
Abstract
Interest in using Light Detection and Ranging (LiDAR) technology in Transportation Engineering has grown over the past decade. The high accuracy of LiDAR datasets and the efficiency by which they can be collected has led many transportation agencies to consider mobile LiDAR as an alternative to conventional tools when surveying roadway infrastructure. Nonetheless, extracting semantic information from LiDAR datasets can be extremely challenging. Although extracting roadway features from LiDAR has been considered in previous research, the extraction of some features has received more attention than others. In fact, for some roadway design elements, attempts to extract those elements from LiDAR have been extremely scarce. To document the research that has been done in this area, this paper conducts a thorough review of existing studies while also highlighting areas where more research is required. Unlike previous research, this paper includes a thorough review of the previous attempts at data extraction from LiDAR while summarizing the detailed steps of the extraction procedure proposed in each study. Moreover, the paper also identifies common tools and techniques used to extract information from LiDAR for transportation applications. The paper also highlights common limitations in existing algorithms that could be improved in future research. This paper represents a valuable resource for researchers and practitioners interested in knowing the current state of research on the applications of LiDAR in the field of Transportation Engineering while also understanding the opportunities and challenges that lie ahead.
Introduction
Light Detection and Ranging (LiDAR) is an optical remote sensing technology that uses near infrared light rays to collect information about the surrounding environment. LiDAR data is collected using a scanning systems that incorporate laser scanners, sensors, Global Navigation Satellite System (GNSS) receivers, and inertial measurement units (IMU). The laser scanners constantly emit beams at surrounding objects and based on the properties of the reflected beams, the the distance to the point off which each beam was reflected is computed. Scanners emit thousands of beams per second, which result in millions of distance measurements to surrounding surfaces (Kemeny and Turner Citation2008). Constantly scanning objects creates a 3D point cloud of the environment surrounding the laser scanner, as illustrated in .
Figure 1. LiDAR point cloud of highway segments.
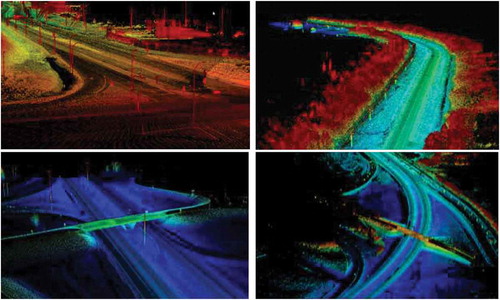
LiDAR data can be collected aerially, using helicopters or drones, or terrestrially. Terrestrial LiDAR data collection can either be static, where scanning equipment is mounted on a tripod, or mobile, where data collection equipment is mounted onto vehicles in motion. The high level of detail attainable through Mobile Laser Scanning (MLS) has made it the more popular form of LiDAR for transportation applications (Williams et al. Citation2013a).
Different laser scanning methods have different advantages and disadvantages. For instance, while a more detailed representation of the roadside features could be acquired using mobile laser scanning (MLS), aerial laser scanning (ALS) has the capability of capturing a wider range of data (i.e. the extents of the spatial area covered in an aerial scan is much wider)(Williams et al. Citation2013a). This wider range, however, comes at the expense of point density. In fact, density is also a function of several other factors including the distance between the scanner and the scanned object (i.e. the range), the angle of incidence, the environment and weather conditions in which data is collected, and the speed of the data collection vehicle (Guan et al. Citation2016;).
Another factor that impacts point cloud density is scanning system capabilities. Scanners vary in their scan rates, range, and the scanning mechanism. For instance, a Velodyne VLP-16 scanner has a scan rate of 300,000 Points per Second and a range of 100 m. The RIEGL VQ 450, in contrast, has a scan rate of 1,100,000 points per second and a range of 800 m. The literature shows that the quality of data obtained from different scanning systems, and the accuracy of measurements made using those systems varies significantly (Guan et al. Citation2016).
One major advantage of MLS over traditional surveying is that those systems are capable of producing a highly accurate model of the road’s environment while traveling at highway speeds. This causes minimal disruption to traffic and significantly reduces data collection time. Moreover, since a 3D point cloud of the entire highway is captured, the same dataset can be used to accurately extract multiple features on a highway. Other advantages of LiDAR that have led many agencies to prefer it over other remote sensing techniques such as photogrammetry include its 360° field of view. This property ensures that all objects surrounding the laser scanner can be scanned regardless of the scanner’s orientation. Hence, a scanner has the ability to create a 360°-point cloud of a highway in a single survey pass, which is not possible using photogrammetric techniques. In addition, LiDAR is also an active sensing technology, which means that, unlike cameras, LiDAR scanning systems do not require external lighting to be able to collect data. Such a property makes it possible to collect LiDAR data at any time of day. Accordingly, LiDAR scans can be conducted at night when there is low traffic on highways. LiDAR scanners are also insensitive to bright light or geometric distortions, which sometimes cause corruption of images.
In 2013, research by the National Highway Cooperate Research Program (NCHRP) highlighted several potential applications for LiDAR in transportation, illustrated in (Olsen et al. Citation2013). The research found that current and emerging applications for MLS in transportation cover a wide range of topics including asset management, autonomous vehicle applications, and safety.
Figure 2. Applications of mobile laser scanning in transportation [Adopted from (Olsen et al. Citation2013)].
![Figure 2. Applications of mobile laser scanning in transportation [Adopted from (Olsen et al. Citation2013)].](/cms/asset/2fc4226a-1b25-44f8-801b-9b1f99817699/tgrs_a_1581475_f0002_oc.jpg)
Although many agencies across North America, have been considering using LiDAR for transportation applications, research in this area has been limited. In fact, based on the results of a review conducted as part of the NCHRP research effort, it was concluded that there was a lack of research on “how” information can be extracted from LiDAR (Olsen et al. Citation2013). The report states that “Generally, most information related to MLS use is from presentations at conferences or short web articles that do not go into detail regarding the work performed.”
In the five years since the NCHRP report, interest in using LiDAR for transportation applications has grown significantly. This is, in part, due to the adoption of LiDAR as a sensing technology onboard many autonomous vehicle systems, including Google’s Waymo and Uber. Despite the growing interest in this area, the extraction of some features has received more attention than others. For instance, attempts to extract roadway design elements from LiDAR have been scarce.
To document the amount of research that has been done in this area and identify areas where more research is required, this paper provides a thorough review of the previous attempts to extract transportation features from LiDAR data. shows a summary of the transportation features that were considered in this study. For each of those features, the paper provides a summary of the extraction procedure proposed in each of the previous studies, the testing that was conducted, and the challenges associated with the extraction processes. Furthermore, the paper also highlights gaps in the literature and areas where more research is required. Although there have been some attempts to review the LiDAR applications in transportation in recent years (Gargoum and El-Basyouny Citation2017; Guan et al. Citation2016; Williams et al. Citation2013b), this paper differs from all previous efforts in that it: (i) summarises the most significant contributions found in this area to date, in both written and tabular format, (ii) provides a thorough discussion of the tools and techniques utilized in previous studies to develop algorithms for transportation feature extraction from LiDAR, (iii) provides a critique of the limitations of previous studies while identifying gaps where future research is needed.
Figure 3. Transportation features extracted from LiDAR in previous work.
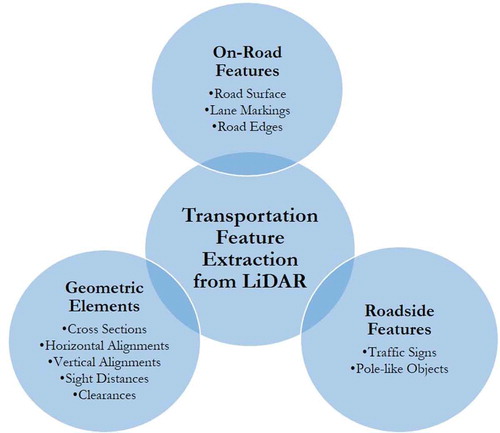
The remainder of this paper is organized as follows: Sections 2, 3, and 4 review previous research where LiDAR data has been used to extract on-road information (Section 2), roadside information (Section 3), and geometric elements of highways (Section 4). Section 5.1 summarizes and discusses the common tools and techniques that were used in the studies reviewed in Sections 2, 3, and 4. Section 5.2 highlights the limitations that exist in the literature and areas where more research is needed to fully utilize LiDAR datasets in transportation.
On-road information
Road surface extraction
When extracting semantic information from LiDAR scans of highways, isolating the road surface from other infrastructure elements is extremely valuable. This is known in the literature as point cloud segmentation. Not only does segmentation create a reference point for extracting other features, but it also reduces the size of the dataset processed for other applications. For instance, when only extracting on-road features, such as lane markings or lane widths, working with the road surface alone instead of the entire dataset significantly reduces processing time.
In research by Lam et al. (Citation2010) an algorithm for extracting road surface information from mobile LiDAR data was proposed. The road was first segmented into planes, and the center of each plane and its heading were then determined using Kalman filtering. After that, mathematical models were fitted to the planes using Random SAmple Consensus (RANSAC). The authors also extracted other roadside elements, such as lamp posts and poles. The developed algorithm was tested on multiple road segments and the results were described by the authors as satisfactory.
In (Wang et al. Citation2012) the road surface extraction procedure first involved defining the road’s profile. Points along the road were then located by conducting a search along the road profile as well as the orthogonal direction. To locate the road’s boundaries (edges), the paper employed hypothesis testing based comparing the local variance in altitude of a particular segment. Objects that were neither road surface points nor boundaries were also filtered out using hypothesis testing, however, in this case, the test was on the mean value of local altitude as opposed to the variance. The proposed algorithm was tested using data collected in China, however, not much discussion of the results was provided.
In recent work, Yadav, Singh, and Lohani (Citation2017) proposed a method that segments LiDAR point clouds into ground and nonground points while also classifying ground points into road surface and non-road surface points. The method was split into three stages, (i) data structuring and ground filtering, (ii) road surface extraction, and (iii) road boundary refinement. In step one, points were first organized into a 2D grid of connected rectangular segments, rough ground classification was then performed to obtain a preliminary set of ground points, and skewness balancing was used to filter out any remaining non-ground points. The road surface extraction proposed in the second step filters out ground points that do not represent the road’s surface. This is achieved through (a) filtering ground points based on intensity and point density, (b) region growing, and (c) road point recovery. The algorithm was tested on three different segments in India with results showing an average completeness of 93.8%, correctness of 98.3%, and quality of 92.3%.
Unlike research on road surface extraction, which is fairly limited (Yadav, Singh, and Lohani Citation2017), a number of studies have attempted the segmentation of LiDAR point clouds into ground and nonground points. These attempts are often part of a greater extraction procedure where the aim is to extract roadside furniture such as poles. As a result, the accuracy of the ground and non-ground segmentation is not assessed.
Zhou et al. (Citation2014) analyzed LiDAR scanlines to identify whether different points along a scanline were ground or nonground points. Similarly, Yadav et al. (Citation2016), structured points into overlapping cylinders. Points that lie at the base of the cylinders were then grouped and extracted as ground points. Those ground points were then further refined using a height roughness-based approach.
Voxel-based approaches for ground and nonground segmentation are also common in the literature (Lehtomäki et al. Citation2016; Wu et al. Citation2013; Cabo et al. Citation2014). Yu et al. (Citation2015), used a voxel-based growing method whereby the point cloud was first segmented into different blocks of a 2D XY grid. Upward growing of voxels was then performed connecting each voxel to neighbors that lie above. Depending on the elevation of each voxel compared to a ground elevation threshold, points in a particular voxel cell are classified as ground or nonground. It is worth noting that studies where ground extraction was attempted as part of pole extraction are reviewed in Section 3.2.
Lane marking and road edge extraction
Unlike road surface extraction, extracting lane markings, curbs and road edges from LiDAR has received more attention in previous research. A summary of those studies is found in . One reason the extraction of such features has been popular among researchers is their importance to vehicle guidance applications developed for Autonomous Vehicles.
Table 1. A summary of previous studies that attempted the extraction of road surface, lane marking, and road edges from LiDAR.
The curb extraction procedure proposed by Zhou and Deng (Citation2014) was threefold. The first step involved identifying points of sudden change in height. The maximum height difference in the vicinity of the sudden change in height was then computed and the points were arranged into a sequence to obtain the approximate curbstone location. The final step involved filling the gaps between adjacent and collinear segments along the curbstone (parallel to the roads axis). The authors tested their algorithm on points obtained in Aerial Laser Scanning (ALS), GPS surveys, and Mobile Laser Scanning (MLS). Completeness varied between 53% and 92% for ALS and 54% to 83% for MLS. Low completeness was attributed to occlusion of the curbstones.
Zhang (Citation2010) developed a procedure for road edges as well as road surface. The process was designed to work in realtime (i.e. during the data collection stage) and involved using elevation-based filters and pattern recognition techniques to identify points representing the road segment. Although not much information is provided about the testing environment, the paper concluded that the algorithm was successful in detecting most road points, road-curb points, and road-edge points correctly. The authors reported a false positive rate of 0.83% and a false negative rate.
Serna and Marcotegui (Citation2013) attempted curb extraction by mapping point clouds into range images. Ground and nonground segmentation were then performed using the λ-flat zones algorithm. Finally, height and elongation criteria were used to select curb candidates and the Bézier curves were used to reconnect close curbs. The proposed method was tested using datasets collected in France and the Netherlands with results showing completeness rates ranging from 54% to 65% and correctness ranging from 91% to 95%. In another algorithm by McElhinney et al. (Citation2010), road edges were extracted in two stages. The first stage involved extracting the cross sections of the data, which were then fitted to 2D cubic splines. The splines were analyzed based on intensity, pulse width, slope, and proximity to the vehicle to identify road edges. The algorithm was tested on two urban road segments; however, the paper does not include discussion of the results.
Zhang et al. (Citation2018) attempted curb detection using LiDAR for autonomous vehicle systems. The proposed process first uses a plane-based method to distinguish off-road and on-road regions. Data were further segmented using a sliding beam method and the spatial properties of curbs are used for their detection. The algorithm was tested on data collected by an autonomous vehicle with the authors reporting an average precision and recall rate of 84.89% and 82.87%, respectively.
Jaakkola et al. (Citation2008) employed image processing tools in their attempt to extract pavement markings and curbstones. The proposed method involved applying multiple heuristic thresholds to a TIN surface generated from the LiDAR point cloud and using morphological operations on elevation and intensity images of the data. The proposed method was used to extract different types of road markings including pedestrian crossings and the detection rate reported in the study was in the region of 80%. Kumar et al. (Citation2013) also attempted the extraction of road edges through rasterizing the point clouds and employing Gradient Vector Flow (GVF) and Balloon Parametric Active Contour models. Two-dimensional rasters were first generated based on elevation, reflectance, and pulse width. Hierarchical thresholding (limits noise) and canny edge detection (determines boundaries) were then used to identify the edge boundaries of the raster data. The authors tested their proposed method on three 50 m road sections. The extraction procedure was accurate on all but two short subsegments of the 50 m road sections. Failure to detect road edges on those subsections was due to low point density near the edges.
In other work, Kumar et al. (Citation2014) adopted a similar method used for edge detection to extract lane markings. The authors conducted range dependent thresholding of intensity values within the point cloud and used binary morphological operations to clean up the extracted lane marking information. The method was tested on around 150 m of data collected on seven different road sections. Eighty-six percent of the markings were accurately detected and 13 false positives were detected.
Guan et al. (Citation2014), also adopted range dependent thresholding and image morphology to extract lane markings. Blocks of data perpendicular to the road’s trajectory were first extracted from the point clouds. Road edge identification was then achieved by analyzing changes in elevation across each block. LiDAR points in between the road edges, representing road surface, were then to generate intensity rasters. Finally, a multi-threshold segmentation filter was applied on the generated rasters to extract lane marking information, which was then morphologically treated. The algorithm was tested on a total length 168 m collected on two different road segments with the authors reporting completeness and correctness rates of 96% and 83%, respectively.
The first step of the lane detection process proposed by Thuy and León (Citation2010) involved using the probability density function (pdf) of the intensity readings stored for all data points to identify the peak intensity. The motivation here was that the peak intensity would correspond to the intensity of the pavement surface since most points typically fall on the road. To enhance the contrast between the road surface points and lane markings, a dynamic threshold was calculated based on the peak intensity reading and the standard deviation. The threshold was used to filter out point on the road surface and the mean value of remaining observations was recalculated and used as the threshold for image binarization to detect lane markings. A Canny filter was later applied to the binary image to improve the sharpness of the extracted lane markings.
Yan et al. (Citation2016) adopted a slightly different approach for lane marking extraction. To enhance search efficiency the authors adopted a scan-line based approach whereby points were first sequentially ordered based on timestamp and scanner angle. The height difference between the trajectory data and the road surface was then used to define seed points. Moving least squares was then used to fit a line between all seed points, and points that fell within a certain threshold of the line were then retained as potential road points. An intensity filter was then applied to classify points into asphalt points or road marking. Testing was conducted on three segments 70 to 100 m in length and the average completeness and correctness rates of 96% and 93%, respectively, were reported.
Roadside information
Traffic signs
Extraction of traffic sign inventory from LiDAR has been attempted in many studies, a sample of which is presented in . It is worth noting here that traffic sign extraction studies can be classified into two categories. One category deals with real-time extractions (i.e. as the data was collected) the other category of studies deals with sign extractions after the data is collected. Vu et al. (Citation2013) was one of the studies that attempted real-time sign extraction and classification. Planes of data were first filtered by intensity, retaining high-intensity planes that were spaced more than 1 m apart. Principle Component Analysis (PCA) was then used to filter out outlying planes that did not align. The proposed method was tested on a controlled test track. (Zhou and Deng Citation2014) a raster-based realtime sign extraction method where LiDAR point clouds were first converted into images. The detection rates reported in the study ranged from 84% to 96%.
Table 2. A summary of previous studies that attempted the extraction of traffic sign information from LiDAR.
Chen et al. (Citation2009) proposed a sign extraction method that involved filtering LiDAR data based on several thresholds after data collection was complete. The thresholds included distance from the scanner, scanner angle interval, and intensity. Once filtering was complete the data were clustered, and geometric filtering was applied to the different clusters. Even though the proposed method was tested on a 600 m in Chicago segment, the paper contains no information about the percentage of signs accurately extracted.
Weng et al. (Citation2016) adopted a similar method to that of Chen et al. (Citation2009) by filtering and clustering the point clouds to detect traffic signs. The filters were based on intensity, the number of points within a cluster (hit count), and cluster dimensions (elevation and height). After extracting traffic signs, the study attempted shape-based classification of traffic signs using convex hull, Minimum Enclosing Rectangle, and Minimum Enclosing Circle. The accuracy of the detection and classification methods is not discussed in depth; however, the authors do acknowledge the detection of some false positives.
Ai and Tsai (Citation2014a) filtered their data based on intensity and hit count while also introducing elevation and offset values specified in the Manual for Uniform Traffic Control Devices (MUTCD) as additional filters. Unlike other studies, in this paper threshold values were selected in this study were optimized by applying a sensitivity sweeping procedure whereby the threshold that minimized false-negatives and false-positives was selected. The algorithm was tested on urban and rural road segments. On the rural segment, a 94% detection rate was achieved with six false positives. In contrast, on the urban segment, a 91.4% detection rate was achieved with seven false positives. Poor retro-reflectivity, insufficient height, and object occlusion were all factors that the paper cites are potential causes of false negatives.
Landa and Prochazka (Citation2014) was another paper that employed intensity, hit count, and dimension filters to extract signs from LiDAR data. One difference was that this study employed a Euclidean distance filter for preliminary clustering. A detection rate of 93% was reported in this study. In addition to intensity filters, Wu et al. (Citation2015) introduced Principle Component Analysis (PCA) to filter traffic sign panels based on orientation. The study also attempted measuring sign panel area by projecting the 3D points of each traffic sign onto a 2D.
Soilán et al. (Citation2016) started their detection process by omitting points that fell at a distance more than 20 m away from the laser scanner. The also omitted ground points from the dataset to minimize the chances of detecting false positive. The paper introduced a Gaussian mixture model-based intensity filter, which represented an improvement on the heuristic thresholds adopted in previous work. The filtered data were then clustered using a density-based clustering algorithm and PCA was used to filter clusters based on sign panel properties. The method was tested on an urban and a rural road segment with the authors reporting detection rates of 86.1% on the urban road and 92.8% on the rural road. Planar metallic surfaces and pedestrians dressed in reflective clothing were seen as factors that impacted detection rates, particularly on the urban roads. Riveiro et al. (Citation2016) extended Soilán et al. (Citation2016) work for sign detection by image-based sign classification of signs. The methodology was tested in three different countries with detection rates ranging between 80% and 90%.
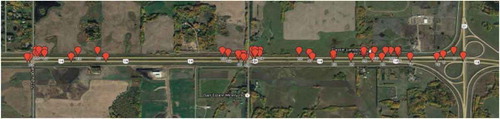
The procedure proposed by Gargoum et al. (Citation2017) also involved filtering the point cloud based on intensity information. The filtered point cloud was clustered using a density-based clustering algorithm (DBSCAN) and geometric filtering was employed to remove clusters that had dimensions that met thresholds defined in the local traffic sign design guides. The final step of the procedure involved defining a buffer zone that was set to remove clusters that did not lie within reasonable limits of the road’s edges or those that fell on the road’s surface. The proposed method was tested on three different Highway segments in Alberta, Canada, with detection rates ranging from 93% to 100%. The detected sign clusters were also mapped on the test highways ().
Figure 4. Mapped sign clusters extracted from a LiDAR scan of one of the test highways in Gargoum et al. (Citation2017).
Guan et al. (Citation2018) assumed prior knowledge of road width and sign-pole height when detecting traffic signs using LiDAR data. After voxelizing the point cloud, the geometric properties of neighboring voxel were analyzed to decide whether the voxels were a sign candidate. Further filtering based on intensity, size, and position of voxel clusters were applied and a Euclidean distance clustering algorithm was used to remove noise. The authors report a detection rate of 86.8%.
Ai and Tsai (Citation2016) extended work in all studies that dealt with the detection of traffic signs using LiDAR by introducing a LiDAR-based approach to assess sign reflectivity conditions. Signs were first extracted and segmented based on color from video log images. After that, intensity information in the LiDAR points was coded into image pixels of the signs. The following stage involved normalizing intensity values to omit the impacts of confounding factors including incidence angle and range. Linking intensity values to the retro-reflectivity standards was achieved through experimental lab tests. Testing revealed that the results obtained using the proposed method were consistent with handheld retroreflectometer.
Other roadside objects
Fixed roadside objects have significant impacts on the severity of runoff the road crashes, thus, effective management of such objects is essential for the safe operation of highways. In fact, ensuring that the roadside area is forgiving to errand vehicles, giving them the highest chances of recovery, is one of the core elements of a safe system approach. Proper management of roadside objects includes maintaining up to date inventory of those objects including their locations, conditions, and proximity to the road. The next few paragraphs and provide an extensive summary of the previous studies that have attempted extracting such information from mobile LiDAR.
Table 3. A summary of previous studies that attempted the extraction of other roadside objects from LiDAR.
In the algorithm proposed by Zheng, Wang, and Xu (Citation2017) the first step in the extraction process involved removing ground points. This was achieved by employing a piecewise elevation histogram segmentation. Euclidian distance clustering was used to filter out candidate pole clusters and a graph-cut-based segmentation method was then introduced to further filter the clustered information. Besides clustering and segmentation, the paper also worked on extracting pole shape and the point’s intensity information were to formulate an energy function used in the pole extraction. The final step involved introducing a Gaussian-mixture-model-based method to distinguish poles from other non-ground objects. The method was tested on several datasets with authors reporting detection rates of up to 90%.
Teo and Chiu (Citation2015) proposed a coarse-to-fine approach for the extraction of pole-like objects from LiDAR. The extraction framework involved (i) data processing, where data trajectories were reorganized into different road elements and building facades are filtered out of the point cloud, and (ii) coarse-to-fine segmentation whereby pole-like objects were detected at an aggregate voxel scale before detecting them at the point scale. Testing revealed that the method was effective in detecting pole-like objects at a rate of 90%. The authors attributed false negatives to object occlusion, and false positives to complex environment.
Lehtomäki et al. (Citation2010) analyzed LiDAR scanlines to detect and extract poles. The authors utilized the fact that pole-like objects usually exist in LiDAR data as sweeps (i.e. group of curved points). When a pole exists these sweeps typically exist in each scanline since the scanner is typically unable to scan the nonvisible side of the pole. The proposed algorithm by analyzing point arrangement in each scanline to locate those sweeps. In cases were sweeps did exist at the same location but in different layers, they were clustered and then merged using principal component analysis (PCA). The next step involved applying a set geometric filters based on the typical dimensions of a pole to remover towers of sweeps that did not represent poles. When tested, the algorithm produced a completeness rate of 77.7% and a correctness rate of 81.0%. False negatives were attributed to object occlusions and low point density.
In Pu et al. (Citation2011), the extraction method involved classifying the LiDAR dataset into ground surface, on-ground objects, and off-ground objects. On-ground objects were further classified into sub-groups including signs, trees, and poles. To remove the ground surface, the authors adopted a surface growing method proposed by Vosselman et al. (Citation2004). Detecting poles were then achieved by analyzing the vertical principal axis of the third quartile of the height of nonground objects. This approach helped filter out vegetative nonground objects such as bushes and trees since such objects would have non-pole-like characteristics in their 1st and 4th quartiles. The detection rate achieved using the proposed method was 87% overall; however, lower detection rates were reported for signs (61%) and trees (64%).
El-Halawany and Lichti (Citation2011) take a slightly different approach by first segmenting the data in two-dimensions using a density-based clustering algorithm (DBSCAN) to identify locations where there is a high concentration of points in a region with a diameter similar to that of a pole. To extract points representing poles in the detected regions, the authors use a vertical region growing technique. Once that was achieved, the distance between centroids of the pole candidates was measured and in cases where the objects were close to one another, these objects were merged to represent the same pole-like object. Geometric filtering was then applied using variables such as height range, surface normal direction, and the largest normalized eigenvalue to classify pole-like objects. Testing the algorithm on three different urban segments revealed an average detection rate of 86% and an accuracy was 97%.
The algorithm proposed by Yan et al. (Citation2016) to extract pole-like objects involved ground filtering, unsupervised clustering, classification, and data cleaning. Ground filtering was first achieved by analyzing the elevation histogram of the data and assuming normality for the elevations of ground point. The paper then used DBSCAN to cluster the height-normalized non-ground points and identify candidates for pole-like objects. Further classification of the pole-like object candidates was achieved based on a set of geometric filters and decision rules. To omit noise often present near the foot of pole-like objects, the authors applied a least square circle fitting algorithm to the lower portion of the pole. Testing revealed that the algorithm was successful in accurately detecting poles at a 91% detection rate.
In Cabo et al. (Citation2014) data was first voxelized and each horizontal layer of the voxel grid was subject to segmentation of connected elements, filtering based on maximum area criteria, and filtering based on an isolation criteria. Both the maximum area and the isolation criteria were set based on the assumptions that poles have a relatively small cross-sectional area and are often isolated. Since the layer-based assessment outputs pole candidates in each horizontal layer, the final step in the extraction algorithm involved connecting all voxel elements that share a face, edge or vertex among all elevation layers. Testing on four different segments revealed a completeness rate of 92.3% and a correctness of 83.8%.
In another attempt to extract pole-like information from LiDAR datasets Lehtomäki et al. (Citation2016) also proposed a voxel-based approach where non-ground points were first filtered out of the point cloud. Object segmentation of nonground objects was then achieved using connected component labeling. To classify the extracted nonground objects, the authors used feature descriptors including local descriptor histograms, spin images, and general shape and point distribution attributes to train the classification model. Testing revealed that the detection rates ranged between 66.7% and 94.3% depending on the object extracted, which included trees, lamp posts, and traffic signs.
(Gargoum, Koch, and El-Basyouny Citation2018) also adopted a voxel-based approach when attempting the extraction of poles on rural highway segments with significant variations in vertical alignments. In this paper, the authors started by tiling the point cloud data into manageable data tiles. After that voxel-based segmentation of nonground points in the point cloud was performed and followed by density-based clustering, connected components labeling, and geometric filtering of pole-like objects based on a set of decision rules. The algorithm was tested on a 4 km rural segment in Alberta, Canada where it achieved detection rates of up to 78.6%.
Geometric data extraction and assessments
Unlike roadside objects and lane markings, LiDAR-based assessment of road geometric elements has received less attention from researchers. This section reviews the work that has been done in this area with a focus on slopes, horizontal and vertical alignments, sight distances, and clearances.
Road cross section information
Geometric design guides are full of standards governing the design of cross-sectional elements. Efficiently designed cross sections ensure speedy water drainage off roads to minimize the risks of hazards such as hydroplaning. On horizontal curves, a superelevated or tilted cross section helps counteract centrifugal forces acting on a vehicle negotiating the curve. In most design guides, side slopes are also important elements of the road’s geometry that govern the design of the roadside area. Unfortunately, the microscopic nature of elements such as cross-sectional slopes means that collecting such information using conventional tools is extremely challenging, nonetheless, not many studies have attempted extracting such features from LiDAR.
In one of a few studies in this area, Tsai et al. (Citation2013) proposed a cross slope extraction from LiDAR, that first involved adjusting the orientation of the laser scanner such that cross section information could be extracted along a specific region of interest (ROI) perpendicular to the road. The extents of the ROI were defined based on a user specified depth and the road’s lane markings. After extracting the points that lie within the ROI, the points were used to estimate road cross slopes using linear regression. The algorithm was tested in a controlled environment and cross-slope information obtained using the proposed method was within 0.28% of the digital level readings.
Holgado‐Barco et al. (Citation2017) proposed a semi-automated algorithm for extraction of slope information from LiDAR data. The first step of the extraction process involved segmenting the ground surface using an adaptive height threshold. An intensity-based filtering was then employed to obtain lane marking information, which was used to define the ends of the roads cross section for each lane. Cross slopes in each lane were estimated by finding the ratio of the lane widths (delta x) and the difference in elevation at either end of the lane (i.e. at each lane marking) (delta y). The method was tested on two different highway segments and only minor variations in slope estimates were observed between measurements taken at different locations along the same segments.
Although not with the intention of extracting road slope information, Lato et al. (Citation2009) used mobile LiDAR to assess cut-slopes along transportation corridors. The authors concluded that multiple scans using a mobile LiDAR were useful in the detection of small rock block release (sub 15 cm).
Shams et al. (Citation2018) attempted cross slope extraction using LiDAR by first defining the endpoints of the analyzed using survey nails in the field, a reference line was drawn between the two points and a 4-in. buffer of points that fall within the test region was clipped using ArcGIS. Mesh grid surfaces were fitted to points within each buffer and lane marking locations were defined based on the intensity of points. The cross-slopes were then calculated by evaluating the ratio of the rise and run between the lane lines. Although the method did involve a manual component the authors report a difference between ground control adjusted and unadjusted LiDAR-derived cross-slopes, and field surveying measurements of less than 0.19%.
Gargoum, El-Basyouny et al. (Citation2018) proposed a fully automated method to assess both cross slopes and side slopes on LiDAR segments. The algorithm involved estimating vectors that intersect the road’s axis, whereby points within proximity to the vectors are retained and extracted. Points of change in slope along the extracted cross section were then identified using Multivariate Adaptive Regression Splines and linear regression was used to estimate the slopes. The algorithm was tested on two highway segments in Alberta where the authors extracted multiple cross sections and compared estimates to information obtained in GPS surveys. The authors found that differences in cross slope measurements ranged from 0.08% to 0.22%.
Alignment information
The design of vertical and horizontal alignments on roadways is also governed by multiple standards in highway design guides. This includes the standards for the length of vertical crest and sag curves, vertical grades, the radii of horizontal curves, superelevations. and spiral transitions. Obtaining such information about design elements requires long site visits and road closure, which is disruptive to traffic, time-consuming, labor intensive, and financially demanding. The next few paragraphs review the research that has been done to extract such information from LiDAR. In addition, , provides a summary of previous work in this area.
Vertical alignments
(Souleyrette et al. Citation2003) was one of the early studies that explored vertical alignment extraction from LiDAR. The method first involved locating the road’s centerline; this was achieved by manually tracing road edges in ArcGIS and estimating the line central to those edges. Multiple linear regression along the centreline was then used to estimate grade and cross slope information. The independent variables in the regression model (lateral distance of a point in the point cloud from the centerline) and (longitudinal distance along the segment from its origin) were used as estimates of the road’s cross slope and the grade, respectively. Testing revealed that the estimated grade and slope attributes both deviated significantly from field measurements. Zhang and Frey (Citation2006), adopted a similar method to (Souleyrette et al. Citation2003), with slight improvements to the way road edges and centreline were estimated which resulted in the level of accuracy in grade estimates to reach 5%.
In more recent work, Wu et al. (Citation2012) used point cloud data to model road surface elevation. Data were first projected onto vertical planes defined by the trajectory of the data collection vehicle. The Douglas-Peucker algorithm was then used to segment points along the road's profile. The level of accuracy achievable using the proposed method was not discussed in the paper.
In a recent paper, Higuera de Frutos and Castro (Citation2017) proposed a method for the reconstruction of road vertical profiles using GNSS data collected along a road’s centreline. The aim of the study was to automatically acquire information about different elements of a road’s vertical profile including grades and parabolic curve details using the points collected along its centreline. The first step of the procedure involved classification of points along the profile into grade points, parabolic curve points or border points and clustering points based on their type. Analytic expressions were then estimated for the set of points between borders before calculating integrals of the expressions to obtain the analytical expressions of the elements of the longitudinal profile. Testing was conducted on rural highways in Spain with the authors reporting a mean error of less than 8 cm when estimating the geometric elements of a road’s vertical profile. Although not an automated procedure, Di Mascio et al. (Citation2012) and Baass and Vouland (Citation2005) also used GNSS data to extract vertical profile information on roads. It is worth noting that, although GNSS data is not necessarily collected in LiDAR scans, such information is acquired by all MLS systems. Therefore, procedures proposed here do apply to datasets collected using LiDAR scanning systems.
Horizontal alignments
Previous research on the extraction of horizontal curve attributes has been directed in three different directions. The extraction using Graphical Information Systems (GIS) (Findley et al. Citation2012; Rasdorf et al. Citation2011), GPS data (Imran, Hassan, and Patterson Citation2006; Ai and Tsai Citation2014b), and photogrammetric techniques (Tsai et al. Citation2010). Despite the high accuracy of LiDAR datasets, attempts to use them in the extraction of horizontal curve attributes have been limited.
In Holgado‐Barco et al. (Citation2015) a semi-automatic method for curve extraction was proposed. The method involved segmenting, parametrizing, and filtering the point cloud. In the segmentation stage, points tracing the road’s trajectory (lane markings) were filtered out. These points were then classified into curved and straight segments based on changes in azimuth and curvature between consecutive vectors. Data were classified into (i) straight segments (zero curvature), (ii) circular arcs (constant curvature), and (iii) clothoids (variation in curvature). After detecting the curves, radii and the transition lengths were estimated. The algorithm was tested on simulated data and data collected on a Spanish highway and the results were compared to information estimated by a topographer. Errors in length of up to 3.8 m (2.0%) for circular arcs and 5.6 m (0.4%) for circular radius were reported. When testing on the simulated segment the errors were 0.3 m (0.1%) and 0.9 m (1.1%) for arc radius and length, respectively.
(Gargoum, El-Basyouny, and Sabbagh (Citation2018b)) proposed a method to detect and extract attributes of horizontal curves from LiDAR. The method involved analyzing changes in the azimuth along the road’s trajectory to identify a preliminary estimate of the endpoints of curves. Linear regression analysis of the trajectory points was then used to identify the point of intersection and deflection angle of the curve. The actual point of tangency (PT) and point of curvature (PC) were then identified by minimizing the spacing between regression lines and the trajectory points on the road. Furthermore, the Radius of the curve was estimated by intersecting lines from PC and PT to the center of the curve. The authors also estimated the length of curve’s arch and chord. The proposed method was tested on multiple LiDAR segments with results showing that the attributes of the curves were estimated with an average percent difference of less than 3%.
Sight distance assessment
Another geometric design element that is critical to the safe operation of highways is Sight Distance. Sight Distance is the distance required by a driver to complete a certain maneuver, which could range from coming to a complete stop in case of an emergency to the safely passing a leading vehicle on a highway. Quantifying the sight distance available to a driver along a highway corridor is a tedious process that often requires long sight visits or two-dimensional graphic assessments. In recent years, researchers have realized the value of using LiDAR datasets to conduct three-dimensional assessments of available sight distance on highways; the most recent studies in this area are summarized in .
Table 4. A summary of previous studies that attempted the extraction of road alignment information from LiDAR.
Table 5. A summary of previous studies that attempted assessing sight distances using LiDAR.
In one of the earliest studies in this area, Khattak and Shamayleh (Citation2005) explored the feasibility of assessing stopping and passing sight distance along a highway scanned using ALS. The data were first used to create a Triangulated Irregular Network (TIN) surface of the highway in ArcGIS. The surface was then visually inspected to identify locations with potential limitations in sight distance. To verify the existence of limitations at the suspect locations, the authors assessed visibility using the Line of Sight tool in ArcGIS. Ten locations were found to be prone to limitations in sight distance; a result that was verified using field data.
Castro et al. (Citation2011) adopted a different approach in their assessment, with the aims of automating as much of the assessment process as possible. The point cloud was first used to generate a Digital Terrain Model (DTM) and viewsheds for observers were created. Visible portions of the viewsheds were converted into polygons and intersections between the polygons and vehicle trajectory data were identified. The available sight distance was then quantified by finding the distance between the observer and the nearest intersection point between the visibility polygon and the trajectory. To verify the accuracy of the results, the authors compared the sight distance information obtained using the proposed method to information obtained from design software Trivium. The results showed that there were no statistically significant differences in the estimates.
Castro et al. (Citation2013) attempted increasing the level of automation in the assessment. The point cloud was first used to generate a DTM. Points representing observers and targets collected in a GPS survey were then overlaid onto the DTM and ArcGIS tools were used to identify obstructions along the lines of sight connecting observers and targets. The available sight distance at each observer location was computed by measuring the distance between the observer and the last visible target. To assess the accuracy of the results, the authors compared their findings to the results obtained in their previous paper (Castro et al. Citation2011). The comparison showed that there were no statistically significant differences between the results obtained in the two studies.
In another paper, Castro et al. (Citation2016b) analyzed the difference between using DTM (bare ground) and Digital Surface Model (DSM) when assessing sight distances on LiDAR highways. The paper also compared the use of ALS and MLS. Statistical significance testing revealed that the type of surface model used did impact the sight distance estimates obtained. It was found that DTMs overestimated the sight distance available along a highway and that DSM was more likely to detect obstructions. The study also showed that using MLS data resulted in more accurate estimates of the available sight distance due to the higher point density.
Jung et al. (Citation2018) also developed an algorithm for the assessment of ISD using LiDAR. In this paper, ground points were first segmented by analyzing an elevation-based histogram of the point cloud. The point cloud was organized into a 2D grid, and line of sight assessment was conducted along a driver’s sight line until a cell containing an obstruction was identified. Obstructed cells were then used to create a viewshed map of nonvisible regions. The viewsheds were imported into GIS software to analyze visibility. The algorithm was tested at an intersection in Oregon, US, and, according to the authors, was able to capture significantly more detail on visibility constraints.
Gargoum, El-Basyouny, and Sabbagh (Citation2018a) proposed a method to assess stopping and passing sight distance on LiDAR highways. The method involved using the LiDAR data in the creation of a DSM (raster surface). After that, points representing observers and targets were filtered out of the LiDAR dataset while adjusting elevations to values defined in design guides. As in the procedure by Castro et al. (Citation2013), the next step involved assessing the visibility from each observer to multiple targets until an obstruction is detected. The available sight distance (ASD) is then recorded as the distance from the observer to the last visible target. After computing the available stopping and passing sight distance the authors then compare the ASD to the design standards. The algorithm was tested on 50 km of highway in Alberta, Canada.
Unlike sight distance along highways, assessing available sight distance at intersections using LiDAR technology has received less attention by researchers. In one of the very few studies in this area, Tsai, Yang, and Wu (Citation2011) proposed a manual method for detecting obstructions at intersections. GPS points representing the road’s centreline were first offset to trace the centerlines of the travel lanes at either approach of the intersection. After that, the dimensions of the sight triangle, which must be kept clear of any obstructions, were estimated based on the speed limit on the major and minor approaches and the type of control at the intersection. The point cloud data was then used to generate a DSM and a plane of sight analysis of the area enclosed by the sight triangle was then conducted using LiDAR software Quick Terrain modeler. The method was tested by comparing the results to ground truth data collected in a conventional survey. The results revealed that the LiDAR-based assessment, which was able to identify 92% of the obstructions, was more effective than the on-site assessment where only 64% of obstructions were detected.
Vertical & lateral clearance
Another application for LiDAR in transportation is in the assessment of clearances, particularly vertical clearance, recent studies in this area are summarized in . Clearance data is typically collected in routine bridge inspections; similarly, clearance information is also important for agencies responsible for issuing over height permits for oversized vehicles. Although the use of manual tools such as theodolites and total stations for clearance assessment is still common among transportation agencies, other digitized tools have recently been adopted. For instance, many agencies use digital measuring rods in clearance assessments (Alberta Transportation Citation2014). The use of photolog data in clearance assessments has also been explored in previous work (Lauzon Citation2000).
Table 6. A summary of previous studies that attempted clearance assessment using LiDAR.
Liu, Chen, and Hasuer (Citation2012) proposed a method to assess bridge clearance using static terrestrial LiDAR scans. The proposed algorithm involved automatically matching points on the bridge’s deck points with points on ground surface that fall within a certain margin of the vertical plane perpendicular to the ground. The matching search is conducted for all points on the bridge deck.
Puente et al. (Citation2016) proposed a semi-automated technique for the assessment of clearances in tunnels. The method first involves extracting cross sections at regular intervals in the tunnel. After that, lane markings are detected to identify the edges of the tunnel’s travel lanes. To measure clearance, convex hull is used to define a semicircle representing the tunnel’s cross section by connecting points on the road’s edges to points in the roof of the tunnel. The algorithms were tested at several cross sections in the tunnel and the results showed that error between clearance estimated using the proposed method and that collected in field measurements did not exceed 1% for most cross sections.
(Gargoum, Karsten, et al. Citation2018) proposed a method for the automated detection and clearance assessment of overhead objects using mobile LiDAR. The assessment pipeline involved mapping out the roads trajectory and filtering out the nonground points of the highway. A nearest neighbor search was then used to locate overhead objects. Overhead objects were then grouped using a density-based clustering algorithm and the objects were classified into bridges and non-bridges using a statistical kurtosis assessment. The minimum clearance at each object was also estimated. The algorithm was tested on three different highways including a 242 km highway corridor. The algorithm was also employed to conduct network level assessment of clearances on multiple highway corridors in an extension of the research (Gargoum, Karsten, and El-Basyouny Citation2018).
Discussion and future research
Common tools and techniques
As evident from the review, a variety of different tools and techniques have been used in previous research attempting to extract road features from LiDAR. The data processing tools and platforms range from programming languages such as MATLAB, C++, and Python to general purpose commercial software such as ArcGIS. LiDAR market software such as Trimble3D and Quick Terrain have also been used in previous work (Lato et al. Citation2009; Ai and Tsai Citation2014a). Although full automation often requires coding the entirety of the extraction procedure in a specific programing language, some general-purpose software do support specific programming languages, hence, it is sometimes possible to run tools in such software using specific syntax. For instance, Python can be used to run some tools in ArcGIS (ESRI Citation2017). It is worth noting here that general-purpose software such as ArcGIS’s ArcScene and QuickTerrain (QT) Reader are all useful for visualizing LiDAR point clouds (Varela-González et al. Citation2013).
In terms of the actual workflow of the procedure, the initial stages of the extraction often involve preprocessing and cleaning the data. This is followed by organizing the point cloud (voxelization), segmentation, and extracting reference or seed points. Although these steps are not always necessary, they often help speed up the extraction process. Once these steps are completed, the remainder of the extraction procedure relies heavily on the nature of the features that are to be extracted and the level of complexity associated with the extraction. Common techniques used to process point cloud data lie in multiple areas including, but not limited to, supervised and unsupervised machine learning, classical and Bayesian statistics, planimetry and vector analysis, image analysis, and pattern recognition. , provides a summary of the different techniques that have been commonly used as part of extraction pipelines proposed in previous research to process LiDAR datasets for transportation applications; the table also includes information on the use of each technique. The most appropriate technique must be chosen based on the intended function and the problem at hand.
Table 7. Common techniques used in previous research to process LiDAR point clouds for transportation applications.
Limitations and future research
This review shows that there seems to be some understanding of the potential value of LiDAR in transportation. With that being said, the review also highlights that the majority of existing research has focused on the utilizing LiDAR datasets in inventorying and mapping on-road and roadside features, without much attention to the role of LiDAR in improving the efficiency of extracting and assessing geometric design elements of roads. One reason features such as traffic signs, lane markings, and road edges have attracted more attention than others is because mapping such features is important for autonomous vehicle applications. Moreover, a significant portion of research in this area has been conducted by experts in the fields of computer science, robotics, and geomatics who are not particularly concerned with design elements of transportation infrastructure.
The paper highlights a lack of studies exploring the extraction of multiple geometric design elements form LiDAR including cross-sections and their attributes, horizontal and vertical alignment and their attributes, and clearance information. The value of automatically extracting such information from LiDAR datasets extends beyond helping enhance the efficiency of inventorying such information, to potential improvements in roadway design and safety. In fact (Jalayer et al. Citation2015) concluded that, if properly utilized and efficiently processed, mobile LiDAR datasets represent a valuable tool when collecting roadside data for the purpose of safety analysis.
Even the limited research that exists on the extraction of geometric feature suffers from common limitations. For instance, in case of cross sections extraction from LiDAR one limitation of previous studies in this area lies in the reliance on lane marking information to define the edges of cross sections to identify slope endpoints. The main issue with this is that lane markings might not exist or might have degraded on some rural highways, which makes the algorithms limited to highways where lane markings are sharply defined. Previous cross-section extraction studies have also been limited their attempts to extract side slopes, despite how important such information is to roadside safety. This is, in part, due to the challenges associated with filtering side slopes (bare earth) from points representing roadside vegetation.
In the case of clearance assessment studies, most studies that exist in the literature are limited to vertical clearance assessments without attempts to assess lateral clearances. In fact, even vertical clearance assessment attempts that do exist are limited assessing clearance at bridges, despite the ability of LiDAR scans to capture different overhead objects including power lines and overhead signs.
Even in areas where a significant number of studies exist such as sight distance assessments, those studies suffer from several limitations. For instance, most previous sight distance assessments do not account for the existence of overhanging objects. This results in biased estimates when creating the DSM of the highway, which, in turn, bias the assessment results (Castro et al. Citation2016a). Another common issue with sight distance assessment in previous studies is that almost all those studies used aerial LiDAR when developing their assessment methods (Castro et al. Citation2013; Khattak and Shamayleh Citation2005). Although useful for urban planning applications, the top-down nature of aerial LiDAR scans and the low point density of those scans compared to mobile datasets means that not all obstructions are accurately represented in the point cloud. This could also impact the accuracy of the sight distance assessment. It is also worth noting that in previous studies, testing was mostly conducted on a single segment, which raises some concerns about the repeatability of the extraction procedures. Inadequate testing is also a common issue in previous studies where algorithms were proposed to extract lane marking information from LiDAR. In most of that work, testing was conducted on straight short segments, raising doubts about the efficiency and the accuracy of the proposed methods if they were to be used on longer segments where variations in the road’s alignment exist.
Similar to sight distances and lane markings, although sign extraction from LiDAR has received a significant amount of attention from researchers in recent years, there remains room for improvement in this area. It was found in the review that there are not many studies that attempted shape-based classification of traffic signs using LiDAR point clouds. More research on the possibility of linking intensity information in point clouds to retroreflectivity readings used to assess the conditions of traffic signs has also been extremely sparse. All these limitations and others must be addressed in future research to ensure that transportation agencies fully utilize their LiDAR datasets. This is particularly important when considering the size of investment required for the adoption of mobile LiDAR datasets.
Another area where more research is required is comparing the performance of the different algorithms proposed in existing research. Unfortunately, various studies test their algorithms using point cloud data from different sources. Hence, comparison of the varying algorithms based on the detection results would not be appropriate, since the difference in accuracy could be a result of using a more accurate scan as opposed to a better algorithm. Such a comparison can only be achieved if each of the algorithms are tested on the same dataset. Similarly, assessing the performance of algorithms on LiDAR datasets from diverse sources and at varying levels of point density is also something that must be explored in future research.
In conclusions, this paper shows that, despite the growing research effort on studying the value of LiDAR in transportation, more work is still required and warranted. The paper shows that future research could be streamed in several different directions including (i) utilizing LiDAR to extract other roadway features and (ii) developing algorithms to overcome the limitations of existing algorithms, which includes limitations related to processing time, accuracy, robustness, and repeatability.
Acknowledgements
The authors would like to thank Alberta Innovates and Alberta Advanced Education for the financial support.
Disclosure statement
No potential conflict of interest was reported by the authors.
Additional information
Funding
References
- Ai, C., and Y. Tsai. 2014b. “Automatic Horizontal Curve Identification and Measurement Method Using GPS Data.” Journal of Transportation Engineering 141 (2): 04014078. doi:10.1061/(ASCE)TE.1943-5436.0000740.
- Ai, C., and Y. J. Tsai. 2016. “An Automated Sign Retroreflectivity Condition Evaluation Methodology Using Mobile LIDAR and Computer Vision.” Transportation Research Part C: Emerging Technologies 63: 96–113. doi:10.1016/j.trc.2015.12.002.
- Ai, C., and Y.-C. J. Tsai. 2014a. “Critical Assessment of an Enhanced Traffic Sign Detection Method Using Mobile LiDAR and INS Technologies.” Journal of Transportation Engineering 141 (5): 04014096. doi:10.1061/(ASCE)TE.1943-5436.0000760.
- Alberta Transportation. 2014. “Vertical Clearance Measurements (VCL2).” In, 13. Alberta Infrastructure and Transportation
- Baass, K., and J. Vouland. 2005. DÉTERMINATION DE L’ALIGNEMENT ROUTIER À PARTIR DE TRACES GPS. Alberta, Calgary: Transportation Association of Canada.
- Cabo, C., C. Ordoñez, S. García-Cortés, and J. Martínez. 2014. “An Algorithm for Automatic Detection of Pole-Like Street Furniture Objects from Mobile Laser Scanner Point Clouds.” ISPRS Journal of Photogrammetry and Remote Sensing 87: 47–56. doi:10.1016/j.isprsjprs.2013.10.008.
- Castro, M., J. A. Anta, L. Iglesias, and J. A. Sánchez. 2013. “GIS-based System for Sight Distance Analysis of Highways.” Journal of Computing in Civil Engineering 28 (3): 04014005. doi:10.1061/(ASCE)CP.1943-5487.0000317.
- Castro, M., L. Iglesias, J. A. Sánchez, and L. Ambrosio. 2011. “Sight Distance Analysis of Highways Using GIS Tools.” Transportation Research Part C: Emerging Technologies 19 (6): 997–1005. doi:10.1016/j.trc.2011.05.012.
- Castro, M., S. Lopez-Cuervo, M. Paréns-González, and C. de Santos-Berbel. 2016a. “LIDAR-based Roadway and Roadside Modelling for Sight Distance Studies.” Survey Review 48 (350): 309–315. doi:10.1179/1752270615Y.0000000037.
- Castro, M., S. Lopez-Cuervo, M. Paréns-González, and C. de Santos-Berbel. 2016b. “LIDAR-based Roadway and Roadside Modelling for Sight Distance Studies.” Survey Review 48 (350): 1–7.
- Chen, X., B. Kohlmeyer, M. Stroila, N. Alwar, R. Wang, and J. Bach. 2009. “Next Generation Map Making: Geo-Referenced Ground-Level LIDAR Point Clouds for Automatic Retro-Reflective Road Feature Extraction.” Paper presented at the Proceedings of the 17th ACM SIGSPATIAL International Conference on Advances in Geographic Information Systems, Seattle, Washington, November 04–06.
- Chih-Wen, W., and S.-H. Chio, 吳志文, and 邱式鴻. 2012. “Road Surface Modeling from Vehicle-Borne Point Cloud by Profile Analysis.” Paper presented at the 33rd Asian Conference on Remote Sensing 2012, Pattaya, Thailand. November 26–30, ACRS 2012
- Di Mascio, P., M. D. Vito, G. Loprencipe, and A. Ragnoli. 2012. “Procedure to Determine the Geometry of Road Alignment Using GPS Data.” Procedia-Social and Behavioral Sciences 53: 1202–1215. doi:10.1016/j.sbspro.2012.09.969.
- El-Halawany, S. I., and D. D. Lichti. 2011. “Detection of Road Poles from Mobile Terrestrial Laser Scanner Point Cloud.” Paper presented at the Multi-Platform/Multi-Sensor Remote Sensing and Mapping (M2RSM), 2011 International Workshop on Janurary 10–12.
- ESRI. 2017. “Using the Python Window.” Environmental Systems Research Institute. Accessed November 2017. http://desktop.arcgis.com/en/arcmap/10.3/analyze/executing-tools/using-the-python-window.htm
- Findley, D. J., C. V. Zegeer, C. A. Sundstrom, J. E. Hummer, W. Rasdorf, and T. J. Fowler. 2012. “Finding and Measuring Horizontal Curves in a Large Highway Network: A GIS Approach.” Public Works Management & Policy 17 (2): 189–211. doi:10.1177/1087724X11419307.
- Gargoum, S., and K. El-Basyouny. 2017. “Automated Extraction of Road Features Using LiDAR Data: A Review of LiDAR Applications in Transportation.” Paper presented at the Transportation Information and Safety (ICTIS), Banff, Alberta, Canada. 2017 4th International Conference.
- Gargoum, S., K. El-Basyouny, and J. Sabbagh. 2018a. “Assessing Stopping and Passing Sight Distance on Highways Using Mobile LiDAR Data.” Journal of Computing in Civil Engineering. doi:10.1061/(ASCE)CP.1943-5487.0000753.
- Gargoum, S., K. El-Basyouny, K. Froese, and A. Gadowski. 2018. “A Fully Automated Approach to Extract and Assess Road Cross Sections from Mobile Lidar Data.” IEEE Journal of Transactions in Intelligent Transportation Systems (IEEE Xplore edition). doi:10.1109/TITS.2017.2784623.
- Gargoum, S., L. Karsten, and K. El-Basyouny. 2018. “Network Level Clearance Assessment Using LiDAR to Improve the Reliability and Efficiency of Issuing Over-Height Permits on Highways.” Transportation Research Record: Journal of the Transportation Research Board, no. 2643: 1–8. doi:10.1177/0361198118758685
- Gargoum, S. A., J. C. Koch, and K. El-Basyouny. 2018. “A Voxel-Based Method for Automated Detection and Mapping of Light Poles on Rural Highways Using LiDAR Data.” Transportation Research Record: 0361198118787657. doi:10.1177/0361198118787657.
- Gargoum, S. A., K. El-Basyouny, and J. Sabbagh. 2018b. “Automated Extraction of Horizontal Curve Attributes Using LiDAR Data.” Transportation Research Record: Journal of the Transportation Research Board. doi:10.1177/0361198118758685.
- Gargoum, S. A., K. El-Basyouny, J. Sabbagh, and K. Froese. 2017. “Automated Highway Sign Extraction Using Lidar Data.” Transportation Research Record: Journal of the Transportation Research Board. doi:10.3141/2643-01.
- Gargoum, S. A., L. Karsten, K. El-Basyouny, and J. C. Koch. 2018. “Automated Assessment of Vertical Clearance on Highways Scanned Using Mobile LiDAR Technology.” Automation in Construction 95: 260–274. doi:10.1016/j.autcon.2018.08.015.
- Guan, H., J. Li, S. Cao, and Y. Yu. 2016. “Use of Mobile LiDAR in Road Information Inventory: A Review.” International Journal of Image and Data Fusion 7 (3): 219–242. doi:10.1080/19479832.2016.1188860.
- Guan, H., J. Li, Y. Yu, C. Wang, M. Chapman, and B. Yang. 2014. “Using Mobile Laser Scanning Data for Automated Extraction of Road Markings.” ISPRS Journal of Photogrammetry and Remote Sensing 87: 93–107. doi:10.1016/j.isprsjprs.2013.11.005.
- Guan, H., W. Yan, Y. Yu, L. Zhong, and D. Li. 2018. “Robust Traffic-Sign Detection and Classification Using Mobile LiDAR Data with Digital Images.” IEEE Journal of Selected Topics in Applied Earth Observations and Remote Sensing 11 (5): 1715–1724. doi:10.1109/JSTARS.2018.2810143.
- Higuera de Frutos, S., and M. Castro. 2017. “A Method to Identify and Classify the Vertical Alignment of Existing Roads.” Computer-Aided Civil and Infrastructure Engineering. doi:10.1111/mice.12302.
- Holgado‐Barco, A., B. Riveiro, D. González‐Aguilera, and P. Arias. 2017. “Automatic Inventory of Road Cross‐Sections from Mobile Laser Scanning System.” Computer-Aided Civil and Infrastructure Engineering 32 (1): 3–17. doi:10.1111/mice.2017.32.issue-1.
- Holgado‐Barco, A., D. González‐Aguilera, P. Arias‐Sanchez, and J. Martinez‐Sanchez. 2015. “Semiautomatic Extraction of Road Horizontal Alignment from a Mobile LiDAR System.” Computer-Aided Civil and Infrastructure Engineering 30 (3): 217–228. doi:10.1111/mice.2015.30.issue-3.
- Imran, M., Y. Hassan, and D. Patterson. 2006. “GPS–GIS‐Based Procedure for Tracking Vehicle Path on Horizontal Alignments.” Computer-Aided Civil and Infrastructure Engineering 21 (5): 383–394. doi:10.1111/mice.2006.21.issue-5.
- Jaakkola, A., J. Hyyppä, H. Hyyppä, and A. Kukko. 2008. “Retrieval Algorithms for Road Surface Modelling Using Laser-Based Mobile Mapping.” Sensors 8 (9): 5238–5249. doi:10.3390/s8095238.
- Jalayer, M., J. Gong, H. Zhou, and M. Grinter. 2015. “Evaluation of Remote Sensing Technologies for Collecting Roadside Feature Data to Support Highway Safety Manual Implementation.” Journal of Transportation Safety & Security 7 (4): 345–357. doi:10.1080/19439962.2014.976691.
- Jung, J., M. J. Olsen, D. S. Hurwitz, A. G. Kashani, and K. Buker. 2018. “3D Virtual Intersection Sight Distance Analysis Using Lidar Data.” Transportation Research Part C: Emerging Technologies 86: 563–579. doi:10.1016/j.trc.2017.12.004.
- Kemeny, J., and K. Turner, Ground-based LiDAR: rock slope mapping and assessment. Federal Highway Administration report, FHWA-CFL/TD-08-006., Available at http:// www.“ www. iaeg. info/ portals/ 0/ Content/ Commissions/ Comm19/ GROUND-BASED LiDAR Rock Slope Mapping and Assessment. pdf, 2008.
- Khattak, A. J., and H. Shamayleh. 2005. “Highway Safety Assessment through Geographic Information System-Based Data Visualization.” Journal of Computing in Civil Engineering 19 (4): 407–411. doi:10.1061/(ASCE)0887-3801(2005)19:4(407).
- Kumar, P., C. P. McElhinney, P. Lewis, and T. McCarthy. 2013. “An Automated Algorithm for Extracting Road Edges from Terrestrial Mobile LiDAR Data.” ISPRS Journal of Photogrammetry and Remote Sensing 85: 44–55. doi:10.1016/j.isprsjprs.2013.08.003.
- Kumar, P., C. P. McElhinney, P. Lewis, and T. McCarthy. 2014. “Automated Road Markings Extraction from Mobile Laser Scanning Data.” International Journal of Applied Earth Observation and Geoinformation 32: 125–137. doi:10.1016/j.jag.2014.03.023.
- Lam, J., K. Kusevic, P. Mrstik, R. Harrap, and M. Greenspan. 2010. “Urban Scene Extraction from Mobile Ground Based Lidar Data.” Paper presented at the Proceedings of 3DPVT, Paris, France.
- Landa, J., and D. Prochazka. 2014. “Automatic Road Inventory Using LiDAR.” Procedia Economics and Finance 12: 363–370. doi:10.1016/S2212-5671(14)00356-6.
- Lato, M., J. Hutchinson, M. Diederichs, D. Ball, and R. Harrap. 2009. “Engineering Monitoring of Rockfall Hazards along Transportation Corridors: Using Mobile Terrestrial LiDAR.” Nat. Hazards Earth Syst. Sci 9 (3): 935–946. doi:10.5194/nhess-9-935-2009.
- Lauzon, R. G. 2000. “Automated vertical clearance measurement during photolog operations.” https://rosap.ntl.bts.gov/view/dot/14168
- Lehtomäki, M., A. Jaakkola, J. Hyyppä, A. Kukko, and H. Kaartinen. 2010. “Detection of Vertical Pole-Like Objects in a Road Environment Using Vehicle-Based Laser Scanning Data.” Remote Sensing 2 (3): 641–664. doi:10.3390/rs2030641.
- Lehtomäki, M., A. Jaakkola, J. Hyyppä, J. Lampinen, H. Kaartinen, A. Kukko, E. Puttonen, and H. Hyyppä. 2016. “Object Classification and Recognition from Mobile Laser Scanning Point Clouds in a Road Environment.” IEEE Transactions on Geoscience and Remote Sensing 54 (2): 1226–1239. doi:10.1109/TGRS.2015.2476502.
- Liu, W., S.-E. Chen, and E. Hasuer. 2012. “Bridge Clearance Evaluation Based on Terrestrial LIDAR Scan.” Journal of Performance of Constructed Facilities 26: 4. doi:10.1061/(ASCE)CF.1943-5509.0000208.
- McElhinney, C. P., P. Kumar, C. Cahalane, and T. McCarthy 2010. “Initial Results from European Road Safety Inspection (EURSI) Mobile Mapping Project.” Paper presented at the ISPRS Commission V Technical Symposium. Riva del Garda, Italy, June 23–25.
- Olsen, M. J., G. Roe, C. Glennie, F. Persi, M. Reedy, D. Hurwitz, K. Williams, H. Tuss, A. Squellati, and M. Knodler. 2013. “NCHRP 15-44 Guidelines for the Use of Mobile LiDAR in Transportation Applications, 2013.” http://onlinepubs.trb.org/onlinepubs/nchrp/docs/NCHRP15-44_FinalGuidelines.pdf
- Pu, S., M. Rutzinger, G. Vosselman, and S. O. Elberink. 2011. “Recognizing Basic Structures from Mobile Laser Scanning Data for Road Inventory Studies.” ISPRS Journal of Photogrammetry and Remote Sensing 66 (6): S28–S39. doi:10.1016/j.isprsjprs.2011.08.006.
- Puente, I., B. Akinci, H. González-Jorge, L. Díaz-Vilariño, and P. Arias. 2016. “A Semi-Automated Method for Extracting Vertical Clearance and Cross Sections in Tunnels Using Mobile LiDAR Data.” Tunnelling and Underground Space Technology 59: 48–54. doi:10.1016/j.tust.2016.06.010.
- Rasdorf, W., D. J. Findley, C. V. Zegeer, C. A. Sundstrom, and J. E. Hummer. 2011. “Evaluation of GIS Applications for Horizontal Curve Data Collection.” Journal of Computing in Civil Engineering 26 (2): 191–203. doi:10.1061/(ASCE)CP.1943-5487.0000127.
- Riveiro, B., L. Díaz-Vilariño, B. Conde-Carnero, M. Soilán, and P. Arias. 2016. “Automatic Segmentation and Shape-Based Classification of Retro-Reflective Traffic Signs from Mobile LiDAR Data.” IEEE Journal of Selected Topics in Applied Earth Observations and Remote Sensing 9 (1): 295–303. doi:10.1109/JSTARS.2015.2461680.
- Serna, A., and B. Marcotegui. 2013. “Urban Accessibility Diagnosis from Mobile Laser Scanning Data.” ISPRS Journal of Photogrammetry and Remote Sensing 84: 23–32. doi:10.1016/j.isprsjprs.2013.07.001.
- Shams, A., W. A. Sarasua, A. Famili, W. J. Davis, J. H. Ogle, L. Cassule, and A. Mammadrahimli. 2018. “Highway Cross-Slope Measurement Using Mobile LiDAR.” Transportation Research Record: 0361198118756371. doi:10.1177/0361198118756371.
- Soilán, M., B. Riveiro, J. Martínez-Sánchez, and P. Arias. 2016. “Traffic Sign Detection in MLS Acquired Point Clouds for Geometric and Image-Based Semantic Inventory.” ISPRS Journal of Photogrammetry and Remote Sensing 114: 92–101. doi:10.1016/j.isprsjprs.2016.01.019.
- Souleyrette, R., S. Hallmark, S. Pattnaik, M. O’Brien, and D. Veneziano. 2003. “Grade and Cross Slope Estimation from LiDAR-based Surface Models.” The National Consortium of Remote Sensing in Transportation.
- Teo, T.-A., and C.-M. Chiu. 2015. “Pole-Like Road Object Detection from Mobile Lidar System Using a Coarse-To-Fine Approach.” IEEE Journal of Selected Topics in Applied Earth Observations and Remote Sensing 8 (10): 4805–4818. doi:10.1109/JSTARS.2015.2467160.
- Thuy, M., and F. León. 2010. “Lane Detection and Tracking Based on Lidar Data.” Metrology and Measurement Systems 17 (3): 311–321. doi:10.2478/v10178-010-0027-3.
- Tsai, Y., A. Chengbo, Z. Wang, and E. Pitts. 2013. “Mobile Cross-Slope Measurement Method Using Lidar Technology.” Transportation Research Record: Journal of the Transportation Research Board, no. 2367: 53–59. doi:10.3141/2367-06.
- Tsai, Y., Q. Yang, and Y. Wu. 2011. “Use of Light Detection and Ranging Data to Identify and Quantify Intersection Obstruction and Its Severity.” Transportation Research Record: Journal of the Transportation Research Board, no. 2241: 99–108. doi:10.3141/2241-11.
- Tsai, Y. J., J. Wu, Z. Wang, and Z. Hu. 2010. “Horizontal Roadway Curvature Computation Algorithm Using Vision Technology.” Computer-Aided Civil and Infrastructure Engineering 25 (2): 78–88. doi:10.1111/j.1467-8667.2009.00622.x.
- Tsai, Y.-C. J., and F. Li. 2012. “Critical Assessment of Detecting Asphalt Pavement Cracks under Different Lighting and Low Intensity Contrast Conditions Using Emerging 3D Laser Technology.” Journal of Transportation Engineering 138 (5): 649–656. doi:10.1061/(ASCE)TE.1943-5436.0000353.
- Varela-González, M., H. González-Jorge, B. Riveiro, and P. Arias. 2013. “Performance Testing of LiDAR Exploitation Software.” Computers & Geosciences 54: 122–129. doi:10.1016/j.cageo.2012.12.001.
- Vosselman, G., B. G. H. Gorte, G. Sithole, and T. Rabbani. 2004. “Recognising Structure in Laser Scanner Point Clouds.” International Archives of Photogrammetry, Remote Sensing and Spatial Information Sciences 46 (8): 33–38.
- Vu, A., Q. Yang, J. A. Farrell, and M. Barth. 2013. “Traffic Sign Detection, State Estimation, and Identification Using Onboard Sensors.” Paper presented at the 16th International IEEE Conference on Intelligent Transportation Systems (ITSC 2013).
- Wang, H., Z. Cai, H. Luo, C. Wang, L. Peng, W. Yang, S. Ren, and J. Li 2012. “Automatic Road Extraction from Mobile Laser Scanning Data.” Paper presented at the Computer Vision in Remote Sensing (CVRS), 2012 International Conference on.
- Weng, S., J. Li, Y. Chen, and C. Wang. 2016. “Road Traffic Sign Detection and Classification from Mobile LiDAR Point Clouds.” Paper presented at the 2015 ISPRS International Conference on Computer Vision in Remote Sensing.
- Williams, K., M. Olsen, G. Roe, and C. Glennie. 2013b. “Synthesis of Transportation Applications of Mobile LiDAR.” Remote Sensing 5 (9): 4652–4692. doi:10.3390/rs5094652.
- Williams, K., M. J. Olsen, G. V. Roe, and C. Glennie. 2013a. “Synthesis of Transportation Applications of Mobile LiDAR.” Remote Sensing 5 (9): 4652–4692. doi:10.3390/rs5094652.
- Wu, B., Y. Bailang, W. Yue, S. Shu, W. Tan, C. Hu, Y. Huang, J. Wu, and H. Liu. 2013. “A Voxel-Based Method for Automated Identification and Morphological Parameters Estimation of Individual Street Trees from Mobile Laser Scanning Data.” Remote Sensing 5 (2): 584–611. doi:10.3390/rs5020584.
- Wu, S., C. Wen, H. Luo, Y. Chen, C. Wang, and L. Jonathan 2015. “Using Mobile LiDAR Point Clouds for Traffic Sign Detection and Sign Visibility Estimation.” Paper presented at the 2015 IEEE International Geoscience and Remote Sensing Symposium (IGARSS).
- Yadav, M., A. K. Singh, and B. Lohani. 2017. “Extraction of Road Surface from Mobile LiDAR Data of Complex Road Environment.” International Journal of Remote Sensing 38 (16): 4645–4672. doi:10.1080/01431161.2017.1320451.
- Yadav, M., B. Lohani, A. K. Singh, and A. Husain. 2016. “Identification of Pole-Like Structures from Mobile Lidar Data of Complex Road Environment.” International Journal of Remote Sensing 37 (20): 4748–4777. doi:10.1080/01431161.2016.1219462.
- Yan, L., H. Liu, J. Tan, Z. Li, H. Xie, and C. Chen. 2016. “Scan Line Based Road Marking Extraction from Mobile LiDAR Point Clouds.” Sensors 16 (6): 903. doi:10.3390/s16122100.
- Yu, Y., J. Li, H. Guan, and C. Wang. 2015. “Automated Extraction of Urban Road Facilities Using Mobile Laser Scanning Data.” IEEE Transactions on Intelligent Transportation Systems 16 (4): 2167–2181. doi:10.1109/TITS.2015.2399492.
- Zhang, K., and H. Christopher Frey. 2006. “Road Grade Estimation for On-Road Vehicle Emissions Modeling Using Light Detection and Ranging Data.” Journal of the Air & Waste Management Association 56 (6): 777–788. doi:10.1080/10473289.2006.10464500.
- Zhang, W. 2010. “LIDAR-based Road and Road-Edge Detection.” Paper presented at the Intelligent Vehicles Symposium (IV), 2010 IEEE.
- Zhang, Y., J. Wang, X. Wang, and J. M. Dolan. 2018. “Road-Segmentation-Based Curb Detection Method for Self-Driving via a 3d-Lidar Sensor.” IEEE Transactions on Intelligent Transportation Systems.
- Zheng, H., R. Wang, and S. Xu. 2017. “Recognizing Street Lighting Poles from Mobile LiDAR Data.” IEEE Transactions on Geoscience and Remote Sensing 55 (1): 407. doi:10.1109/TGRS.2016.2607521.
- Zhou, L., and Z. Deng. 2014. “LIDAR and Vision-Based Real-Time Traffic Sign Detection and Recognition Algorithm for Intelligent Vehicle.” Paper presented at the 17th International IEEE Conference on Intelligent Transportation Systems (ITSC).
- Zhou, Y., D. Wang, X. Xie, Y. Ren, G. Li, Y. Deng, and Z. Wang. 2014. “A Fast and Accurate Segmentation Method for Ordered LiDAR Point Cloud of Large-Scale Scenes.” IEEE Geoscience and Remote Sensing Letters 11 (11): 1981–1985. doi:10.1109/LGRS.2014.2316009.