
 ?Mathematical formulae have been encoded as MathML and are displayed in this HTML version using MathJax in order to improve their display. Uncheck the box to turn MathJax off. This feature requires Javascript. Click on a formula to zoom.
Abstract
Previous research on urban impervious surface monitoring has ignored the differences, spatial patterns, and driving factors of impervious surfaces among the various functional zones in cities. In this paper, we extracted the impervious surface coverage of Tianjin in 1990, 1995, 2000, 2005, 2010, and 2015 based on the Classification and Regression Tree model. Then, using the methods of quantitative geography, we systematically analyzed the spatiotemporal variations of impervious surface coverage among the functional zones in Tianjin from 1990 to 2015. Additionally, the driving mechanisms of impervious surface growths among different functional zones were investigated. The results showed that (1) the growth of impervious surfaces shows two spatially separate core areas of growth. The core functional zone (CFZ) had the highest impervious surface coverage, and the ecological conservation zone (ECZ) had the lowest impervious surface coverage. (2) High-high aggregation regions of impervious surface coverage were mainly located in CFZ, while low-low aggregation regions of impervious surface coverage area were mainly located in ECZ. (3) Influences of social-economic factors on area growths of impervious surface are stronger in urban function expanded zone, coastal city key development zone, Beijing–Tianjin coordinated development zone, and urban-rural coordinated development zone than those in CFZ. Our results can provide a point of reference for decision-making regarding urban planning management.
1. Introduction
Urbanization has become a research hotspot in the twenty-first century (Wigginton, et al. Citation2016; Fang and Yu Citation2017; Fang, Pang, and Liu Citation2017; Cao et al. Citation2018a; Cao, Hu, and Hu et al. Citation2018b). The most prominent feature of urbanization is the continual replacement of a large number of natural surfaces by artificial impervious surfaces, such as roads, buildings, and parking lots (Weng Citation2012; Yang, Huang, and Homer et al. Citation2003; Peng, Xie, and Liu et al. Citation2016; Lu, Batistella, and Moran et al. Citation2014). The rapid expansion of impervious surfaces severely impacts the biochemical cycle, hydrological processes, climate change, and regional ecosystem biodiversity at global and local scales (Grimm et al. Citation2008; Alberti Citation2009; Pickett, Cadenasso, and Grove et al. Citation2011; Sáchez-Rodrfguez, Seto, and Simon Citation2005). Moreover, the expansion of these surfaces would affect the water environment and aggravate water pollution (Yuan and Bauer Citation2007). Therefore, dynamic monitoring of urbanization has become a key area of global change research.
As the core of urban planning and an important basis for spatial planning, urban functional zoning involves arranging various material elements, such as factories, warehouses, and houses, in a city based on functional requirements to form an organic whole that is interconnected and reasonable in layout and create a good environment and conditions for the various activities of the city (Masser Citation1982). The idea of urban functional zoning stems from the Athens Charter published by the International Conference on Modern Architecture in 1933 (Le, Giraudoux, and Eardley et al. Citation1973). At that time, urban planning was primarily based on functional zoning. Since the 1970s, certain big cities in Europe and the US have gradually weakened functional zoning in their planning because of mature spatial structure (Huang Citation2004). However, urban functional zoning is still widely practiced in developing countries, especially in China, because urban spatial structure is still imperfect (Zhang and Du Citation2015). Urban functional divisions vary in their urban functions; e.g. an urban core functional zone may focus on administrative, cultural, and business services, while an ecological functional zone may be an important scenic tourist area and an ecological conservation area. These differences lead to substantial differences in the extent and intensity of the artificial impervious surfaces in these areas. Accurately monitoring the changes, spatial patterns, growth rates, and driving mechanisms of impervious surface in the various functional zones of a city and implementing targeted regulations are key to the sustainable urban development.
With the rapid development of remote sensing technologies, remote sensing can be used as an effective technical means for the dynamic monitoring and mapping of impervious surfaces (Weng Citation2012; Yang et al. Citation2003; Lu, Batistella, and Moran et al. Citation2014; Wilson et al. Citation2003; Guo et al. Citation2018; Torbick and Corbiere Citation2015; Piyoosh and Ghosh Citation2017). Unlike traditional LULC data, the emerging spatial distribution pattern of impervious surface coverage can handle the mixed pixel problem to a certain extent and provides a continuous description of the urban land use patterns (e.g. Cao et al. Citation2018b; Hu et al. Citation2017; Yang, Huang, and Homer et al. Citation2003). Therefore, methods of quantifying urban impervious surfaces and their spatiotemporal variations received widespread attention in recent literature. Currently, the use of impervious surfaces for the quantitative assessment of urbanization, global environmental change and urban ecology, and climate change has attracted widespread attention (Kuang, Chen, and Liu et al. Citation2016; Foley, DeFries, and Asner et al. Citation2005). The US National Oceanic and Atmospheric Administration (NOAA) developed a global 1-km-resolution impervious surface dataset using the Defense Meteorological Satellite Program (DMSP) and the Operational Linescan System (OLS) nighttime light data (NTL) and found that China has a larger impervious surface area than other countries and that the growth of the impervious surface area in the US, Europe, Japan, China, and India has significantly affected the local water environment (Elvidge et al. Citation2007). At a national scale, the USGS developed an impervious surface dataset for the continental US in 2001, 2006, and 2011 based on Landsat images and predicted that the increased impervious surface area had a strong effect on the water environment in the US (Yang et al. Citation2003; Xian, Homer, and Fry Citation2009). Using the DMSP/OLS NTL data, Liu et al. (Citation2012) analyzed the impervious surface expansion of Chinese cities from 1992 to 2008 and found that impervious surfaces increased dramatically during this period. Additionally, the spatial distribution of impervious surfaces in Beijing was retrieved by Xiao, Ouyang, and Cai et al. (Citation2007) and Fan (Citation2014) based on Classification and Regression Tree (CART) and vegetation-impervious-soil (V-I-S) models, respectively, revealing that impervious surface coverage gradually decreased from the city center to the suburbs, while the rate of expansion increased over time. Although previous researchers have conducted a large number of studies at various scales for the dynamic monitoring of urban impervious surface, few studies have focused on the variations, differences, interactions, and driving mechanisms of impervious surfaces among the functional zones within a city.
As one of the four major municipalities in China, Tianjin has undergone a process of rapid urbanization over the last 25 years. The expansion of impervious surfaces in Tianjin has been characterized by the spreading of rapid changes. In this paper, Tianjin is taken as the study area to discuss the spatial and temporal distribution of impervious surfaces in various functional zones as well as the similarities and differences of their driving factors. The specific objectives are as follows: (1) monitor the variations in the impervious surface area of the functional zones in Tianjin from 1990 to 2015; (2) analyze the spatial distributions of the impervious surfaces of the functional zones in Tianjin; and (3) identify the driving factors of impervious surface variations among the functional zones.
2. Study area and data
2.1. Study area
shows the geographical location of Tianjin. According to General Planning for Land Use in Tianjin (2006–2020) (http://www.tjsqgt.gov.cn/Lists/List77/DispForm.aspx?ID=43), Tianjin can be divided into six functional zones: the core functional zone (CFZ), the urban function expanded zone (UEZ), the coastal city key development zone (CKZ), the Beijing–Tianjin coordinated development zone (BTZ), the urban-rural coordinated development zone (URZ), and the ecological conservation zone (ECZ). Considering such factors as natural conditions, economic, and social structure and the strategic layout of economic development in Tianjin, the plan of division is based on the principle of creating zones with maximum internal similarity by maximizing the difference from areas outside the zone and the relative integrity of the administrative division.
Figure 1. Overview of the study area. According to the General Planning for Land Use in Tianjin (2006–2020) (http://www.tjsqgt.gov.cn/Lists/List77/DispForm.aspx?ID=43), Tianjin can be divided into six different functional zones: core functional zone (CFZ), urban function expanded zone (UEZ), coastal city key development zone (CKZ), Beijing–Tianjin coordinated development zone (BTZ), urban-rural coordinated development zone (URZ), and ecological conservation zone (ECZ). BTH refers to Beijing-Tianjin-Hebei urban agglomeration.
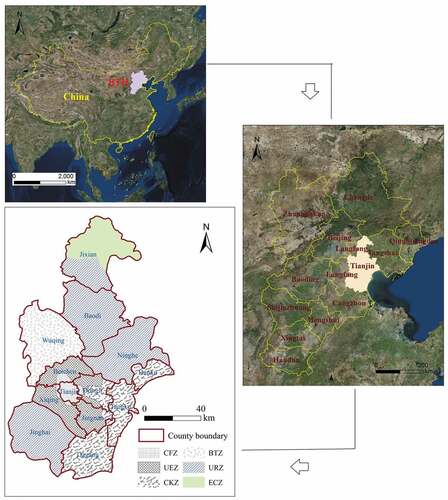
CFZ consists of administrative, cultural, and business service centers, and it is a core area of urban functions. UEZ is an important transportation hub for population and industrial transfer in the core functional zone, and it is a key area for undertaking residential functions, business service functions and industrial expansion functions of CFZ. CKZ is the gateway to the opening of northern China and home to a high level of modern manufacturing and an R&D base. As an important corridor connecting Beijing and Tianjin, BTZ is an important area for urban development and industrial activity in Tianjin and has excellent agricultural production conditions. URZ is the main agricultural zone in Tianjin and an important area for modern manufacturing. As the only mountainous area in Tianjin, ECZ is an important scenic tourist area and an ecological conservation area.
2.2. Data collection and preprocessing
shows the satellite images used in this research: (1) 30-m cloud-free leaf-on and leaf-off Landsat Thematic Mapper (TM)/Operational Land Imager (OLI) image data (Level 2 reflectance data) covering Tianjin in 1990, 1995, 2000, 2005, 2010, and 2015 were downloaded from USGS (Citation2017); (2) high-resolution multispectral QuickBird images (Digitalglobe Citation2017; 2.4-m spatial resolution) covering Tianjin were obtained to assist impervious surface extraction; (3) DMSP/OLS NTL data were acquired from the National Centers for Environmental Information for 1992, 1995, 2000, 2005, and 2010 (NOAA Citation2017a); (4) Polar-orbiting Partnership (NPP)/Visible Infrared Imaging Radiometer (VIIRS) NTL data for 2015 were downloaded from the National Centers for Environmental Information (NOAA Citation2017b). (5) High-resolution Google Earth images covering Tianjin from 1990 to 2015 were investigated to identify the changes of impervious surface coverage. The Landsat TM/OLI images and the DMSP/OLS and NPP/VIIRS datasets were the input variables of the CART model. The results of impervious surface extraction from QuickBird images were the target variables and testing samples of the CART model.
Table 1. A summary of satellite images used in this research.
DMSP/OLS and NPP/VIIRS NTL data were resampled at 30 m to match the spatial resolution of the Landsat TM/OLI images. All images were geo-referenced to WGS-84/UTM with root-mean-square errors of less than 0.5 pixels using ArcGIS 10.1.
In addition, gridded population and Gross Domestic Product (GDP) data with a resolution of 1 km covering 1995, 2000, 2005, 2010, and 2015 released by Resource and Environment Data Cloud Platform, Institute of Geographic Sciences and Natural Resources Research, CAS (REDCP Citation2018) were used to analyze the driving factors to the impervious surface variations.
3. Methods
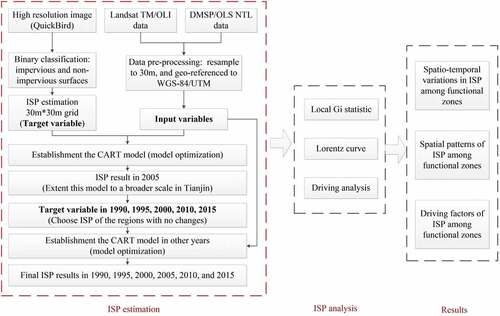
A workflow of the study is shown in , and it includes two key steps: (1) impervious surface coverage extraction from 1990 to 2015 and (2) analysis of variations, spatial patterns, and driving factors in impervious surface percentage (ISP) in Tianjin for various urban functional zones from 1990 to 2015.
Figure 2. Workflow of the study.
3.1. Impervious surface coverage extraction
Impervious surface coverage was extracted using a combination of remote sensing data and a CART model, which has become the main method for impervious surface coverage extraction used by the US National Land Cover Database (NLCD) (Yang, Huang, and Homer et al. Citation2003). Previous researchers have shown that the accuracy and predictability of regression tree models are better than those of simple linear regression models (Huang and Townshend Citation2003; Liu et al. Citation2005b; Hu et al. Citation2017). Three main steps were involved in the extraction of impervious surface coverage.
First, we extracted the binary classification results for Tianjin, including impervious surfaces and nonimpervious surfaces, using a segmentation-based procedure with the random forest classification method (Breiman Citation2001) from high-resolution QuickBird images in 2005. Then, we calculated impervious surface coverage in 2005 (from 1% to 100%) at a 30-m resolution based on the results of the binary classification of the training data sample. The impervious surface coverage data extracted from high-resolution images were divided into training and testing samples for the CART model.
Second, the impervious surface coverage in Tianjin in the other years was estimated based on the CART model. For 1990, 1995, 2000, and 2010, the independent variables of the CART model were the reflectance values of bands 1, 2, 3, 4, 5, and 7 of TM and the DNs of DMSP/OLS stable NTL data, while those for 2015 were the reflectance values of bands 2, 3, 4, 5, 6, and 7 of the OLI data and the radiance values of the NPP/VIIRS NTL data. Compared with high-resolution Google Earth images, the impervious surface coverage data of regions without changes were collected in Tianjin in 2005 as the training and testing samples in other years.
Third, the impervious surface coverage of Tianjin in 2005 was estimated for the test sample based on the CART model. The independent variables of the CART model included the reflectance values of bands 1, 2, 3, 4, 5, and 7 of the Landsat 5 TM data and the digital numbers (DNs) of the DMSP/OLS stable NTL data for 2005. The target variable was the impervious surface coverage at a 30-m resolution.
Based on the above steps, we mapped the impervious surface coverage of Tianjin from 1990–2015. The initial predictive models were developed using Cubist software, which is produced by Rulequest for data mining (detailed information on Cubist software is available at <http://rulequest.com/cubist-info.html>). In addition, the predictive accuracy can be estimated using 10-fold cross-validation in Cubist, which means the sample data was divided into 10 parts (9 parts for training and 1 part for verification) of roughly equal size, and in turn, each block is used to test a model built from the data in the remaining blocks.
In the accuracy assessment of the extraction of impervious surface coverage, we used three variables to evaluate CART model performance: average error (AE), relative error (RE), and the Pearson correlation coefficient (r) between actual and predicted values (Yang Citation2003; Hu et al. Citation2017).
AE is used to measure the quality of the regression tree:
(1)
(1)
where is the function of the regression plane through the example set, X = {x1, x2, …, xm} is a set of m predicted ISP values, yi is a set of the actual ISP values (interpreted values), and N is the number of samples used to establish the tree.
RE is used to compare the quality of serval regression trees:
(2)
(2)
where AE (u) is used to standardize AE (T) and represents the mean value of predicted ISP.
r, which is also produced by Cubist, is defined as:
(3)
(3)
where X represents the interpreted ISP value, Y represents the predictive ISP value, and N is number of samples.
To further analyze the accuracy of the impervious surface coverage extracted with the CART model, we randomly selected 100 sample points in each of the six functional zones (a total of 600 samples). Then, we mapped scatter plots of model estimates and the results extracted from the high-resolution QuickBird images in each of the six functional zones in 2005.
Lower AE and RE are associated with higher r and indicate greater similarity between the interpreted ISP values and the estimated ISP values.
3.2. Local gi statistic
The local Gi statistic is an indicator of the local spatial associations among observation values around spatial location i. A larger positive value of the Gi statistic indicates clustering of high observation values, whereas a larger negative value of the Gi statistic indicates clustering of low observation values. Therefore, we could use the local Gi statistic to identify the spatial pattern of the impervious surface coverage characterized by the clustering of very high or very low ISP values (Getis and Ord Citation1992; Chen Citation2009):
(4)
(4)
where Wij represents the distance weight between patches i and j. A significant positive value of Z (Gi) suggests that the impervious surface coverage of the patches adjacent to i is high, whereas a significant negative value of Z (Gi) reflects the opposite pattern.
We divided the categories according to statistical significance to describe the local spatial clustering of impervious surface coverage (ISC) into a high-high aggregation region, a moderate high-high aggregation region, a non-aggregation region, a moderate low-low aggregation region, and a low-low aggregation region. These categories have Z (Gi) values higher than 2.58, between 1.96 and 2.58, between −1.96 and 1.96, between −2.57 and −1.96, and lower than −2.58, respectively. High-high aggregation means the region has a significant clustering of high ISC values, whereas low-low aggregation region means the region has a significant clustering of low ISC values.
4. Results
4.1. Evaluation of the impervious surface coverage results
shows the accuracy assessment of the extraction of impervious surface coverage. The AE, RE, and r values between the estimated impervious surface from Landsat and DMSP/OLS data, the CART model and the extracted impervious surface from high-resolution QuickBird images from 2005 were 8.30%, 0.35, and 0.83, respectively. In the other years, the AE, RE, and r values were within 11.30%, below 0.44, and higher than 0.78, respectively.
Table 2. Accuracy assessment of the extraction of impervious surface coverage.
The system errors of CFZ, UEZ, CKZ, BTZ, URZ, and ECZ were −0.123, −0.095, −0.055, −0.037, −0.045, and −0.027, respectively. The small negative values of system errors in all functional zones indicate that the impervious surface coverage extracted by the CART model was slightly underestimated in all functional zones (Lu, Batistella, and Moran et al. Citation2014).
shows that coverage was underestimated in the high impervious surface coverage region of CFZ when the impervious surface coverage was greater than 80% (system error was −2.02), while coverage was overestimated in the low impervious surface coverage region of ECZ (system error was 2.36) when the impervious surface coverage was lower than 20%. These findings have proven that the results of the CART model are affected by some systematic errors (Wang, Wu, and Wu et al. Citation2017), which is consistent with the previous research results (Yang, Huang, and Homer et al. Citation2003; Im et al. Citation2012; Hu et al. Citation2017). Based on the above evaluation of the impervious surface coverage results and a comparison with previous research, we confirmed that our results can meet the analytical needs of our study.
Figure 3. Relationships between the estimated and interpreted impervious surface coverage for 2005 in six different functional zones: (a) core functional zone (CFZ), (b) urban function expanded zone (UEZ), (c) coastal city key development zone (CKZ), (d) Beijing–Tianjin coordinated development zone (BTZ), (e) urban-rural coordinated development zone (URZ), and (f) ecological conservation zone (ECZ).
4.2. Variations in impervious surface area (ISA)
4.2.1. The overall changes in ISA
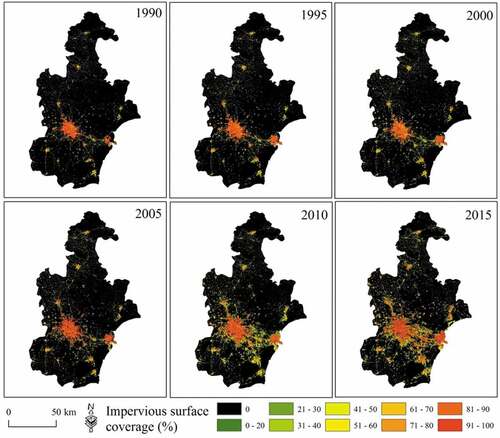
The total area of the impervious surfaces in Tianjin rapidly increased from 524.24 km2 in 1990 to 1292.96 km2 in 2015, which is an increase of 768.72 km2 and a factor of approximately 1.47. The annual rate of change was 30.74 km2 year–1 (). shows the impervious surface coverage in Tianjin from 1990 to 2015. As shown in , few changes in the spatial distribution of the impervious surface were observed in Tianjin from 1990 to 2005, although rapid increases occurred in Tianjin from 1990 to 2015. Moreover, a sporadic point structure of the impervious surface coverage of Tianjin in 1990 gradually converted to a mesh structure in 2015. In addition, the growth of impervious surfaces shows two spatially separate core areas of growth. CFZ and UEZ experienced the highest expansions of impervious surfaces, in which layers of impervious surfaces rapidly radiate outward in the shape of concentric circles.
Table 3. Changes in impervious surface areas in the functional zones of Tianjin from 1990 to 2015. Abbreviations for the six functional zones are core functional zone (CFZ), urban function expanded zone (UEZ), coastal city key development zone (CKZ), Beijing–Tianjin coordinated development zone (BTZ), urban-rural coordinated development zone (URZ), and ecological conservation zone (ECZ).
Figure 4. Impervious surface coverage in Tianjin from 1990 to 2015.
4.2.2. Variations in impervious surface coverage among the various functional zones
shows the changes in the impervious areas among functional zones from 1990 to 2015. The area of the impervious surfaces showed varying degrees of growth across the functional zones and among the different periods. In addition, the area of the impervious surfaces of CKZ exhibited the largest increase, while that of ECZ had the lowest increase.
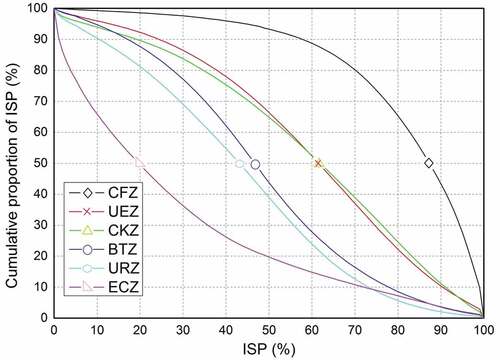
A significant difference of the impervious coverages was observed among zones due to the different functional orientations of the various urban functional zones (). As shown in , CFZ had the highest impervious surface coverage, and the proportion of the region with an impervious surface coverage greater than 70% was approximately 80%. ECZ had the lowest impervious surface coverage, and the proportion of the region with an impervious surface coverage lower than 30% was higher than 60%. UEZ and CKZ had similar impervious surface coverages, and their proportion of the region with an impervious surface coverage greater than 50% was approximately 65%. Additionally, the impervious surface coverage in BTZ was slightly higher than that in URZ, and the proportions of regions with an impervious surface coverage greater than 50% in BTZ and URZ were approximately 45% and 40%, respectively.
Figure 5. Differences in the cumulative proportion of impervious surface coverage of the functional zones in 2015. ISP refers to impervious surface percentage (note: ISP refers to impervious surface percentage; please refer to for an explanation of the abbreviations).
4.2.3. Monitoring the impervious surface coverage of the key conservation zone
According to the plan of the General Planning for Land Use in Tianjin (2006–2020) (http://www.tjsqgt.gov.cn/Lists/List77/DispForm.aspx?ID=43), there are 15 farmland conservation zones (FCZs) and two wetland conservation zones (WCZs) in addition to ECZ (). Cultivated land protection is a global strategic issue that relates to the sustainable development of economy and society in China and a basic state policy that must be adhered to long term. With their rich biological diversity and high productivity, wetlands are one of the most important environmental resources for mankind. Therefore, monitoring the changes in the impervious surfaces of FCZs and WCZs is of great importance for coordinating urban construction and environmental protection and promoting sustainable development in Tianjin.
Figure 6. Wetland and farmland conservation zones in Tianjin (note: please refer to for an explanation of the abbreviations).
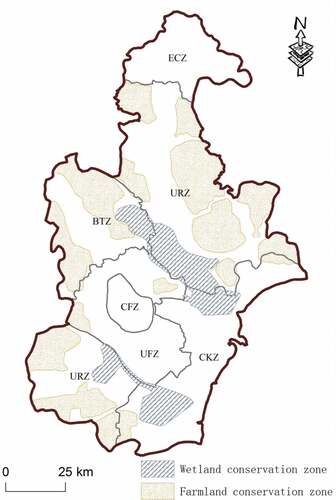
shows the impervious surface areas in the WCZ and FCZ regions of Tianjin from 1990 to 2015. As shown in , both the impervious surface area and the coverage in WCZ and FCZ increased from 1990–2015. The area of the impervious surfaces of WCZ and FCZ gradually increased, from 7.06 km2 and 46.13 km2 in 1990 to 33.65 km2 and 126.07 km2 in 2015, which is a respective increase of 26.59 km2 and 79.94 km2. In addition, the impervious coverages of WCZ and FCZ substantially increased from 0.61% to 1.38% in 1990 to 2.91% to 3.77% in 2015, respectively. Planners should enforce limits on the growth of impervious surfaces and focus on protecting the pervious surface environments and the ecological functions of WCZ and FCZ.
Table 4. Impervious surface areas in the wetland conservation zone and farmland conservation zone of Tianjin from 1990 to 2015 (note: ISA and ISP represent impervious surface area and impervious surface percentage, respectively).
4.3. Spatial patterns of impervious surfaces
4.3.1. Spatial clustering
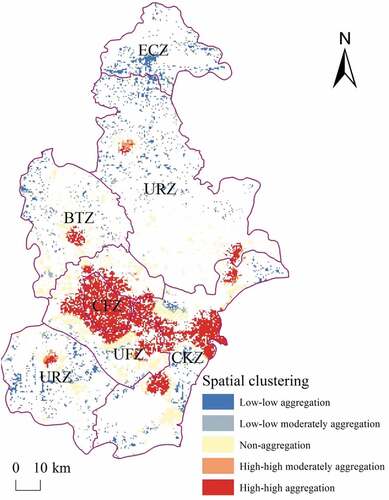
shows the spatial clustering of the impervious surface coverage of Tianjin in 2015. As shown in , the high-high aggregation regions of impervious surface coverage are mainly located in CFZ, UEZ, and CKZ. Notably, the proportion of the high-high aggregation regions area in CFZ is 100%. Low-low aggregation regions of impervious surface coverage area are mainly located in ECZ and URZ. In addition, 95.09% of the impervious surface area of ECZ has a low-low aggregation trend.
Figure 7. Spatial hotspot maps of impervious surfaces in Tianjin in 2015 (note: please refer to for an explanation of the abbreviations).
4.3.2. Spatial heterogeneity
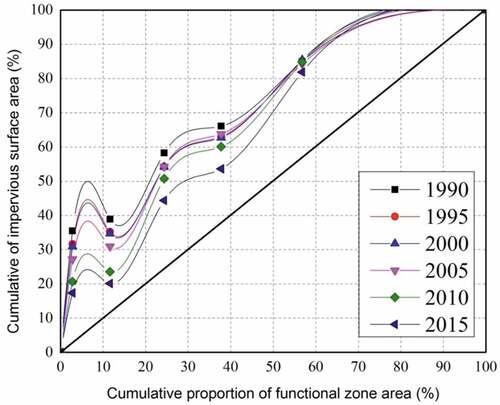
shows a Lorenz curve based on the impervious surface of each functional zone. The Lorenz curve was used to reveal the inequality in distribution of wealth, land, and income among social classes or other population units. In this study, we used the Lorenz curve to analyze the spatial heterogeneity of ISP among various functional zones. In , the horizontal axis is the cumulative proportion of functional zone areas of each functional zone and the vertical axis is the cumulative proportion of impervious surface areas of each functional zone. As shown in , the spatial Lorenz curve gradually went closer to the standard line over time, which indicates that the distribution of impervious surfaces was more equal from 1990 to 2015 among the functional zones.
Figure 8. Differences in the cumulative proportion of impervious surface coverage among the functional zones in from 1990 to 2015.
4.4. Driving factors of the variations in ISA among functional zones
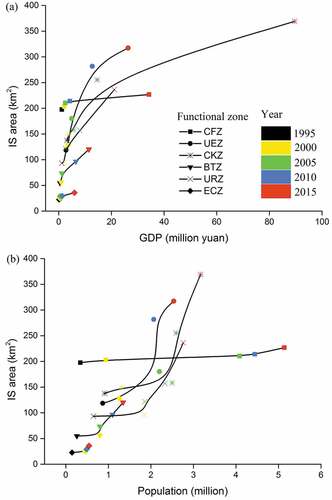
Usually, growths of population and Gross Domestic Product (GDP) are regarded as the key drivers for urban expansion associated with an increase of ISA (Cao et al. Citation2017; Kuang, Chi, and Lu et al. Citation2014). High coefficients of determination (R2) between ISA and population and GDP for all functional zones indicate that the impervious surface area had a strong positive relationship with the values of population and GDP at different periods among urban functional zones (). This implies that growths of population and GDP are largely stimulated the increased ISA of functional zones.
Table 5. Relationships between impervious surface area and socio-economic factors (note: please refer to for an explanation of the abbreviations).
shows the scatter plots between ISA and socio-economic factors. As shown in , influences of GDP and population on ISA growths varied considerably in different functional zones. It is clear from these results that influences of GDP and population on ISA growths are stronger in UEZ, CKZ, BTZ, and URZ than that in CFZ.
Figure 9. Scatter plots between impervious surface area and socio-economic factors: (a) GDP and (b) population (note: ISP refers to impervious surface percentage; please refer to for an explanation of the abbreviations).
Impervious surface distributions change significantly by functional zone.
Impervious surfaces distribution was more equal among the functional zones over time.
Population, economic conditions, and policies affect ISA growths of functional zones.
Influences of GDP and population on ISA growths vary considerably by functional zone.
In addition, different functional planning and policies among functional zones can significantly affect the growths of ISA. For examples, in 2005, Binhai coastal area of Tianjin was written in China’s “Eleventh Five-Year Plan” and became a national-level district with national key support for development and opening up. These policies significantly stimulated the growth of ISA in CKZ after 2005 (). China’s severe policy of farmland protection from 2005 to 2010 greatly inhibited the ISA growth in farmland conservation zones (). These results indicate that China’s government plays a key role in China’s urbanization process. In China, the government generally designs an urban planning frame in which the functional zone orientation and functions are precisely determined; then detailed landscape or land-use planning and management measures are implemented (Liu et al. Citation2005b).
5. Discussion
In the period from 1990–2015, Tianjin experienced unprecedented urbanization and industrialization. The impervious surface expansion of Tianjin has been spreading and changing significantly. Previous impervious surface monitoring studies have primarily focused on the cities’ overall level (e.g. Xiao, Ouyang, and Cai et al. Citation2007; Fan Citation2014). Combined with urban planning research, we provide the first clear picture of the large differences, spatial patterns, and driving mechanisms of the ISA growths among urban functional zones. Further, our work can provide a reference for urban planner in Tianjin.
The spatial patterns of urban impervious surfaces can significantly affect the urban ecosystem services and water/heat environment (Zhang, Balzter, and Zou et al. Citation2015). Yuan and Bauer (Citation2007) found that the rapid expansion of impervious surfaces would aggravate water pollution and is closely related to the urban heat island effect. The premise of healthy urban development is to promote the synergistic development of the economy and the protection of the environment. Thus, rational regulation of impervious surfaces is an effective means of promoting sustainable urban development. In addition, because urban functional zones perform varied urban functions and the influences of social-economic factors on the ISA growths varied considerably by functional zone (), the impervious surface regulation should be treated according to functional zone. Monitoring the extent and intensity of impervious surfaces and their driving mechanisms in urban functional zones is of great value for urban planning and management.
Our study has serval limitations. For example, more in-depth analyses would be required to perform different impervious surface regulations in the various urban functional zones and to characterize the uncertainties in satellite-derived impervious surface coverage.
6. Conclusions
In this paper, which considered urban functional planning, we analyzed the spatiotemporal variations in impervious surfaces in Tianjin from 1990 to 2015. The spatial patterns of impervious surfaces in various functional zones were quantified using methods of quantitative geography. Further, we revealed the driving mechanisms of ISA growths to functional zones. Our results can provide a decision-making reference for urban planning management. Our main conclusions are as follows.
A rapid increase in the spatial distribution of impervious surfaces has occurred in Tianjin from 1990 to 2015. Large differences in impervious surface growth were observed among the various urban functional zones in Tianjin, which means that different functional areas play different roles in the growth of impervious surfaces. In addition, influences of GDP and population on the ISA growths vary considerably by functional zone. Therefore, impervious surface regulation should be treated according to the functional zone. Our finding provides a foundation for the rational regulation of impervious surfaces and new insight for the quantitative relationships between impervious surfaces and social-economic factors among functional zones. In the future, additional comparative analyses of the variations, spatial patterns, and driving factors of impervious surfaces should be performed for the various urban functional zones.
Acknowledgements
The authors would like to thank the editor and the anonymous reviewers for their valuable comments, which helped improve this manuscript significantly.
Disclosure statement
No potential conflict of interest was reported by the authors.
Additional information
Funding
Related Research Data
References
- Alberti, M. 2009. Integrating Humans and Ecological Processes in Urban Ecosystems, 61–65. New York: Springer Science + Business Media.
- Breiman, L. 2001. “Random Forests.” Machine Learning 45 (1): 5–32. doi:10.1023/A:1010933404324.
- Cao, S., D. Hu, W. Zhao, Y. Mo, and S. Chen. 2017. “Monitoring Spatial Patterns and Changes of Ecology, Production, and Living Land in Chinese Urban Agglomerations: 35 Years after Reform and Opening Up, Where, How and Why?” Sustainability 9: 766. doi:10.3390/su9050766.
- Cao, S., D. Hu, Z. Hu, W. Zhao, S. Chen, and C. Yu. 2018a. “Comparison of Spatial Structures of Urban Agglomerations between the Beijing-Tianjin-Hebei and Boswash Based on the Subpixel-Level Impervious Surface Coverage Product.” Journal of Geographical Sciences 28 (3): 306–322. doi:10.1007/s11442-018-1474-0.
- Cao S., Hu D., Hu Z., Zhao W., Mo Y., and Qiao K. 2018b. “An Integrated Soft and Hard Classification Approach for Evaluating Urban Expansion from Multisource Remote Sensing Data: A Case Study of the Beijing–Tianjin–Tangshan Metropolitan Region, China.” International Journal of Remote Sensing 39 (11): 3556–3579.
- Chen, Y. G. 2009. “Reconstructing the Mathematical Process of Spatial Autocorrelation Based on Moran’s Statistics.” Geographical Research 27(1): 90–98. (in Chinese).
- Digitalglobe. 2017. “High-Resolution Multi-Spectral QuickBird Images.” Accessed 2017 May 15 https://www.digitalglobe.com/
- Elvidge, C. D., T. B T, S. P C, K. E. Baugh, A. T. Howard, C. Milesi, B. Bhaduri, and R. Nemani. 2007. “Global Distribution and Density of Constructed Impervious Surface.” Sensor 7: 1962–1979. doi:10.3390/s7091962.
- Fan, F. 2014. “Understanding Spatial-Temporal Urban Expansion Pattern (1990–2009) Using Impervious Surface Data and Landscape Indexes: A Case Study in Guangzhou (China).” Journal of Applied Remote Sensing 8 (7): 4480–4494. doi:10.1117/1.JRS.8.083609.
- Fang, C., B. Pang, and H. Liu. 2017. “Global City Size Hierarchy: Spatial Patterns, Regional Features, and Implications for China.” Habitat International 66: 149–162. doi:10.1016/j.habitatint.2017.06.002.
- Fang, C., and D. Yu. 2017. “Urban Agglomeration: An Evolving Concept of an Emerging Phenomenon.” Landscape and Urban Planning 162: 126–136. doi:10.1016/j.landurbplan.2017.02.014.
- Foley J A, DeFries R, Asner G P. 2005. “Global Consequences of Land Use”. Science 309: 388–400. doi:10.1126/science.1111104.
- Getis, A., and J. K. Ord. 1992. “The Analysis of Spatial Association by Use of Distance Statistics.” Geographical Analysis 24 (3): 189–206. doi:10.1111/j.1538-4632.1992.tb00261.x.
- Grimm, N. B., S. H. Faeth, N. E. Golubiewski, C. L. Redman, J. Wu, X. Bai, and J. M. Briggs. 2008. “Global Change and the Ecology of Cities.” Science 319 (5864): 756–760. doi:10.1126/science.1150195.
- Guo, W., G. Li, W. Ni, Y. Zhang, and D. Lu. 2018. “Exploring Improvement of Impervious Surface Estimation at National Scale through Integration of Nighttime Light and Proba-V Data.” GIScience and Remote Sensing 55: 699–717. doi:10.1080/15481603.2018.1436425.
- Hu, D., S. Chen, K. Qiao, and S. Cao. 2017. “Integrating Cart Algorithm and Multi-Source Remote Sensing Data to Estimate Sub-Pixel Impervious Surface Coverage: Acase Study from Beijing Municipality, China.” Chinese Geographical Science 27 (4): 614–625. doi:10.1007/s11769-017-0882-x.
- Huang, C., and J. R. G. Townshend. 2003. “A Stepwise Regression Tree for Nonlinear Approximation: Application to Estimating Subpixel Land cover[J].” International Journal of Remote Sensing 24 (1): 75–90. doi:10.1080/01431160305001.
- Huang, F. 2004. Future-Oriented Urban Planning and Design: Theoretical and Case Studies of Sustainable Urban Planning and Design. Beijing: China Building Industry Press.
- Im, J., Z. Lu, J. Rhee, and L. J. Quackenbush. 2012. “Impervious Surface Quantification Using a Synthesis of Artificial Immune Networks and Decision/Regression Trees from Multi-Sensor Data.” Remote Sensing of Environment 117 (1): 102–113. doi:10.1016/j.rse.2011.06.024.
- Kuang W., Chen L., Liu J. 2016. “Remote Sensing-Based Artificial Surface Cover Classification in Asia and Spatial Pattern Analysis.” Science China: Earth Science 59 (9): 1720–1737. doi:10.1007/s11430-016-5295-7.
- Kuang W., Chi W., Lu D., and Dou Y. 2014. “A Comparative Analysis of Megacity Expansions in China and the U.S.: Patterns, Rates and Driving Forces”. Landscape and Urban Planning 132: 121–135. doi:10.1016/j.landurbplan.2014.08.015.
- Le C., Giraudoux J., Eardley A. 1973. The Athens Charter. New York, NY: Grossman Publishers.
- Liu, J., J. Zhan, and X. Deng. 2005a. “Spatio-Temporal Patterns and Driving Forces of Urban Land Expansion in China during the Economic Reform Era.” A Journal of the Human Environment 34 (6): 450–455. doi:10.1579/0044-7447-34.6.450.
- Liu, Y., Z. Niu, and C. Wang. 2005b. “Research and Application of the Decision Tree Classification Using MODIS Data.” Journal of Remote Sensing 9 (4): 405–411.
- Liu Z., He C., Zhang Q., Huang Q. Yang Y. 2012. “Extracting the Dynamics of Urban Expansion in China Using Dmsp-Ols Nighttime Light Data from 1992 to 2008.” Landscape and Urban Planning 106 (1): 62–72. doi:10.1016/j.landurbplan.2012.02.013.
- Lu D., Batistella M., Moran E. and Mausel P. 2014. “Application of Spectral Mixture Analysis to Amazonian Land-Use and Land-Cover Classification.” International Journal of Remote Sensing 25 (23): 5345–5358. doi:10.1080/01431160412331269733.
- Masser, I. 1982. “Urban Planning Methods: Research and Policy Analysis.” Urban Studies 19 (4): 421. doi:10.1080/00420988220080741.
- NOAA, 2017a. “DMSP-OLS Nighttime Lights Time Series.” Accessed 2017 May 15. https://ngdc.noaa.gov/eog/dmsp/downloadV4composites.html
- NOAA, 2017b. “VIIRS Day/Night Band Nighttime Lights.” Accessed 2017 May 15. https://ngdc.noaa.gov/eog/viirs/download_dnb_composites.html
- Peng J., Xie P., Liu Y., and Ma J. 2016. “Urban Thermal Environment Dynamics and Associated Landscape Pattern Factors: A Case Study in the Beijing Metropolitan Region”. Remote Sensing of Environment 173: 145–155. doi:10.1016/j.rse.2015.11.027.
- Pickett S., Cadenasso M., Grove J., Boone C., Groffman P., Irwin E., Kaushal S. et al. 2011. “Urban Ecological Systems: Scientific Foundations and a Decade of Progress.” Journal of Environmental Management 92 (3): 331–362. doi:10.1016/j.jenvman.2010.08.022.
- Piyoosh, A., and S. Ghosh. 2017. “Semi-Automatic Mapping of Anthropogenic Impervious Surfaces in an Urban/Suburban Area Using Landsat 8 Satellite Data.” GIScience and Remote Sensing 54: 471–494. doi:10.1080/15481603.2017.1282414.
- REDCP, 2018. “Gridded Population and Gross Domestic Product (GDP) Data.” Accessed 2018 December 15. http://www.resdc.cn/
- Sáchez-Rodrfguez, R., K. C. Seto, and D. Simon 2005. “Urbanization and Global Environment Change.” IHDP Report No. 15. Science Plan.
- Torbick, N., and M. Corbiere. 2015. “Mapping Urban Sprawl and Impervious Surfaces in the Northeast United States for the Past Four Decades.” GIScience and Remote Sensing 52: 746–764. doi:10.1080/15481603.2015.1076561.
- USGS, 2017. “Landsat TM/OLI Images.” Accessed 2017 May 15. https://earthexplorer.usgs.gov/
- Wang J, Wu Z, Wu C. 2017. “Improving Impervious Surface Estimation: An Integrated Method of Classification and Regression Trees (CART) and Linear Spectral Mixture Analysis (LSMA) Based on Error Analysis.” Giscience & Remote Sensing 55 (4): 1–21.
- Weng, Q. 2012. “Remote Sensing of Impervious Surfaces in the Urban Areas: Requirements, Methods, and Trends.” Remote Sensing of Environment 117 (2): 34–49. doi:10.1016/j.rse.2011.02.030.
- Wigginton, N. S., J. Fahrenkamp-Uppenbrink, B. Wible, and D. Malakoff. 2016. “Cities are the Future.” Science 352: 904–905. doi:10.1126/science.352.6288.904.
- Wilson, J. S., M. Clay, E. Martin, D. Stuckey, and K. Vedder-Risch. 2003. “Evaluating Environmental Influences of Zoning in Urban Ecosystems with Remote Sensing.” Remote Sensing of Environment 86 (3): 303–321. doi:10.1016/S0034-4257(03)00084-1.
- Xian, G., C. Homer, and J. Fry. 2009. “Updating the 2001 National Land Cover Database Land Cover Classification to 2006 by Using Landsat Imagery Change Detection Methods.” Remote Sensing of Environment 113 (6): 1133–1147. doi:10.1016/j.rse.2009.02.004.
- Xiao R., Ouyang Z., Cai N., and Li W. 2007. “Urban Landscape Pattern Study Based on Sub-Pixel Estimation of Impervious Surface.” Acta Ecologica Sinica 27:3189–3197. in Chinese.
- Yang L., Huang C., Homer C. Wylie B. K., Coan M. J. 2003. “An Approach for Mapping Large-Area Impervious Surfaces: Synergistic Use of Landsat-7 ETM+ and High Spatial Resolution Imagery.” Canadian Journal of Remote Sensing 29 (2): 230–240. doi:10.5589/m02-098.
- Yuan, F., and M. E. Bauer. 2007. “Comparison of Impervious Surface Area and Normalized Difference Vegetation Index as Indicators of Surface Urban Heat Island Effects in Landsat Imagery.” Remote Sensing of Environment 106 (3): 375–386. doi:10.1016/j.rse.2006.09.003.
- Zhang, X., and S. Du. 2015. “A Linear Dirichlet Mixture Model for Decomposing Scenes: Application to Analyzing Urban Functional Zonings.” Remote Sensing of Environment 169: 37–49. doi:10.1016/j.rse.2015.07.017.
- Zhang Y, Balzter H, Zou C. 2015. “Characterizing Bi-Temporal Patterns of Land Surface Temperature Using Landscape Metrics Based on Sub-Pixel Classifications from Landsat TM/ETM+ [J]”. International Journal of Applied Earth Observation and Geoinformation 42: 87–96. doi:10.1016/j.jag.2015.06.007.