
 ?Mathematical formulae have been encoded as MathML and are displayed in this HTML version using MathJax in order to improve their display. Uncheck the box to turn MathJax off. This feature requires Javascript. Click on a formula to zoom.
Abstract
Yellow rust (Puccinia striiformis f. sp. Tritici) and aphid (Sitobion avenae F.) are two major biotic factors threatening winter wheat growth in the main growing region in northern China. The goal of this study was to develop a remote sensing based approach to reliably detect and discriminate yellow rust and aphid infection. The study was conducted in the North China Plain in 2017 based on RapidEye satellite images using three supervised classification algorithms, the maximum-likelihood classifier, the support vector machine, and the random forest. An overall accuracy of above 60% for aphid and above 70% for yellow rust can be achieved using a single image (May 7 or 10, 2017) with any of the three algorithms. With multi-temporal images, the overall accuracies both increased for aphid and yellow rust (above 70% and above 78%). Using the image acquired on 23 May 2017, joint infections by yellow rust and aphid can be detected with satisfaction (>73% overall accuracy), although confusion exists between the two infections. This study demonstrates that winter wheat disease/pest infection can be detected with remote sensing technologies, providing decision support to farmers, insurance companies, and government organizations in the agriculture sector.
1. Introduction
Crop diseases and pests are important threats that can cause severe grain yield loss and quality degradation (Strange and Scott Citation2005; Savary et al. Citation2012; Chakraborty and Newton Citation2011). With climate change, the occurrence of certain plant disease/pest is likely to increase, leading to more serious food security issues (Strange and Scott Citation2005; Chakraborty and Newton Citation2011). During the past several decades, an increasing trend in the frequency, duration, extent, and severity of disease/pest disturbances has been witnessed in some regions in the world (Chakraborty and Newton Citation2011). Given the elevated concerns of environmental impact caused by pesticide and fungicide usage, timely and spatially explicit information on field crop vitality is needed to determine the location and intensity of the affected areas in time for implementing mitigation measures. Traditionally, scouting of crop disease/pest relies mainly on field visits and visual assessment, which is time-consuming, labor-intensive, and costly. Traditional methods cannot meet the requirements for precision disease/pest detection and management over large areas. Scouting by walking the fields can also increase the chance of cross-contamination. Thus, it is important to develop a practical method for crop disease and pest detection over large areas.
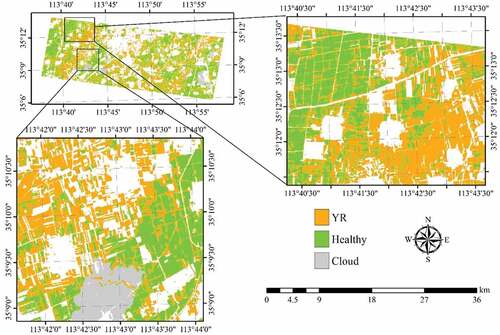
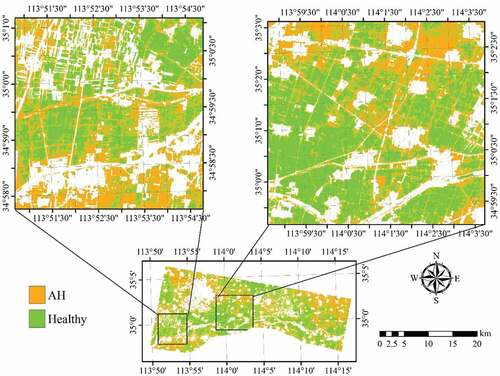
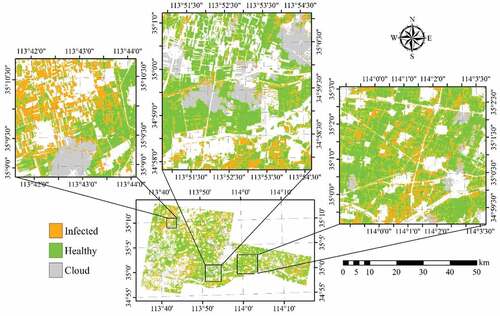
Figure 8. Spatial distribution of YR infected winter wheat derived by SVM with the RapidEye images acquired on May 10 and 23, 2017. Areas in white represent non-wheat fields.
Remote sensing has long been recognized as an effective technology for non-destructive and rapid field survey across large areas (Martinelli et al. Citation2015). With increased spatial/temporal/spectral resolution and reduced cost of the satellite/airborne imagery, applications of remote sensing technologies have been broadened to address a wide range of practical needs in agriculture, including detecting crop disease/pest and monitoring crop vitality. Numerous studies have assessed the spectral characteristics of crop disease/pest at both leaf (Luo et al. Citation2013; Mahlein et al. Citation2013) and canopy scales (Calderón et al. Citation2013; Feng et al. Citation2017). For instance, the reflectance at 490, 510, 516, 540, 780, and 1300 nm was reported to be sensitive to wheat leaf infected by powdery mildew at an early stage (Graeff, Link, and Claupein Citation2006). De Castro et al. (Citation2015) found that significant differences existed between healthy and infected plants at canopy scale in the red-edge (RE) (740 and 750 nm) and the near-infrared (NIR) (760, 940, and 950 nm) regions.
Hyper-spectral data obtained using portable field spectrometers (Mahlein et al. Citation2013; Huang et al. Citation2014) or airborne hyper-spectral sensors (Huang et al. Citation2007; Mirik et al. Citation2014) are widely used to monitor crop disease/pest. Although hyper-spectral technology can be accurate in detecting crop disease/pest, it is challenging to apply to operational applications over large areas due to high cost and low data availability (Liu, Kelly, and Peng Citation2006; De Castro et al. Citation2015). Multi-spectral satellite imaging sensors, especially the new generation sensors with short revisiting cycles (e.g., Sentinel-2 and RapidEye), are more favorable for operational applications at different scales (Sonobe et al. Citation2017; Forkuor et al. Citation2018; Latifi et al. Citation2018). Particularly, since RE reflectance is more sensitive to changes in chlorophyll content and vegetation health (Smith, Steven, and Colls Citation2004; Shafri and Hamdan Citation2009; Dong et al. Citation2019), sensors with RE bands have great potential in crop disease/pest detection. For instance, De Castro et al. (Citation2015) used the RE band for early detection of laurel wilt disease in avocado, and Huang et al. (Citation2014) explored the potentials of RE for identifying winter wheat diseases. While these studies have confirmed the capability of RE information of hyper-spectral on crop disease/pest identification, the abilities of broad-band RE information has not been evaluated sufficiently. In this study, the RapidEye data with a RE band (690–730 nm) are selected to assess its performance for crop disease/pest detection. Five identically configured satellites form the constellation, so that high spatial resolution observations can be achieved at a short revisit cycle (Tyc et al. Citation2005), therefore, it is important to evaluate its usefulness in detecting crop disease/pest at the field level. Feasibility study on discriminating plant disease/pest has been conducted using RapidEye data simulated from hyper-spectral data and spectral response functions (Yuan et al. Citation2017b; Dhau et al. Citation2018; Martins, Galo, and Vieira Citation2017), and so does studies based on real RapidEye image (Abdel-Rahman et al. Citation2017; Marx and Kleinschmit Citation2017).
Crop disease/pest can affect the biophysical and biochemical status of plants, such as pigment content, leaf/canopy structure, nutrient levels, and water content, which in turn can change the optical properties of the plants. Therefore, multi-spectral remote sensing data have the potential to discriminate plants infected by disease/pest from healthy plants. Consequently, several recent studies have used multispectral data with 3–8 broad bands in the visible/near-infrared (VNIR) spectral range to map crop disease/pest infection over large areas (Mirik et al. Citation2013; Zhang et al. Citation2014; Zheng et al. Citation2018). The methods in these studies can be grouped into two categories: threshold-based and classification based.
The threshold-based methods have shown great ability for crop disease/pest detection. For instance, a new multispectral index, the Red-Edge Disease Stress Index (REDSI), was proposed to detect yellow rust infection at different severity levels using Sentinel-2 multispectral image based on the optimal threshold method (Zheng et al. Citation2018). However, since the threshold is site, crop and disease/pest specific, the threshold-based method is not transferable to other areas.
In comparison, classification algorithm was relatively more robust in operational applications, as they can use multiple features more effectively. For instance, based on Fisher’s linear discriminant analysis model, the spatial variability of crop diseases and pests was more accurately detected using a combination of crop vegetation indices and environmental characteristics than using vegetation indices alone (Yuan et al. Citation2017a). The performances of three supervised classification algorithms were compared for powdery mildew detection and found that multi-spectral imagery with fine spatial resolution was useful for disease detection in winter wheat using proper classification algorithms and field observations (Yuan et al. Citation2014). Using HJ-CCD (CCD sensor on the Huanjing satellite) data, four classification methods, including mahalanobis distance, maximum likelihood classifier, partial least square regression, and mixture tuned matched filtering, were tested and their performances were evaluated in disease mapping (Zhang et al. Citation2014). The use of Landsat-5 TM imagery was explored for monitoring the progression of Wheat Streak Mosaic (WSM) over time and space with a sub-pixel classifier (Mirik et al. Citation2013). In addition to spectral features, temporal features are also important factors in monitoring plant disease/pest damage. It has been found that plant disease/pest can be detected better using time-series images (Liu, Kelly, and Peng Citation2006; Zhang et al. Citation2014); thus, the use of multi-temporal images was also evaluated in this study.
Three classification algorithms, the Maximum-Likelihood Classifier (MLC), the Support Vector Machine (SVM), and the Random Forest (RF), with proven capability to extract information from remote sensing data (Breiman Citation2001; Yuan et al. Citation2014; Martinelli et al. Citation2015), are tested in this study to detect and discriminate crop disease/pest using satellite multi-spectral data. The MLC is one of the most popular conventional classification algorithms for remote sensing data. The SVM and RF are both nonparametric classification algorithms that do not require a specific distribution for the input data (Breiman Citation2001; Deschamps et al. Citation2012). The SVM is a kernel-based supervised classifier built on statistical learning theory (Burges Citation1998; Cristianini and Shawe-Taylor Citation2000) and has been found to be advantageous for high-dimensional datasets (Zhang, Guo, and Lu Citation2017). The RF is an ensemble learning method (Ho Citation1995; Breiman Citation2001), which is considered robust and effective for differentiating different vegetation conditions compared with most other supervised parametric and machine learning algorithms (Breiman Citation2001; Liang et al. Citation2017) because it combines the strengths and minimizes the weaknesses of each individual classifiers through grouping (Ghimire, Rogan, and Miller Citation2010). These three classification algorithms were also used to identify diseases/pests for different crops (Chemura, Mutanga, and Dube Citation2017; Liu, Kelly, and Peng Citation2006; Yuan et al. Citation2014).
Winter wheat (Triticumaestivum L.) is one of the main cereal crops in Northern China. Many kinds of diseases and pests could potentially threaten the crop growth and induce yield loss and grain quality degradation. Yellow rust (YR) and aphid (AH) are two most common disease/pest affecting winter wheat growth in this region, with a very rapid rate of spreading under favorable weather and environmental conditions. YR can form in patches easily through wind dispersion of pathogen, especially at the early stages of an epidemic. AH feeds on plants and injects saliva that can destroy the foliar structure of the crops (Luo et al. Citation2013, Citation2014). Due to different treatment requirements for YR and AH, it is desirable to distinguish the two types of infections.
The specific objectives of this study are (1) to investigate the feasibility of using multi-spectral satellite imagery to map YR and AH infection, (2) to compare the performance for the three classification algorithms, and (3) to find an effective and practical classification method for crop disease/pest mapping.
2. Materials and methods
2.1. Data
2.1.1. Study area and field survey
The study area covers three counties, Yuanyang (35°3ʹN, 113°58ʹE), Xinxiang (35°12ʹN, 113°48ʹE), and Huojia (35°16ʹN, 113°39ʹE), in Henan Province, China. The area belongs to the North China Plain, a region dominated by winter wheat crop (). Winter wheat is typically sown in early October in previous year and harvested before mid-June the following year.
Figure 1. Study area and sample distribution.
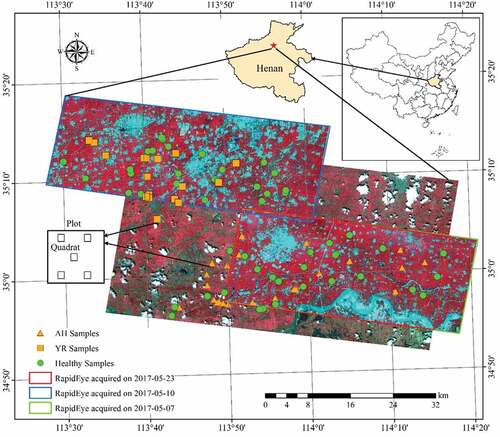
During the summer of 2017, there was an eruption of AH and YR in winter wheat in the study area, causing yield loss and even plant death in some areas. Field data were collected on May 16 and 21, 2017. A total of 95 plots (greater than 1 ha each) were selected, of which 52 were healthy, 23 were infected by AH and 20 by YR. The corner coordinates of each plot were recorded using a differential GPS (Global Positioning System). In each plot, five 1 m × 1 m quadrats were deployed (). Within each quadrat, 20 plants were randomly selected to inspect the infection status. A plot was considered infected if more than 80% of the collected plants within the plot showed signs of apparent infection.
2.1.2. RapidEye imagery and feature selection
Five RapidEye images () during the winter wheat growing season were acquired. Images acquired on December 4 and 6, 2016 were used to extract winter wheat area distribution, and images acquired on 7 May 2010, and 23, 2017 (, ) were used to identify YR and AH infection. For all the images, pre-processing, including radiometric calibration and atmospheric correction, was conducted using PCI Geomatica 2014 (PCI Geomatics, Richmond Hill, Ontario, Canada) to derive surface reflectance products. For atmospheric correction, the mid-latitude summer or mid-latitude winter atmospheric model and the rural aerosol model were selected. Meteorological visibility used for atmospheric correction was obtained from the local meteorological stations (station ID: 57083, 53986). Finally, geometric correction was conducted with ground control points using ERDAS Imagine 2010 (ERDAS Inc., Norcross, GA) with subpixel accuracy.
Table 1. Specifications of the RapidEye Multi-spectral imager bands.
Table 2. Specifications of RapidEye data acquisitions and corresponding phenological stage of winter wheat.
Based on literature studies, 13 Vegetation Indices (VIs) were initially selected for this study (). These VIs provide enhanced measurements of vegetation attributes such as greenness, cover fraction, vitality and chlorophyll content. Information may be redundant among these indices due to either their functional similarity or correlations among the reflectance in the five spectral bands. A cross-correlation analysis was conducted prior to image classification to screen the VIs according to the coefficient of correlation (R). If R between a pair of VIs was greater than +0.9 or less than −0.9, one of the VIs was dropped from the dataset in subsequent analysis.
Table 3. List of selected vegetation indices.
2.2. Winter wheat distribution mapping
Winter wheat fields were identified from the RapidEye images acquired in December 2016 for subsequent analysis using the threshold approach developed by Zhang et al. (Citation2018). Because winter wheat was the only crop with vigorous green vegetation development before winter dormancy in northern China, it can be accurately identified with large values of green vegetation indices during that time. Histogram of NDVI of the RapidEye images showed a clear double peak distribution separated between winter wheat and other land types at around 0.4. A pixel is identified as winter wheat field if its NDVI > 0.4. Although minor commission and omission errors existed, all the sampled winter wheat plots were successfully identified.
2.3. Classification algorithms
Classification was conducted with three classification algorithms (MLC, SVM, and RF) at pixel level using features derived from a single-date image as well as that derived from multi-date images. The single-date feature set consisted of five original RapidEye band reflectance and the selected VIs. The multi-temporal feature set consisted of 10 RapidEye band reflectance from either May 7 or May 10 image and the May 23 image, and the ratios of the selected VIs between the two dates. As the image acquired on May 7 covered most of the AH samples and the image acquired on May 10 covered mainly the YR samples, they were used to detect AH and YR infected winter wheat, respectively (). The image acquired on May 23 covered most samples; thus, it was used for discriminating AH, YR, and healthy winter wheat. Similarly, the combination of May 7 and May 23 images was used to detect AH, and the combination of May 10 and May 23 images was for YR detection.
For the MLC, the input features are assumed to follow a normal distribution, and the distribution parameters are determined from the training samples which are then used for subsequent classification (Duda and Hart Citation1973). The MLC classifier in Environment for Visualizing Images software (ENVI; Exelis Visual Information Solutions, Boulder, Colorado) was used, and no probability threshold was set in the classification; thus, each pixel is assigned to the class with the highest likelihood.
The SVM is trained to find an optimal classification hyperplane to minimize the upper bound of the generalization error and separate the classes in the feature space, while its position in the feature space is unambiguously defined by the principle of maximum margin, thus facilitating the learning of models with optimal generalization performance. In this study, the SVM classifier in ENVI was used. The kernel type was set to radial basis function, and the gamma parameter was set to 0.167.
In this study, the RF classifier in EnMAP-Box (van der Linden et al. Citation2015) was used to perform the image classification. The RF constructs a set of decision trees through training and attributes final class as the mode of the classes of the individual trees. Following conventional practices, the number of trees was set to 100, and the square root of all features was used to determine the number of randomly selected features to compute the best split point. Gini coefficient was used to determine the impurity of a node. The default value of the stop criterion (the minimum number of samples) was set to 1, and the minimum impurity was set to 0 so that the decision trees would be fully grown.
2.4. Assessment of YR and AH mapping accuracy
Due to limited number of samples in this study (), a cross-validation approach, which had been proven to be effective for model assessment with limited sample size (Khan, Van Aelst, and Zamar Citation2010), was applied. Samples were randomly divided into 10 groups and a 10-fold cross-validation was carried out, by iteratively training the classification algorithms using 9 groups and testing it with the remaining group. To ensure that each group of samples contains different types (AH/YR, Healthy), samples of each type were randomly divided independently and then merged. The classification was conducted on a pixel basis, but the assessment was carried out on plot level, therefore, a plot was considered to be a certain class only when more than 80% of the pixels in that plot were classified as the class.
Table 4. Summary for the use of sampling plots.
3. Results
3.1. Feature selection and evaluation
To reduce data redundancy among VIs and enhance classification performance, feature selection was conducted through cross-correlation analysis among the 13 VIs, and the correlation coefficients are given in . From this analysis, seven VIs (NDVI, TVI, VIGreen, SIPI, SCCCI, YRI, and AI2) were retained for subsequent analysis. NDVI was selected because it is the most commonly used vegetation index that can be derived from almost all space-borne optical data. Using a threshold of R = ±0.9, EVI, GNDVI, GCI, NDVIRE, and CIRE were removed from further analysis. As stated earlier, all of the five reflectance bands were included in the classification.
Table 5. Correlation coefficient between different vegetation indices.
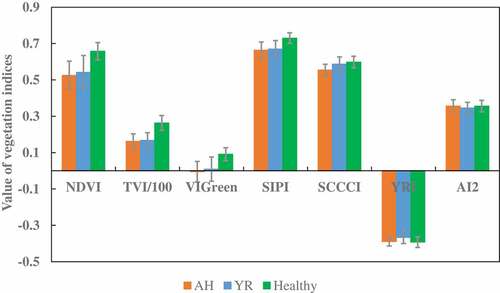
and illustrate the selected features derived from the RapidEye image acquired on May 23 for the three target classes, AH, YR and healthy winter wheat. The differences in canopy reflectance between the healthy and the infected wheat samples were more obvious in the NIR and RE bands than in the visible bands. The indices, such as the NDVI, TVI, VIGreen, SIPI, and SCCCI, also showed significant differences between the healthy and the infected class. However, there was no apparent difference in YRI and AI2 among the three classes of samples, and the difference between the two infections was also not apparent.
Figure 2. Average canopy reflectance of the three classes of winter wheat samples derived from the 23 May 2017 RapidEye image. Vertical error bars represent the standard deviation.
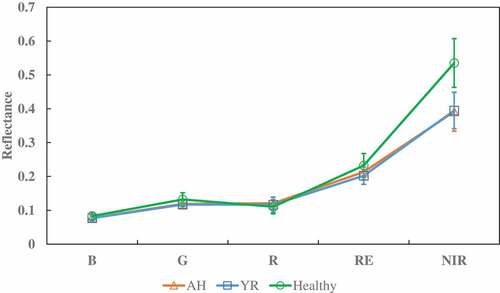
Figure 3. Average vegetation indices of the three classes of winter wheat samples derived from the May 23, 2017 RapidEye image; vertical error bars represent the standard deviation.
To evaluate the contribution of each variable for crop disease/pest identification, the importance of the variables derived using RF is shown in . The three most effective variables are VIGreen, SCCCI, and YRI/AI2. The YRI and AI2, developed for infection detection using hyper-spectral data (Mahlein et al. Citation2013; Shi et al. Citation2017), show the desired efficiency. The ability of RE band to detect crop disease/pest is also demonstrated, since SCCI, YRI, and AI2 are all RE-based vegetation indices. The RE band is also the best variable among the five original bands.
Figure 4. Importance of variables for disease/pest identification, computed using RF. The left panel is for YR detection using RapidEye image acquired on 10 May 2017, and the right panel is for AH detection using RapidEye image acquired on 7 May 2017.
3.2. Discrimination between healthy and YR infected winter wheat
To discriminate YR infected winter wheat using the image acquired on 10 May 2017, all selected features excepting AI2 (designed for AH detection) were used for classification, with 45 training samples (26 healthy plots and 19 YR infected plots, ). As shown in , the overall accuracy (OA) was 72.0% for the MLC, and 76.0% for the SVM and RF. The producer’s accuracy (PA) was 83.3%, 100%, and 96.7% for the healthy crop class using the three algorithms MLC, SVM, and RF, respectively. For the YR class, the highest PA was 60.0% using MLC, 45.0% using SVM and 50.0% using RF. The omission error could be due to the fact that the image used for classification was acquired 11 days (May 10) before the date of field data collection (May 21). YR infection at the time of image acquisition might be less severe and extensive compared with the time of field sampling; thus, the symptoms of the infection were weaker and could not be effectively detected by the RapidEye image. Continuous wind (7 days), frequent cloud (8 days), and precipitation happened between May 10 and May 23. These factors are favorable weather conditions for the development of YR infection (Te Beest et al. Citation2008). Visual comparison of the classification results using the three algorithms showed similar spatial patterns, and the result using the SVM algorithm is presented in as an example.
Figure 5. Boxplots of the overall accuracy (OA) of the three algorithms for detection of YR infection using RapidEye image acquired on 10 May 2017, using the10-fold cross-validation. The thick horizontal lines represent the median, the top and bottom of the box represent the 25th and 75th percentiles, and the whiskers are 1.5 times of the box height towards upper and lower from the median. Dark circles represent the average of OA.
Figure 6. Distribution of YR infected winter wheat area derived from SVM using the RapidEye imagery acquired on 10 May 2017. Areas in white represent non-wheat fields.
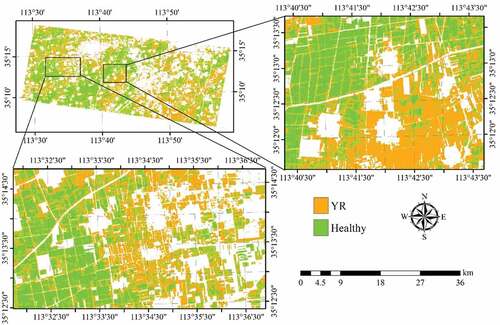
The performances of the multi-temporal imageries (May 10 and 23, 2017) were also evaluated using a 16-band data cube, including five original bands per RapidEye image and the ratios of the six selected VIs between the two dates, with 36 training samples (21 healthy plots and 15 YR infected plots, ). As shown in , compared with single image classification, both OAs and PAs for YR were improved, with 78.2%, 80.2% and 78.0% for OA and 80.0%, 60.0%, 60.0% for PA for the three algorithms, respectively. However, PAs for healthy crop decreased slightly (78.3%, 96.7%, 93.3%). The result obtained using the SVM is shown in .
Figure 7. Boxplots of the overall accuracy (OA) of the three algorithms for detection of YR infection using RapidEye image acquired on May 10 and 23, 2017, using the10-fold cross-validation. The thick horizontal lines represent the median, the top and bottom of the box represent the 25th and 75th percentiles, and the whiskers are 1.5 times of the box height towards upper and lower from the median. Dark circles represent the average of OA.
3.3. Discrimination of healthy and AH infected winter wheat
Similar to the classification of YR and healthy winter wheat, the AH infected and healthy winter wheat were classified using 11 features (excluding YRI) derived from the image acquired on 7 May 2017, using 32 samples (19 healthy plots and 13 AH infected plots, ). As shown in , the OAs were all below 70% (62.5% for MLC, 69.2% for SVM, and 65.0% for RF). The PA for the health crop was 75.0% using all three algorithms, and that for the AH class was 60.0% using SVM. PAs for the AH class were not so satisfactory using MLC and RF (45.0%). The result obtained using the SVM is shown in .
Figure 9. Boxplots of the overall accuracy (OA) of the three algorithms for detection of AH infection using RapidEye image acquired on 7 May 2017, using the10-fold cross-validation. The thick horizontal lines represent the median, the top and bottom of the box represent the 25th and 75th percentiles, and the whiskers are 1.5 times of the box height towards upper and lower from the median. Dark circles represent the average of OA. Open circles are outliers.
Figure 10. Spatial distribution of AH infected winter wheat derived by SVM with RapidEye imagery acquired on 7 May 2017. Areas in white represent non-wheat fields.
The classification performance using the two images acquired on May 7 and 23, 2017 was also evaluated using 16 features, including 10 original RapidEye band reflectance and the ratios of the six selected VIs with the same number of samples (). As shown in , compared with the results from single-date image classification, OAs for all three algorithms increased apparently (72.5%, 78.3%, and 75.0%). The PAs for both healthy crop and AH classes also improved. The result obtained using the SVM is shown in .
Figure 11. Boxplots of the overall accuracy (OA) of the three algorithms for detection of AH infection using RapidEye image acquired on May 7 and 23, 2017, using the10-fold cross-validation. The thick horizontal lines represent the median, the top and bottom of the box represent the 25th and 75th percentiles, and the whiskers are 1.5 times of the box height towards upper and lower from the median. Dark circles represent the average of OA.
Figure 12. Distribution of AH infected winter wheat derived by SVM with RapidEye imageries acquired on May 7 and 23, 2017. Areas in white represent non-wheat fields.
3.4. Discrimination of healthy, YR, and AH infected winter wheat
To discriminate the three classes (healthy, YR, and AH infected) of winter wheat using a single image acquired on 23 May 2017, all 12 selected features (five band reflectance and seven VIs) were used in the classification using 86 training samples (47 healthy plots, 21 AH infected plots, and 18 YR infected plots, ). As shown in , the highest OA was achieved using the SVM (64.3%), followed by RF (60.1%) and MLC (59.5%). The lowest PA for healthy winter wheat was 80.0% using MLC. The PA of the AH class was 61.7% using SVM, and the accuracies were not satisfactory using the other two algorithms (<50%). YR cannot be discriminated using any of the classification algorithms, as most of the samples were mistakenly classified as AH. When the two infected classes were merged into one class (), the OAs increased to higher than 70% using all three algorithms (). This suggests that it is feasible to detect the infected crops from healthy crop using broad-band multi-spectrum satellite data.
Figure 13. Boxplots of the overall accuracy (OA) of the three algorithms for detection of AH and YR infection using RapidEye image acquired on May 7 23, 2017, using the10-fold cross-validation. (a) for “AH vs. YR vs. Healthy,” (b) for “Infected vs. Healthy.” The thick horizontal lines represent the median, the top and bottom of the box represent the 25th and 75th percentiles, and the whiskers are 1.5 times of the box height towards upper and lower from the median. Dark circles represent the average of OA. Open circles are outliers.
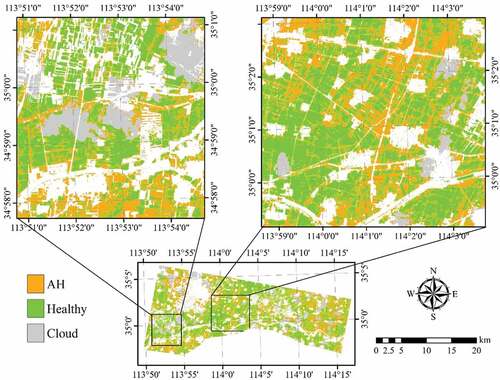
Figure 14. Distribution of Infected winter wheat derived by SVM with RapidEye image acquired on 23 May 2017. Areas in white represent non-wheat fields.
4. Discussion
As shown in , most of the original RapidEye band reflectance and the selected VIs exhibited obvious difference between the infected and healthy winter wheat. The reflectance of both RE and NIR in the infected winter wheat was generally lower than that in the healthy ones (), which is also reported by previous studies (Yuan et al. Citation2017b; Zheng et al. Citation2018). The reason is that all the infected plots were severely infected (the proportion threshold of infected population within sampling plots was set to 80%), and premature senescence of the infected winter wheat existed at the late development stage compared with the healthy ones. A decrease in leaf area, a change in leave angle distribution, and an increase in exposed soil would be expected in the infected wither wheat as illustrated by some of the VIs used in this study ().
Generally, multi-spectral remote sensing data offers the potential to differentiate the infested (YR/AH) areas from healthy areas and can be used to generate mapping products to facilitate crop loss assessment for insurance companies. For instance, the infection maps can guide the ground visits to determine the extent of the infection and subsequently deployment of mitigation measures. However, it is challenging to differentiate YR and AH infections. Similarity in spectral responses between the YR and AH infected areas in this study might be due to early termination of grain-filling for both diseases at the stage around the RapidEye data acquisition date (23 May 2017), characterized by leaf wilting, drooping, and senescence. This might have resulted in the infected (YR and AH) winter wheat showing a similar reduced vitality.
Literature studies have reported that multi-temporal imageries outperformed single imagery on disease/pest damage detection (Zhang et al. Citation2014, Citation2016). This was also demonstrated in this study. However, the difference of the classification accuracies might be affected by many factors, for instance, crop phenology or quality of data. In the AH/YR detection with multi-temporal imageries, the RapidEye images acquired on May 7/10 and May 23 corresponded to different phenological stages (). Although the AH/YR was already in a severe condition and can be considered as the main factor during the period, the spectral modifications induced by crop phenology would definitely affect the identification of crop disease/pest, which should be considered in a future study. Furthermore, the image acquired on May 23 was acquired under partially cloudy contamination, potentially impacting on classification accuracy.
In summary, using a combination of band reflectance and VIs, this study was able to identify the most appropriate and effective classifier for the detection of disease and pest infected winter wheat. Classification accuracy was considered satisfactory for differentiating YR/AH infected plots from health plots using the SVM or RF algorithms. Although RF had an inferior performance than SVM when AH and YR were treated separately, the difference of overall accuracy was not large. Moreover, RF showed better performance for identifying infected crop (). This could be attributed to that RF is an ensemble method which integrates multiple learning algorithms; hence, it is more effective and robust (Breiman Citation2001; Ghimire, Rogan, and Miller Citation2010; Liang et al. Citation2017). In consideration of computational cost, RF will be an attractive algorithm in practical applications, especially when facing large amount of data and limited computing power (Cracknell and Reading Citation2014).
To further improve the classification accuracies in future work, special attention should be given to the following areas: (1) the field samples should be representative and capture different levels of infection separately; (2) sample size should be sufficiently large. Insufficient number of samples can lead to unstable classifier performance and biased accuracy assessment; (3) investigate new remote sensing features for classification.
5. Conclusions
In this study, three classification algorithms were tested in mapping winter wheat with yellow rust/aphid infection using multi-spectral RapidEye images. Results show that multi-spectral RapidEye data can be used to map yellow rust and aphid infected winter wheat area with satisfaction, and the multi-temporal data can effectively improve the classification accuracy. Among the three classifiers, the performance of the SVM was the best with the highest overall accuracy. The proposed workflow for crop disease/pest detection and discrimination offers a practical approach to generating disease/pest extend maps that can be used to guide targeted field visit for subsequent implementation of mitigation measures and crop insurance payoff assessment. In anticipation of more high spatial resolution and high spectral resolution satellite and UAV data become available, the performance of crop disease/pest identification based on big data and machine learning can be further improved.
Acknowledgments
Dr. Zhiqiang Cheng for the help of data pre-processing and the reviewers for their helpful comments and suggestions.
Disclosure statement
No potential conflict of interest was reported by the authors.
Additional information
Funding
Related Research Data
References
- Abdel-Rahman, E. M., T. Landmann, R. Kyalo, G. Ong’amo, S. Mwalusepo, S. Sulieman, and B. Le Ru. 2017. “Predicting Stem Borer Density in Maize Using RapidEye Data and Generalized Linear Models.” International Journal of Applied Earth Observation and Geoinformation 57: 61–74. doi:10.1016/j.jag.2016.12.008.
- Barnes, E. M., T. R. Clarke, S. E. Richards, P. D. Colaizzi, J. Haberland, M. Kostrzewski, P. Waller, C. Choi, E. Riley, and T. Thompson. 2000. “Coincident Detection of Crop Water Stress, Nitrogen Status and Canopy Density Using Ground-Based Multispectral Data.” Paper presented at the International Conference on Precision Agriculture and Other Resource Management July 16-19, 2000, Bloomington, MN USA.
- Breiman, L. 2001. “Random Forests.” Machine Learning 45 (1): 5–32. doi:10.1023/A:1010933404324.
- Broge, N. H., and E. Leblanc. 2001. “Comparing Prediction Power and Stability of Broadband and Hyperspectral Vegetation Indices for Estimation of Green Leaf Area Index and Canopy Chlorophyll Density.” Remote Sensing of Environment 76 (2): 156–172. doi:10.1016/s0034-4257(00)00197-8.
- Burges, C. J. C. 1998. “A Tutorial on Support Vector Machines for Pattern Recognition.” Data Mining and Knowledge Discovery 2 (2): 121–167. doi:10.1023/a:1009715923555.
- Calderón, R., J. A. Navas-Cortés, C. Lucena, and P. J. Zarco-Tejada. 2013. “High-Resolution Airborne Hyperspectral and Thermal Imagery for Early Detection of Verticillium Wilt of Olive Using Fluorescence, Temperature and Narrow-Band Spectral Indices.” Remote Sensing of Environment 139 (139): 231–245. doi:10.1016/j.rse.2013.07.031.
- Chakraborty, S., and A. C. Newton. 2011. “Climate Change, Plant Diseases and Food Security: An Overview.” Plant Pathology 60 (1): 2–14. doi:10.1111/j.1365-3059.2010.02411.x.
- Chemura, A., O. Mutanga, and T. Dube. 2017. “Separability of Coffee Leaf Rust Infection Levels with Machine Learning Methods at Sentinel-2 MSI Spectral Resolutions.” Precision Agriculture 18 (5): 859–881. doi:10.1007/s11119-016-9495-0.
- Cracknell, M. J., and A. M. Reading. 2014. “Geological Mapping Using Remote Sensing Data: A Comparison of Five Machine Learning Algorithms, Their Response to Variations in the Spatial Distribution of Training Data and the Use of Explicit Spatial Information.” Computers & Geosciences 63 (1): 22–33. doi:10.1016/j.cageo.2013.10.008.
- Cristianini, N., and J. Shawe-Taylor. 2000. An Introduction to Support Vector Machines. United Kingdom: Cambridge University Press Cambridge.
- De Castro, A. I., R. Ehsani, R. Ploetz, J. H. Crane, and J. Abdulridha. 2015. “Optimum Spectral and Geometric Parameters for Early Detection of Laurel Wilt Disease in Avocado.” Remote Sensing of Environment 171 (2): 33–44. doi:10.1016/j.rse.2015.09.011.
- Deschamps, B., H. Mcnairn, J. Shang, and X. Jiao. 2012. “Towards Operational Radar-Only Crop Type Classification: Comparison of a Traditional Decision Tree with a Random Forest Classifier.” Canadian Journal of Remote Sensing 38 (1): 60–68. doi:10.5589/m12-012.
- Dhau, I., E. Adam, O. Mutanga, K. Ayisi, E. M. Abdel-Rahman, J. Odindi, and M. Masocha. 2018. “Testing the Capability of Spectral Resolution of the New Multispectral Sensors on Detecting the Severity of Grey Leaf Spot Disease in Maize Crop.” Geocarto International 33 (11): 1223–1236. doi:10.1080/10106049.2017.1343391.
- Dong, T., J. Liu, J. Shang, B. Qian, B. Ma, J. M. Kovacs, D. Walters, X. Jiao, X. Geng, and Y. Shi. 2019. “Assessment of Red-Edge Vegetation Indices for Crop Leaf Area Index Estimation.” Remote Sensing of Environment 222: 133–143. doi:10.1016/j.rse.2018.12.032.
- Duda, R. O., and P. E. Hart. 1973. “Pattern Classification and Scene Analysis.” In A Wiley-Interscience Publication. New York: Wiley.
- Feng, W., S. L. Qi, Y. R. Heng, Y. Zhou, Y. P. Wu, W. D. Liu, L. He, and X. Li. 2017. “Canopy Vegetation Indices from in Situ Hyperspectral Data to Assess Plant Water Status of Winter Wheat under Powdery Mildew Stress.” Frontiers in Plant Science 8: 12. doi:10.3389/fpls.2017.01219.
- Forkuor, G., K. Dimobe, I. Serme, and J. E. Tondoh. 2018. “Landsat-8 Vs. Sentinel-2: Examining the Added Value of Sentinel-2‘S Red-Edge Bands to Land-Use and Land-Cover Mapping in Burkina Faso.” GIScience & Remote Sensing 55 (3): 331–354. doi:10.1080/15481603.2017.1370169.
- Ghimire, B., J. Rogan, and J. Miller. 2010. “Contextual Land-Cover Classification: Incorporating Spatial Dependence in Land-Cover Classification Models Using Random Forests and the Getis Statistic.” Remote Sensing Letters 1 (1): 45–54. doi:10.1080/01431160903252327.
- Gitelson, A., and M. N. Merzlyak. 1994. “Quantitative Estimation of Chlororhyll-A Using Reflectance Spectra: Experiments with Autumn Chestnut and Maple Leaves.” Journal of Photochemistry and Photobiology B-Biology 22 (3): 247–252. doi:10.1016/1011-1344(93)06963-4.
- Gitelson, A. A., Y. J. Kaufman, R. Stark, and D. Rundquist. 2002. “Novel Algorithms for Remote Estimation of Vegetation Fraction.” Remote Sensing of Environment 80 (1): 76–87. doi:10.1016/S0034-4257(01)00289-9.
- Gitelson, A. A., and M. N. Merzlyak. 1996. “Signature Analysis of Leaf Reflectance Spectra: Algorithm Development for Remote Sensing of Chlorophyll.” Journal of Plant Physiology 148 (3–4): 494–500. doi:10.1016/s0176-1617(96)80284-7.
- Gitelson, A. A., A. Viña, V. Ciganda, D. C. Rundquist, and T. J. Arkebauer. 2005. “Remote Estimation of Canopy Chlorophyll Content in Crops.” Geophysical Research Letters 32 (8): 93–114. doi:10.1029/2005GL022688.
- Graeff, S., J. Link, and W. Claupein. 2006. “Identification of Powdery Mildew (Erysiphe Graminis Sp. Tritici) and Take-All Disease (Gaeumannomyces Graminis Sp. Tritici) in Wheat (Triticum Aestivum L.) By Means of Leaf Reflectance Measurements.” Central European Journal of Biology 1 (2): 275–288.
- Ho, T. K. 1995. “Random Decision Forests. Paper Presented at the Document Analysis and Recognition, 1995.” proceedings of the third international conference on.
- Huang, W., L. Davidw, N. Zheng, Y. Zhang, L. Liu, and J. Wang. 2007. “Identification of Yellow Rust in Wheat Using In-Situ Spectral Reflectance Measurements and Airborne Hyperspectral Imaging.” Precision Agriculture 8 (4–5): 187–197. doi:10.1007/s11119-007-9038-9.
- Huang, W., Q. Guan, J. Luo, J. Zhang, J. Zhao, D. Liang, L. Huang, and D. Zhang. 2014. “New Optimized Spectral Indices for Identifying and Monitoring Winter Wheat Diseases.” IEEE Journal of Selected Topics in Applied Earth Observations & Remote Sensing 7 (6): 2516–2524. doi:10.1109/JSTARS.2013.2294961.
- Huete, A., K. Didan, T. Miura, E. P. Rodriguez, X. Gao, and L. G. Ferreira. 2002. “Overview of the Radiometric and Biophysical Performance of the MODIS Vegetation Indices.” Remote Sensing of Environment 83 (1): 195–213. doi:10.1016/S0034-4257(02)00096-2.
- Khan, J. A., S. Van Aelst, and R. H. Zamar. 2010. “Fast Robust Estimation of Prediction Error Based on Resampling.” Computational Statistics & Data Analysis 54 (12): 3121–3130. doi:10.1016/j.csda.2010.01.031.
- Latifi, H., T. Dahms, B. Beudert, M. Heurich, C. Kübert, and S. Dech. 2018. “Synthetic RapidEye Data Used for the Detection of Area-Based Spruce Tree Mortality Induced by Bark Beetles.” GIScience & Remote Sensing 55 (6): 839–859. doi:10.1080/15481603.2018.1458463.
- Liang, L., X. C. Li, Y. B. Huang, Y. C. Qin, and H. B. Huang. 2017. “Integrating Remote Sensing, GIS and Dynamic Models for Landscape-Level Simulation of Forest Insect Disturbance.” Ecological Modelling 354: 1–10. doi:10.1016/j.ecolmodel.2017.03.007.
- Liu, D., M. Kelly, and G. Peng. 2006. “A Spatial–Temporal Approach to Monitoring Forest Disease Spread Using Multi-Temporal High Spatial Resolution Imagery.” Remote Sensing of Environment 101 (2): 167–180. doi:10.1016/j.rse.2005.12.012.
- Luo, J., W. Huang, J. Zhao, J. Zhang, R. Ma, and M. Huang. 2014. “Predicting the Probability of Wheat Aphid Occurrence Using Satellite Remote Sensing and Meteorological Data.” Optik – International Journal for Light and Electron Optics 125 (19): 5660–5665. doi:10.1016/j.ijleo.2014.06.010.
- Luo, J., W. Huang, J. Zhao, J. Zhang, C. Zhao, and R. Ma. 2013. “Detecting Aphid Density of Winter Wheat Leaf Using Hyperspectral Measurements.” IEEE Journal of Selected Topics in Applied Earth Observations & Remote Sensing 6 (2): 690–698. doi:10.1109/JSTARS.2013.2248345.
- Mahlein, A. K., T. Rumpf, P. Welke, H. W. Dehne, L. Plümer, U. Steiner, and E. C. Oerke. 2013. “Development of Spectral Indices for Detecting and Identifying Plant Diseases.” Remote Sensing of Environment 128 (1): 21–30. doi:10.1016/j.rse.2012.09.019.
- Martinelli, F., R. Scalenghe, S. Davino, S. Panno, G. Scuderi, P. Ruisi, P. Villa, D. Stroppiana, M. Boschetti, L. R. Goulart, C. E. Davis, and A. M. Dandekar. 2015. “Advanced Methods of Plant Disease Detection. A Review.” Agronomy for Sustainable Development 35 (1): 1–25. doi:10.1007/s13593-014-0246-1.
- Martins, G. D., M. D. L. B. T. Galo, and B. S. Vieira. 2017. “Detecting and Mapping Root-Knot Nematode Infection in Coffee Crop Using Remote Sensing Measurements.” IEEE Journal of Selected Topics in Applied Earth Observations and Remote Sensing 10 (12): 5395–5403. doi:10.1109/JSTARS.2017.2737618.
- Marx, A., and B. Kleinschmit. 2017. “Sensitivity Analysis of RapidEye Spectral Bands and Derived Vegetation Indices for Insect Defoliation Detection in Pure Scots Pine Stands.” iForest 10: 659–668. doi:10.3832/ifor1727-010.
- Mirik, M., R. J. Ansley, J. A. Price, F. Workneh, and C. M. Rush. 2013. “Remote Monitoring of Wheat Streak Mosaic Progression Using Sub-Pixel Classification of Landsat 5 TM Imagery for Site Specific Disease Management in Winter Wheat.” Advances in Remote Sensing 2 (01): 16–28. doi:10.4236/ars.2013.21003.
- Mirik, M., R. J. Ansley, K. Steddom, C. M. Rush, G. J. Michels, F. Workneh, S. Cui, and N. C. Elliott. 2014. “High Spectral and Spatial Resolution Hyperspectral Imagery for Quantifying Russian Wheat Aphid Infestation in Wheat Using the Constrained Energy Minimization Classifier.” Journal of Applied Remote Sensing 8 (1): 083661. doi:10.1117/1.jrs.8.083661.
- Peñuelas, J., and Y. Inoue. 1999. “Reflectance Indices Indicative of Changes in Water and Pigment Contents of Peanut and Wheat Leaves.” Photosynthetica 36 (3): 355–360. doi:10.1023/A:1007033503276.
- Rouse, J. W., Jr, R. H. Haas, J. A. Schell, and D. W. Deering. 1973. “Monitoring Vegetation Systems in the Great Plains with Erts.” Nasa Special Publication 351: 309.
- Savary, S., A. Ficke, J. N. Aubertot, and C. Hollier. 2012. “Crop Losses Due to Diseases and Their Implications for Global Food Production Losses and Food Security.” Food Security 4 (4): 519–537. doi:10.1007/s12571-012-0200-5.
- Shafri, H. Z. M., and N. Hamdan. 2009. “Hyperspectral Imagery for Mapping Disease Infection in Oil Palm Plantation Using Vegetation Indices and Red Edge Techniques.” American Journal of Applied Sciences 6 (6): 1031–1035. doi:10.3844/ajassp.2009.1031.1035.
- Shi, Y., W. J. Huang, J. H. Luo, L. S. Huang, and X. F. Zhou. 2017. “Detection and Discrimination of Pests and Diseases in Winter Wheat Based on Spectral Indices and Kernel Discriminant Analysis.” Computers and Electronics in Agriculture 141: 171–180. doi:10.1016/j.compag.2017.07.019.
- Smith, K. L., M. D. Steven, and J. J. Colls. 2004. “Use of Hyperspectral Derivative Ratios in the Red-Edge Region to Identify Plant Stress Responses to Gas Leaks.” Remote Sensing of Environment 92 (2): 207–217. doi:10.1016/j.rse.2004.06.002.
- Sonobe, R., Y. Yamaya, H. Tani, X. Wang, N. Kobayashi, and K.-I. Mochizuki. 2017. “Assessing the Suitability of Data from Sentinel-1A and 2A for Crop Classification.” GIScience & Remote Sensing 54 (6): 918–938. doi:10.1080/15481603.2017.1351149.
- Strange, R. N., and P. R. Scott. 2005. “Plant Disease: A Threat to Global Food Security.” Annual Review of Phytopathology 43 (1): 83–116. doi:10.1146/annurev.phyto.43.113004.133839.
- Te Beest, D. E., N. D. Paveley, M. W. Shaw, and F. van den Bosch. 2008. “Disease-Weather Relationships for Powdery Mildew and Yellow Rust on Winter Wheat.” Phytopathology 98 (5): 609–617. doi:10.1094/PHYTO-98-5-0609.
- Tyc, G., J. Tulip, D. Schulten, M. Krischke, and M. Oxfort. 2005. “The RapidEye Mission Design.” Acta Astronautica 56 (1–2): 213–219. doi:10.1016/j.actaastro.2004.09.029.
- Van der Linden S., A. Rabe, M. Held, B. Jakimow, P. J. Leitão, A. Okujeni, M. Schwieder, S. Suess and P. Hostert. 2015. “The EnMAP-Box—A Toolbox and Application Programming Interface for EnMAP Data Processing.” Remote Sensing 7 (9): 11249. doi: 10.3390/rs70911249.
- Yuan, L., Z. Bao, H. Zhang, Y. Zhang, and X. Liang. 2017a. “Habitat Monitoring to Evaluate Crop Disease and Pest Distributions Based on Multi-Source Satellite Remote Sensing Imagery.” Optik – International Journal for Light and Electron Optics 145: 66–73. doi:10.1016/j.ijleo.2017.06.071.
- Yuan, L., H. Zhang, Y. Zhang, C. Xing, and Z. Bao. 2017b. “Feasibility Assessment of Multi-Spectral Satellite Sensors in Monitoring and Discriminating Wheat Diseases and Insects.” Optik – International Journal for Light and Electron Optics 131: 598–608. doi:10.1016/j.ijleo.2016.11.206.
- Yuan, L., J. Zhang, Y. Shi, C. Nie, L. Wei, and J. Wang. 2014. “Damage Mapping of Powdery Mildew in Winter Wheat with High-Resolution Satellite Image.” Remote Sensing 6 (5): 3611–3623. doi:10.3390/rs6053611.
- Zhang, C., J. Guo, and J. Lu. 2017. “Research on Classification Method of High-Dimensional Class-Imbalanced Data Sets Based on SVM.” Paper presented at the IEEE Second International Conference on Data Science in Cyberspace, Shenzhen, China, 26-29 June 2017.
- Zhang, C., E. Pattey, J. G. Liu, H. J. Cai, J. L. Shang, and T. F. Dong. 2018. “Retrieving Leaf and Canopy Water Content of Winter Wheat Using Vegetation Water Indices.” IEEE Journal of Selected Topics in Applied Earth Observations and Remote Sensing 11 (1): 112–126. doi:10.1109/jstars.2017.2773625.
- Zhang, J., R. Pu, L. Yuan, J. Wang, W. Huang, and G. Yang. 2014. “Monitoring Powdery Mildew of Winter Wheat by Using Moderate Resolution Multi-Temporal Satellite Imagery.” PLoS One 9 (4): e93107. doi:10.1371/journal.pone.0093107.
- Zhang, J. C., Y. B. Huang, L. Yuan, G. J. Yang, L. P. Chen, and C. J. Zhao. 2016. “Using Satellite Multispectral Imagery for Damage Mapping of Armyworm (Spodoptera Frugiperda) in Maize at a Regional Scale.” Pest Management Science 72 (2): 335–348. doi:10.1002/ps.4003.
- Zheng, Q., W. Huang, X. Cui, Y. Shi, and L. Liu. 2018. “New Spectral Index for Detecting Wheat Yellow Rust Using Sentinel-2 Multispectral Imagery.” Sensors 18 (3): 868. doi:10.3390/s18030868.