
 ?Mathematical formulae have been encoded as MathML and are displayed in this HTML version using MathJax in order to improve their display. Uncheck the box to turn MathJax off. This feature requires Javascript. Click on a formula to zoom.
ABSTRACT
Over-exploitation of groundwater has caused severe land subsidence in Beijing during the past two decades. Since the middle route of South-to-North Water Diversion Project (SNWDP), the biggest water diversion project in China, started to deliver water to Beijing in December 2014, the groundwater shortage has been greatly alleviated. This study aims to analyze the impact of SNWDP on the spatiotemporal evolution of land subsidence in Beijing. Change in surface displacement in Beijing after SNWDP was retrieved and the spatiotemporal patterns of the change were analyzed based on long time-series Envisat Advanced Synthetic Aperture Radar (ASAR) (2004–2010), Radarsat-2 (2011–2014), and Sentinel-1 (2015–2017) satellite datasets using Permanent Scatterer Interferometric Synthetic Aperture Radar (PS-InSAR) techniques. Land subsidence unevenness index (LSUI) was proposed to represent the spatial unevenness of surface displacement. PS-Time approach was then adapted to examine the time series evolution of LSUI. The results showed that the InSAR measurements agree well with leveling measurements with R2 over 0.96. Although the maximum annual displacement rate reached −159.7 mm/year by 2017, over 57% of the area within 25 mm/year contour line showed decreasing or unchanged displacement rate after the south-north water delivered to Beijing. The settlement rate in Chaoyang-Dongbalizhuang (CD) subsidence center has decreased for 26 mm/year from 2011–2014 to 2015–2017. Only around 15% of the area experienced continued accelerating settlement rate through the three time periods, which was mainly located in the area with the compressible layer thickness over 190 m, while the magnitude of velocity increment considerably decreased after SNWDP. Land subsidence unevenness, represented by LSUI, developed more slowly after SNWDP than that during 2011–2014. However, LSUI at the edge of settlement funnel has kept developing and reached 1.7‰ in 2017. Decreasing groundwater level decline after SNWDP and the positive relationship (R2 > 0.74) between land subsidence and groundwater level clearly showed impacts of SNWDP on the alleviating land subsidence. Other reasons include geological background, increasing precipitation, and strict water management policies implemented during these years.
1. Introduction
Land subsidence is a geological hazard by consolidation and compression of the underground loose strata, which is usually induced by natural or human activities. It causes serious damage to the natural environment and affects people’s life and production. Land subsidence has occurred in more than 50 cities in China. Beijing is a city with serious land subsidence in the North China Plain. The land subsidence in Beijing first occurred in 1935 in the center of the city. By the end of 2013, the area with a total settlement of more than 50 mm had reached more than 4200 km2, accounting for 66% of the total area of Beijing plain (Zhu et al. Citation2015). It is widely recognized that in Beijing over-exploitation of groundwater is the main cause of land subsidence (Zhou et al. Citation2018; Yang et al. Citation2018; Chen et al. Citation2016; Gao et al. Citation2018; Chen et al. Citation2017a).
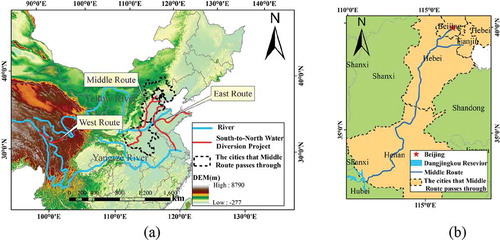
In Beijing, the water availability is below 500 m3 per capita per year, which is considered as the threshold of water scarcity. In fact, the entire northern part of China has been facing water shortage due to the unbalanced spatial distribution of water resources across China. The northern part of China covering around 60% of the country’s cultivated land has less than 16% of the total water resources, while the southern China covering 40% of the arable land has over 84% of the national water resources. In order to mitigate water scarcity in the northern China, South-to-North Water Diversion Project (SNWDP) was implemented. To date, it is the largest cross-regional water transfer project both in China and in the world (Fu et al. Citation2018). The project included three routes, i.e. east route, middle route, and west route ()). The middle route of the SNWDP originates from Danjiangkou reservoir in Han River and runs through Henan and Hebei Provinces before reaching Beijing and Tianjin ()), with the total length of 1432 km. Since the middle route began operation in December 2014, it has transferred more than 15 billion cubic meters water to the north China. By the end of July 2018, the volume of water coming to Beijing from the South Water has reached 3.6 billion cubic meters, of which 2.4 billion cubic meters has been supplied to tap water plants and the rest has flowed to reservoirs, emergency water sources, rivers, and lakes (http://www.bjwater.gov.cn). Thanks to the SNWDP, the water shortage in Beijing has been greatly relieved and thus the amount of groundwater exploitation has decreased. In 2015, Beijing’s groundwater depth has risen for the first time since 1999. Until 2018, the groundwater depth has risen for 1.2 m since SNWDP implementation (http://nsbd.beijing.gov.cn).
How land subsidence developed with decreasing groundwater exploitation after SNWDP has drawn a lot of attentions (Qin et al. Citation2018; Cheng et al. Citation2018; Li, Sivapalan, and Xu Citation2019). Qin et al. (Citation2018) investigated water distribution optimization strategies after SNWDP in order to control land subsidence. Cheng et al. (Citation2018) monitored land subsidence in Chaoyang District based on four leveling benchmarks, and reported slowing-down subsidence. Li, Sivapalan, and Xu (Citation2019) pointed out the necessities to evaluate the future impacts of SNWDP on Beijing’s water supply prospects and then on the hydrogeological challenges.
However, to date there have been little studies on regional land subsidence monitoring in Beijing after SNWDP, and little research has investigated the impact of decreasing groundwater level declination rate on land subsidence. Previous studies mainly focused on surface deformation monitoring before 2015 (Chen et al. Citation2016, Citation2017a, Citation2017b; Deng et al. Citation2017; Gao et al. Citation2018; Zhou et al. Citation2016, Citation2017; Yang et al. Citation2018; Guo et al. Citation2019). For example, Chen et al. (Citation2016, Citation2017a) investigated spatial pattern of land subsidence in Beijing Plain area during 2003–2010 using Permanent Scatterer Interferometric Synthetic Aperture Radar (PS-InSAR) technique based on Envisat Advanced Synthetic Aperture Radar (ASAR) datasets. Zhou et al. (Citation2016) analyzed land subsidence in different land cover types in Beijing plain area during 2003–2013 based on Envisat ASAR and Radarsat-2 datasets. Deng et al. (Citation2017) developed an improved Grey–Markov model for time-series land subsidence prediction based on Envisat ASAR datasets during 2003–2010. Zhou et al. (Citation2017) reported land subsidence characteristics under different land use types in the eastern Beijing area using TerraSAR-X datasets during 2010–2015. Gao et al. (Citation2018) reported elastic deformation characteristics in eastern Beijing area during 2003–2013 using Envisat ASAR and TerraSAR-X datasets. Yang et al. (Citation2018) examined the relationship between land subsidence and construction age of buildings in eastern Beijing urban area during 2003–2016 based on Envisat ASAR and TerraSAR-X datasets. Guo et al. (Citation2019) conducted trend analysis on the time-series cumulative displacement from 2004 to 2015 based on Envisat ASAR and Radarsat-2 datasets. Most of these studies utilized PS-InSAR techniques for interferometric measurements of land surface deformation based on C-band Envisat ASAR, C-band Radarsat-2, and X-band TerraSAR-X satellite datasets. Current studies have proved that PS-InSAR technique can be successfully used in land surface deformation monitoring (Kampes and Hanssen Citation2004; Lanari et al. Citation2007; Mohammadimanesh et al. Citation2019). With the launch of twin satellites Sentinel-1A and Sentinel-1B in April 2014 and in April 2016, respectively, they provide new opportunities for continuous ground deformation monitoring after SNWDP with revisiting time of 6 days (Fiaschi et al. Citation2017; Krishnan, Kim, and Jung Citation2017; Raspini et al. Citation2018). Another limitation of existing studies is that most research used deformation rate to represent land subsidence characteristics (Chen et al. Citation2016, Citation2017b; Deng et al. Citation2017; Gao et al. Citation2018; Zhou et al. Citation2016, Citation2017; Yang et al. Citation2018). The spatial unevenness of land subsidence and its temporal patterns, which maybe more hazardous for urban infrastructures has not been well quantified.
Figure 1. The location of south-north water diversion project. (a) the three routes of south-north water diversion project; (b) the middle route of south-north water diversion project.
The objective of this study was to investigate the spatiotemporal patterns of the change in regional land subsidence in Beijing plain area after SNWDP by examining surface displacement during three periods (2004–2010, 2011–2014, and 2015–2017) using PS-InSAR techniques. A new index named Land Subsidence Unevenness Index (LSUI) was presented to describe the spatial unevenness of settlement. With the combination of PS-Time time-series analysis (Berti et al. Citation2013), the development of subsidence unevenness was analyzed. Finally, the impact of SNWDP on change in surface displacement was analyzed, and other reasons including geological background, precipitation and water management policies were discussed.
2. Study area and datasets
2.1. Study area
Beijing (115°25′–117°30′ E, 39°28′–41°05′ N) is located in the northern part of the North China Plain, with the total area of 16,422.78 km2. The region can be divided into the western mountain area, the northern mountain area and the southeast plain area. In this study, the central part of the Beijing plain area was selected as the study area (). By the end of 2016, the population density of Beijing had reached 1324 persons per square kilometer. During 1961–2017, the average precipitation in Beijing was 571 mm (http://www.bjwater.gov.cn). Water-bearing alluvial–pluvial deposits and river channel deposits with bedrock beneath are dominant geology types in the Beijing plain. The unconsolidated deposits have thickness of tens of meters in the mountain-front area and several hundred meters in the central to southeast plain area (Zhang et al. Citation2014). Groundwater is the main source of municipal, industrial, and irrigation water use. Since the SNWDP middle route was officially completed on 24 December 2014, the water supplied to Beijing has reached 3.6 billion cubic meters by the end of July 2018.
2.2. Datasets
The SAR datasets used in this study include 36 images collected by C-band Envisat ASAR from 14 January 2004 to 25 August 2010, 27 images by C-band Radarsat-2 satellite collected from 22 November 2010 to 19 December 2014, and 21 images collected by C-band Sentinel-1 satellite from 17 June 2015 to 31 May 2017. Detailed information of the three datasets is shown in . The Shuttle Radar Topography Mission (SRTM) digital elevation data with 90 m resolution was downloaded from the United States Geological Survey (http://dds.cr.usgs.gov/srtm/) and used to remove the topographic phase contribution in the processing of multi-temporal InSAR method.
Figure 2. Geographic location of study area and coverage of SAR datasets.
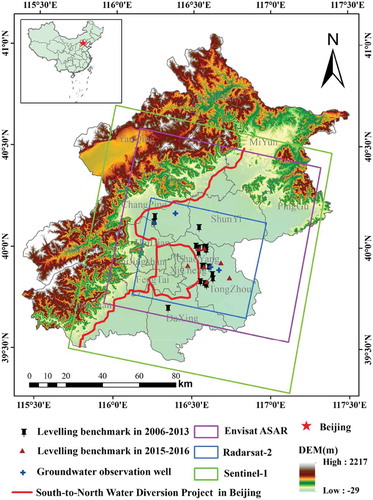
Table 1. Summary of the SAR datasets information.
Land surface deformation measurements collected from 7 leveling benchmarks from 2006 to 2013, and 12 leveling benchmarks from 2015 to 2016 were used for validation (). Due to limited availability of long-term observations, there is no in situ datasets covering the entire time span from 2013 to 2015.
3. Methods
In this study, the PS-InSAR approaches, i.e. Stanford Method for Persistent Scatterers (StaMPS) algorithm and SAR PROcessing tool by periZ (SARPROZ) method, were used to determine the land surface displacement rate and the time-series displacement based on the SAR datasets. The results were then validated by leveling measurements. Change in land surface displacement rate before and after SWNDP was analyzed. Then, an index representing spatial unevenness of land was presented, and the time series of the unevenness index was classified.
3.1. Land subsidence monitoring using Ps-InSAR techniques
The PS-InSAR approach was first presented by Ferretti, Prati, and Rocca (Citation2000). In this study, the StaMPS algorithm developed by Hooper (Citation2008) was used to derive deformation from the Envisat ASAR datasets. The PS-InSAR technique in SARPROZ software (https://www.sarproz.com) was used to obtain deformation time series from the Radarsat-2 and Sentinel-1 datasets. Both methods consist of master image selection, image co-registration, PS selection, and estimation of ground motion.
3.1.1 StaMPS
StaMPS method starts with master image selection based on the parameters such as the acquisition date, temporal and spatial baselines and Doppler centroid frequency. In this study, the Envisat ASAR image acquired on 18 April 2007 was selected as the master image. Next, all other Envisat ASAR images were co-registered to the master image based on precise orbits and reference DEM data with an amplitude-based function. Afterward, the interferograms were generated, the orbital parameters and the SRTM DEM were used to remove the orbital and topographic phase contribution from the interferometric phase. Next, the StaMPS selected initial persistent scatterer candidates (PSCs) with the amplitude dispersion index value lower than a given threshold (0.4 in this study). The phase stability analysis was then performed for the PSC pixels. For each PSC pixel, the “flattened” and topographically corrected interferogram can be represented as the wrapped sum of five terms:
Where is the wrapping operator,
represents the phase change due to ground motion in the line-of-sight (LOS) direction between two satellite passes,
is the phase due to the difference in atmospheric delay,
and
are the residual phase due to inaccurate estimation of orbital parameters and DEM errors, respectively.
is the noise phase including scattering, thermal noise, co-registration errors and uncertainty in the position of the phase center at the azimuth. Finally, the time series deformation along the LOS direction was derived by subtracting the errors.
3.1.2 SARPROZ method
SARPROZ is a software package for interferometric processing. Here the classical PS-InSAR algorithm (PSI) embedded in SARPROZ (Ferretti, Prati, and Rocca Citation2000) was used to derive surface displacement. Researches have found that the results from both algorithms achieved the same level accuracies (Yang et al. Citation2018; Ruiz-Armenteros et al. Citation2016). First, the Radarsat-2 image acquired on 11 December 2012, and the Sentinel-1 image acquired on 30 September 2016 were selected as the master images, respectively. The slave images were co-registered to the master image using coherence coefficient approach. Then, a series of differential interferograms were constructed with the aid of SRTM DEM and precise orbital data. The phase to height constants and phase to flat constants were generated. The wrapped interferometeric phase after removing the influence of earth curvature and the topography can be also represented by Eq. (1), while in the SARPROZ PSI algorithm, the phase change due to LOS ground motion is modeled as the sum of temporal linear and non-linear components of displacement:
where λ denotes the wavelength, v denotes the displacement velocity. From the interferograms, an initial set of PSCs were obtained with amplitude difference dispersion index lower than 0.3. A network (spatial graph) of PSCs was constructed in order to estimate preliminary parameters and Atmospheric Phase Screen (APS). After APS removal, PS points with a temporal coherence index greater than 0.65 were selected to ensure that the selected PS points have a high coherence and show phase stability over a long period of time. For each PS, the DEM error, the linear displacement rate along the LOS and the deformation time series were calculated.
In Beijing, the horizontal movement of the land surface can be neglected (Gao et al. Citation2018). For both StaMPS and SARPROZ results, the deformation rate in LOS direction is projected into the up-down direction as subsidence rate by Equation (3):
where and
are the up-down (vertical) deformation rate and SAR LOS deformation rate, respectively,
SAR viewing angle at position
. It is assumed that subsidence and uplift are ideal conditions for ground deformation. In this study, it is reasonable that the main deformation in Beijing plain is land subsidence and uplift (Gao et al. Citation2018). The displacement rates mentioned below are all in the vertical direction.
3.2. Time-series analysis of land subsidence unevenness
Spatially uneven subsidence, indicating a large difference in deformation within a short distance, maybe more hazardous for urban infrastructures. In this study, LSUI was proposed based on deformation information of neighboring PS points. First, cumulative displacement raster datasets with 100 m resolution were created from PS points by Kriging interpolation. Then, the LSUI at a given pixel was calculated as
where ,
,
,
,
,
,
,
are the cumulative displacement of the pixels located in the north, south, east, west, north-west, north-east, south-west, and south-east to the pixel; the denominator 800 is the product of the number of surrounding pixels (8) and the pixel resolution (100 m);
and
are the land subsidence unevenness index in the direction of north-south and west-east, respectively. As there were 83 cumulative displacement maps derived from 84 SAR imagery, a total of 83 LSUI maps were calculated.
We further adapted the PS-Time approach for time-series analysis of LSUI. PS-Time approach was first proposed by Berti et al. (Citation2013). The approach automatically interpret the persistent scatters interferometry time series based on a conditional sequence of statistical tests, i.e. variance analysis, linear regression, segmented regression, quadratic regression, a discontinuity test, slope-change detection, and corresponding significance tests. It classifies the time series of cumulative displacement into six categories, namely, uncorrelated, linear, discontinuous with constant velocity, quadratic, bilinear, and discontinuous with variable velocity. For the last three categories, the breakpoint of time-series displacement where change in velocity occurs can be identified. The PS-Time method has been applied to characterize ground subsidence caused by longwall mining (Iannacone et al. Citation2015) and long-term land subsidence (Mantovani et al. Citation2016). In this study, we applied the PS-Time to the time-series LSUI and adapted it by reclassifying the six categories into three categories, namely, stable, deceleration and acceleration according to the change in velocity ().
Table 2. Types of time series classification.
4. Results
4.1. Land subsidence velocities during the three time periods
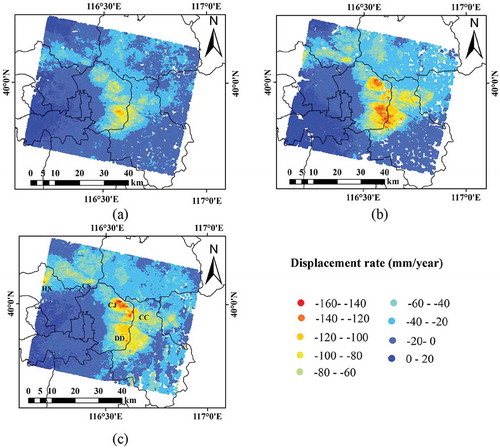
A total of 148,513, 121,203, and 111,745 PS pixels were identified from the Envisat ASAR (2004–2010), Radarsat-2 (2011–2014), and Sentinel-1 (2015–2017) datasets, respectively. As illustrated in , the surface deformation rates vary widely throughout the study area. The rate ranged from −108.08 to 4.04 mm/year during 2004–2010 for the Envisat ASAR datasets, from −147.57 to 18.56 mm/year during 2011–2014 for the Radarsat-2 datasets and from −159.7 to 9.58 mm/year during 2015–2017 for the Sentinel-1 datasets. All three time periods showed similar spatial patterns of surface deformation. Land subsidence rate in part of Chaoyang, Tongzhou, Changping, and Haidian Districts was obviously higher than other areas, and five subsidence funnels have formed including Chaoyang Dongbalizhuang-Dajiaoting (CD), Chaoyang Caofang (CC), Chaoyang Jinzhan (CJ), Changping Shahe (CS), and Haidian Xixiaoying (HX). Comparison of the three subsidence maps showed that the subsidence center area has expanded since 2004. The subsidence rate in the center areas has considerably sped up from 2004–2010 to 2011–2014, while seemingly slowed down since 2015 in some subsidence centers. For example, the maximum subsidence rate in CD settlement funnel increased from −108.08 mm/year during 2004–2010 to −147.57 mm/year during 2011–2014, and decreased to −121.92 mm/year during 2015–2017.
Figure 3. Displacement rates from 2004 to 2017 in the study area. (a) displacement rates from Envisat ASAR data during 2004–2010; (b) displacement rates from radarsat-2 data during 2011–2014; (c) displacement rates from sentinel-1 data during 2015–2017.
4.2. Validation using leveling measurements
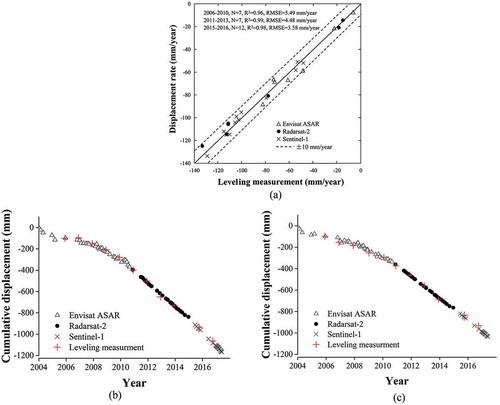
The mean displacement rate during the three time periods were further assessed by 19 in situ leveling measurements collected from 2006 to 2013 and from 2015 to 2016 (). For each leveling benchmark, the closest PS pixel was selected. The leveling measurements and vertical displacement velocities of the PS pixels retrieved by Envisat ASAR, Radarsat-2, and Sentinel-1were compared. As there are no leveling measurements available throughout the time span, we calculated the average displacement rates during 2006–2010 based on Envisat ASAR cumulative displacement time series, during 2011–2013 based on Radarsat-2 cumulative displacement time series, and that during 2015–2016 based on Sentinel-1 cumulative displacement time series. As illustrated in ), the InSAR measurements show good consistency with leveling measurements. Both measurements are strongly correlated, and the coefficient of determination (R2) of the linear regression between them are 0.96, 0.99, and 0.98 for Envisat ASAR, Radarsat-2, and Sentinel-1 measurements, respectively. The root-mean-square-error (RMSE) was lower than 5.49 mm/year, indicating the reliability of InSAR results. , compared the time series cumulative displacement from leveling measurements and that from PS-InSAR at two leveling benchmarks. It can be seen that the general trend of land subsidence derived from PS-InSAR agrees very well with the leveling measurements.
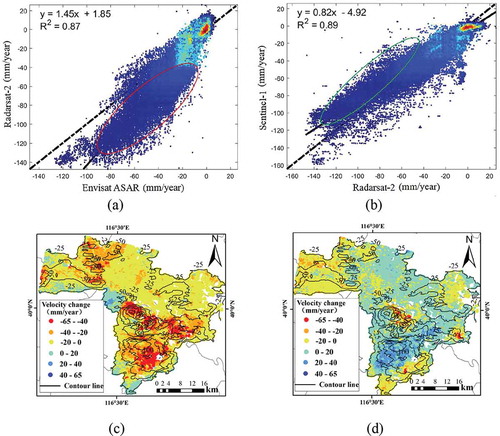
Figure 4. Comparison of PS-InSAR results and leveling measurement. (a) scatterplot of annual displacement rates from PS-InSAR technique and leveling measurement; (b) and (c) time series cumulative displacement from PS-InSAR technique and leveling measurement.
4.3. Change in land subsidence velocity before and after SNWDP
In order to examine change in land subsidence velocity throughout 2004–2017, common PS pixels of the three InSAR measurements were detected. The PS pixels from Envisat ASAR and Radarsat-2 that are closest to Sentinel-1 PS pixels with distance less than 10 m were assumed to be at the same location. Overall, there were 111,745 PS pixels recognized as common PS pixels for Envisat ASAR, Radarsat-2, and Sentinel-1 measurements. ,b) demonstrate the correlation between Radarsat-2 (2011–2014) and Envisat ASAR (2004–2010) deformation rates, and between Sentinel-1 (2015–2017) and Radarsate-2 (2011–2014) deformation rates, respectively, for the common PS pixels. It can be seen that deformation rates during different time periods correlate well, with R2 of 0.87 between Envisat ASAR and Radarsat-2 and R2 of 0.89 between Sentinel-1 and Radarsat-2. It is worth noting that around 60% of the PS pixels had increasing displacement rate (greater negative values) during 2011–2014 compared to 2004–2010 (marked with red circle in )), while around 45% of the PS pixels had decreasing displacement rate (smaller negative values) during 2015–2017 compared to 2011–2014. ,d) map the velocity differences between Radarsat-2 and Envisat ASAR, and between Sentinel-1 and Radarsat-2, respectively. Only the area with mean settlement rate greater than 25 mm/year during 2015 to 2017 is demonstrated. From 2004–2010 to 2011–2014, most of the area showed accelerating displacement rates ()). In CD and CJ settlement funnels, the velocity increment reached over 40 mm/year. After 2014, the year that SNWDP started to supply water to Beijing, some area in Beijing plain showed decelerating subsidence ()). For example, the maximum displacement rate in CD subsidence funnel area was −147.57 mm/year during 2011–2014, which decreased to −121.92 mm/year during 2015–2017. However, Changping and CC subsidence area still showed accelerating trend.
Figure 5. The correlation and difference of InSAR measurements. (a) correlation between radarsat-2 and envisat ASAR; (b) correlation between sentinel-1 and radarsat-2; (c) difference between radarsat-2 and envisat ASAR; (d) difference between sentinel-1 and radarsat-2.
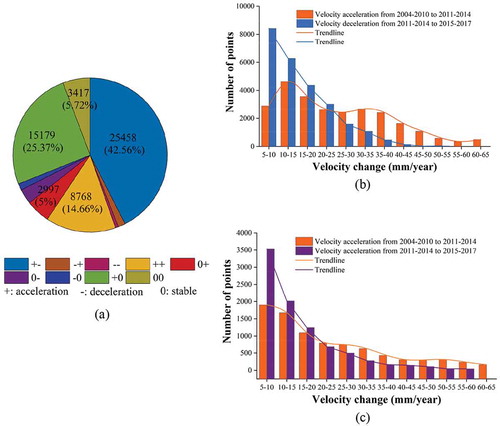
showed the statistics of the magnitude of velocity change from 2004–2010 to 2011–2014 and from 2011–2014 to 2015–2017 in the region showed in ,d). Here we consider those PS pixels with velocity change between −5 and 5 mm/year as stable PS pixels considering the uncertainties of PS-InSAR results (denoted as “0”). The symbol “+” represents the velocity acceleration greater than 5 mm/year, “−” represents velocity deceleration greater than 5 mm/year. The successive use of the sign “+”, “−”, or “0” represents the velocity change from 2004–2010 to 2011–2014, and from 2011–2014 to 2015–2017, respectively. For example, “+−” represents the velocity of the PS pixel was accelerating from 2004–2010 to 2011–2014, but decelerating from 2011–2014 to 2015–2017. The PS points are thus classified into nine types based on the velocity change during the three time periods. Three dominant types include “+−”, “+0” and “++”, which accounts for 42.56%, 25.37%, and 14.66% of the total PS pixels, respectively. This means that around 83% of the area within 25 mm/year contour line had accelerating settlement before 2014. Over 57% of the area experienced accelerating settlement before 2014, and then experienced decelerating or stable settlement after 2014. ,c) shows the histogram of velocity change magnitude for the types “+−” and “++”. For those PS pixels with increasing settlement rate before 2014 and decreasing rate after 2014, the overall magnitude of velocity increment from 2004–2010 to 2011–2014 is greater than the magnitude of velocity decrement from 2011–2014 to 2015–2017. The average velocity increment is 25.67 mm/year, and the average velocity decrement after 2014 is 15.29 mm/year. Among these pixels, 77% had velocity increment over 10 mm/year, while only 47% PS pixels had velocity decrement over 10 mm/year. This indicates that although subsidence rate in some area began to slow down after 2014, the magnitude of slowing down is still small. From ), we can see that for those PS pixels with accelerating settlement velocity during the three time periods, the magnitude of acceleration after 2014 is smaller than that before 2014. 63% of the PS pixels had velocity increment over 10 mm/year from 2004–2010 to 2011–2014, while only 36% of PS pixels had velocity increment over 10 mm/year from 2011–2014 to 2015–2017. Although around 14.77% of the area experienced accelerating subsidence during the three time periods, the magnitude of acceleration declined after 2014.
Figure 6. Statistics of velocity change during three periods. (a) classification of velocity change; (b) the histogram of velocity change of the PS pixels with “+−” type; (c) the histogram of velocity change of the PS pixels with “++” type.
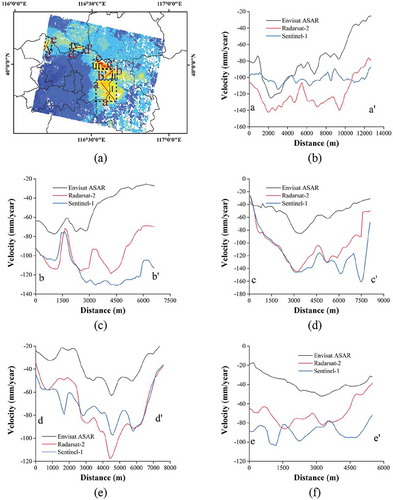
Close examination of the local subsidence velocity change was conducted by analyzing five regions of interest in the subsidence funnel areas, namely Zone I (CD), II (CC), III (CJ), IV (CS), and V (HX) in ). Five profile lines a-a’, b-b’, c-c’, d-d’ and e-e’ were chosen to illustrate the spatial characteristics of land subsidence, which can be found in –f). It can be clearly seen that the displacement rate along the profile lines a-a’ and d-d’ in Zone I and Zone IV showed decreasing rate after 2014. The maximum displacement rate along line a-a’ reached −142.16 mm/year during 2011–2014, while it decreased to −104.89 mm/year after 2014. For the profile line d-d’ at the distance between 2500 and 5500 m, the displacement rates after 2014 were lower than those before 2014. However, other profile lines exhibit increasing subsidence rates. Particularly, the maximum displacement rate reached −159.7 mm at profile line c-c’ during 2015–2017. At the border area of CC settlement funnel (around distance of 6603 m for line b-b’), the displacement rate increased rapidly from −27.3 mm/year before 2010 to −69.8 mm/year during 2011–2014, and to −112.9 mm/year after 2014.
Figure 7. Displacement rate along the profile lines in the five regions of interest. (a) the location of region of interest and profile line; (b) profile line a-a’ in zone I; (c) profile line b-b’ in zone II; (d) profile line c-c’ in zone III; (e) profile line d-d’ in zone IV; (f) profile line e-e’ in zone V.
4.4. Change in land subsidence unevenness before and after SNWDP
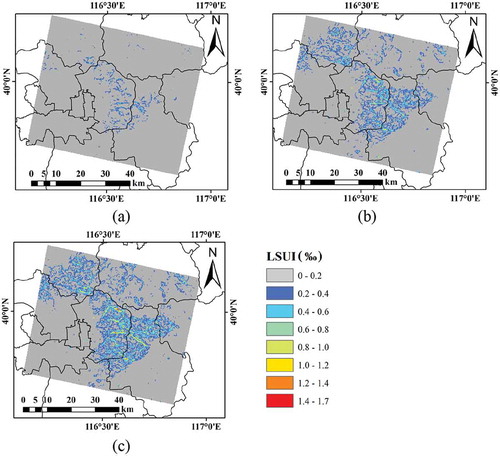
showed LSUI maps calculated from the cumulative displacement from 2004 to 2010, from 2004 to 2014, and from 2004 to 2017, respectively. Results showed that the maximum LSUI of displacement was 1.7‰, which occurred in 31 May 2017. Although the time span of 2004–2010 is larger than 2011–2014 and 2015–2017, the LSUI value is smaller and the overall LSUI is less than 0.6‰. The time span from 2004 to 2014 belongs to the period of rapid development of subsidence funnel. During this period, the area with LSUI greater than 0.2‰ increased rapidly. In contrast, although the maximum LSUI was increasing, the location of the area with the LSUI greater than 0.2‰ was basically the same. Thus, the period from 2014 to 2017 belongs to the stable period of the development of settlement funnel. In the subsidence area, the LSUI at the center of the funnel was smaller than the LSUI at the edge of the funnel. Therefore, the edge of the funnel should be paid more attention than the center of the funnel area.
Figure 8. Spatial unevenness of land subsidence represented by land subsidence unevenness index during (a) 2004–2010, (b) 2004–2014, and (c) 2004–2017.
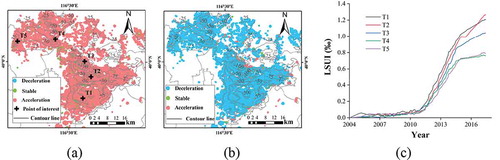
As the PS-Time can only detect one breakpoint, in this study we applied it to analyze time-series LSUI during two time segments, i.e. 2004–2014 and 2011–2017. (a,b) showed the change type of LSUI in the area of LSUI greater than 0.2‰. It can be seen that most of the area experienced speeding-up LSUI increment during 2004–2014, while slowing-down LSUI change during 2011–2017. The time-series LSUI at five locations in the edge of subsidence funnels (DD, CC, CJ, CS, and HX) clearly shows rapid rise during 2011–2014 compared to prior 2011, and slow increment after 2015()).
Figure 9. Classes of time-series of land subsidence unevenness index (LSUI) during (a) 2004–2014 and (b) 2011–2017. (c) time-series LSUI at the edge of subsidence funnel area at T1~T5 denoted in (a).
5. Discussion
5.1. Land subsidence and SNWDP
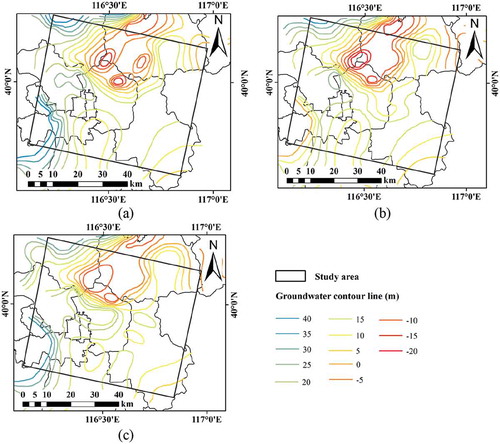
In December 2014, the SNWDP started to deliver water to Beijing. As illustrated in , before 2010 around 69% of the water supply in Beijing comes from groundwater. Although groundwater usage has reduced after 2011, it is still the major water source in Beijing (56%). Since 2015, the amount of groundwater usage has decreased to less than 1.8 billion m3, accounting for less than 45% of the total water supply. The reduction of groundwater usage is mainly attributed to the SNWDP operation. During the same period, the amount of delivered water has accounted for around 21% of the total water supply in Beijing, compared to ~6.6% prior 2014. As reported by China’s Water Conservancy Bureaus (http://www.bjwater.gov.cn), Beijing has gradually shut down wells in the past three years, which effectively prevented further decline of groundwater level and the expansion of groundwater funnel area. As a result, in the year 2015 the average groundwater depth decline was only 0.09 m, compared to ~1 m annually prior SNWDP. For the years from 2016 to 2018, the groundwater level raised by 0.52, 0.26, and 0.75 m, respectively, compared to the same period of the previous year. As shown in the groundwater level map () in 2012, 2014, and 2016, the groundwater level decreased obviously in 2014 compared to 2012, but recovered in 2016, especially in the eastern and northern part of Chaoyang District. The combined view of and also showed that the locations of the subsidence funnel area are generally coincided with the groundwater funnel areas.
Figure 10. The sources of water supply during 2004–2017.
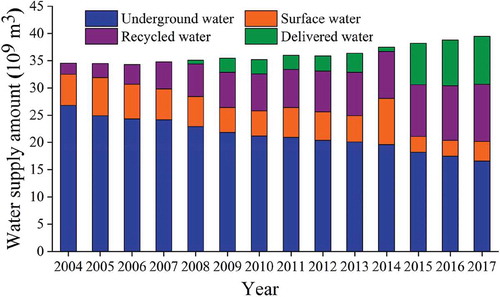
Figure 11. Groundwater level in study area. (a) ground water level in 2012; (b) groundwater level in 2014; (c) ground water level in 2016.
According to Terzaghi’s theory of consolidation, soil is compressed as the pore water is slowly released from the stressed clay materials, and the stress is then gradually transferred to the granular structure of the clay (Terzaghi Citation1925). Accordingly, the reduction of groundwater exploitation lower the magnitude of the pore water stress decrease and soil effective stress increase, thus leading to slowing down in land subsidence. In our study, we found that over 57% of the area within 25 mm/year contour line showed decreasing or unchanged displacement rate starting from 2015 (Section 4.4). For the area with increasing displacement rate throughout 2004–2017, the magnitude of velocity acceleration after 2014 is lower than that before 2014.
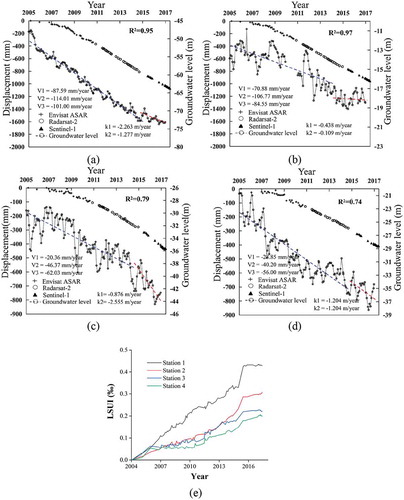
We further examined the time-series land subsidence around four groundwater observation wells located in Chaoyang, Tongzhou, and Changping Districts (location shown in ). illustrates the comparison between the time-series cumulative displacement derived from the three datasets and the groundwater level at the second confined aquifer during 2005–2016, which was the main exploitation aquifer. It can be seen that land subsidence rate was closely related to temporal variations in the groundwater level. The declination rate of groundwater level at all stations (k1 and k2 in ) decreased or stayed stable after 2015 except for the Station 3 in Changping District. Correspondingly, the settlement rate decreased or remained stable except at station 3. For example, at station 1 at Chaoyang District the settlement rate decreased to 101 mm/year after SNWDP compared to 114.01 mm/year before SNWDP. The linear regression between the cumulative displacement and annual groundwater level shows positive relationship with R2 greater than 0.74. This indicates that alleviated regional-scale land subsidence observed from Sentinel-1 dataset was related to SNWDP. This is also supported by recent literatures modeling groundwater dynamics and land subsidence processes after SNWDP. For example, Zhou et al. (Citation2018) simulated the groundwater dynamics in Beijing plain area using FEFLOW model, and concluded the groundwater level will increase to 23 m after 11 years of the SNWDP operation. Qin et al. (Citation2018) simulated the groundwater pumping amounts with different scenarios of groundwater pumping after SNWDP. The results showed the land subsidence rates will decrease to 17.0 mm/year by 2030. In addition to the land subsidence rate, in our study we found that the unevenness of land subsidence represented by LSUI was also alleviated because of the SNWDP (combined view of , , and (e)). It is expected that the hazards caused be uneven land subsidence will be well controlled in the near future given that SNWDP continues to supply water to Beijing.
Figure 12. The relationship between displacement and groundwater in (a) station 1, (b) station 2, (c) station 3 and (d) station 4; and the time series LSUI at the four stations (e).
5.2. Land subsidence and precipitation
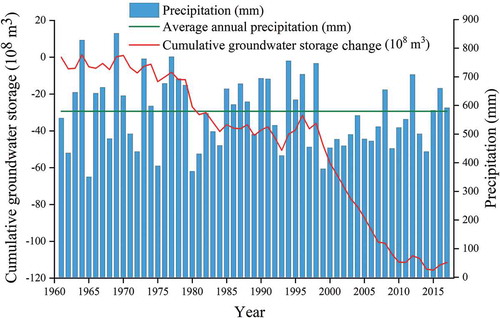
Precipitation is an important source of groundwater supply in Beijing plain. shows the annual precipitation and the cumulative groundwater storage change from 1961 to 2017 (Qin et al. Citation2018). It can be seen that the groundwater storage change correlates well with annual precipitation. During the period 1999–2014, Beijing experienced the longest consecutive number of dry years (except 2008 and 2012). The combined effect of intensive groundwater withdraw and reduced groundwater recharge leads to rapid depletion of groundwater storage during this period, with the average annual storage depletion of four times than that during 1980–1988. However, from 2015 to 2017, the annual precipitation was higher than the annual average precipitation and the cumulative storage of groundwater increasing correspondingly. The increase in precipitation means that the recharge of groundwater also increases, which indirectly results in slowing down in land subsidence rate.
Figure 13. Annual precipitation and cumulative groundwater storage during 1961–2017.
5.3. Land subsidence change and geological background
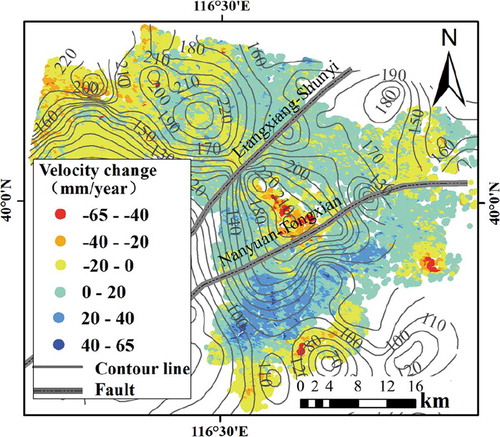
The spatial distribution of land subsidence is influenced by geological background (Zhu et al. Citation2015; Zhou et al. Citation2018; Guo et al. Citation2019). As illustrated in , in the central and southern subsidence areas, deceleration of settlement rate occurred in the area with compressible layer thickness of 100–190 m, and land subsidence acceleration occurred in the area with the compressible layer thickness over 190 m. In the new settlement areas in the northwest, the settlement rate has been increasing from 2011 to 2017. The stratum of the compressible thickness between 100 and 260 m is the middle Pleistocene, and the corresponding aquifer is the main exploitation aquifer in the Beijing plain (Zhou et al. Citation2017). In the zones between two faults, the area with the compressible layer over 190 m is mainly located in the urban area at the junction of the alluvial fan, with a high content of cohesive soil. There was no self-drilling well in this area. Therefore, after SNWDP the recovery of groundwater is slow, resulting in the continuous acceleration of land subsidence. In the south of the Nanyuan-Tongxian fault zone, the gradient of compressible soil layer changes greatly. This area belongs to the urban and rural groundwater exploitation area. The groundwater exploitation layer in this area is relatively shallow. After SNWDP, the groundwater rises quickly, which is also the reason for the decrease of land subsidence rate in this area. Therefore, the geological background in this area provides favorable conditions for the land subsidence to slow down after SNWDP.
Figure 14. Fault and compressible layer thickness overlaid on the velocity change from 2011–2014 to 2015–2017.
5.4. Water management policies in Beijing
In 2012, the government of Beijing Municipality announced the policy of “Implementing the Strictest Water Resources Management System.” The system is aimed to optimize the water utilization strategy and improve the water utilization efficiency. As can be seen from , the proportion of recycled water supply was increasing from 2014 although the total amount of water consumption was increasing. This also helps to relieve the stress of groundwater depletion. In addition, two land subsidence prevention and control policies have been promulgated successively, namely National Ground Settlement Prevention Plan (NGSPP [2011–2020]) and Beijing Ground Settlement Prevention Plan (BGSPP [2013–2020]). As a result, all self-drilling wells in Beijing urban area have been closed, and the control and management of underground wells in suburban counties have been strengthened. From 2015, Emergency Groundwater Resource Regions (EGRR) began to reduce production, and groundwater level began to rise. These policies linked the control of land subsidence and the improved management of groundwater, so as to slow down the over-exploitation of groundwater. In sum, the implementation of water resources management policies and land subsidence prevention policies are beneficial to the alleviation of land subsidence hazards.
6. Conclusions
In this study, change in land subsidence in Beijing plain area after SNWDP was presented by monitoring surface deformation based on Envisat ASAR (2004–2010), Radarsat-2 (2011–2014), and Sentinel-1 (2015–2017) datasets using PS-InSAR techniques. Our PS-InSAR measurements agree well with leveling benchmark observations, with R2 over 0.96 and RMSE less than 5.5 mm/year. Although the maximum annual displacement rate kept increasing during the three periods (−159.7 mm/year during 2015–2017 compared to −126.84 mm/year during 2004–2010), it is evident that the Beijing plain area began to show decreasing trend after SNWDP. After SNWDP, around 45% of the area had decelerating land subsidence compared to 2011–2014. For the region within contour line of 25 mm/year settlement rate, over 57% of the area experienced accelerating settlement before SNWDP and decelerating or stable settlement after SNWDP. Particularly, the settlement rate in Chaoyang Dongbalizhuang-Dajiaoting subsidence center has decreased for 26 mm/year during from 2011–2014 to 2015–2017. In contrast, almost the entire region witnessed accelerating subsidence before SNWDP. Only around 15% of the area experienced continued accelerating settlement rate through the three periods, while the magnitude of velocity increment considerably decreased after SNWDP. LSUI, as a new index, combined with PS-Time time series analysis, well showed the spatial distribution unevenness of land subsidence. The edge of the settlement funnel areas showed greater LSUI than the center, indicating more attention should be paid in those areas. After SNWDP, LSUI had developed more slowly than that during 2011–2014.
The alleviation of land subsidence after 2014 clearly showed the impact from slowing-down groundwater level decline thanks to SNWDP, because the R2 of linear regression between groundwater level and cumulative displacement was over 0.74. Precipitation is another factor affecting land subsidence. The geological background provides favorable conditions for the land subsidence to slow down after SNWDP in the area with compressible layer thickness between 100 and 190 m. In addition, a series of governmental policies related to strict water management and land subsidence control were implemented in recent years. These policies help to reduce groundwater pumping, and therefore help to control land subsidence development.
Acknowledgments
This research was supported by the Beijing Natural Science Foundation under Grant [5172002], by the National Natural Science Foundation of China under Grant [41401493], and by Capacity Building for Sci-Tech Innovation – Fundamental Scientific Research Funds. We also thank the reviewers for their valuable suggestions.
Disclosure statement
No potential conflict of interest was reported by the authors.
Additional information
Funding
References
- Berti, M., C. Alessandro, S. Franceschini, and J. Iannacone. 2013. “Automated Classification of Persistent Scatterers Interferometry Time-series.” Natural Hazard and Earth System Sciences 13 (8): 1945–1958. doi:10.5194/nhess-13-1945-2013.
- Chen, B., H. Gong, X. Li, K. Lei, L. Zhu, M. Gao, and C. Zhou. 2017a. “Characterization and Causes of Land Subsidence in Beijing, China.” International Journal of Remote Sensing 38 (3): 808–826. doi:10.1080/01431161.2016.1259674.
- Chen, M., R. Tomás, Z. Li, M. Motagh, T. Li, L. Hu, H. Gong, X. Li, J. Yu, and X. Gong. 2016. “Imaging Land Subsidence Induced by Groundwater Extraction in Beijing (China) Using Satellite Radar Interferometry.” Remote Sensing 8 (6): 468. doi:10.3390/rs8060468.
- Chen, W., H. Gong, B. Chen, K. Liu, M. Gao, and C. Zhou. 2017b. “Spatiotemporal Evolution of Land Subsidence around a Subway Using InSAR Time-series and the Entropy Method.” GIScience & Remote Sensing 54 (1): 78–94. doi:10.1080/15481603.2016.1257297.
- Cheng, L., Z. Fan, X. Wang, R. Bi, Y. Luo, and F. Yang. 2018. “New Trend of Groundwater and Land Subsidence in Typical AreasAfter the South-to-North Water Transfer into Beijing.” Yellow River 40 (7): 82–87.
- Deng, Z., Y. Ke, H. Gong, X. Li, and Z. Li. 2017. “Land Subsidence Prediction in Beijing Based on PS-InSAR Technique and Improved Grey-Markov Model.” GIScience & Remote Sensing 54 (6): 797–818. doi:10.1080/15481603.2017.1331511.
- Ferretti, A., C. Prati, and F. Rocca. 2000. “Nonlinear Subsidence Rate Estimation Using Permanent Scatterers in Differential SAR Interferometry.” IEEE Transactions on Geoscience and Remote Sensing 38 (5): 2202–2212. doi:10.1109/36.868878.
- Fiaschi, S., S. Tessitore, R. Bonì, D. Martire, V. Achilli, S. Borgstrom, A. Ibrahim, et al. 2017. “From ERS-1/2 to Sentinel-1: Two Decades of Subsidence Monitored through A-DInSAR Techniques in the Ravenna Area (Italy).” GIScience & Remote Sensing 54 (3): 305–328. doi:10.1080/15481603.2016.1269404.
- Fu, Z., Y. Wang, W. Lu, H. Zhao, J. Liu, and H. Guo. 2018. “An Inexact Stochastic Optimization Model for Multi-conflict Regional Water Resources Allocation in the South-to-north Water Benefited Area.” Journal of Hydroinformatics 20 (4): 946–959. doi:10.2166/hydro.2018.121.
- Gao, M., H. Gong, B. Chen, X. Li, C. Zhou, M. Shi, Y. Si, Z. Chen, and G. Duan. 2018. “Regional Land Subsidence Analysis in Eastern Beijing Plain by InSAR Time Series and Wavelet Transforms.” Remote Sensing 10 (3): 365. doi:10.3390/rs10030365.
- Guo, L., H. Gong, F. Zhu, L. Zhu, Z. Zhang, C. Zhou, M. Gao, and Y. Sun. 2019. “Analysis of the Spatiotemporal Variation in Land Subsidence on the Beijing Plain, China.” Remote Sensing 11 (10): 1170. doi:10.3390/rs11101170.
- Hooper, A. 2008. “A Multi-temporal InSAR Method Incorporating Both Persistent Scatterer and Small Baseline Approaches.” Geophysical Research Letters 35 (16). doi:10.1029/2008GL034654.
- Iannacone, J., A. Corsini, M. Berti, J. Morgan, and G. Falorni. 2015. “Characterization of Longwall Mining Induced Subsidence by Means of Automated Analysis of InSAR Time-series.” In Engineering Geology for Society and Territory-Volume 5, edited by G. Lollino, A. Manconi, F. Guzzetti, M. Culshaw, P. Bobrowsky, and F. Luino, 973–977. Cham: Springer. doi:10.1029/2008GL034654.
- Kampes, B., and R. Hanssen. 2004. “Ambiguity Resolution for Permanent Scatterer Interferometry.” IEEE Transactions on Geoscience and Remote Sensing 42 (11): 2446–2453. doi:10.1109/TGRS.2004.835222.
- Krishnan, P. V., D. Kim, and J. Jung. 2017. “Subsidence in the Kathmandu Basin, before and after the 2015 Mw 7.8 Gorkha Earthquake, Nepal Revealed from Small Baseline Subset-DInSAR Analysis.” GIScience & Remote Sensing 55 (4): 604–621. doi:10.1080/15481603.2017.1422312.
- Lanari, R., F. Casu, M. Manzo, G. Zeni, P. Berardino, M. Manunta, and A. Pepe. 2007. “An Overview of the Small BAseline Subset Algorithm: A DInSAR Technique for Surface Deformation Analysis.” Pure and Applied Geophysics 164 (4): 637–661. doi:10.1007/s00024-007-0192-9.
- Li, B., M. Sivapalan, and X. Xu. 2019. “An Urban Sociohydrologic Model for Exploration of Beijing’s Water Sustainability Challenges and Solution Spaces.” Water Resources Research 55 (7): 5918–5940. doi:10.1029/2018WR023816.
- Mantovani, M., S. Devoto, D. Piacentini, M. Prampolini, M. Soldati, and A. Pasuto. 2016. “Advanced SAR Interferometric Analysis to Support Geomorphological Interpretation of Slow-moving Coastal Landslides (Malta, Mediterranean Sea).” Remote Sensing 8 (6): 443. doi:10.3390/rs8060443.
- Mohammadimanesh, F., B. Salehi, M. Mahdianpari, J. English, J. Chamberland, and P. Alasset. 2019. “Monitoring Surface Changes in Discontinuous Permafrost Terrain Using Small Baseline SAR Interferometry, Object-based Classification, and Geological Features: A Case Study from Mayo, Yukon Territory, Canada.” GIScience & Remote Sensing 56 (4): 485–510. doi:10.1080/15481603.2018.1513444.
- Qin, H., C. Andrews, F. Tian, G. Cao, Y. Luo, J. Liu, and C. Zheng. 2018. “Groundwater-pumping Optimization for Land-subsidence Control in Beijing Plain, China.” Hydrogeology Journal 26: 1061–1081. doi:10.1007/s10040-017-1712-z.
- Raspini, F., S. Bianchini, A. Ciampalini, M. Soldato, L. Solari, F. Novali, S. Conte, A. Rucci, A. Ferretti, and N. Casagli. 2018. “Continuous, Semi-automatic Monitoring of Ground Deformation Using Sentinel-1 Satellites.” Scientific Reports 8 (1): 7253. doi:10.1038/s41598-018-25369-w.
- Ruiz-Armenteros, A., M. Bakon, M. Lazecky, J. Delgado, J. Sousa, D. Perissin, and M. Caro-Cuenca. 2016. “Multi-Temporal InSAR Processing Comparison in Presence of High Topography.” Procedia Computer Science 100: 1181–1190. doi:10.1016/j.procs.2016.09.278.
- Terzaghi, K. 1925. “Principles of Soil Mechanics, IV—Settlement and Consolidation of Clay.” Engineering News-Record 95: 874–878.
- Yang, Q., Y. Ke, D. Zhang, B. Chen, H. Gong, M. Lv, L. Zhu, and X. Li. 2018. “Multi-Scale Analysis of the Relationship between Land Subsidence and Buildings: A Case Study in an Eastern Beijing Urban Area Using the PS-InSAR Technique.” Remote Sensing 10 (7): 1006. doi:10.3390/rs10071006.
- Zhang, M., L. Hu, L. Yao, and W. Yin. 2018. “Numerical Studies on the Influences of the South-to-North Water Transfer Project on Groundwater Level Changes in the Beijing Plain, China.” Hydrological Processes 32 (12): 1858–1873. doi:10.1002/hyp.13125.
- Zhang, Y., H. Gong, Z. Gu, R. Wang, X. Li, and W. Zhao. 2014. “Characterization of Land Subsidence Induced by Groundwater Withdrawals in the Plain of Beijing City, China.” Hydrogeology Journal 22 (2): 397–409. doi:10.1007/s10040-013-1069-x.
- Zhou, C., H. Gong, B. Chen, F. Zhu, G. Duan, M. Gao, and W. Lu. 2016. “Land Subsidence under Different Land Use in the Eastern Beijing Plain, China 2005–2013 Revealed by InSAR Timeseries Analysis.” GIScience & Remote Sensing 53 (6): 671–688. doi:10.1080/15481603.2016.1227297.
- Zhou, C., H. Gong, B. Chen, W. Li, M. Gao, F. Zhu, W. Chen, and Y. Liang. 2017. “InSAR Time-Series Analysis of Land Subsidence under Different Land Use Types in the Eastern Beijing Plain, China.” Remote Sensing 9 (4): 380. doi:10.3390/rs9040380.
- Zhou, C., H. Gong, Y. Zhang, T. Warner, and C. Wang. 2018. “Spatiotemporal Evolution of Land Subsidence in the Beijing Plain 2003–2015 Using Persistent Scatterer Interferometry (PSI) with Multi-Source SAR Data.” Remote Sensing 10 (4): 552. doi:10.3390/rs10040552.
- Zhu, L., H. Gong, X. Li, R. Wang, B. Chen, Z. Dai, and P. Teatini. 2015. “Land Subsidence Due to Groundwater Withdrawal in the Northern Beijing Plain, China.” Engineering Geology 193: 243–255. doi:10.1016/j.enggeo.2015.04.020.