
ABSTRACT
Rapid economic growth, a high degree of urbanization and the proximity of a large number of desert and semidesert landscapes can have a significant impact on the atmosphere of adjacent territories, leading to high levels of atmospheric pollution. Therefore, identifying possible sources of atmospheric pollution is one of the main tasks. In this study, we carried out an analysis of spatial and temporal characteristics of five main atmospheric pollutants (PM2.5, PM10, SO2, NO2, and CO) near potential source of natural aerosols, affecting seven cities (Wuhai, Alashan, Wuzhong, Zhongwei, Wuwei, Jinchang, Zhangye), located in immediate proximity to the South Gobi deserts. The results, obtained for the period from 1 January 2016 to 31 December 2018, demonstrate total concentrations of PM2.5 and PM10 are 38.2 ± 19.5 and 101 ± 80.7 μg/m3 exceeding the same established by the Chinese National Ambient Air Quality Standard (CNAAQS), being 35 and 70 μg/m3, respectively. Based on the data from Moderate Resolution Imaging Spectroradiometer (MODIS) for the whole period, Clean Сontinental (71.49%) and Mixed (22.29%) types of aerosols prevail in the region. In the spring and winter seasons maximum concentrations of pollutants and high values of Aerosol Optical Depth (AOD) in the region atmosphere are observed. PM2.5 and PM10 ratio shows the presence of coarse aerosols in the total content with value 0.43. The highest concentrations of pollutants were in the period of dust storms activity, when PM2.5 and PM10 content exceeded 200 and 1000 µg/m3, and AOD value exceeded 1. UV Aerosol Index (UVAI), Aerosol Absorbing Optical Depth (AAOD), and Single Scattering Albedo (SSA), obtained from Ozone Monitoring Instrument (OMI), demonstrate the high content of dust aerosols in the period of sandstorms. Analysis of backward trajectories shows that dust air masses moved from North to Northwest China, affecting large deserts such as Taklamakan, Gurbantunggut, Badain Jaran, Tengger, and Ulan Buh deserts.
1. Introduction
Principal air pollutants, formed both in the course of anthropogenic activity, and as a result of natural processes, are nitrogen dioxide (NO2), sulfur dioxide (SO2), carbon monoxide (CO), solid particles – aerosols or particulate matters (PM2.5 and PM10). Aerosols and gaseous pollutants affect the absorption and scattering of solar radiation, thus affecting energy balance of the earth-atmosphere system and, consequently, climate changes (Lian et al. Citation2015; Sun and Zhang Citation2016; Hou et al. Citation2019). Aerosol affects not only atmospheric radiation but also air quality (Filonchyk et al. Citation2018a, Citation2019a), atmospheric visibility (Song et al. Citation2015), cloud formation (Shi et al. Citation2017; Huang et al. Citation2018a; Asl, Farid, and Choi Citation2019) as well as animals (Hime, Marks, and Cowie Citation2018). It has been clearly shown that high content of PM2.5 adversely affects human health (Schwartz, Dockery, and Neas Citation1996; Nagpure, Gurjar, and Martel Citation2014; Ma et al. Citation2016a; Khaniabadi et al. Citation2017; Dhital and Rupakheti Citation2019). Thus, capability to obtain precise time-space distribution of surface concentrations of pollutants is an important prerequisite for efficient reduction and prevention of pollution.
Air pollution problems arise in many countries of the world, and China could not avoid this serious problem either. It has undergone a great economic development for the last several decades, which led to a significant impact on environment and deterioration of air quality in many cities of the country (Lian et al. Citation2015; Song et al. Citation2015; Ma et al. Citation2016b; Wang et al. Citation2017; Zhang et al. Citation2018; Lindner and Pitombo Citation2019). Permanent deterioration of air quality in many cities of the country is causing concern of the China government. A lot of studies, carried out in China, showed that many cities of the country suffer over pollution of city’s air basin (Lian et al. Citation2015; Song et al. Citation2015; Huang, Yan, and Zhang Citation2018b). However, most are aimed at studying atmospheric pollution over the highly developed and densely populated eastern and southern regions of the country, including North China Plain, Yangtze River Delta, Pearl River Delta, and Sichuan Basin (Hu et al. Citation2014; Sun et al. Citation2014; Chen, Luo, and Xie Citation2015; Kuang et al. Citation2016; Ma et al. Citation2016b; Zhang et al. Citation2018; Liu et al. Citation2019). However, besides anthropogenic activity, leading to high pollution levels, natural aerosol sources also significantly affect local and regional air quality. Thus, large sandstorms, may have a considerable impact far from the epicenter of its formation, reaching such large cities as Shanghai (Fu et al. Citation2010; Wang et al. Citation2018), Beijing (Sun et al. Citation2014), Taipei (Tsai et al. Citation2014), Wuhan (He and Yi Citation2015), Chengdu (Chen, Luo, and Xie Citation2015). Thus, air pollution in China is not only one of the key environmental issues, but also becomes one of the most important national problems of the country (Jin, Andersson, and Zhang Citation2016; Wang et al. Citation2016; Huang et al. Citation2018a). At that accelerated urbanization, transportation of polluted air masses for long distances permanently complicate searching of pollution sources (Fu et al. Citation2010).
China is known to have one of the largest areas, covered by desert and semidesert landscapes. Notwithstanding that many studies of pollutants and aerosol optical properties over various surface areas were carried out, however, studies, focused on spatial and temporal distribution of air pollutants investigation near and inside large sources of natural aerosols are very limited. There were conducted some studies of cities near the Taklamakan Desert (Yu et al. Citation2019a), or pollution in the capital cities of the provinces of Northwestern and Northern China (Filonchyk et al. Citation2018a, Citation2019a), as well as the total aerosol loading of the territory (Aili and Oanh Citation2015; Zhou et al. Citation2019) ignoring other major cities special in the Gobi Desert region. Therefore, it was decided to conduct a study covering large cities in the region (Wuhai, Alashan, Wuzhong, Zhongwei, Wuwei, Jinchang, Zhangye), which, due to their close location, may be influenced by the atmosphere of the Gobi Desert.
The goal of this study is to fill this gap, providing a comprehensive characteristic of air quality and aerosol optical properties both in local and regional scales. Therefore, this study investigates spatial and temporal variations of atmospheric pollutants in the period from 1 January 2016 to 31 December 2018, uses data on PM2.5, PM10, SO2, NO2, and CO, obtained based on data from 18 air quality monitoring stations, located in seven cities of the southern part of the Gobi Desert. Predominant aerosol types in the region are studied based on satellite data. To analyze Aerosol Optical Depth (AOD), Single Scattering Albedo (SSA), Aerosol Absorbing Optical Depth (AAOD), and the UV Aerosol Index (UVAI) during large dust storms (3–4 May 2017 and 2–3 December 2018), Moderate Resolution Imaging Spectroradiometer (MODIS) and Ozone Monitoring Instrument (OMI) were used. With analysis of backward trajectories with use of Hybrid Single-Particle Lagrangian Integrated Trajectory (HYSPLIT) ways and potential regions of dust storms formation sources were also studied. Navy Aerosol Analysis and Prediction System (NAAPS) were used to study quantitative estimation of dust aerosols contribution into the overall air pollution in the period of high dust activity.
2. Materials and methods
2.1. Study area
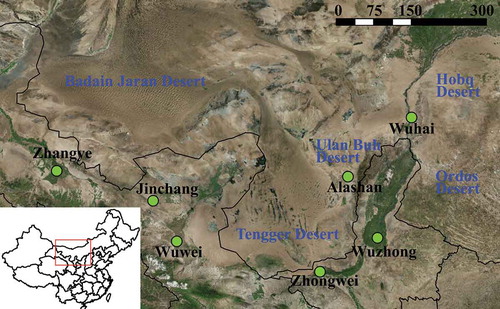
In order to study atmospheric pollution near the South Gobi Desert the following seven cities were selected: Wuhai, Alashan, Wuzhong, Zhongwei, Wuwei, Jinchang, Zhangye (). Wuhai (N39°67′ E106°82′), a city with population of 561 thousand people, located in the Inner Mongolia Autonomous Region, is situated along the upper reaches of the Yellow River between the Gobi and Ordos Deserts. Alashan (N38°85′ E105°68′) with population of 245.7 thousand people is situated in the most western part of the Inner Mongolia Autonomous Region between the Badain Jaran, Tengger and Ulan Buh deserts, lying across its area. Wuzhong (N37°99′ E106°21′) with population of 1,437 million people is situated in the central part of the Ningxia Autonomous Region and lies between the Ordos Desert and the Loess Plateau. Zhongwei (N37°51′ E105°18′) with population of 1,214 million people is situated in the western part of the Ningxia Autonomous Region at the intersection of Ningxia, Inner Mongolia, and Gansu provinces. Wuwei (N37°94′ E102°61′), a city with population of 1,825 million people, lies in the central part of Gansu Province, is situated at the intersection of three plateaus: Qinghai–Tibet, Loess, and Mongolian plateau. Jinchang (N38°29′43″ E102°10′26″) with population of 469.2 thousand people is situated in the central part of Gansu Province west of the Yellow River, north of the Qilian Mountains and south of the Alashan Plateau. Jinchang and Wuwei are surrounded by the Tengger Desert in the east. Zhangye (N38°93′ E100°46′) with population of 1,224 million people is situated in the northwest part of Gansu Province surrounded by the Tengger Desert in the east and the Badain Jaran Desert in the northeast.
Figure 1. Geographic location of the study site and five main deserts of the South Gobi region.
2.2. Ground-based air pollutants concentration data
Data on atmospheric pollutants were provided by the Ministry of Environmental Protection of the People’s Republic of China (MEP) and obtained from 18 national air quality monitoring stations, located in seven cities (Wuhai – three monitoring sites, Alashan – three monitoring sites, Wuzhong – three monitoring sites, Zhongwei – three monitoring sites, Wuwei – one monitoring site, Jinchang – three monitoring sites, Zhangye – two monitoring sites), which report about concentrations of air pollutants in accordance with Chinese National Ambient Air Quality Standard (CNAAQS) GB3095-2012. This study used hourly data on concentration of solid fine particles with diameter less or equal to 2.5 μm (PM2.5) and diameter less than 10 μm (PM10) as well as gaseous pollutants (NO2, SO2, and CO).
Daily data were obtained by averaging out of hourly data, monthly data – by averaging out of daily data, seasonal data – by averaging out of daily data per each season of the year (winter – December, January, and February; spring – March, April, and May; summer – June, July, and August; autumn – September, October, and November), and annual data – by averaging out of daily data for the entire calendar year.
2.3. Satellite and model simulation products
To study aerosol load of the area, dust, and aerosol transport in the regional scale, the following satellite products were used: Moderate Resolution Imaging Spectroradiometer (MODIS), NOAA-HYSPLIT (National Oceanic and Atmospheric Administration-Hybrid Single-Particle Lagrangian Integrated Trajectory), Navy Aerosol Analysis and Prediction System (NAAPS), Cloud–Aerosol Lidar with Orthogonal Polarization (CALIOP) as well as OMI (Ozone Monitoring Instrument).
MODIS level 2 Сollection 6.1 aerosol product at 550 nm data, on-board at Terra satellite, was used. MODIS is a 36-channels spectrometer, forming an image in the wavelength range of 0.4–14.4 μm. The width of the device’s scan area is 2,330 km and provides for daily global supervision of the area of extra-tropical latitudes. For AOD reconstruction over land, a reflected solar radiation at wavelength of 0.412, 0.47, and 0.66 μm is used (Hsu et al. Citation2013). Spatial resolution of 10 × 10 km and 1 × 1°, the expected error is ±(0.03 + 0.2× AODAERONET) (Sayer et al. Citation2013) over land. This study uses daily MODIS AOD data, obtained with Deep Blue algorithm (Hsu et al. Citation2013), which is better suited for desert regions.
OMI, installed aboard of Aura satellite, features a great scanning width (2600 km) and high space resolution (0.25 × 0.25°). The study used OMI Near-UV Aerosol Algorithm (OMAERUV), which extracts Aerosol Absorbing Optical Depth (AAOD), Single Scattering Albedo (SSA) and the UV Aerosol Index (UVAI) at 388 nm over cloudless scenes (Torres et al. Citation2007) and cloud sky (Hammer et al. Citation2016). Reliable AAOD, UVAI, and SSA extractions require clear sky, since reflective power of clouds causes errors in the obtained aerosol parameters. The comparison of OMAERUV products with 44 ground-based stations AERONET AOD demonstrates an expected tolerance of search about 30% with slope, and intercept of the regression between OMAERUV and AERONET AOD were 0.74 and 0.15. OMI SSA product agrees with AERONET to an accuracy of 0.03 in 50% of coinciding pairs and to an accuracy of 0.05 in 75% of cases (Ahn, Torres, and Jethva Citation2014).
NAAPS is a real-time operational system, predicting the concentration of sulfate, dust, and smoke aerosols in troposphere (Christensen Citation1997), which was developed by Naval Research Laboratory (NRL) in Monterey. It allows to make global prediction and rapid analysis of aerosols. The output data of NAAPS model are available in space resolution 1 × 1° with 6-h intervals and 24 vertical levels, reaching 100 hPa. NAAPS model uses global meteorological fields, obtained from Navy Operational Global Atmospheric Prediction System (NOGAPS) (Hogan and Brody Citation1993). This study uses NAAPS model, which simulates images of surface dust concentration (µg/m3).
CALIOP (Cloud-Aerosol Lidar with Orthogonal Polarization) was used to study the vertical distribution of aerosols. CALIOP is on-board CALIPSO satellite that was launched on 28 April 2006 as part of an integrated program of NASA EOS (Earth Observing System) and is designed to study radiative effects clouds and on climate aerosols. СALIOP measures vertical profiles of aerosol at 532 and 1064 nm, respectively, at night and daytime. It provides detailed information on the vertical distribution of aerosols, clouds, and classification of aerosol size (Winker et al. Citation2013).
NOAA-HYSPLIT model is one of the most widely used models of air transport and dispersion (Draxler and Rolph Citation2003; Stein et al. Citation2015). Its main purpose is backward trajectory analysis to determine air masses origination and establishment of source-end point relationship. HYSPLIT model is also used in various simulations, describing air transport, dispersion, and sedimentation of pollutants and hazard substances. The study used 72-h backward trajectories of air masses, calculated at three different heights of 500, 1500, 2500 m above ground, which use reanalysis archived data from the Global Data Assimilation System (GDAS).
3. Results and discussion
3.1. Spatial-temporal change of particulate matter and gaseous air pollutants concentrations
Observations for pollutants concentrations in atmosphere are made according to uniform standards, established by the Ministry of Environmental Protection. The CNAAQS GB3095-2012 includes two classes of tolerability limits for pollutants concentrations. Class 1 standards are applied to specific regions, such as national parks, class 2 standards are applied to all other regions with industrial and urban districts. According to CNAAQS, 24 h mean concentrations for two classes are 35 and 75 µg/m3 for PM2.5, 50 and 150 µg/m3 for PM10, 80 µg/m3 for NO2, 50 and 150 µg/m3 for SO2, 4 mg/m3 for CO, respectively.
3.1.1. Total concentration of particulate matters and gaseous pollutants
In order to establish annual differences in pollution and describe the total number of days, exceeded the set standards on air quality, on hourly concentrations of principal pollutants in Wuhai, Alashan, Wuzhong, Zhongwei, Wuwei, Jinchang, and Zhangye, their annual mean values (±standard deviation), presented in , were calculated. Total concentrations of SO2, NO2, and CO in the region were 24.2 ± 16.5 µg/m3, 21.9 ± 7.8 µg/m3, and 0.78 ± 0.25 mg/m3, respectively. Besides, concentrations of PM2.5 and PM10 generally for the region were 38.2 ± 19.5 and 101 ± 80.7 µg/m3, which exceeded the set class 1 standard. Daily mean PM2.5 values exceeded the set class 1 norms in 44.1% of days (484 days) and class 2 norms in 4.47% of days (47 days) of monitoring, and for PM10 the set classes 1 and 2 norms were exceeded in 86.13% (944 days) and 11.4% (125 days) of monitoring days. At that PM2.5 and PM10 concentrations demonstrate the similar tendencies in their formation. Thus, on 2 December 2018 mean PM2.5 concentration in seven study cities was 190 µg/m3, and PM10 – 875.7 µg/m3, however, significant differences in concentrations per cities were observed, while maximum values were in Wuwei (PM2.5–271 µg/m3 and PM10 – 1,496 µg/m3), Zhongwei (PM2.5–198 µg/m3 and PM10 – 1,130 µg/m3), and Wuzhong (PM2.5–188 µg/m3 and PM10 – 1,078 µg/m3), which demonstrates the similar sources of pollutants formation, but with various degree of intensity.
Table 1. Annual average concentrations (±standard deviation) of air pollutants (µg/m3 for PM2.5, PM10, NO2, SO2 and mg/m3 for CO) in the seven cities.
Interestingly, in some cities there was a decrease from year to year over the established CNAAQS standards, in others, an increase or alternation between a decrease and an increase (Table S1). For Wuhai and Alashan, there is a decrease in days when the concentration of PM10 is higher than the established standards, in Wuzhong, Zhongwei, Wuwei, and Zhangye, the greater number of days was in 2017 with a decrease by 2018 and only in Jinchang there is a constant decrease in days with a concentration of PM10 exceeding class 1 standards. For PM2.5, a similar picture of days with exceeding standards is observed, in Alashan there is an increase in the number of days, in Wuzhong and Jinchang a decrease is clearly visible, and in Wuhai, Zhongwei, and Zhangye there is an alternation. In general, the table shows that there are still a large number of days in the year that the established standards for PM are exceeded, which causes some concern.
Study of pollutants concentration in the cities demonstrates that the highest values of air pollution were in Wuhai, and the lowest ones in Alashan (). Daily mean PM2.5 and PM10 concentrations in Wuhai were 43.9 ± 25.6 and 113 ± 85.4 µg/m3, at the same time there was a gradual decrease of PM2.5 values (from 46.5 ± 29.2 µg/m3 in 2016 to 40.8 ± 21.7 µg/m3 in 2018) with simultaneous increase of PM10 values (from 109.7 ± 69.9 in 2016 to 113 ± 85.4 µg/m3 in 2018). In Wuzhong, Zhongwei, and Wuwei daily mean PM2.5 and PM10 concentrations exceeded the set class 1 standards and were 43.5 ± 30 and 104.9 ± 89.6, 41 ± 27.3 and 107.5 ± 112.5, 41.4 ± 32.1 and 110.9 ± 141.4 µg/m3, respectively. The highest values of gaseous pollutants were also in Wuhai, where 3-years mean SO2, NO2, and CO concentrations were 46.9 ± 41 µg/m3, 29.2 ± 14.5 µg/m3 and 1 ± 0.48 mg/m3, respectively. Generally, besides Wuhai, in all study cities gaseous pollutants did not exceed the set CNAAQS standards.
3.1.2. Seasonal variations in atmospheric pollutant concentrations
This study also investigated a seasonal behavior of pollutants distribution in the cities in questions. Calendar year was classically divided into four seasons, such as winter, spring, summer, and autumn. Meanwhile, winter is characterized as a primary heating period with a high amount of secondary aerosol emissions from residential and industrial premises typically heated by coal and oil. Winter and spring are characterized by frequent sandstorms (Filonchyk et al. Citation2019a) with predominance of primary, mainly coarse aerosols (Khaniabadi et al. Citation2017). Summer and spring periods are interim seasons between the dusty and the heating seasons and are characterized by frequent biomass burning from agricultural activity (Reid and Hobbs Citation1998). shows seasonal changes of particulate matter (PM2.5 and PM10) and three gaseous pollutants (SO2, NO2, and CO). As is seen from the , PM2.5 and PM10 concentrations demonstrate similar pollution trends in all the cities, except for Alashan, while the highest PM2.5 and PM10 concentrations were in winter and spring periods, and the lowest concentrations were in summer. High PM levels in winter and spring may be caused by natural factors, such as sandstorms from strong winds. Since the study region is situated in the southern part of the Gobi, including such deserts as the Badain Jaran, Tengger, Ordos, and Ulan Buh Hobq deserts, the great amount of dust air masses may be transferred from the deserts to the surrounding cities, which plays a key role in atmospheric pollution of the region from coarse particles. Dry windy weather in winter and spring contributes to favorable conditions for wind erosion of soil, which under the action of air masses may blow up fine earth particles and carry them over great distances to the neighboring regions of the country. In winter in all the cities, except for Alashan, PM2.5 concentrations are higher, than in spring. This is attributed to the extensive burning of hydrocarbons for premises heating in winter, while the highest concentrations were in Wuwei (57.1 µg/m3) and Wuzhong (56.7 µg/m3). The lowest PM2.5 and PM10 (35.4 and 74.2 µg/m3) concentrations in winter were in Alashan, which is attributed to the impact of local pollution sources and less anthropogenic activities (as compared to other cities of the region) due to low number of population. It was noted that during winter and spring PM10 concentrations in the south and southwest parts of the region were the highest (Wuwei 141.5 µg/m3, Zhongwei 124.8 µg/m3, and Wuzhong 123.3 µg/m3), demonstrating the direct influence of near-by sources of coarse dust, namely the Tengger Desert, which may directly affect the atmosphere of the region cities.
Figure 2. Seasonal mean concentrations of pollutants in the seven cities.
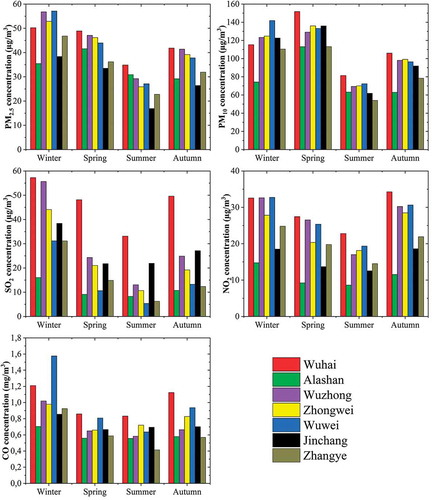
Daily mean concentrations of gaseous pollutants had U-shape just like PM, with maximum concentrations in winter and autumn seasons, and minimum concentrations in spring and summer seasons. This may point to the fact that anthropogenic emissions and meteorology may affect seasonal variation of NO2, SO2, and CO. Based on the data, obtained from the European Center for Medium-Range Weather Forecasts (ECMWF) ERA-Interim, which is a global atmospheric reanalysis, in the region these seasons were characterized by the lower wind velocities and low air temperatures, making the atmosphere more sustainable, which does not contribute to distribution of pollutants from a source of pollution to other sites. Besides, burning of fossil fuel may also contribute to increase of pollutants concentration in atmosphere during these periods due to active continuous heating in winter and commencement of heating period in autumn (late October–November) (Filonchyk and Yan Citation2018b). The highest SO2 values were registered in Wuhai (57.2 µg/m3), Wuzhong (55.9 µg/m3), and Zhongwei (44 µg/m3), suggesting that SO2 is a primary gaseous pollutants, which raises some concern now. SO2 is formed at fossil fuel burning during various kinds of anthropogenic and agricultural activities, including animal farming, well developed in these cities and adjacent areas. Autumn high SO2 concentrations are formed from burning of a large amount of biomass (straw) and grass in the process of agricultural activity (Lian et al. Citation2015). Relatively easy air pollution in summer is predominantly attributed to lack of necessity in premises heating, better diffusion in atmosphere and wetter sedimentation (Hou et al. Citation2019). Also the primary source of SO2 formation in all the seasons is industrial burning of crude hydrocarbons with great predominance of coal (Kerimray et al. Citation2017). NO2 and CO concentrations in all the cities were not considerable and mainly originate from exhaust gases of automobiles and industrial activity (Filonchyk and Yan Citation2018b; Huang, Yan, and Zhang Citation2018b). Low values of the concentrations may be attributed to agricultural orientation of the cities as well as the low degree of urbanization and industrialization. Wuwei is the large automobile and railway hub, connecting the central and northwest China, and the highest CO concentration is observed here, especially in winter, due to high traffic (1.57 mg/m3). It may be concluded that the size of a city, number of population and traffic may give a good explanation of differences in atmosphere pollution levels in the seven cities.
3.1.3. PM2.5 and PM10 ratio
To find out, fractions of what size dominate in the atmosphere of the region cities, PM2.5/PM10 ratio was determined (Zhou et al. Citation2016; Filonchyk and Yan Citation2018b). At the quantitative sampling of 1,097 days of samples collection PM2.5/PM10 ratio was 0.43, while the highest values were in spring (March – 0.41, April – 0.37, and May – 0.37) (Table S2), suggesting that PM10 contributes significantly to the total content of particulate matter in the study region in the period in question. High PM2.5/PM10 ratio in winter (December – 0.48, January – 0.49, and February – 0.47) may be attributed to the predominance of PM2.5 emissions, formed as a result of fossil fuel burning for heating the premises (Zhang et al. Citation2018; Filonchyk et al. Citation2019a). The lowest PM2.5/PM10 ratios are observed in spring in Jinchang (0.27–0.3), Wuhai (0.33–0.41), Zhangye (0.35–0.36), and Wuwei (0.36–0.39), indicating the predominance of dust aerosols. In winter and summer in Alashan PM2.5/PM10 ratios were higher, than in other cities of the region as it is subject to the higher influence of local sources of secondary aerosols formation, received as a result of fossil fuel burning in winter and high photochemical reactions in summer due to high temperatures. In general, high values of PM2.5/PM10 ratios may also be attributed to vehicles emissions and secondary particles, formed in the atmosphere from gases due to photochemical processes (Chen, Luo, and Xie Citation2015), while lower ratios are associated with violent dust emissions from the regions of Northwest and North China in spring (He and Yi Citation2015; Jing et al. Citation2017; She et al. Citation2018), which are formed due to wind erosion and under the action of concurrent air masses carry dust to the study region (Sarkar and Mishra Citation2018; Kannan et al. Citation2019). It also may be concluded that the difference in pollutants concentration in the cities may be associated with their geographical locations, relief, and pollution sources. With that it may be noted that the primary pollutant in all the cities is PM10 indicating the predominance of dust aerosols in atmospheric pollution of air basins of the cities.
It is quite interesting to study the relationship between PM2.5 and PM10, which not only sheds light on the characteristic of atmospheric particulates source, but also may facilitate to assess the situation with PM2.5. Upon conducting a linear regression from 1,097 groups of valid samplings, correlation ratio (R) was calculated as 0.828 (p < 0.05) (Table S2), which emphasizes a high correlation relationship between PM2.5 and PM10 in all the cities. Three-years monthly mean values of the correlation demonstrate a wide range of values from 0.452 to 0.981, while the low correlation was in February in Wuzhong (0.452) and Wuhai (0.511) as well as in May (with peak in Alashan [0.965], Jinchang [0.961]), June (Zhangye [0.981]), and July (Wuzhong [0.969]), suggesting that in warm season PM2.5 and PM10 formation occurs from similar sources. Besides, PM2.5 has a strong correlation with PM10 in all four seasons. This suggests that in wet and dry weather conditions, relatively high and low temperatures, in different synoptical weather conditions, sources of PM2.5 and PM10 formation have less divergence between different seasons.
3.2. Characteristic of aerosol optical depth and aerosols types classification from satellite observation
This study used AOD and Angstrom exponent (AE), two basic parameters to understand aerosol characteristics. AOD is the main characteristic of atmospheric aerosol turbidity, characterized by light attenuation in the medium due to its absorption and scattering. AE is the main indicator, which enables to determine particles size in atmosphere. AE values less than 1 suggest the predominance of coarse fraction aerosols, and AEs more than 1 suggest the predominance of fine fractions particles (Schuster, Dubovik, and Holben Citation2006). The predominant aerosol types in the atmosphere of the region may be identified based on interaction between AOD and AE.
3.2.1. Total aerosol loading of the territory
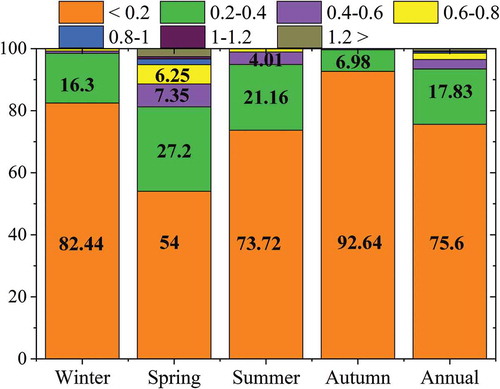
To study aerosol properties on the study area, data from MODIS (Terra) satellite based on Deep Blue algorithm was used as it is best suited for investigation of bright surface areas, featured by the selected territory (Hsu et al. Citation2013). Validation of MODIS AOD data with data, obtained from ground-based AERONET observations, was not carried out because of sufficient number of studies with comparison of data over bright surface areas near the study area (Filonchyk et al. Citation2019b), the results of which suggest that 76.3% of all obtained data in the period from 2006 to 2012 (695 pairs) are within the expected tolerance ±0.03 ± 0.2× AODAERONET (Sayer et al. Citation2013) for MODIS (Terra) data over land. demonstrates 3-years mean and seasonal AOD values over the South Gobi area. It is evident from the figure that the highest mean AOD values are over the area of the Tengger Desert with peak value 0.332 ± 0.089 at average values in the region 0.156 ± 0.101. Frequency of daily distribution of AOD () suggests that in 75.6% (818 of 1,082 days) of all days of sampling AOD values do not exceed 0.2, indicating the predominance of conditions with low aerosol load of the area. In 17.8% (193 days) of days AOD values ranged from 0.2 to 0.4, and only in 6.56% (71 days) of all days of sampling AOD values exceeded 0.4 (in 3% [33 days] of days AOD values ranged 0.4–0.6, in 2% [22 days] of days they ranged 0.6–0.8, in 0.55% [6 days] of days they ranged 0.8–1, in 0.18% [2 days] of days they ranged 1–1.2, AOD over 1.2 constituted 0.73% [8 days] of all days of sampling), suggesting air pollution.
Figure 3. Mean ((a) and seasonal (b) – winter, (c) – spring, (d) – summer, (e) – autumn) AOD change (550 nm) in the South Gobi region for 2016–2018.
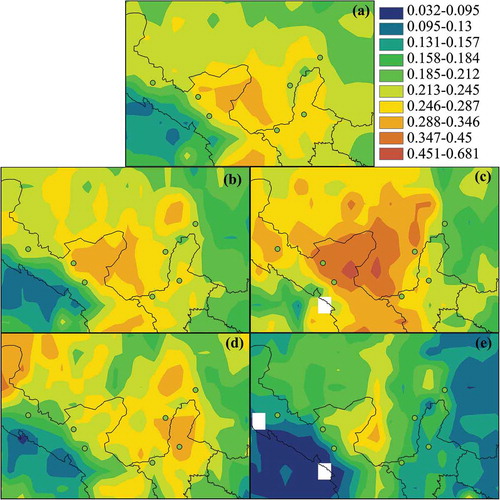
Figure 4. Frequency distribution (in %) of AOD in the region.
Multiangle Imaging Spectroradiometer (MISR) aerosol product is very well optimized for dust aerosol detection over Asian desert areas such as Yu et al. (Citation2019b) by using multi-angle measurement, which enables to distinguish non-spherical aerosol shape of dust with other aerosol types. Therefore, it was decided to conduct a spatial correlation between the MISR and MODIS data. Since the global MISR product has a higher resolution (0.5 × 0.5°) compared to MODIS (1 × 1°), the spatial resolution of MODIS was converted to the MISR value by reselecting the nearest neighbors. Each pixel in MODIS was divided into four identical pixels with a size of 0.5 × 0.5°, after which the correlation coefficient for each pixel was calculated. The results showed that over the desert regions (Gobi Desert and Tarim Basin) a good correlation was demonstrated (Figure S1), which indicates the similarity of the search algorithms. The low correlation values in some desert areas are explained by the high surface reflectance or lack of AOD data from one of the tools above the corresponding zones. Despite this, the AOD data obtained by different tools were similar in most areas.
3.2.2. Seasonal changes and frequency distribution of aerosol optical depth
Seasonal values of AOD distribution are similar to seasonal changes in PM concentrations with maximum values in spring. With mean AOD value in the region equal to 0.302 ± 0.277 its values varied from 0.128 ± 0.085 in the northeast to 0.621 ± 0.325 in the region of the Tengger Desert. Frequencies of daily AOD values in the spring, not exceeding 0.2, were in 54% (147 of 272 days) of days, varying from 0.2 to 0.4 – in 27.2% (74 days) of days, from 0.4 to 0.6 – in 7.35% (20 days) of days, and only in 11.39% (31 days) of all days of sampling AOD values exceeded 0.6 (AOD values, varying from 0.6 to 0.8, were in 6.25% [17 days] of days, 0.8–1 were in 1.83% [5 days] of days, 1–1.2 were in 0.73% [2 days] of days, AOD over 1.2 were in 2.5% [7 days] of all days of monitoring). In this period atmosphere experienced the highest loads, when its dustiness was felt most obviously. High spring values were predominantly associated with high frequency of dust storms in this season. And in this period dust storms affect not only the cities of the study region but also other cities of the country (Filonchyk et al. Citation2018a). Spatial distributions of AOD values were similar in winter and summer seasons, but in winter AOD values were higher, than in summer with values 0.152 ± 0.082 and 0.165 ± 0.113, respectively. Frequencies of daily AOD values in the region in the both seasons did not exceed 0.8 (). Days with clean air, when AOD values did not exceed 0.2, constituted 82.44% (216 of 262 days) and 73.72% (202 of 274 days) of all days of monitoring, AOD values ranged from 0.2 to 0.4 constituted 16.3% (42 days) and 21.16% (58 days) of days, from 0.4 to 0.6 constituted 0.76% (2 days) and 4% (11 days) of days, ranged from 0.6 to 0.8 were observed in 0.76% (2 days) and 1% (3 days) of all days of monitoring for aerosols in winter and summer, respectively. Ultimately, autumn is the season with the lowest atmosphere load (with AOD values 0.122 ± 0.11) and is characterized by the highest frequency of AOD, not exceeding 0.2, when low AOD values were registered in 92.64% (252 of 272 days) of days and only in 6.98% (19 days) of days of monitoring AOD values were ranged from 0.2 to 0.4, and only 1 day (0.36%) AOD values were ranged from 0.8 to 1.
The vertical distribution measurement from the CALIOP sensor on board CALIPSO satellite could be helpful to understand the vertical distribution aerosol particles (Figure S2). The results demonstrate that aerosol particles can rise to higher heights in spring and summer due to strong vertical transport, as well as high summer temperatures, which can result in hygroscopic growth of aerosol particles, which can lead to high AOD values. Relatively weak vertical movement in winter and autumn affects the formation of stagnant zones in the atmospheric surface layer, leading to higher surface concentrations of pollutants compared to spring and summer (Chen et al. Citation2019; Filonchyk et al. Citation2019b). It is interesting, the surface concentration of PM2.5 takes into account the total mass concentration when aerosol particles have a diameter of less than 2.5 microns. Therefore, coarse particles (mineral dust) usually make up only a small percentage of the total mass, but can make a significant contribution to the value of AOD. This fact may lead to different seasonal variations for PM and AOD (Ma et al. Citation2016b). Generally, the obtained data suggest that the highest aerosol load of the region area was predominantly in spring period. Sources of high aerosol pollutions have similar nature of formation with particulate matter and other gaseous pollutants, discussed in Section 3.1.
3.2.3. Aerosol type classification and their contributions
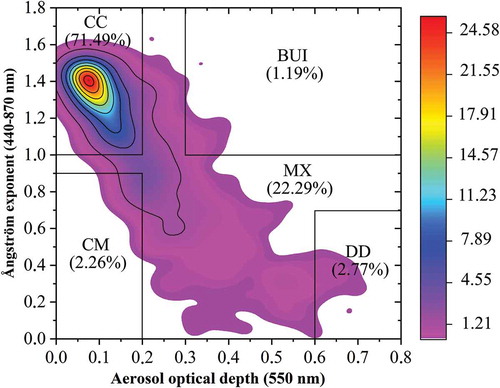
For aerosol type identification a method of AOD and AE relationship was applied. It was used in a number of studies (Boiyo, Kumar, and Zhao Citation2018; Rupakheti et al. Citation2019) and is based on the sensitivity of two wavelength-dependent parameters to various microphysical aerosol properties. It is noteworthy that AOD predominantly depends on aerosol column density, and AE – on aerosol particles size. In light of this, different aerosol types are distinguished by physically interpretable individual cluster regions, divided with solid lines, which act as relative threshold values of AOD and AE. The following five-types aerosol classification was selected: Clean Marine (CM) (AOD <0.2; AE <0.9), Clean Continental (AOD <0.2; AE> 1.0), Biomass Burning/Urban Industrial (BUI) (AOD>0.3; AE>1.0), the Desert Dust (DD) (AOD> 0.6; AE <0.7), Mixed aerosol (MX), not included in either of the listed groups. shows the presence of various aerosol types in the study region, for which classification daily mean values of AOD and AE were used. Upon a closer view of contour density plots, between AOD and AE there are areas of maximum density, representing СС and MX aerosol types (). MX aerosol type is a result of mixture of particles of various size, pertaining to different sources. In view of the fact that this region does not have a high density of population and, consequently, high anthropogenic activity, BUI aerosol type’s impact is less remarkable. Although the territory of the study region features large desert landscapes, DD aerosol type impact is also insignificant, which may be attributed to the decrease of sandstorms number from year to year. Because of high remoteness of the region from the sea, CM aerosol type also insignificantly impacts the region.
Figure 5. Contour density maps of the AOD (550 nm) versus AE (440–870 nm) in the period 2016–2018 for indicating major aerosol type in the South Gobi region. Figures in brackets demonstrate a percentage of each type of aerosols in the total amount for the entire study period.
3.3. Ground-based and satellite observation of dust storm characteristics
3.3.1. Characteristic of aerosol pollution based on data from ground-based stations for air quality monitoring
Two intensive dust events, which covered a large area, were observed in the period 3–5 May 2017 and 2–3 December 2018, suggesting that dust events in the north and northwest part of China may occur both in spring and in winter. In the period of dust events horizontal and vertical visibility was decreased, air quality deteriorated, thus adversely affecting the health of all living things (Ma et al. Citation2016b; Khaniabadi et al. Citation2017; Dhital and Rupakheti Citation2019). Supposedly, the main reasons of such violent atmosphere storms formation may be the impact of different weather fronts, which carried a great amount of dust from the deserts of Gobi and the Tarim Basin, leading to intensification of convective air motion and development of whirling motion. This period featured a sharp increase of particulate matter with maximum concentrations of PM2.5 and PM10, exceeding the set CNAAQS standards. In many cities of the region PM10 concentrations in the very peak of a dust storm was 280–1496 µg/m3, and PM2.5 – 49-326 µg/m3, suggesting the presence of heavy atmosphere pollution wit predominance of coarse dust (Table S3). Besides, the highest daily mean concentrations of PM2.5 and PM10 during the dust storm, occurred from 3 to 5 May 2017, were registered on 3 May in Jinchang (245 and 1001 µg/m3) and 4 May in Wuhai (253 and 1070 µg/m3) and Alashan (244 and 1054 µg/m3), which is 3.2 and 6.5 times higher than CNAAQS class 2 (GB3095-2012). In other cities in this period PM concentrations also exceeded class 2 standards. It may be concluded that under the action of western air masses the dust storm moved from west to east and on the way of its movement significantly affected aerosol pollutions of the region area. A similar dust storm was registered in the period 2–3 December 2018, however, with respect to the dust storm of 3–5 May 2017 the peak PM values in this period were registered in other cities. On 2 December 2018 maximum PM values were in the region of the Tengger Desert as well as the adjacent cities with the similar geographical location, such as Wuwei, Zhongwei, and Wuzhong, where changes in the values of PM2.5 and PM10 concentrations were similar with peak concentration values 271 and 1496 µg/m3, 198 and 1130 µg/m3, 159 and 1078 µg/m3, respectively, which is 3–5 and 7–9 times higher than CNAAQS class 2 for PM2.5 and PM10. PM concentrations in these cities were the highest in this period (2–3 December 2018), because Wuwei, Zhongwei, and Wuzhong are situated in immediate proximity to the Tengger Desert and, thus, the desert dust directly impacts the air quality with gradual decrease in all directions. Despite a clearly defined spatial distribution of PM, even cities outlying the Tengger Desert also suffer atmosphere pollution and exceedance of values set by CNAAQS. Besides, fine and hard dispersed aerosol particles may be emitted into atmosphere from different sources and may have different physical and chemical properties, therefore study of PM2.5/PM10 ratio may provide information about the origin of these particles (Filonchyk et al. Citation2018a). High values of PM2.5/PM10 ratio suggest the predominance of anthropogenic sources in the overall pollution, and the lower ones suggest the predominance of natural sources, such as dust storms. Compared to results, obtained during normal days, PM2.5/PM10 ratio during sandstorms decreased with change in solid particles concentration (Table S3). This effect was caused by the difference between a region and a source of atmospheric emissions. Coarse particles prevail in the total PM content, coming predominantly from soil and sand dust as a result of erosion.
3.3.2. Satellite observation and dust storm characteristics
3.3.2.1. Aerosol optical depth
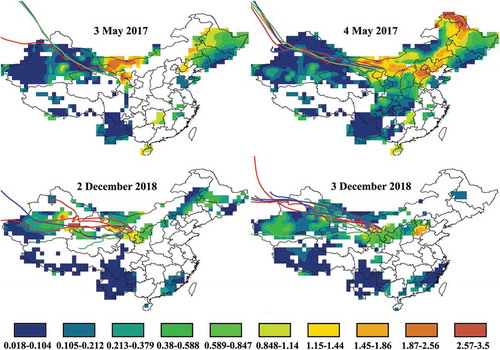
shows spatial distribution of MODIS AOD during dust events, where daily mean AOD values are marked with color, while white spots mean absence of AOD data. The Figure clearly shows intensive foci of high AOD values over the Gobi Desert, covering all cities of the region on 3–4 May 2017. It can be observed that the dust flow moved in north-eastern and eastern directions through Inner Mongolia and Hebei provinces, reaching the metropolitan area (Beijing and Tianjin) and further covering the northern part of Liaoning, Jilin and Heilongjiang provinces. In the period of this dust storm this region featured the highest AOD values with high aerosol concentration, when AOD values ranged from 1.15 to 3.5 over the entire study region, suggesting heavy atmospheric dustiness. However, the movement of dusty air masses may depend heavily on regional and local meteorology (Gao et al. Citation2009; Yao et al. Citation2011; Wang et al. Citation2017; Filonchyk et al. Citation2018a). On 3 and 4 May 2017 air masses came from Kazakhstan and the Gurbantunggut Desert in the north of Xinjiang Province passing long distances, which is also proved by 72-h backward trajectories of air masses at heights of 500, 1,500, and 2,000 m above ground level. Trajectories show that at three different heights air masses move in the same direction, passing through the Gobi Deserts (Badain Jaran, Tengger, and Ulan Buh deserts) and causing the elevation in aerosol concentration over the entire northern part of China. On the other hand, in another period of dust storm (2–3 December 2018) in the cities of Wuwei, Zhongwei, and Wuzhong air masses predominantly come from the Tarim Basin, passing through the Taklamakan Desert and also causing elevation in aerosol concentration. AOD values in this period were less, than in the period of dust storm of 3–4 May 2017, but heavy atmospheric dustiness with AOD values ranging from 0.848 to 1.86 in the region was still observed. The earlier studies confirm the fact of dust transport over great distances and increase of aerosol load of the area, over which the air mass is traveling (Aili and Oanh Citation2015; Taghavi, Owlad, and Ackerman Citation2017; Huang, Yan, and Zhang Citation2018b; Zhou et al. Citation2019).
Figure 6. Spatial distributions of daily average MODIS AOD during dust event days over China on 3–4 May 2017 and 2–3 December 2018. Color lines demonstrate 72-h backward trajectories of air masses arriving in the cities (3 May 2017 – Jinchang, 4 May 2017 – Wuhai and Alashan, 2–3 December 2018 – Wuwei, Zhongwei and Wuzhong) at a height of 500 m (red line), 1500 m (blue line), and 2500 m (green line).
3.3.2.2. Ultraviolet aerosol index
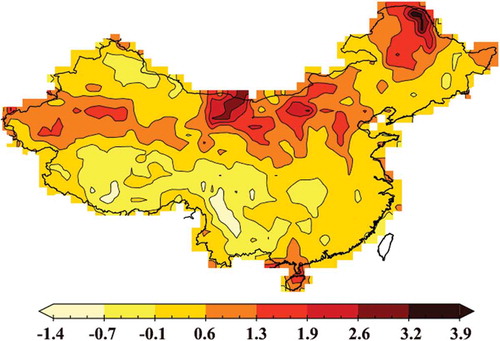
Besides, this study used Ultraviolet (UV) Aerosol Index (UVAI), which is a standard product of OMI (Ozone Monitoring Instrument) and provides valuable information about the presence of UV-absorbing aerosols, such as dust aerosol or smoke. It is worth remarking that positive UVAI values, as a rule, represent absorbing aerosols (dust, smoke, and volcanic ash), while small or negative values represent non-absorbing aerosols (sulfate, sea salt) and clouds (Torres et al. Citation2007). shows spatial distribution of UVAI during the dust storm of 3–4 May 2017, clearly pointing at the presence of dust not only over the territory of the South Gobi, but the major part of the North China area. However, due to the absence of data on UVAI on 2–3 December 2018, they were not analyzed. demonstrates UVAI values in the range of 0.7–3.9 over the entire northern region of the country, representing distribution of dust over the entire region during the sandstorm, as confirmed by the higher UVAI (over 1.8) and AOD (over 1.15) values directly over the area of the South Gobi. Studies, carried out by Filonchyk et al. (Citation2019a), also obtained similar results with high UVAI (over 3) and AOD (over 1) values in the period of heavy dust storms, occurred in April 2014 and March 2016 over the area of Northwest China. Thus, the results confirm that a heavy dust storm coupled with air-mass trajectories and spatial distribution of AOD () was registered on 3–4 May 2017, clearly indicating that the basic mass of dust originated from the Gobi deserts, giving the maximum contribution into the total dust load of the area. High UVAI values also suggest the presence of a great amount of dust aerosol in atmosphere, which is likely related to meteorology and dust transport over great distances (Fu et al. Citation2010; Chen, Luo, and Xie Citation2015). These results are confirmed by the earliest studies, which report that high UVAI values contribute to increase in dust aerosols in atmosphere (Tariq and Ali Citation2015; She et al. Citation2018; Tiwari et al. Citation2019; Filonchyk et al. Citation2019a).
Figure 7. Spatial distribution of OMI UV aerosol index (UVAI) during the dust storm in the territory of continental China on 3–4 May 2017.
3.3.2.3. Aerosol absorbing optical depth
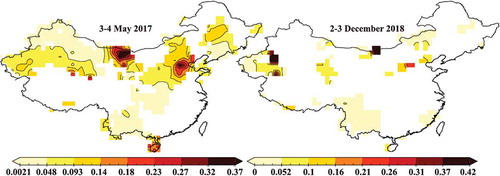
Besides, apart from UVAI an additional parameter was selected, facilitating to measure the value of column aerosol loading on light-absorbing particles, such as smoke (black carbon) and mineral dust. This parameter is called Aerosol Absorbing Optical Depth (AAOD) and is a key parameter for assessment of aerosol radiative forcing and atmospheric heating. AAOD is an absorbance in aerosol column and is calculated as AOD*(1 − SSA), where AOD – Aerosol Optical Depth, SSA – column Single Scattering Albedo. Meanwhile the highest AAOD values (over 0.1) suggest the presence of a great amount of dust or other absorbing aerosols in atmosphere (Souri and Vajedian Citation2015; Jing et al. Citation2017). Data from ground-based station AERONET AOE_Baotou (N40°85′ E109°62′) were planned to be used in this study, however, data in the period of dust storms were absent, therefore decision was taken to use AAOD daily product from OMI at 388 nm. Daily mean AAOD values in the period of the two large dust storms are shown in . It was found that on 3–4 May 2017 AAOD values exceeded 0.14, and at the epicenter the values reached 0.37, and on 2–3 December 2018 the values varied from 0.1 to 0.42. It may be concluded that high dust loading of the area may be responsible for high AOD values in the northern desert regions of the country.
Figure 8. Spatial distribution of OMI Aerosol Absorbing Optical Depth (AAOD) during the two dust storms in the period of 3–4 May 2017 and 2–3 December 2018.
3.3.2.4. Single scattering albedo (SSA)
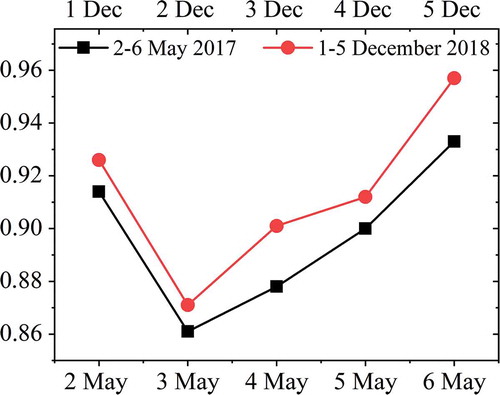
SSA is one of the fundamental parameters for aerosol properties study and gives idea of decrease or increase of solar and terrestrial radiations in polluted environments as well as of the quantitative impact of aerosols on atmosphere heat balance. It is a key parameter when calculating cooling and warming of atmospheric radiation exposure effect and is defined as scattering to complete absorption ratio, which is associated with chemical composition and dimensions of aerosol particles (Reid and Hobbs Citation1998). High SSA values suggest predominance of scattering aerosols (organic carbon, sulfates, and nitrates), while the lower values are associated with predominance of absorbing aerosol types (black carbon, mineral dust, soot). demonstrates spectral variation of SSA during dust and non-dust events. During dust storms at a wave length 388 nm a significant increase of SSA as compared to normal days (or clean days) is observed. As is seen from the figure SSA ranged from 0.914 to 0.957 in normal days and from 0.861 to 0.878 and from 0.871 to 0.901 in dust storms days (3–4 May 2017 and 2–3 December 2018, respectively). Minimum SSA values confirm the predominance of coarse fractions of dust. The results suggest that the dust storms in questions demonstrate similar SSA values with insignificant predominance on 3–4 May 2017. The results obtained also similar with results of the previous studies, when mean SSA values (from 0.76 to 0.90) were found in the period of dust storm from March 2007 to December 2010 over Loess Plateau (Pu et al. Citation2015). Alam et al. (Citation2014) and reported that SSA during the dust storm, occurred over the Middle East and Southwest Asia in May 2012, were 0.87–0.99. Srivastava et al. (Citation2014) found high SSA value (about 0.87 and 0.86) during a heavy dust storm occurred on 21 March 2014 over large Indian cities Delhi and Jodhpur. The Figure also shows that pattern of SSA values during the both dust events are relatively equal, which reflects high and relatively similar concentration of aerosols over the area.
Figure 9. Temporal variation of OMI SSA at 388 nm during dusty days and non-dusty days during 2–6 May 2017 and 1–5 December 2018 in the South Gobi.
3.3.2.5. Surface dust concentration
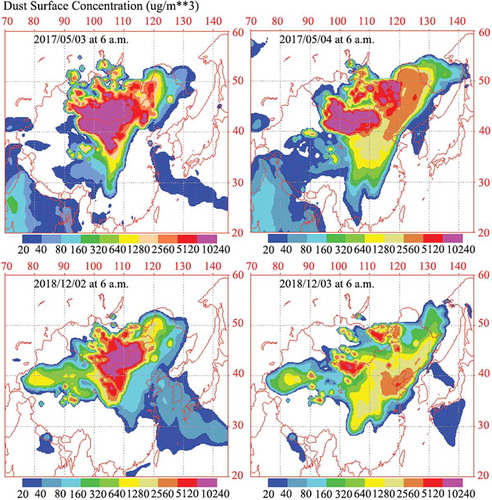
Finally, in order to see the transportation and change of surface dust concentration on 3–4 May 2017 and 2–3 December 2018, assessment of its concentration with NAAPS model product was done. As is seen from the , this is not a local case, since in the morning on 3 May 2017 and 2 December 2018 NAAPS dust concentration product indicates high dust concentrations near the surface over the desert sources in the northern part of China, covering many cities of Ningxia, Inner Mongolia, Gansu, and Shaanxi provinces. However, during these days surface dust burden exceeded 5,120 µg/m3, especially in the northern part of China and over the area of the Mongolian Republic. Then, at 6 a.m. (Coordinated Universal Time (UTC)) on 4 May 2017 and 3 December 2018 a gradual reduction in dust concentration occur (especially on 3 December till 320–640 µg/m3). Despite a gradual reduction in dust concentration in the region, pollution load was still critical, which negatively affected both human health, and all living things.
Figure 10. The Navy Aerosol Analysis and Prediction System (NAAPS) simulated surface level dust concentration (µg/m3) on 2–3 May 2017 and 2–3 December 2018 at 6 a.m. (UTC).
From the study, it may be concluded that all cities of the region suffer from impact of dust aerosols, however, anthropogenic burden of these regions should not be disregarded either. To improve ecological situation, the dust impact on the overall air quality should be reduced. To study overall compliance of aerosol products from satellite and ground-based stations, an additional study focused on data validation is needed. Also it is necessary to analyze extended data on aerosols, including Size Distribution Parameters, Volume Size Distribution, Refractive Index, Radiative Forcing, Asymmetry Factor as well as some parameters, characterizing the shape and vertical distribution of aerosol particles. These studies will help to conduct extensive validation of satellite data, and the combination of satellite and ground data will enable to decrease uncertainty in determination of aerosols characteristics.
Conclusion
This study analyzed spatial and temporal variations of particulate matters (PM2.5 and PM10), gaseous pollutants (SO2, NO2, CO), and aerosol properties in seven cities of the South Gobi during the period from 1 January 2016 to 31 December 2018. Total concentrations of PM2.5, PM10, SO2, NO2, and CO in the region were 38.2 ± 19.5, 101 ± 80.7, 24.2 ± 16.5, 21.9 ± 7.8 µg/m3, and 0.78 ± 0.25 mg/m3, respectively. Mean AOD values in the entire region were 0.156 ± 0.101, while in 75.6% (818 of 1082 days) of all days of sampling AOD values did not exceed 0.2, in 17.8% (193 days) of days AOD values were ranged from 0.2 to 0.4, and only in 6.56% (71 days) of all days of sampling AOD values exceeded 0.4. Seasonal contrasts of change in pollutants suggest clearly defined seasonality, at which maximum values for PM2.5 were in the order winter→spring→autumn→summer and for PM10 spring→winter→autumn→summer. Besides, SO2, NO2, and CO demonstrated the similar trend of change, where maximum and minimum concentrations were observed correspondingly in winter and summer seasons with two-fold difference in concentrations between seasons. The highest concentrations of pollutants were in the period of dust storms activity, when PM2.5 and PM10 contents exceeded 200 and 1000 µg/m3 in many cities (up to peak values of 326 [Wuzhong] and 1496 µg/m3 [Wuwei]). Aerosol load of the area in the period of dust storms was also high with AOD values ranged from 1.15 to 3.5. Over the entire area Clean Continental (71.49%) and Mixed (22.29%) aerosol types prevail, however, based on UV Aerosol Index, Aerosol Absorbing Optical Depth, Single Scattering Albedo the predominance of dust aerosols in the period of dust storms occurs over all cities of the region. The analysis of backward trajectories of air masses movement showed that the main direction of air flow during the dust events was from the deserts of the north and northwest parts of China, including the Taklamakan, Gurbantunggut, Badain Jaran, Tengger, and Ulan Buh deserts.
This study was the first to analyze comprehensively the characteristics of air pollution in seven cities on the South Gobi. It helped to fill in the gaps in areas where research data was needed, which is an important basis for preventing air pollution in poorly studied semidesert and desert regions. The results obtained can not only help in the effective assessment of air quality, but also make a significant contribution to research in the field of ecology, health care, and epidemiology and give recommendations for the further development and implementation of state environmental protection policies.
Supplemental Material
Download MS Word (415.9 KB)Disclosure statement
No potential conflict of interest was reported by the authors.
Supplementary material
Supplemental data for this article can be accessed here.
Additional information
Funding
References
- Ahn, C., O. Torres, and H. Jethva. 2014. “Assessment of OMI near UV Aerosol Optical Depth over Land.” Journal of Geophysical Research, [Atmospheres] 119: 2457–2473. doi:10.1002/2013JD020188.
- Aili, A., and N. T. K. Oanh. 2015. “Effects of Dust Storm on Public Health in Desert Fringe Area: Case Study of Northeast Edge of Taklimakan Desert, China.” Atmospheric Pollution Research 6 (5): 805–814. doi:10.5094/APR.2015.089.
- Alam, K., T. Trautmann, T. Blaschke, and F. Subhan. 2014. “Changes in Aerosol Optical Properties Due to Dust Storms in the Middle East and Southwest Asia.” Remote Sensing of Environment 143: 216–227. doi:10.1016/j.rse.2013.12.021.
- Asl, S. Z., A. Farid, and Y. S. Choi. 2019. “Assessment of CALIOP and MODIS Aerosol Products over Iran to Explore Air Quality.” Theoretical and Applied Climatology 137 (1–2): 117–131. doi:10.1007/s00704-018-2555-9.
- Boiyo, R., K. R. Kumar, and T. Zhao. 2018. “Optical, Microphysical and Radiative Properties of Aerosols over a Tropical Rural Site in Kenya, East Africa: Source Identification, Modification and Aerosol Type Discrimination.” Atmospheric Environment 177: 234–252. doi:10.1016/j.atmosenv.2018.01.018.
- Chen, J., Z. Li, M. Lv, Y. Wang, W. Wang, Y. Zhang, and M. Cribb. 2019. “Aerosol Hygroscopic Growth, Contributing Factors, and Impact on Haze Events in a Severely Polluted Region in Northern China. .” Atmospheric Chemistry and Physics 19 (2): 1327–1342. doi:10.5194/acp-19-1327-2019.
- Chen, Y., B. Luo, and S. D. Xie. 2015. “Characteristics of the Long-range Transport Dust Events in Chengdu, Southwest China.” Atmospheric Environment 122: 713–722. doi:10.1016/j.atmosenv.2015.10.045.
- Christensen, J. H. 1997. “The Danish Eulerian Hemispheric model—A Three-dimensional Air Pollution Model Used for the Arctic.” Atmospheric Environment 31 (24): 4169–4191. doi:10.1016/S1352-2310(97)00264-1.
- Dhital, S., and D. Rupakheti. 2019. “Bibliometric Analysis of Global Research on Air Pollution and Human Health: 1998–2017.” Environmental Science and Pollution Research 26 (13): 13103–13114. doi:10.1007/s11356-019-04482-x.
- Draxler, R. R., and G. D. Rolph. 2003. HYSPLIT (Hybrid Single-Particle Lagrangian Integrated Trajectory) Model Access via NOAA ARL READY. Silver Spring, MD: NOAA Air Resources Laboratory.
- Filonchyk, M., and H. Yan. 2018b. “The Characteristics of Air Pollutants during Different Seasons in the Urban Area of Lanzhou, Northwest China.” Environment and Earth Science International 77 (22): 763. doi:10.1007/s12665-018-7925-1.
- Filonchyk, M., H. Yan, T. M. E. Shareef, and S. Yang. 2019a. “Aerosol Contamination Survey during Dust Storm Process in Northwestern China Using Ground, Satellite Observations and Atmospheric Modeling Data. .” Theoretical and Applied Climatology 135 (1–2): 119–133. doi:10.1007/s00704-017-2362-8.
- Filonchyk, M., H. Yan, S. Yang, and X. Lu. 2018a. “Detection of Aerosol Pollution Sources during Sandstorms in Northwestern China Using Remote Sensed and Model Simulated Data.” Advances in Space Research 61 (4): 1035–1046. doi:10.1016/j.asr.2017.11.037.
- Filonchyk, M., H. Yan, Z. Zhang, S. Yang, W. Li, and Y. Li. 2019b. “Combined Use of Satellite and Surface Observations to Study Aerosol Optical Depth in Different Regions of China.” Scientific Reports 9 (1): 6174. doi:10.1038/s41598-019-42466-6.
- Fu, Q., G. Zhuang, J. Li, K. Huang, Q. Wang, R. Zhang, and J. Fu. 2010. “Source, Long‐range Transport, and Characteristics of a Heavy Dust Pollution Event in Shanghai.” Journal of Geophysical Research 115: D7. doi:10.1029/2009JD013208.
- Gao, T., X. Zhang, Y. Li, H. Wang, S. Xiao, and Q. Teng. 2009. “Potential Predictors for Spring Season Dust Storm Forecast in Inner Mongolia, China.” Theoretical and Applied Climatology 97 (3–4): 255–263. doi:10.1007/s00704-008-0072-y.
- Hammer, M. S., R. V. Martin, A. van Donkelaar, V. Buchard, O. Torres, D. A. Ridley, and R. J. D. Spurr. 2016. “Interpreting the Ultraviolet Aerosol Index Observed with the OMI Satellite Instrument to Understand Absorption by Organic Aerosols: Implications for Atmospheric Oxidation and Direct Radiative Effects.” Atmospheric Chemistry and Physics 16: 2507–2523. doi:10.5194/acp-16-2507-2016.
- He, Y., and F. Yi. 2015. “Dust Aerosols Detected Using a Ground-based Polarization Lidar and CALIPSO over Wuhan (30.5 N, 114.4 E), China.” Advances in Meteorology 1–18. doi:10.1155/2015/536762
- Hime, N., G. Marks, and C. Cowie. 2018. “A Comparison of the Health Effects of Ambient Particulate Matter Air Pollution from Five Emission Sources.” International Journal of Environmental Research and Public Health 15 (6): 1206. doi:10.3390/ijerph15061206.
- Hogan, T. F., and L. R. Brody. 1993. “Sensitivity Studies of the Navy’s Global Forecast Model Parameterizations and Evaluation of Improvements to NOGAPS.” Monthly Weather Review 121 (8): 2373–2395. doi:10.1175/1520-0493(1993)121<2373:SSOTNG>2.0.CO;2.
- Hou, Y. K., Y. F. He, H. Chen, C. Y. Xu, J. Chen, J. S. Kim, and S. L. Guo. 2019. “Comparison of Multiple Downscaling Techniques for Climate Change Projections Given the Different Climatic Zones in China.” Theoretical and Applied Climatology 138: 27–45. doi:10.1007/s00704-019-02794-z.
- Hsu, N. C., M. J. Jeong, C. Bettenhausen, A. M. Sayer, R. Hansell, C. S. Seftor, and S. C. Tsay. 2013. “Enhanced Deep Blue Aerosol Retrieval Algorithm: The Second Generation.” Journal of Geophysical Research, [Atmospheres] 118 (16): 9296–9315. doi:10.1002/jgrd.50712.
- Hu, J., Y. Wang, Q. Ying, and H. Zhang. 2014. “Spatial and Temporal Variability of PM2.5 And PM10 over the North China Plain and the Yangtze River Delta, China.” Atmospheric Environment 95: 598–609. doi:10.1016/j.atmosenv.2014.07.019.
- Huang, J., X. Pan, X. Guo, and G. Li. 2018a. “Health Impact of China’s Air Pollution Prevention and Control Action Plan: An Analysis of National Air Quality Monitoring and Mortality Data.” The Lancet Planetary Health 2 (7): 313–323. doi:10.1016/S2542-5196(18)30141-4.
- Huang, Y., Q. Yan, and C. Zhang. 2018b. “Spatial–temporal Distribution Characteristics of PM 2.5 In China in 2016.” Journal of Geovisualization and Spatial Analysis 2 (2): 12. doi:10.1007/s41651-018-0019-5.
- Jin, Y., H. Andersson, and S. Zhang. 2016. “Air Pollution Control Policies in China: A Retrospective and Prospects.” International Journal of Environmental Research and Public Health 13 (12): 1219. doi:10.3390/ijerph13121219.
- Jing, Y., P. Zhang, L. Chen, and N. Xu. 2017. “Integrated Analysis of Dust Transport and Budget in a Severe Asian Dust Event.” Aerosol and Air Quality Research 17: 2390–2400. doi:10.4209/aaqr.2017.05.0170.
- Kannan, R., S. Venkateswaran, M. V. Prabhu, R. Suresh, and A. Kalaiyarasi. 2019. “Demarcation of Groundwater Possible Zones in a Hard Rock Terrain, Nagavathi Watershed of Dharmapuri District, Tamil Nadu, India—Geophysical and Geoinformatics Approach.” Journal of Geovisualization and Spatial Analysis 3 (1): 2. doi:10.1007/s41651-018-0025-7.
- Kerimray, A., L. Rojas-Solórzano, M. A. Torkmahalleh, P. K. Hopke, and B. P. Ó. Gallachóir. 2017. “Coal Use for Residential Heating: Patterns, Health Implications and Lessons Learned.” Energy for Sustainable Development 40: 19–30. doi:10.1016/j.esd.2017.05.005.
- Khaniabadi, Y. O., S. M. Daryanoosh, A. Amrane, R. Polosa, P. K. Hopke, and G. Goudarzi. 2017. “Impact of Middle Eastern Dust Storms on Human Health.” Atmospheric Pollution Research 8 (4): 606–613. doi:10.1016/j.apr.2016.11.005.
- Kuang, B. Y., P. Lin, M. Hu, and J. Z. Yu. 2016. “Aerosol Size Distribution Characteristics of Organosulfates in the Pearl River Delta Region, China.” Atmospheric Environment 130: 23–35. doi:10.1016/j.atmosenv.2015.09.024.
- Lian, Y., G. J. Y. You, K. Lin, Z. Jiang, C. Zhang, and X. Qin. 2015. “Characteristics of Climate Change in Southwest China Karst Region and Their Potential Environmental Impacts.” Environment and Earth Science International 74 (2): 937–944. doi:10.1007/s12665-014-3847-8.
- Lindner, A., and C. S. Pitombo. 2019. “Sequential Gaussian Simulation as a Promising Tool in Travel Demand Modeling.” Journal of Geovisualization and Spatial Analysis 3 (2): 15. doi:10.1007/s41651-019-0038-x.
- Liu, Y., B. Wang, Q. Zhu, R. Luo, C. Wu, and R. Jia. 2019. “Dominant Synoptic Patterns and Their Relationships with PM 2.5 Pollution in Winter over the Beijing-Tianjin-Hebei and Yangtze River Delta Regions in China.” Journal of Meteorological Research 33 (4): 765–776. doi:10.1007/s13351-019-9007-z.
- Ma, X., J. Wang, F. Yu, H. Jia, and Y. Hu. 2016a. “Can MODIS AOD Be Employed to Derive PM2.5 In Beijing-Tianjin-Hebei over China?” Atmospheric Research 181: 250–256. doi:10.1016/j.atmosres.2016.06.018.
- Ma, Y., B. Xiao, C. Liu, Y. Zhao, and X. Zheng. 2016b. “Association between Ambient Air Pollution and Emergency Room Visits for Respiratory Diseases in Spring Dust Storm Season in Lanzhou, China.” International Journal of Environmental Research and Public Health 13 (6): 613. doi:10.3390/ijerph13060613.
- Nagpure, A. S., B. R. Gurjar, and J. Martel. 2014. “Human Health Risks in National Capital Territory of Delhi Due to Air Pollution.” Atmospheric Pollution Research 5 (3): 371–380. doi:10.5094/APR.2014.043.
- Pu, W., X. Wang, X. Zhang, Y. Ren, J. S. Shi, J. R. Bi, and B. D. Zhang. 2015. “Size Distribution and Optical Properties of Particulate Matter (PM10) and Black Carbon (BC) during Dust Storms and Local Air Pollution Events across a Loess Plateau Site.” Aerosol and Air Quality Research 15: 2212–2224. doi:10.4209/aaqr.2015.02.0109.
- Reid, J. S., and P. V. Hobbs. 1998. “Physical and Optical Properties of Young Smoke from Individual Biomass Fires in Brazil.” Journal of Geophysical Research: Atmospheres 103: 32013–32030. doi:10.1029/98JD00159.
- Rupakheti, D., S. Kang, M. Bilal, J. Gong, X. Xia, and Z. Cong. 2019. “Aerosol Optical Depth Climatology over Central Asian Countries Based on Aqua-MODIS Collection 6.1 Data: Aerosol Variations and Sources.” Atmospheric Environment 207 (15): 205–214. doi:10.1016/j.atmosenv.2019.03.020.
- Sarkar, T., and M. Mishra. 2018. “Soil Erosion Susceptibility Mapping with the Application of Logistic Regression and Artificial Neural Network.” Journal of Geovisualization and Spatial Analysis 2 (1): 8. doi:10.1007/s41651-018-0015-9.
- Sayer, A. M., N. C. Hsu, C. Bettenhausen, and M. J. Jeong. 2013. “Validation and Uncertainty Estimates for MODIS Collection 6 “Deep Blue” Aerosol Data.” Journal of Geophysical Research, [Atmospheres] 118 (14): 7864–7872. doi:10.1002/jgrd.50600.
- Schuster, G. L., O. Dubovik, and B. N. Holben. 2006. “Angstrom Exponent and Bimodal Aerosol Size Distributions.” Journal of Geophysical Research 111: D07207. doi:10.1029/2005JD006328.
- Schwartz, J., D. W. Dockery, and L. M. Neas. 1996. “Is Daily Mortality Associated Specifically 598 with Fine Particles?” Journal of the Air & Waste Management Association 46: 927–939. doi:10.1080/10473289.1996.10467528.
- She, L., Y. Xue, J. Guang, Y. Che, C. Fan, Y. Li, and Y. Xie. 2018. “Towards a Comprehensive View of Dust Events from Multiple Satellite and Ground Measurements: Exemplified by the May 2017 East Asian Dust Storm.” Natural Hazards and Earth System Sciences 18 (12): 3187–3201. doi:10.5194/nhess-18-3187-2018.
- Shi, L., J. Zhang, F. Yao, X. Han, T. Igbawua, Y. Liu, and D. Zhang. 2017. “Influence of Meteorological Conditions on Correlation between Aerosol and Cloud in Summer.” Advances in Space Research 59 (7): 1907–1920. doi:10.1016/j.asr.2017.01.026.
- Song, X., L. Shao, Q. Zheng, and S. Yang. 2015. “Characterization of Crystalline Secondary Particles and Elemental Composition in PM10 of North China.” Environment and Earth Science International 74 (7): 5717–5727. doi:10.1007/s12665-015-4589-y.
- Souri, A. H., and S. Vajedian. 2015. “Dust Storm Detection Using Random Forests and Physical-based Approaches over the Middle East.” Journal of Earth System Science 124 (5): 1127–1141. doi:10.1007/s12040-015-0585-6.
- Srivastava, A. K., V. K. Soni, S. Singh, V. P. Kanawade, N. Singh, S. Tiwari, and S. D. Attri. 2014. “An Early South Asian Dust Storm during March 2012 and Its Impacts on Indian Himalayan Foothills: A Case Study.” Science of the Total Environment 493: 526–534. doi:10.1016/j.scitotenv.2014.06.024.
- Stein, A. F., R. R. Draxler, G. D. Rolph, B. J. Stunder, M. D. Cohen, and F. Ngan. 2015. “NOAA’s HYSPLIT Atmospheric Transport and Dispersion Modeling System.” Bulletin of the American Meteorological Society 96 (12): 2059–2077. doi:10.1175/BAMS-D-14-00110.1.
- Sun, R., and B. Zhang. 2016. “Topographic Effects on Spatial Pattern of Surface Air Temperature in Complex Mountain Environment.” Environment and Earth Science International 75 (7): 621. doi:10.1007/s12665-016-5448-1.
- Sun, Y., Q. Jiang, Z. Wang, P. Fu, J. Li, T. Yang, and Y. Yin. 2014. “Investigation of the Sources and Evolution Processes of Severe Haze Pollution in Beijing in January 2013.” Journal of Geophysical Research, [Atmospheres] 119 (7): 4380–4398. doi:10.1002/2014JD021641.
- Taghavi, F., E. Owlad, and S. A. Ackerman. 2017. “Enhancement and Identification of Dust Events in the South-west Region of Iran Using Satellite Observations.” Journal of Earth System Science 126 (2): 28. doi:10.1007/s12040-017-0808-0.
- Tariq, S., and M. Ali. 2015. “Spatio–temporal Distribution of Absorbing Aerosols over Pakistan Retrieved from OMI Onboard Aura Satellite.” Atmospheric Pollution Research 6 (2): 254–266. doi:10.5094/APR.2015.030.
- Tiwari, S., A. Kumar, V. Pratap, and A. K. Singh. 2019. “Assessment of Two Intense Dust Storm Characteristics over Indo–Gangetic Basin and Their Radiative Impacts: A Case Study.” Atmospheric Research 228: 23–40. doi:10.1016/j.atmosres.2019.05.011.
- Torres, O., A. Tanskanen, B. Veihelmann, C. Ahn, R. Braak, and P. K. Bhartia. 2007. “Aerosols and Surface UV Products from Ozone Monitoring Instrument Observations: An Overview.” Journal of Geophysical Research 112: D24. doi:10.1029/2007JD008809.
- Tsai, F., J. Y. Tu, S. C. Hsu, and W. N. Chen. 2014. “Case Study of the Asian Dust and Pollutant Event in Spring 2006: Source, Transport, and Contribution to Taiwan.” Science of the Total Environment 478: 163–174. doi:10.1016/j.scitotenv.2014.01.072.
- Wang, Q., X. Dong, J. S. Fu, J. Xu, C. Deng, Y. Jiang, and G. Zhuang. 2018. “Environmentally Dependent Dust Chemistry of a Super Asian Dust Storm in March 2010: Observation and Simulation.” Atmospheric Chemistry and Physics 18 (5): 3505–3521. doi:10.5194/acp-18-3505-2018.
- Wang, X., H. Cheng, H. Che, J. Sun, H. Lu, M. Qiang, and L. Lang. 2017. “Modern Dust Aerosol Availability in Northwestern China.” Scientific Reports 7 (1): 8741. doi:10.1038/s41598-017-09458-w.
- Wang, Y., M. Sun, X. Yang, and X. Yuan. 2016. “Public Awareness and Willingness to Pay for Tackling Smog Pollution in China: A Case Study.” Journal of Cleaner Production 112: 1627–1634. doi:10.1016/j.jclepro.2015.04.135.
- Winker, D. M., J. L. Tackett, B. J. Getzewich, Z. Liu, M. A. Vaughan, and R. R. Rogers. 2013. “The Global 3-D Distribution of Tropospheric Aerosols as Characterized by CALIOP.” Atmospheric Chemistry and Physics 13 (6): 3345–3361. doi:10.5194/acp-13-3345-2013.
- Yao, Z., J. Xiao, C. Li, and K. Zhu. 2011. “Regional Characteristics of Dust Storms Observed in the Alxa Plateau of China from 1961 to 2005.” Environment and Earth Science International 64 (1): 255–267. doi:10.1007/s12665-010-0845-3.
- Yu, H., W. Yang, X. Wang, B. Yin, X. Zhang, J. Wang, and Z. Bai. 2019a. “A Seriously Sand Storm Mixed Air-polluted Area in the Margin of Tarim Basin: Temporal-spatial Distribution and Potential Sources.” Science of the Total Environment 676: 436–446. doi:10.1016/j.scitotenv.2019.04.298.
- Yu, Y., O. V. Kalashnikova, M. J. Garay, and M. Notaro. 2019b. “Climatology of Asian Dust Activation and Transport Potential Based on MISR Satellite Observations and Trajectory Analysis.” Atmospheric Chemistry and Physics 19: 363–378. doi:10.5194/acp-19-363-2019.
- Zhang, J., E. Wei, L. Wu, X. Fang, F. Li, Z. Yang, and T. Wang. 2018. “Elemental Composition and Health Risk Assessment of PM10 and PM2.5 In the Roadside Microenvironment in Tianjin, China.” Aerosol and Air Quality Research 18: 1817–1827. doi:10.4209/aaqr.2017.10.0383.
- Zhou, C., A. Mamtimin, F. Yang, W. Huo, M. Wang, H. Pan, Q. He, L. Jin, and X. Yang. 2019. “Dust Uplift Potential in the Taklimakan Desert: An Analysis Based on Different Wind Speed Measurement Intervals.” Theoretical and Applied Climatology 137 (1–2): 1449–1456. doi:10.1007/s00704-018-2678-z.
- Zhou, X., Z. Cao, Y. Ma, L. Wang, R. Wu, and W. Wang. 2016. “Concentrations, Correlations and Chemical Species of PM2.5/PM10 Based on Published Data in China: Potential Implications for the Revised Particulate Standard.” Chemosphere 144: 518–526.