
 ?Mathematical formulae have been encoded as MathML and are displayed in this HTML version using MathJax in order to improve their display. Uncheck the box to turn MathJax off. This feature requires Javascript. Click on a formula to zoom.
ABSTRACT
Urban functional zones (UFZs) are important for urban sustainability and urban planning and management, but UFZ maps are rarely available and up-to-date in developing countries due to frequent economic and human activities and rapid changes in UFZs. Current methods have focused on mapping UFZs in a small area with either remote sensing images or open social data, but large-scale UFZ mapping integrating these two types of data is still not be applied. In this study, a novel approach to mapping large-scale UFZs by integrating remote sensing images (RSIs) and open social data is proposed. First, a context-enabled image segmentation method is improved to generate UFZ units by incorporating road vectors. Second, the segmented UFZs are classified by coupling Latent Dirichlet Allocation (LDA) and Support Vector Machine (SVM). In the classification framework, physical features from RSIs and social attributes from POI (Point of Interest) data are integrated. A case study of Beijing was performed to evaluate the proposed method, and an overall accuracy of 85.9% was achieved. The experimental results demonstrate that the presented method can provide fine-grained UFZs, and the fusion strategy of RSIs and POI data can distinguish urban functions accurately. The proposed method appears to be promising and practical for large-scale UFZ mapping.
1. Introduction
The progress of urbanization and modern civilization leads to the generation of various urban functional zones (UFZs) within a city, serving as the spatial carriers of various socioeconomic activities to accommodate people’s diverse demands for living, working, education, and public service. Although certain big cities (such as New York and London) in developed countries have gradually weakened functional zoning in their planning due to their matured urban spatial structures, UFZs are still widely practiced and employed as the basic units for urban planning and management in developing countries due to the imperfect urban spatial structures and rapid urbanization (Banzhaf and Hofer Citation2008; Yuan et al. Citation2014; Cao et al. Citation2019). UFZ maps are crucial for uncovering the urban social and physical characteristics and can enable a variety of valuable applications, such as residential relocation, commercial site selection, and urban transportation planning, as well as being used in economic impact assessment (Deal and Schunk Citation2004) and demography studies (Bagan and Yamagata Citation2015; Grippa et al. Citation2019), leading to increasing demands for them.
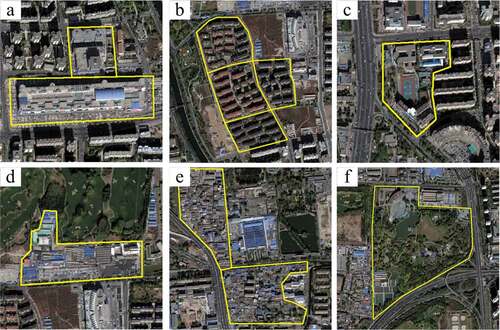
illustrates multiple types of UFZs, including commercial zones, residential districts, campuses, industrial zones, shantytowns, and parks. Influenced by two dominant factors: government policy-planning and people’s actual lifestyles, UFZs would change territories and functions with the evolution of a city (Yuan et al. Citation2014; Du et al. Citation2019). However, up-to-date UFZ maps are rarely available in some cities, especially in developing countries, since the standard urban planning maps used by governments did not provide meaningful information on real status of a particular region. Different from urban functional regions (Gao, Janowicz, and Couclelis Citation2017), UFZs we studied are really looking at how things are zoned and the potential changes. Therefore, this study aims at not only mapping up-to-date UFZs to uncover the real status of cities in the absence of such data in developing countries but also cross-examining existing urban zoning maps in developed countries.
Figure 1. Different categories of UFZs outlined by yellow lines. (a) commercial zones; (b) residential districts; (c) a campus; (d) an industrial zone; (e) shantytowns; and (f) a park.
1.1 Data sources
Traditionally, UFZ maps are mainly produced by field survey which is labor- and time-consuming and hard to update timely (Herold, Liu, and Clarke Citation2003; Song et al. Citation2018). The availability of very-high-resolution (VHR) remote sensing images provides a great opportunity to map urban land cover and land use (LULC) as VHR images can capture the physical characteristics of urban areas (Hussain and Shan Citation2016; Antunes et al. Citation2019). Visual features (spectrums, textures, and shapes) are commonly used for classifying urban LULC. Voltersen et al. (Citation2014) used land cover information to characterize urban blocks, and then applied a synergetic approach of knowledge-based and statistical feature selection to derive the defined urban structure types. Zhao, Tang, and Huo (Citation2014) proposed a spatial-rotation-invariant representation strategy for describing spatial information of visual words, and then a concentric circle-structured multiscale bag-of-visual-words model was presented for land-use scene classification. Zhang, Du, and Wang (Citation2015) classified urban scenes by using intra-scene feature similarity, and then inter-scene semantic dependency was adopted to optimize the classification results. Visual features are however weak in characterizing urban scenes as scenes are usually composed of diverse objects with variant visual cues. To resolve this issue, spatial relations of land cover objects are designed as components to characterize urban scenes and identify their categories (Walde et al. Citation2014; Zhang, Du, and Zhang Citation2018). Recently, deep learning methods have gained much attention as they greatly improve the classification accuracy of VHR images (Wang et al. Citation2017; Nogueira, Penatti, and Dos Santos Citation2017; Anwer et al. Citation2018; Lu et al. Citation2018; Huang, Zhao, and Song Citation2018). However, the deep learning model requires a large number of samples to achieve better generalization ability. For urban built-up areas, they are commonly composed of diverse man-made infrastructures and various land cover types leading to a complex urban environment which makes it difficult to differentiate UFZs using only VHR images.
Land use patterns are strongly correlated with human social and economic activities (Soliman et al. Citation2017; Tu et al. Citation2018). The emergence of open social data (e.g. OSM (OpenStreetMap), social media data, mobile phone data, POI (Point of Interest), GNSS trajectories) makes social attributes of urban areas are available to recognize urban functions (Pei et al. Citation2014; Yuan et al. Citation2014; Frias-Martinez and Frias-Martinez Citation2014; Crooks et al. Citation2015; Ríos and Muñoz. Citation2017; Tu et al. Citation2017). For example, Pei et al. (Citation2014) used hourly aggregated number of mobile phone calls managed by each base transceiver station to obtain land use maps with fuzzy c-means. By considering the similarity of Tweeting activities in urban areas, Frias-Martinez and Frias-Martinez (Citation2014) developed an unsupervised learning method to automatically differentiate urban land uses. In addition to using a single data source, multi-sourced data fused method has also been studied. Yuan et al. (Citation2014) developed a topic-modeling-based approach for land use identification leveraging both location (POI) and mobility (taxi trajectories) semantics mined from latent activity trajectories. Tu et al. (Citation2017) distinguished urban functions by aggregating human activities inferred from mobile phone positioning and social media check-in data. Among these studies, accuracies ranging from 60% to 80% were reported. Open social data could yield an improved understanding of urban functions with more human activities, such as commercial and residential zones, because they are highly correlated with these urban land use types. However, open social data are usually unbalanced and biased in category and spatial distribution. For example, the commercial POIs are much more than other types because they are produced by human activities focusing mainly on commercial places. On the other hand, the POI data is rare in suburbs and rural areas. Therefore, open social data-based methods can hardly map large-scale UFZs with suburbs or rural areas.
Fusing VHR images and open social data helps to take both the physical and social attributes of urban areas into consideration, thus it is expected to hold great potential for identifying urban functions more accurately (Jendryke et al. Citation2017; Rosser, Leibovici, and Jackson Citation2017; Zhang et al. Citation2017c). Several methods have been involved to map UFZs by fusing VHR images and open social data (Hu et al. Citation2016; Liu et al. Citation2017; Zhang et al. Citation2017c; Tu et al. Citation2018; Jia et al. Citation2018; Song et al. Citation2018). Although VHR images with sub-meter-level resolution have shown great potential in classifying UFZs when integrated with open social data (Liu et al. Citation2017; Zhang et al. Citation2017c; Song et al. Citation2018), medium-resolution images are freely available and appropriate for mapping large-scale UFZs. However, medium-resolution images are almost impossible to produce fine-grained UFZs due to the lower spatial resolution compared with VHR images; moreover, physical features (such as spectrums and textures) derived from medium-resolution images are not well suited for identifying urban functions (Hu et al. Citation2016; Jia et al. Citation2018). Accordingly, VHR images with meter-level resolution are more appropriate for mapping fine-grained and large-scale UFZs. Therefore, integrating this kind of images and open social data to map large-scale UFZs need to be further studied.
1.2 Mapping units
Previous efforts on UFZ analysis focus mainly on function classification but ignore zone segmentation (Zhang et al. Citation2017c; Du et al. Citation2019). This is impractical because only when UFZ units are spatially delineated, multiple features derived from VHR images and open social data can be linked to interpret urban functions. Existing methods for mapping UFZs mainly regard image tiles (Tu et al. Citation2018; Jia et al. Citation2018) and road blocks (Hu et al. Citation2016; Liu et al. Citation2017; Zhang et al. Citation2017c; Song et al. Citation2018) as mapping units. Image tiles cannot represent exact UFZs with various shapes and sizes (). Recently, more and more studies have used road vectors to divide VHR images into UFZs. However, the quality of segmented UFZs is highly influenced by the completeness and the quality of road vectors. Moreover, road networks are usually sparse or even absent in some suburbs, especially in rural areas (e.g. the OSM roads are sparse in some suburbs and rural areas because volunteers tend to focus more on urban areas), leading to road blocks with mixed functions (Zhang et al. Citation2017c). Accordingly, image tiles and road blocks can hardly align with the real status of UFZs, thus more appropriate spatial units are needed for mapping UFZs.
Recent advancements in image segmentation techniques provide an alternative to generate spatial units of UFZs from VHR images. Existing widely used segmentation methods include object segmentation (Baatz and Schape Citation2000; Hussain and Shan Citation2016; Teodoro and Araújo Citation2016; Antunes et al. Citation2019) and semantic segmentation (Long, Shelhamer, and Darrell Citation2015; Zheng, Zhang, and Wang Citation2017). However, neither of them can generate exact UFZs, because their purposes are to obtain homogeneous objects with consistent visual cues (such as spectrums, textures, and shapes), while UFZs are heterogeneous patches and composed of diverse geographic objects (such as buildings, roads, and vegetation) with substantial discontinuities in visual cues (). Therefore, visual features are hardly to characterize UFZs alone. A UFZ holds a specific socioeconomic activity and typically has a specific spatial configuration of geographic objects. For example, shows that buildings are neatly arranged with similar size and structure in residential districts, while they are small and tightly connected in shantytowns; a school campus usually contains various building structures and one or more sports fields; a commercial zone typically has big buildings with oversize open spaces for parking; and a park usually has large areas of green space. Accordingly, UFZs tend to be defined by their context information which reflects the spatial configurations of geographic objects (Nielsen Citation2015; Du et al. Citation2019).
A context-enabled UFZ segmentation method was presented for generating UFZ units and its effectiveness has been demonstrated (Du et al. Citation2019). Context information for each individual pixel is realized by calculating the nearest-neighbor distance from a specific pixel to pixels of different classes. However, this work left several problems. For example, the wide main roads may be segmented as a single UFZ, and some segmented UFZs may cross roads due to the lack of considering road information. Therefore, the available road vectors (such as OSM) can improve the segmentation quality as roads are the most important physical boundaries of different UFZs. As a result, integrating VHR images and road vectors can produce better spatial units for mapping UFZs.
In light of the challenges and issues discussed above, this study aims at: (1) improving the context-enabled UFZ segmentation method to generate spatial units for mapping fine-grained (meter lever) and large scale (hundreds of square kilometers) UFZs; and (2) proposing a fusion strategy to integrate VHR images of meter-level resolution and POI data for distinguishing urban functions. To do this, the context-enabled UFZ segmentation method is improved to generate UFZ units by integrating VHR images and road vectors. Second, Latent Dirichlet Allocation (LDA) and Support Vector Machine (SVM) are coupled to fuse physical features from VHR images and social attributes from POIs for classifying urban functions.
2. Method
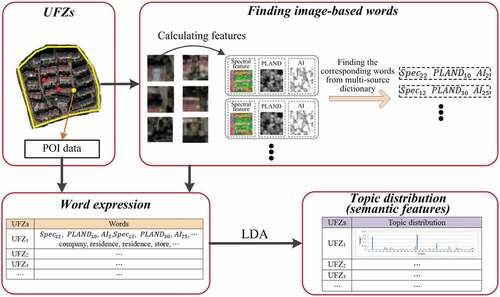
Compared with low-level features extracted directly from images (such as spectrums and textures), high-level semantic features are more robust and effective for UFZ classification (Kusumaningrum et al. Citation2014; Zhao et al. Citation2015). In view of this, the proposed method uses probabilistic topic model to map low-level features of physical and social attributes into high-level semantic features for characterizing UFZs (Blei, Ng, and Jordan Citation2003; Liu et al. Citation2017). The workflow of the proposed method includes four steps ():
Figure 2. Workflow of the proposed UFZ mapping method.
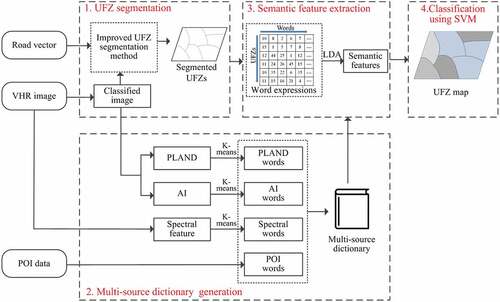
UFZ segmentation. The context-enabled UFZ segmentation method (Du et al. Citation2019) is improved to generate UFZs by integrating VHR images and road vectors.
Multi-source dictionary generation. To express UFZs, words of spectral features and two landscape metrics including PLAND (percentage of landscape) and AI (aggregation index) are generated by using K-means clustering, while each category of POI is regarded as a single POI word.
Semantic feature extraction. UFZs are expressed by words and the topic probabilities of each UFZ are mined by LDA (Blei, Ng, and Jordan Citation2003) as semantic features to better distinguish urban functions.
UFZ supervised classification. SVM classifier is trained and applied to classify UFZs.
2.1. UFZ segmentation
For mapping UFZs, spatial units should be determined first. As discussed in the Introduction section, a context-enabled UFZ segmentation method (Du et al. Citation2019) was proposed for generating UFZs. This context feature uses the geographical distance between classes to measure local configurations by calculating the nearest neighbor distance of every pixel to every class (Nielsen Citation2015; Du et al. Citation2019). However, using only images to segment UFZs cannot guarantee reliable results as roads are the most important physical boundaries of different UFZs, thus integrating images and road vectors are expected to produce better UFZ segmentation results. Therefore, the original method (Du et al. Citation2019) is improved in this study by incorporating road vectors. The improved method consists of five steps ():
Figure 3. Workflow of the improved UFZ segmentation method.
Context features are extracted first for each pixel in the form of geographic nearest-neighbor distances from a pixel to different pixel categories (Nielsen Citation2015). Therefore, each pixel can be characterized by a
dimension feature with each dimension representing the nearest distance to one of the pixel categories, where
Neighboring objects with homogeneous context features can form a UFZ, thus the original VHR image is segmented into objects as the initial units using Multiresolution Segmentation (MRS) (Baatz and Schape Citation2000), which are subsequently merged into UFZ (step (3)).
Image objects of step (2) are further merged to produce UFZs in terms of the heterogeneity of context and shape features between objects. That is, if the minimal heterogeneity between an object and its neighboring objects is less than the UFZ segmentation scale, the two objects with minimal heterogeneity will be merged to form a new object (Du et al. Citation2019). With this step, the initial UFZs will be produced.
The VHR image is segmented into blocks by road vectors, and then each image object generated in step (2) will be assigned a road-block label
Graph cuts algorithm (Boykov, Veksler, and Zabih Citation2001) is applied to optimize the initial UFZs (step (3)).
Road information is incorporated into the graph cuts algorithm to constrain the segmentation process. The basic idea of graph cuts optimization is to construct a weighted graph based on the nodes and their neighborhoods (EquationEquation 1(1)
(1) ) (Boykov, Veksler, and Zabih Citation2001; Veksler, Boykov, and Mehrani Citation2010). The objective of graph cuts optimization is to find a label
for each node
of the graph by minimizing the energy function:
where and
denote unary and pairwise terms, respectively, which are balanced by
;
measures how well label
fits node
;
defines the similarity between nodes
and
.
is the collection of all label assignments, while
is the collection of neighboring node pairs. To construct graph cuts energy function, in this study, image objects generated by step (2) are regarded as nodes and the initial-segmented UFZs produced by step (3) are regarded as labels.
The unary term, measuring the corresponding relationship between the nodes (i.e. image objects) and the labels (i.e. initial UFZs), can be obtained according to the inclusion relation between image objects and initial UFZs. Let denote the set of image objects covered by the initial UFZ
(containing image objects which are two-order neighborhood of
), then the unary term is defined as:
The pairwise term denotes the similarity between nodes and
. In this study, if
and
belong to different road blocks,
will be changed to make
and
separated in the final UFZ segmentation results. Accordingly,
is defined as:
where refers to the heterogeneity between
and
consists of context and shape heterogeneity, where the former is calculated by the standard deviation of context, while the latter composed of smoothness and compactness of objects (Du et al. Citation2019);
is the Euclidean distance between nodes
and
, and
is used to adjust the value range of the pairwise term.
and
are the road-block labels of
and
.
The energy function (EquationEquation (1)(1)
(1) ) considers the similarities between image objects, the inclusion relationships of objects and initial UFZs, and the road information. After minimizing the energy function, the initial-segmented UFZs will be reorganized to achieve the minimal heterogeneity intra-UFZs, maximum heterogeneity inter-UFZs, and the maximum consistency with roads boundaries. In this study,
-expansion algorithm (Boykov, Veksler, and Zabih Citation2001) is employed to minimize the energy function and each object will obtain a new label, then all the adjoining objects with the same label will make up a new UFZ.
2.2. LDA method
LDA is a probabilistic topic model designed to discover latent semantic information from text datasets (Blei, Ng, and Jordan Citation2003). It has achieved good results in mining urban function information (Kusumaningrum et al. Citation2014; Crooks et al. Citation2015; Zhao et al. Citation2015; Zhang, Du, and Zhang Citation2018).
Assuming that topics are associated with
words in the document corpus
, the idea of LDA is to determine the probability distribution of topics for each document
. Given the smoothing parameters
and
of topic distribution in the document and word distribution in topic, respectively, the joint probability function is expressed as:
where represents a set of words;
refers to the inferred latent topics; and
is the probability distribution of topics in documents following the Dirichlet Allocation with parameter
. A final expression can be deduced by integrating EquationEquation (4)
(4)
(4) over
and summing topics
. For a document
, its topic distribution
can be regarded as the semantic features of the document (Kusumaningrum et al. Citation2014; Zhao et al. Citation2015).
The definitions of LDA variables in this study are shown in . By LDA, according to a large number of observable document-word distribution, document-topic and topic-word distribution can be discovered. In this method, each segmented UFZ is regarded as a document and the topic distribution is employed as high-level semantic features to characterize a UFZ.
Table 1. The definitions of LDA variables in this study.
To extract semantic features, a word dictionary needs to be established first to express UFZs. Then, UFZs are expressed by words and fed into LDA for extracting the topic distribution, i.e. semantic features, for each UFZ.
2.3. Multi-source dictionary generation
UFZ classification is different from image object classification since UFZ is a heterogeneous urban-zone composed of multiple objects. Therefore, its recognition needs the information about both the categories and distributions of component elements in each UFZ. Spectral features are related to the element categories, while landscape features can express the element distributions; moreover, POI data reflects social attributes. Therefore, the above information will be used to establish the word dictionary to express UFZs. Particularly, two class-level landscape metrics including PLAND and AI are adopted since they are recommended for land use mapping (Zhang et al. Citation2017c). PLAND and AI are calculated based on regions quantifying the spatial patterns of different land cover types, where a region is homogeneous and composed of pixels with the same land cover type (same ISODATA category in this study). The spectral features, PLAND and AI for a pixel are calculated in an image patch centered on this pixel. The spectral features are defined as the mean and standard deviation of the spectrum in this patch. These features for a pixel can be expressed as:
where is
pixel;
and
are the mean and standard deviation, while
and
refer to the numbers of image channels and ISODATA categories, respectively.
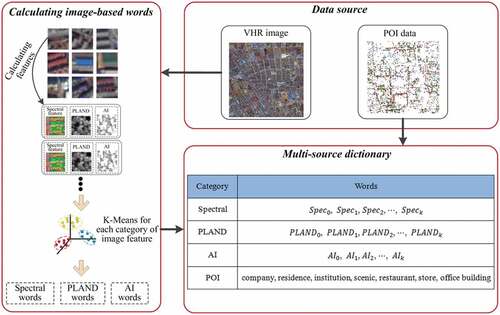
The generation of word dictionary is illustrated in . We first calculate the features defined in EquationEquations (5)(5)
(5) –(Equation7
(7)
(7) ) of a certain number of pixels (with a regular sampling interval), and then the K-means clustering is employed to find the cluster centers for each category of features, and each cluster center will correspond to a word. For POI data, as itself have category information, each category of POI data will correspond to one POI-based word. Finally, all these words are superimposed together to construct a multi-source dictionary. Assuming that the number of cluster centers of K-means is
and types of POI data is
, then the dictionary will contain
words.
Figure 4. The generation of multi-source dictionary.
2.4. Semantic feature extraction
The extraction of semantic features is illustrated in . When using words to express , we select pixels within this UFZ at regular intervals rather than all of them to calculate image-based words, i.e. spectral, PLAND and AI words. For a selected
, spectral features are calculated in terms of EquationEquation (5)
(5)
(5) ; then the Euclidean distances to all the spectral words in the dictionary are calculated, and finally the nearest word will be determined as the corresponding
. On this basis, we can calculate
and
. POI words can be directly acquired according to the POIs contained in this UFZ.
Figure 5. The extraction of semantic features.
The sampling interval of image pixels in a UFZ needs to be determined. Actually, the distribution of POIs is unbalanced as there are more POIs in built-up areas especially in commercial zones, but few in suburbs and rural areas. From another perspective, POIs are more related to the zones with more human activities, while image-based features are concerned with the natural zones, such as greenbelts and bare lands. In order to make better use of the advantages of both image-based features and POI data, the proportions of the image- and POI-based words in a UFZ are determined by an adaptive sampling interval of image pixels:
where is the sampling interval for
;
is the base sampling interval;
is the POI number within
, and
is the average POI number for all UFZs. According to EquationEquation (8)
(8)
(8) , the less POIs in a UFZ are, the more image-based words will be. Supposing a UFZ contains a pixels and b POIs, then it contains
words. After expressing all the UFZs, we get the topic distribution
for each UFZ using LDA (GibbsLDA++, https://sourceforge.net/projects/jgibblda/), and then take them as semantic features.
2.5. UFZ classification
After obtaining the semantic features for each UFZ, SVM is applied to classify UFZs, which has been validated in classifying high-dimensional features (Lilleberg, Zhu, and Zhang Citation2015; Liu et al. Citation2017). The basic model of SVM is to find a hyperplane in high-dimensional feature space to resolve the linearly inseparable problems (Cortes and Vapnik Citation1995). OpenCV3.0 is used to implement SVM classification and Radial Basis Function (RBF) kernel is adopted as it has been proved effective in most classification problems (Keerthi and Lin Citation2003). In this study, the proportion of training and testing datasets is determined based on experience (Liu et al. Citation2017; Zhang et al. Citation2017c). Sixty percent of the selected UFZ samples are used as training dataset and the other 40% as testing dataset. The SVM model requires two finely tuned parameters: the penalty C factor and the kernel parameter . To find the best parameter configuration, 75% of the training dataset is used for model training and the other 25% for validation. The parameter combination leading to the highest validation accuracy is deemed the best parameters. Then, the optimized SVM model is trained using the training dataset and applied to the testing dataset for accuracy assessment.
3. Experiments
3.1. Experimental data
Experiments are carried out in the study area located in Beijing covering part of Haidian, Changping, and Chaoyang Districts (). The area is about 550 km2 including urban built-up areas, suburbs, and rural areas. Not only most universities in Beijing, but also many high-tech companies, famous tourist attractions, a large number of residential districts, industrial zones, and shantytowns are located in this area, leading to a complex urban environment, which makes the UFZ mapping task difficult.
Figure 6. The study area in Beijing.
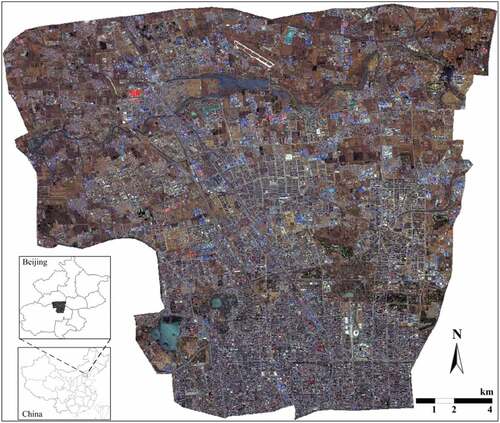
ZiYuan-3 (ZY-3) image is used to map UFZs of the study area. The spatial resolutions of the panchromatic and multispectral bands are 2.1 m and 5.8 m, respectively. Panchromatic cameras can reach a width of 2500 km2 per imagery, while 2704 km2 can be reached by multispectral cameras, thus ZY-3 images are suitable for large-scale UFZ mapping. In this study, a single multispectral ZY-3 image and a single panchromatic image acquired in 2013 are fused using a pansharpening method embedded in ENVI 5.0. The obtained image has four spectral channels with a resolution of 2.1m/pixel.
POI data are provided by Gaode Map Services (https://lbs.amap.com/), which is one of the most used web map service providers in China. A total number of 60,869 POIs is considered in the study area with 7 classes: company (14,860), residence (5075), institution (5830), scenic (714), restaurant (7301), store (25,278), and office building (1811). However, the proportions of POIs corresponding to each kind of urban function are far from balanced, as commercial-related POIs account for a large proportion of the dataset. For example, there are a large number of store POIs that just cover a small area while the residence POIs are relatively less but one residence typically covers a large area. Therefore, the original POIs cannot indicate the urban functions well with respect to volumes. Accordingly, POI data should be modified. In this study, different categories of POIs are assigned with different weights ranging from 1 to 10. In our experiment, the weights of company, residence, institution, scenic, restaurant, store, and office building are set to 1, 5, 10, 10, 1, 1, and 5, respectively. In other words, we expand the number of POIs according to its weight. For example, for a residential zone, its POI numbers of company, residence, institution, scenic, restaurant, store, and office building are {0, 5, 1, 0, 2, 10, 0}, after expanding, it will be changed to {0, 25, 10, 0, 2, 10, 0}. The free accessibility makes OSM a promising data source for segmenting UFZs which has been successfully used in mapping UFZs (Yuan et al. Citation2014; Hu et al. Citation2016; Liu et al. Citation2017; Zhang et al. Citation2017c; Song et al. Citation2018). In this study, road vectors derived from OSM are used in the UFZ segmentation.
3.2. Experimental results
The classification system used in this study is adapted from the Chinese land use classification criterion (GB/T21010-2007). Six categories are adopted including commercial zones, residential zones, institutional zones, industrial zones, shantytowns, and open spaces. The definitions are shown in .
Table 2. The classification system.
The segmentation scale for image segmentation is set to 50 (Section 2.1 step (2)), while the segmentation scale for UFZ segmentation is set to 60 (Section 2.1 step (3)). The sampling interval and patch size in calculating image-based features are set to 20 and 20 × 20. Fifty clustering centers for K-means are adopted. The base sampling interval in constructing documents for UFZs is set to 10 (EquationEquation (8)(8)
(8) ). For LDA, the number of topics and the hyper parameter of topic distribution are set to 60 and 1.2, respectively.
3.2.1. Segmentation results
In this urban area, a total of 2834 UFZs is segmented () and two local regions are selected to demonstrate the effectiveness of the improved segmentation method.
Figure 7. The UFZ segmentation results. (a) segmented UFZs and (b) two local regions circled by red box in (a) (A1 and B1 are the road blocks; A2 and B2 are the segmented UFZs without road vectors; A3 and B3 are the segmented UFZs by the improved method).
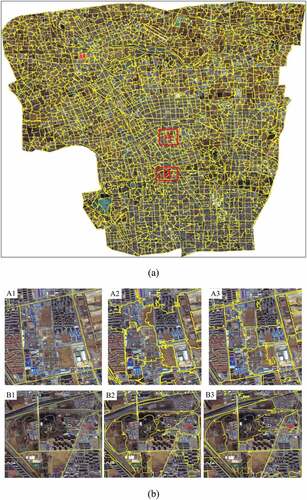
In our segmentation results, most of the UFZs are segmented completely retaining good edge information, especially for the zones surrounded by roads. In addition, zones with significant spatial characteristics are better segmented, such as residential districts with regularly distributed buildings. As can be seen in (b), compared with the road segmented blocks, the generated UFZs by our method are more appropriate for UFZ mapping as the road blocks have mixed functions caused by the sparseness of road networks, which will be a major issue influencing mapping accuracy (Zhang et al. Citation2017c). Furthermore, there is a lack of road network in rural areas, leading to that road segmentation is impossible to be achieved in these areas, thus an alternative solution is needed. In the results of segmentation without road vectors, UFZs may cross the roads () A2), while integrating road vectors eliminates this phenomenon () A3). Accordingly, the improved UFZ segmentation method performs better than the road blocks and the context-enabled segmentation method without road vectors (Du et al. Citation2019). The segmented UFZs in this study are expected to hold great potential for the task of large-scale UFZ mapping.
To quantitatively evaluate the segmentation results, a pure index is designed for measuring the differences between the referenced UFZs and the segmented results. For each referenced UFZ , a segmented zone
that has the largest overlapping with
can be found, thus the pure index
of
and the average pure index
of all referenced UFZs can be defined as:
where is the number of referenced UFZ;
refers to the maximum area. Accordingly,
measures the consistency between segmentation results and references and a large
indicates a good segmentation result.
As it is difficult to obtain the ground truths of all UFZs, a total of 100 referenced UFZs with different types and sizes is manually delineated in the VHR images, assisted by Baidu Map (https://map.baidu.com) and field investigations. For UFZs that are familiar to us, we delineate them directly from VHR images; while others we determine them according to the Baidu Map and field investigations. For the segmentation results (), the calculated average pure index is 0.71 indicating that most of the segmented UFZs are pure. This demonstrates that the proposed UFZ segmentation method is effective for generating UFZs.
3.2.2. Classification results
In this study, 710 UFZs are selected as sample dataset. Their function types are identified based on the VHR images, Baidu Map (https://map.baidu.com) and field investigations. The classification results are shown in and two local regions are selected to demonstrate the effectiveness of the proposed method. As shown in , residential zones cover more than one-third of this area, and most of the institutional zones, mainly including school campuses, are located in the south built-up areas, while the industrial zones, shantytowns, and open spaces mainly located in the north suburbs. Actually, Beijing is experiencing a large-scale urbanization and expanding to the outside regions (north regions in this case). For the two local regions in , they have complex environments and include residential zones, industrial zones, open spaces, and shantytowns. It can be seen that most UFZs are exactly distinguished, indicating that the proposed classification method is effective.
Figure 8. Classification results of UFZs. (a) classification results and (b) two local regions circled by red box in (a).
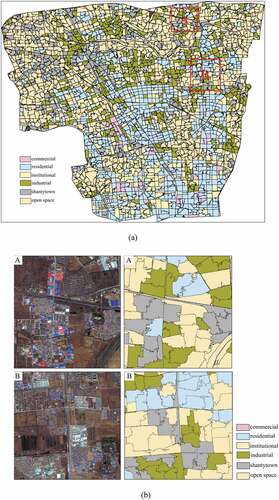
The confusion matrix is listed in . An overall accuracy of 85.9% is achieved with a Kappa of 0.82 showing that this method has great feasibility for mapping large-scale UFZs. Open spaces have obtained the highest producer’s accuracy of 98.3% benefiting from their homogeneous spectral and landscape characteristics. Residential zones have also obtained a higher producer’s accuracy of 91.6% as they are typically with regular spatial patterns of geographic objects leading to similar values in spectral and landscape characteristics. The accuracy of the institutional zone is lowest. According to , it can be drawn that six institutional zones are misclassified into residential zones while six residential zones are misclassified into institutional zones, indicating that these two types of UFZs are easily confused with each other. The main reason is that most of the institutional zones are campuses while many dormitories within campuses are confused with residential buildings. Three and two shantytowns are misclassified into residential and industrial zones, respectively, due to their complex environment and proximity to and mixture with residential and industrial zones. Ten industrial zones are misclassified into shantytowns. This is because they are usually mixed together and similar in spectral features (their buildings typically have blue roofs).
Table 3. The confusion matrix of UFZ classification results.
4. Discussion
4.1. UFZ segmentation
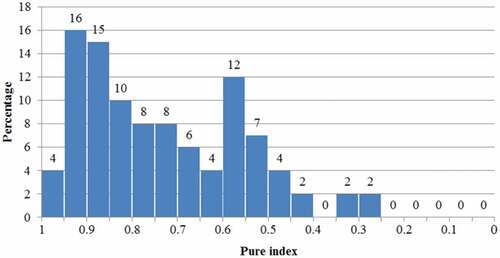
To further validate the UFZ segmentation results, we gather the statistics of the pure index of all referenced UFZs (EquationEquation (9)(9)
(9) ), and the results are shown in . It can be seen that there are 20% highly pure UFZs with a pure index of over 0.9. UFZs with pure index larger than 0.75 are often regarded as moderately pure ones, and in our results, 53% of the segmented UFZs are pure. The lowest pure index is larger than 0.25 and only 10% UFZs have pure index lower than 0.5. On the other hand, if road blocks are used as spatial units for mapping UFZs, the results are highly influenced by the completeness and the quality of used road vectors. The average pure index
of the segmentation method without road vectors (Du et al. Citation2019) is 0.63, while that of the improved method is 0.71, indicating that the combination of road vectors and images can effectively improve the UFZ segmentation quality. The main reason is that roads can prohibit the segmented UFZs cross the roads (EquationEquation (3)
(3)
(3) ). Accordingly, the improved UFZ segmentation method is more appropriate for large-scale UFZ mapping and does an adequate job for generating UFZs.
Figure 9. Statistics of pure index.
4.2. Topic modeling results
It is interesting to examine the discovered topics and their relevance to UFZ categories. shows the top topics and the average topic distribution in different UFZ categories. Here, each topic is represented by the first six high-probability words and the average topic distribution is computed by averaging the topic distribution of the UFZs in each category.
Table 4. The top topics and average topic distribution in different UFZ categories.
As shown in , topics 27, 2 and 38 are the top topics for commercial zones, and among these three topics, POI words including “office building” and “company” have the highest probability. Residential zones have a flatter topic distribution, but for the top topics 19 and 18, the POI word “residence” has the highest probability. It indicates that “residence” is most important for recognizing residential zones. For institutional zones, both the top topics 16, 45 and 52 have the highest probability word “institution,” indicating that the POI word “institution” is significant for recognizing institutional zones. Compared with commercial, residential, and institutional zones, industrial zones, shantytowns, and open spaces rely more on image features for recognition. This is expected and reasonable because the first three have more human activities which are strongly correlated with POI data. For industrial zones, landscape features of AI have a greater effect. Although for industrial zones, shantytowns, and open spaces, no words are salient, they are still distinguishable in topic distribution. In general, the topic distribution mined by LDA for different categories of UFZs contributes much to recognize UFZs.
To further prove the effectiveness of semantic features (i.e. topic distribution) delivered by LDA, an additional experiment that without LDA is conducted. Here, the frequencies of different words in the multi-source dictionary are regarded as the features for UFZs, i.e. each UFZ is characterized by a dimension vector with each dimension representing the frequency of one word, where
is the number of words in the multi-source dictionary. The classification results are shown in .
Table 5. Classification results without LDA.
As shown in , an overall accuracy of 79.9% is achieved by the method without LDA. Compared with the results () using semantic features, the accuracy is improved by 6%. It can also be obtained that the proposed method achieves higher accuracies for all the UFZ categories. This further proves that the semantic features have a better discrimination power for different UFZs.
4.3. Parameter analysis
In this method, LDA is applied to map low-level features of physical and social attributes into high-level semantic features for distinguishing UFZs; thus, two important parameters in LDA are analyzed including the number of topics and the topic distribution parameter . When analyzing the influence of the number of topics,
is set to 1.2, while when analyzing the influence of
, the number of topics is set to 60. The analysis results are shown in .
Figure 10. Parameter influence analysis. (a) number of topics and (b) parameter .
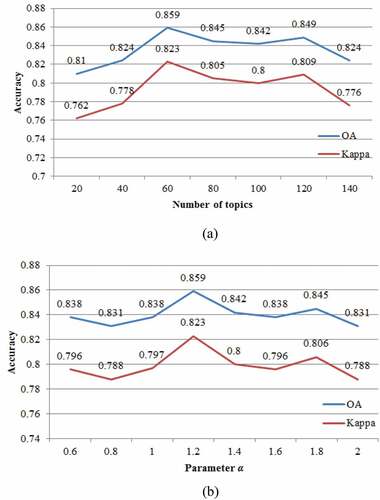
As shown in , the number of topics has a greater impact on the classification results. When the number of topics ranges from 20 to 60, the accuracy will gradually increase. Actually, small number of topics weakens the discrimination of semantic features in distinguishing different UFZs. When the number of topics reaches 60, the best accuracy is obtained. influences the final topic distribution of each document. A larger
will make the topic distribution between different documents aggregated. In (b), as
changes, the overall accuracy ranges from 83.1% to 85.9%. Accordingly,
has little effect on the final classification accuracy, and when
is set to 1.2, the result is the best.
4.4. Comparison with existing studies
For UFZ mapping, most studies rely solely on either remote sensing images (Walde et al. Citation2014; Zhang, Du, and Zhang Citation2018) or open social data (Yuan et al. Citation2014; Tu et al. Citation2017). Nowadays, integrating both of these data for better mapping UFZs has becoming popular and popular (Zhang et al. Citation2017c; Jia et al. Citation2018; Song et al. Citation2018). These methods, including our proposed method, are different in the data sources, spatial units, and study areas. The comparisons of these methods are shown in .
Table 6. Comparisons of different methods.
Among these methods, sub-meter-level VHR images are the most commonly used, due to they can provide accurate information on ground objects (Liu et al. Citation2017; Zhang et al. Citation2017c; Song et al. Citation2018). However, the expensive cost makes it unsuitable for large-scale UFZ mapping as shown in , thus they are only used in study areas of about 100 square kilometers. Medium-resolution images are easy to acquire for mapping large-scale UFZs (e.g. thousands to tens of thousands of square kilometers), but they can hardly produce fine-grained UFZs due to lower spatial resolution and coarse details of ground objects (Hu et al. Citation2016; Jia et al. Citation2018). As a result, meter-level VHR images used in this study have more advantages for mapping fine-grained and large-scale UFZs. In the work of Tu et al. (Citation2018), landscape metrics calculated from meter-level VHR images and human activities extracted from massive MPPD were integrated to identify UFZs by a hierarchical clustering approach. However, the classification system is too coarser (urban center, sub-center, suburbs, urban buffer). For the spatial unit, the comparison between the road blocks and our segmentation method has been shown in , demonstrating the effectiveness of our method. Image tiles are easy to be used but they cannot represent the exact UFZs with various shapes and sizes. The overall accuracy ranges from 77.8% to 86.5%. Although only images and POIs are used in this study, the proposed method achieves a higher accuracy. For our approach, the utilization of MPPD will further improve the classification accuracy (e.g. for commercial zones, there are more people during the day and fewer people at night, just the opposite for residential zones). In summary, the proposed method outperforms existing methods due to its easy acquisition in data, appropriate spatial units, and large overall accuracy for fine-grained and large-scale UFZ mapping.
4.5. Limitations and possible improvements
This method considers the spectral and landscape features, but these features are not enough for classifying complex UFZs. With the remarkable success of deep learning approaches, the deeply learned features can be incorporated into this framework for better distinguishing urban functions.
Despite the quantitative bias, the POIs are currently the most commonly used data sources to represent human social and economic activities (Hu et al. Citation2016; Liu et al. Citation2017; Zhang et al. Citation2017c). However, the numbers of POIs vary among categories, leading to an unbalanced distribution. As a result, the original POIs cannot indicate the urban functions well with respect to volumes. Although we just directly expand their numbers according to the weights of different categories of POIs, this will be more beneficial than directly using them (Liu et al. Citation2017; Jia et al. Citation2018), because it changes the numbers of different categories of POI-words when expressing UFZs. The limitation of POIs further inspires the employment of multi-sourced open social data, such as MPPD, social media data, and GNSS trajectories.
Except open social data, two kinds of information will be also useful: building signs along streets and building height. The building signs along streets are usually different for those different UFZs (Li, Zhang, and Weidong Citation2017; Zhang et al. Citation2017a). They may be extracted from Google street view (https://ggstreetview.com/) or Tencent street view (https://map.qq.com/) images. Zhang et al. (Citation2017a) used building signs along streets to improve the classification accuracy of some urban land use classes, especially mixed residential and commercial buildings. For building height information, buildings in industrial zones and shantytowns tend to be low-rise, while they tend to be high-rise in other urban areas, especially in commercial zones. Large-scale building height information may be represented by the Floor Area Ratio (FAR) data, which may be available from local government administration in some places. The Mid-rise and Taller Buildings (MTBs) density can be estimated from identified shadows in remote sensing images (Zhang et al. Citation2017b). These two kinds of information may be potential solutions to help improve the classification accuracy of UFZs.
5. Conclusions
UFZs are essential for monitoring urbanization and uncovering social and physical characteristics in cities. However, the complex and heterogeneous nature of cities pose great challenges to accurately and effectively mapping UFZs. In this study, a context-enabled UFZ segmentation method is improved to generate UFZ units by integrating VHR images and road vectors. Thereafter, VHR images and POIs are integrated to detect urban functions. For better classification, low-level physical features including spectral and landscape metrics and POI data are mapped into high-level semantic features by LDA to characterize UFZs. Finally, we fused the multi-source semantic information into an SVM classifier to identify different urban functions. An overall classification accuracy of 85.9% was achieved in the study area of Beijing. The experimental results indicate that the proposed approach is more appropriate for UFZ mapping than traditionally used road blocks and image tiles. Moreover, the multi-source data fusion strategy offers interesting perspectives for integrating physical and social attributes to investigate UFZs. Accordingly, this study can fulfill the increasing demands for the timely fine-grained UFZ maps.
Future work includes two aspects. First, a deep learning strategy can be employed to extract deeply learned features from VHR images. Second, the potential of various open social data can be explored to better identify urban functions, such as mobile phone positioning data and GNSS trajectories.
Disclosure statement
No potential conflict of interest was reported by the authors.
Additional information
Funding
References
- Antunes, R. R., T. Blaschke, D. Tiede, E. S. Bias, G. A. O. P. Costa, and P. N. Happ. 2019. “Proof of Concept of a Novel Cloud Computing Approach for Object-based Remote Sensing Data Analysis and Classification.” GIScience & Remote Sensing 56 (4): 536–553. doi:10.1080/15481603.2018.1538621.
- Anwer, R. M., F. S. Khan, J. van de Weijer, M. Molinier, and J. Laaksonen. 2018. “Binary Patterns Encoded Convolutional Neural Networks for Texture Recognition and Remote Sensing Scene Classification.” ISPRS Journal of Photogrammetry and Remote Sensing 138: 74–85. doi:10.1016/j.isprsjprs.2018.01.023.
- Baatz, M., and A. Schape. 2000. “Multiresolution Segmentation: An Optimization Approach for High Quality Multi-Scale Image Segmentation.” In Angewandte Geographische Informationsverarbeitung XII, edited by J. Strobl, T. Blaschke, and G. Griesebner, 12–23. Heidelberg: Wichmann-Verlag.
- Bagan, H., and Y. Yamagata. 2015. “Analysis of Urban Growth and Estimating Population Density Using Satellite Images of Nighttime Lights and Land-use and Population Data.” GIScience & Remote Sensing 52 (6): 765–780. doi:10.1080/15481603.2015.1072400.
- Banzhaf, E., and R. Hofer. 2008. “Monitoring Urban Structure Types as Spatial Indicators with CIR Aerial Photographs for a More Effective Urban Environmental Management.” IEEE Journal of Selected Topics in Applied Earth Observations and Remote Sensing 1 (2): 129–138. doi:10.1109/JSTARS.2008.2003310.
- Blei, D. M., A. Y. Ng, and M. I. Jordan. 2003. “Latent Dirichlet Allocation.” Journal of Machine Learning Research 3 (Jan): 993–1022.
- Boykov, Y., O. Veksler, and R. Zabih. 2001. “Fast Approximate Energy Minimization via Graph Cuts.” IEEE Transactions on Pattern Analysis and Machine Intelligence 23 (11): 1222–1239. doi:10.1109/34.969114.
- Cao, S., H. Deyong, W. Zhao, M. You, C. Yu, and Y. Zhang. 2019. “Monitoring Changes in the Impervious Surfaces of Urban Functional Zones Using Multisource Remote Sensing Data: A Case Study of Tianjin, China.” GIScience & Remote Sensing 56 (7): 967–987. doi: 10.1080/15481603.2019.1600110.
- Cortes, C., and V. Vapnik. 1995. “Support-vector Networks.” Machine Learning 20 (3): 273–297. doi:10.1007/BF00994018.
- Crooks, A., D. Pfoser, A. Jenkins, A. Croitoru, A. Stefanidis, D. Smith, S. Karagiorgou, A. Efentakis, and G. Lamprianidis. 2015. “Crowdsourcing Urban Form and Function.” International Journal of Geographical Information Science 29 (5): 720–741. doi:10.1080/13658816.2014.977905.
- Deal, B., and D. Schunk. 2004. “Spatial Dynamic Modeling and Urban Land Use Transformation: A Simulation Approach to Assessing the Costs of Urban Sprawl.” Ecological Economics 51 (1–2): 79–95. doi:10.1016/j.ecolecon.2004.04.008.
- Du, S., S. Du, B. Liu, and X. Zhang. 2019. “Context-Enabled Extraction of Large-Scale Urban Functional Zones from Very-High-Resolution Images: A Multiscale Segmentation Approach.” Remote Sensing 11 (16): 1902. doi:10.3390/rs11161902.
- Frias-Martinez, V., and E. Frias-Martinez. 2014. “Spectral Clustering for Sensing Urban Land Use Using Twitter Activity.” Engineering Applications of Artificial Intelligence 35: 237–245. doi:10.1016/j.engappai.2014.06.019.
- Gao, S., K. Janowicz, and H. Couclelis. 2017. “Extracting Urban Functional Regions from Points of Interest and Human Activities on Location‐based Social Networks.” Transactions in GIS 21 (3): 446–467. doi:10.1111/tgis.2017.21.issue-3.
- Grippa, T., C. Linard, M. Lennert, S. Georganos, N. Mboga, S. Vanhuysse, A. Gadiaga, and E. Wolff. 2019. “Improving Urban Population Distribution Models with Very-High Resolution Satellite Information.” Data 4 (1): 13. doi:10.3390/data4010013.
- Herold, M., X. Liu, and K. C. Clarke. 2003. “Spatial Metrics and Image Texture for Mapping Urban Land Use.” Photogrammetric Engineering & Remote Sensing 69 (9): 991–1001. doi:10.14358/PERS.69.9.991.
- Hu, T., J. Yang, L. Xuecao, and P. Gong. 2016. “Mapping Urban Land Use by Using Landsat Images and Open Social Data.” Remote Sensing 8 (2): 151. doi:10.3390/rs8020151.
- Huang, B., B. Zhao, and Y. Song. 2018. “Urban Land-use Mapping Using a Deep Convolutional Neural Network with High Spatial Resolution Multispectral Remote Sensing Imagery.” Remote Sensing of Environment 214: 73–86. doi:10.1016/j.rse.2018.04.050.
- Hussain, E., and J. Shan. 2016. “Object-based Urban Land Cover Classification Using Rule Inheritance over Very High-resolution Multisensor and Multitemporal Data.” GIScience & Remote Sensing 53 (2): 164–182. doi:10.1080/15481603.2015.1122923.
- Jendryke, M., T. Balz, S. C. McClure, and M. Liao. 2017. “Putting People in the Picture: Combining Big Location-based Social Media Data and Remote Sensing Imagery for Enhanced Contextual Urban Information in Shanghai.” Computers, Environment and Urban Systems 62: 99–112. doi:10.1016/j.compenvurbsys.2016.10.004.
- Jia, Y., Y. Ge, F. Ling, X. Guo, J. Wang, L. Wang, Y. Chen, and L. Xiaodong. 2018. “Urban Land Use Mapping by Combining Remote Sensing Imagery and Mobile Phone Positioning Data.” Remote Sensing 10 (3): 446. doi:10.3390/rs10030446.
- Keerthi, S. S., and C.-J. Lin. 2003. “Asymptotic Behaviors of Support Vector Machines with Gaussian Kernel.” Neural Computation 15 (7): 1667–1689. doi:10.1162/089976603321891855.
- Kusumaningrum, R., H. Wei, R. Manurung, and A. Murni. 2014. “Integrated Visual Vocabulary in Latent Dirichlet Allocation–based Scene Classification for IKONOS Image.” Journal of Applied Remote Sensing 8 (1): 083690. doi:10.1117/1.JRS.8.083690.
- Li, X., C. Zhang, and L. Weidong. 2017. “Building Block Level Urban Land-use Information Retrieval Based on Google Street View Images.” GIScience & Remote Sensing 54 (6): 819–835. doi:10.1080/15481603.2017.1338389.
- Lilleberg, J., Y. Zhu, and Y. Zhang. 2015. “Support Vector Machines and Word2vec for Text Classification with Semantic Features.” Paper presented at the 2015 IEEE 14th International Conference on Cognitive Informatics & Cognitive Computing (ICCI* CC), Beijing, China, 6–8 July 2015.
- Liu, X., J. He, Y. Yao, J. Zhang, H. Liang, H. Wang, and Y. Hong. 2017. “Classifying Urban Land Use by Integrating Remote Sensing and Social Media Data.” International Journal of Geographical Information Science 31 (8): 1675–1696. doi:10.1080/13658816.2017.1324976.
- Long, J., E. Shelhamer, and T. Darrell. 2015. “Fully Convolutional Networks for Semantic Segmentation.” Paper presented at the Proceedings of the IEEE conference on computer vision and pattern recognition, Boston, Massachusetts, 7–12, June 2015.
- Lu, C., X. Yang, Z. Wang, and Z. Li. 2018. “Using Multi-level Fusion of Local Features for Land-use Scene Classification with High Spatial Resolution Images in Urban Coastal Zones.” International Journal of Applied Earth Observation and Geoinformation 70: 1–12. doi:10.1016/j.jag.2018.03.010.
- Nielsen, M. M. 2015. “Remote Sensing for Urban Planning and Management: The Use of Window-independent Context Segmentation to Extract Urban Features in Stockholm.” Computers, Environment and Urban Systems 52: 1–9. doi:10.1016/j.compenvurbsys.2015.02.002.
- Nogueira, K., O. A. B. Penatti, and J. A. Dos Santos. 2017. “Towards Better Exploiting Convolutional Neural Networks for Remote Sensing Scene Classification.” Pattern Recognition 61: 539–556. doi:10.1016/j.patcog.2016.07.001.
- Pei, T., S. Sobolevsky, C. Ratti, S.-L. Shaw, L. Ting, and C. Zhou. 2014. “A New Insight into Land Use Classification Based on Aggregated Mobile Phone Data.” International Journal of Geographical Information Science 28 (9): 1988–2007. doi:10.1080/13658816.2014.913794.
- Ríos, S. A., and R. Muñoz. 2017. “Land Use Detection with Cell Phone Data Using Topic Models: Case Santiago, Chile.” Computers, Environment and Urban Systems 61: 39–48. doi:10.1016/j.compenvurbsys.2016.08.007.
- Rosser, J. F., D. G. Leibovici, and M. J. Jackson. 2017. “Rapid Flood Inundation Mapping Using Social Media, Remote Sensing and Topographic Data.” Natural Hazards 87 (1): 103–120. doi:10.1007/s11069-017-2755-0.
- Soliman, A., K. Soltani, J. Yin, A. Padmanabhan, and S. Wang. 2017. “Social Sensing of Urban Land Use Based on Analysis of Twitter Users’ Mobility Patterns.” PloS One 12 (7): e0181657. doi:10.1371/journal.pone.0181657.
- Song, J., T. Lin, X. Li, and A. Prishchepov. 2018. “Mapping Urban Functional Zones by Integrating Very High Spatial Resolution Remote Sensing Imagery and Points of Interest: A Case Study of Xiamen, China.” Remote Sensing 10 (11): 1737. doi:10.3390/rs10111737.
- Teodoro, A. C., and R. Araújo. 2016. “A Comparison of Performance of OBIA Techniques Available in Open Source Software (Spring and OTB/Monteverdi) considering Very High Spatial Resolution Data.” Journal of Applied Remote Sensing 10 (1): 016011. doi:10.1117/1.JRS.10.016011.
- Tu, W., J. Cao, Y. Yue, S.-L. Shaw, M. Zhou, Z. Wang, X. Chang, Y. Xu, and Q. Li. 2017. “Coupling Mobile Phone and Social Media Data: A New Approach to Understanding Urban Functions and Diurnal Patterns.” International Journal of Geographical Information Science 31 (12): 2331–2358. doi:10.1080/13658816.2017.1356464.
- Tu, W., Z. Hu, L. Li, J. Cao, J. Jiang, Q. Li, and Q. Li. 2018. “Portraying Urban Functional Zones by Coupling Remote Sensing Imagery and Human Sensing Data.” Remote Sensing 10 (1): 141. doi:10.3390/rs10010141.
- Veksler, O., Y. Boykov, and P. Mehrani. 2010. “Superpixels and Supervoxels in an Energy Optimization Framework.” Paper presented at the European conference on Computer vision, Crete, Greece, 5–11 September 2010.
- Voltersen, M., C. Berger, S. Hese, and C. Schmullius. 2014. “Object-based Land Cover Mapping and Comprehensive Feature Calculation for an Automated Derivation of Urban Structure Types at Block Level.” Remote Sensing of Environment 154: 192–201. doi:10.1016/j.rse.2014.08.024.
- Walde, I., S. Hese, C. Berger, and C. Schmullius. 2014. “From Land Cover-graphs to Urban Structure Types.” International Journal of Geographical Information Science 28 (3): 584–609. doi:10.1080/13658816.2013.865189.
- Wang, G., B. Fan, S. Xiang, and C. Pan. 2017. “Aggregating Rich Hierarchical Features for Scene Classification in Remote Sensing Imagery.” IEEE Journal of Selected Topics in Applied Earth Observations and Remote Sensing 10 (9): 4104–4115. doi:10.1109/JSTARS.2017.2705419.
- Yuan, N. J., Y. Zheng, X. Xie, Y. Wang, K. Zheng, and H. Xiong. 2014. “Discovering Urban Functional Zones Using Latent Activity Trajectories.” IEEE Transactions on Knowledge and Data Engineering 27 (3): 712–725. doi:10.1109/TKDE.2014.2345405.
- Zhang, W., W. Li, C. Zhang, D. M. Hanink, X. Li, and W. Wang. 2017a. “Parcel-based Urban Land Use Classification in Megacity Using Airborne LiDAR, High Resolution Orthoimagery, and Google Street View.” Computers, Environment and Urban Systems 64: 215–228. doi:10.1016/j.compenvurbsys.2017.03.001.
- Zhang, W., W. Li, C. Zhang, and W. B. Ouimet. 2017b. “Detecting Horizontal and Vertical Urban Growth from Medium Resolution Imagery and Its Relationships with Major Socioeconomic Factors.” International Journal of Remote Sensing 38 (12): 3704–3734. doi:10.1080/01431161.2017.1302113.
- Zhang, X., S. Du, and Y.-C. Wang. 2015. “Semantic Classification of Heterogeneous Urban Scenes Using Intrascene Feature Similarity and Interscene Semantic Dependency.” IEEE Journal of Selected Topics in Applied Earth Observations and Remote Sensing 8 (5): 2005–2014. doi:10.1109/JSTARS.2015.2414178.
- Zhang, X., S. Du, and Y. Zhang. 2018. “Semantic and Spatial Co-Occurrence Analysis on Object Pairs for Urban Scene Classification.” IEEE Journal of Selected Topics in Applied Earth Observations and Remote Sensing 11 (8): 2630–2643. doi:10.1109/JSTARS.4609443.
- Zhang, Y., L. Qiangzi, H. Huang, W. Wei, X. Du, and H. Wang. 2017c. “The Combined Use of Remote Sensing and Social Sensing Data in Fine-grained Urban Land Use Mapping: A Case Study in Beijing, China.” Remote Sensing 9 (9): 865.
- Zhao, B., Y. Zhong, G.-S. Xia, and L. Zhang. 2015. “Dirichlet-derived Multiple Topic Scene Classification Model for High Spatial Resolution Remote Sensing Imagery.” IEEE Transactions on Geoscience and Remote Sensing 54 (4): 2108–2123. doi:10.1109/TGRS.2015.2496185.
- Zhao, L.-J., P. Tang, and L.-Z. Huo. 2014. “Land-use Scene Classification Using a Concentric Circle-structured Multiscale Bag-of-visual-words Model.” IEEE Journal of Selected Topics in Applied Earth Observations and Remote Sensing 7 (12): 4620–4631. doi:10.1109/JSTARS.2014.2339842.
- Zheng, C., Y. Zhang, and L. Wang. 2017. “Semantic Segmentation of Remote Sensing Imagery Using an Object-based Markov Random Field Model with Auxiliary Label Fields.” IEEE Transactions on Geoscience and Remote Sensing 55 (5): 3015–3028. doi:10.1109/TGRS.2017.2658731.