
 ?Mathematical formulae have been encoded as MathML and are displayed in this HTML version using MathJax in order to improve their display. Uncheck the box to turn MathJax off. This feature requires Javascript. Click on a formula to zoom.
ABSTRACT
Inner Mongolia is an important ecological zone of northern China and 67% of its land area is grassland. This ecologically fragile region has experienced significant vegetation degradation during the last decades. Although the spatial extents and rates of vegetation change have previously been characterized through various remote sensing and GIS studies, the underlying driving factors of vegetation changes are still not well understood. In this study, we first used time-series MODIS NDVI data from 2000 to 2016 to characterize the temporal trend of vegetation changes. These vegetation change trends were compared with climate and socioeconomic variables to determine the potential drivers. We used a set of statistical methods, including multiple linear regression (MLR), spatial correlation analysis, and partial least squares (PLS) regression analyzes, to quantify the spatial distribution of the driving forces and their relative importance to vegetation changes. Results show that the main driving factors and their impact magnitude (weight) are in the order of human activities (r = -0.785, p < 0.01, VIP = 1.37), precipitation (r = 0.541, p < 0.05, VIP = 0.89), temperature (r = -0.319, p > 0.05 VIP = 0.59). The area affected by human activities was 10.57%. Specific human activities, such as coal mining and grazing were negatively associated with vegetation cover, while eco-engineering projects had positive impacts. This study provided thorough quantification of driving forces of vegetation change and enhanced our understanding of their interactions. Our integrated geospatial-statistical approach is particularly important for sustainable development of ecosystem balance in Chen Barag Banner and other areas facing similar challenges.
Introduction
Approximately 40% of China’s total land area is covered by grassland (Kang et al. Citation2007). The main grassland region of China is located in Inner Mongolia, an autonomous region of northern China. Over the last several decades, Inner Mongolia grassland has experienced rapid degradation attributed to both anthropogenic activities and climate stress (Wu et al. Citation2015; Wang et al. Citation2017). Grassland primary productivity in Inner Mongolia has been steadily deteriorating at an annual rate of 2% (Angerer et al. Citation2008). A large number of previous published studies reported negative impacts of grassland degradation on soil erosion, air pollution, biodiversity, and the livelihood of millions of residents in the region (Mu et al. Citation2013; Zhang et al. Citation2018).
Climate variability has direct impacts on the growth diversity and spatial distribution of vegetation in grassland ecosystem (Parmesan and Yohe Citation2003; Zhang et al. Citation2018). Precipitation and temperature are the two most significant factors affecting the characteristics and dynamics of grassland vegetation. Hao et al. (Citation2014) reported that the increase in the aboveground biomass and vegetation height are significantly correlated with the amount of total growing season precipitation in Inner Mongolia. Chuai et al. (Citation2013) suggested that in Inner Mongolia grassland, different vegetation types have different responses to the changes in precipitation and temperature. Phiri, Shiferaw, and Tesfamichael (Citation2020) showed strong correlation between climate data and NDVI (normalized difference vegetation index), using adjustment of one-two month time-lag. Anthropogenic activities such as mining (Qian et al. Citation2014), urban expansion (Mu et al. Citation2013), overgrazing (Watkinson and Ormerod Citation2001; Gao et al. Citation2008) generally reduce vegetation cover at the local scale. On the other hand, ecological restoration projects can improve vegetation condition through limiting grazing activities and creating grassland restoration zones (Kang et al. Citation2007).
Vegetation changes can be effectively monitored using satellite-derived vegetation indices (Rouse et al. Citation1974; Nemani et al. Citation2003; Pettorelli et al. Citation2005). Among various vegetation indices, NDVI is one of the most commonly used for assessing vegetation status, especially for arid and semi-arid areas where vegetation indices do not suffer from saturation problem (Phiri, Shiferaw, and Tesfamichael Citation2020). It is now common practice to use the 250 m Moderate Resolution Imaging Spectroradiometer (MODIS) NDVI time-series data to evaluate vegetation change trends, detect change points, and assess spatiotemporal pattern of vegetation dynamics (e.g. Huete et al. Citation2002; Beck et al. Citation2006; Szabó et al. Citation2019). The high temporal resolution (1–2 day revisit cycle) and moderate spatial resolution are particularly appealing for regional-global applications (Shao, Taff, and Lunetta Citation2011).
In addition to vegetation change analyzes, researchers have been increasingly interested in identifying their driving factors. For example, linear regression models have been used to explore the relationship between vegetation indices and climate variables in Inner Mongolia (Chuai et al. Citation2013; Hao et al. Citation2014). It should be noted that climate variability alone could not fully explain grassland vegetation change (Jiang, Han, and Wu Citation2006). With the recent intensification of human activities, it is becoming increasingly important to quantify the contribution of human activities, together with climate factors, to vegetation changes (Geerken and Ilaiwi Citation2004; Wu et al. Citation2015; Song et al. Citation2018).
One of the most widely used techniques for quantifying human-induced vegetation changes is the residual trends (RESTREND) method (Evans and Geerken Citation2004). This method distinguishes human impacts from those driven by climate variables using linear regression model. Specifically, for each pixel of satellite imagery, a linear regression model can be developed using rainfall data to predict observed NDVI values (i.e. response variable y) (Herrmann, Anyamba, and Tucker Citation2005; Li, Wu, and Huang Citation2012). The RESTREND model, which are the differences between predicted and observed NDVI values, can be computed for each pixel to approximate human-driven vegetation change (Evans and Geerken Citation2004). Li, Wu, and Huang (Citation2012) applied the RESTREND model to assess vegetation change and they determined that the main human activity driving vegetation change was overgrazing in Xilingol, Inner Mongolia. Rainfall data alone, however, may not be sufficient to account for climate-induced vegetation change. Other climate variables, such as temperature, should also be evaluated in the regression analysis. Inner Mongolia is a vast region, for sub-regions of Inner Mongolia, the human driving forces could be quite different. For example, large-scale open-pit mining and urban development may potentially have larger impacts than overgrazing in certain areas. It is thus important to assess the relative importance of such human activities. Until now, few previously published studies have thoroughly considered various climate variables and human activities in an integrated modeling framework.
The main purpose of this study was to conduct a systematic analysis of the driving factors of vegetation changes in a selected intensive study area of Chen Barag Banner, Inner Mongolia. We first examined NDVI change trends (i.e. upward or downward) from 2000 to 2016 and assessed general spatiotemporal pattern of vegetation change. We then focused on characterizing driving factors of vegetation change using extended RESTREND model. Specifically, we extended the simple linear regression within the RESTREND to multivariate linear regression analysis (MLR) to integrate multiple climatic variables. For human driving factors, we included eight socioeconomic variables to determine their relative importance. Finally, the dual response mechanism of vegetation change to climate variables and human activities was explored. The findings of this study will provide an improved understanding of the process, causes, and potential impacts of grassland degradation, which will in turn aid decision-making on grassland sustainability.
Study area and data
Study area
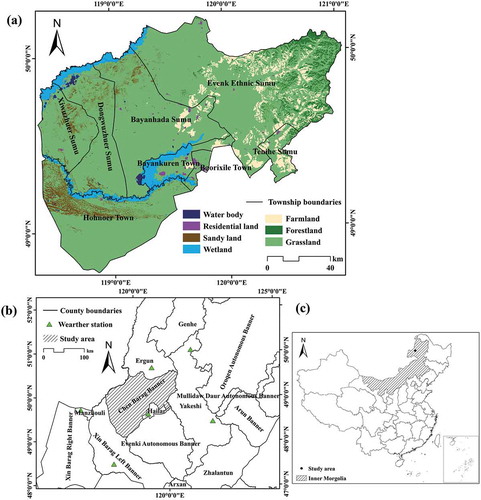
Chen Barag Banner, located in northeastern Inner Mongolia in China (), covers an area of approximately 18,600 km2 and has a population of 58,000 (http://www.cbrhq.gov.cn). This region is primarily rural with a low population density (3.12/km2). Its terrain elevation gradually increased from northeast to southwest (532 m to 1127 m). Chen Barag Banner covers two climatic zones, semi-humid in the east and arid to semi-arid in other areas. Its mean annual temperature ranges from -3°C to 0°C. The mean annual rainfall is between 240 mm and 400 mm, which are mainly concentrated from June to August (Mu et al. Citation2013). Forests and arid desert grasslands are two dominant land cover types of Chen Barag Banner, though local land use shows quite diverse spatial pattern ()). Grasslands cover an area of 15,800 km2, accounting for about 85% of the region’s total area, while forests and farmlands cover areas of 965 km2 and 835 km2, respectively (http://www.cbrhq.gov.cn). In recent years, total livestock population in Chen Barag Banner has been increasing. For example, the number of livestock in 2016 increased by 57.8% over that in 2015 (http://tjj.hlbe.gov.cn). In addition, this region has abundant mineral resources, primarily located in the Mengdong coal-power base in eastern Inner Mongolia (http://www.cbrhq.gov.cn), which is one of the 13 large-scale coal-power bases of China with 17 billion tons of coal geological reserves.
Figure 1. Detail geographical features of the study area: (a) Land use and land cover map of the study area in 2010, obtained from GLC30 information service’s website, showing the border of Chen Barag Banner township and its location within Inner Mongolia; (b) Locations of the weather stations used in the research; (c) Location of the study area within China.
Data
Satellite imagery
We used 17-year time series (2000–2016) of 250 m MODIS NDVI 16-day composite MOD13Q1 (Huete et al. Citation2002) data (https://modis.gsfc.nasa.gov/) in this study. MODIS Reliability Index (RI) was used to identify pixels with quality issues (e.g. RI>1) (Shao et al. Citation2016). The original MODIS NDVI tiles (h25v03 and h25v04) were reprojected using the MODIS reprojection tool (MRT) to WGS84 UTM zone 50 N. Vegetation covers in Inner Mongolia increases steadily from spring to summer and typically reach peak value in July or August. Therefore, for each year, we extracted NDVI layers from July to August and then used maximum NDVI value of each pixel to represent the maximum vegetation cover for each year. This maximum value compositing (MVC) technique (Holben Citation1986; Wan et al. Citation2019) can reduce data redundancy, improve computing efficiency, and simplify NDVI trend analysis and investigation of NDVI-climate variable relationships.
Climate data
Monthly average temperature and monthly precipitation data for June to August were obtained from the National meteorological information center of China (http://data.cma.cn/). The basic information of six meteorological observation stations is shown in ). In this study, raster datasets of average temperature and monthly precipitation from June to August were interpolated to a spatial resolution of 250 m to match the 250 m NDVI datasets. The accuracy verification results are shown in Table S1. In order to minimize information distortion and loss during the conversion process, we used an interpolation method known as kriging with external drift (Bivand, Pebesma, and Rubio Citation2013). The main reason to include data from June to August was to consider the time-lag effect between climate variables and NDVI (Chuai et al. Citation2013).
Socioeconomic and land cover data
The socioeconomic data sources are listed in . A total of eight socioeconomic variables were selected to represent primary human activities that may affect vegetation changes. In this study, 30 m global land-use and land-cover data products prepared by the National geographic information center in 2010 were obtained from the website of GLC30 information service (http://www.globallandcover.com). Further, administrative boundary data were obtained from the international scientific data sharing platform of the computer network information center, Chinese Academy of Sciences.
Table 1. Socioeconomic data used in the study.
Methods
Data processing
illustrates three major components used in this study. These are (i) processing of MODIS time-series data. The most important step in the component is to establish a linear fitting equation between NDVI and time to characterize the spatiotemporal characteristics of vegetation change in the study area from 2000 to 2016. (ii) analyzing the driving factors of spatiotemporal changes in vegetation. We developed linear regression models of NDVIs and climate factors. Impacts of human activities on NDVI were obtained using residual analysis. (iii) identifying the contribution of each driving factor to vegetation change calculating by the partial least squares (PLS) regression model.
Figure 2. Flowchart of the methodology used in this study.
Trend analyzes of grassland changes
For each 250 m MODIS pixel, we evaluated temporal trend of NDVI values using linear regression model. For linear regression analysis, pixels were considered individual samples, resulting in high sample sizes. NDVI value of each pixel in the whole area was plotted over time and simple linear regression applied to determine the general empirical trend. Linear regression results in a simple linear model (Wilson and Norman Citation2018) is depicted as EquationEquation (1)(1)
(1) :
where iNDVI is a dependent variable and Time (i.e. in the present case 17 years) is an independent variable, a is the slope coefficient, which measures the rate of change of iNDVI per unit of Time, and b is the intercept. The significance of this linear regression model is given by the F-test and we considered three levels of significance (0.01, 0.025, and 0.05). Further, we defined the decreasing trend of vegetation cover as D1 (a < 0; p < 0.01), D2 (a < 0; 0.01 ≤ p < 0.025), and D3 (a < 0; 0.025 ≤ p < 0.05) and the increasing trend as I1 (a > 0; p < 0.01), I2 (a > 0; 0.01 ≤ p < 0.025), and I3 (a > 0; 0.025 ≤ p < 0.05). Other no change pixels are defined as NSC, indicating no significant (p > 0.05) change in vegetation cover.
Contributions of climatic factors and human activities to vegetation changes
Climate correlation analysis
We use the partial correlation analysis to characterize the relationship between climate factors and NDVI to avoiding the self-influence between the factors (Helton et al. Citation2006). The partial correlation coefficient between variables of interest is calculated as:
where rxy•z is the partial correlation between variables x and y after removing variable z. rNDVI-P•T thus represents partial correlation between NDVI and precipitation (P, mm) after controlling temperature (T, °C) variable. Subsequently, using the F-test (Li et al. Citation2016; Burrell, Evans, and Liu Citation2017), we defined three significance levels (0.01, 0.025, and 0.05) for the correlation between climate variables (precipitation and temperature) and NDVI. We identified seven correlation trends, which are negative correlations N1 (p < 0.01), N2 (0.01 ≤ p < 0.025), and N3 (0.025 ≤ p < 0.05); positive correlations P1 (p < 0.01), P2 (0.01 ≤ p < 0.025), and P3 (0.025 ≤ p < 0.05); and no significant correlation NSC (p > 0.05).
Vegetation response to human activities
Residual analysis
In order to distinguish climate-induced and human-induced vegetation changes, we first developed multivariate linear regression (MLR) model to investigate the relationship between NDVI values and climate variables. The MLR model is expressed as EquationEquations (3(3)
(3) ) and (Equation4
(4)
(4) ).
where y is predicted NDVI value using climate variables x1 and x2 (indicating accumulated precipitation (mm) and average temperature (°C) from June to August, respectively); λ0, λ1, and λ2 are the coefficients of the regression equation. Y is the observed MODIS NDVI value. Human-induced temporal vegetation changes are represented by ξ, which is the NDVI residual value. If ξ > 0, human activities have a positive impact on vegetation; if ξ ≈ 0, human activities have a weak impact, or the observed changes in vegetation are thought to be attributable to climatic factors; and if ξ < 0, human activities have a negative impact (Evans and Geerken Citation2004).
Correlation analysis of socioeconomic variables
We conducted Spearman’s rank correlation analysis between the socioeconomic variables and NDVI to assess impacts from socioeconomic variables. Spearman’s rank correlation (r) was used because data normality and linear relationship could not be assumed (Pastorguzman, Dash, and Atkinson Citation2018).
Variable importance analysis of driving factors
In statistical regression, there might be significant interactions among variables, and the results will be biased. A PLS regression model (Geladi and Kowalski Citation1986) can solve the problem of multicollinearity among variables (Gao Citation2002) and it is one of the commonly used methods for determining the driving mechanisms of multiple factors (Prasad, Badarinath, and Eaturu Citation2008). The method combines the characteristics of principal component analysis and multiple regressions (Abdi Citation2010). Here, we were particularly interested in identifying the drivers with the most important contributions in distinguishing different NDVI trends. We benefited from the capacity of PLS to determine variable importance in a regression analysis using the PLS internal variable importance in projection (VIP) measures.
VIP is the weighted sum of the effects of the independent variables (xj), to determine the effect size (weight) and sequence relationship of each driving factor of vegetation changes over a period of almost 20 years. The higher the VIP value of variable xj, the more significant is its effect (Farres et al. Citation2015). For the j-th independent variable xj, which is used to explain the dependent variable yk, the VIP indices were computed as follows:
where p is the number of independent variables; m is the number of extracted components from independent variables; k is a dependent variable (k = 1); th is the h-th component of the independent variable, and r2(yk,th) is the correlation coefficient squared value between yk and th. whj2 shows the contribution weight the independent variable xj to the h-th component of the independent variable, si and s indicate the relative importance of independent variables (xj) and dependent variables (yk), respectively. If si > s, the independent variable has a strong effect on the dependent variable. In other words, the value of si indicates the contribution of each driving factor to vegetation changes. Here, only variables with VIP > 0.8 are selected and included in the main drivers.
Complex response analyzes of combined human-climate factors
We use the second-order partial correlation analysis model and select the residual value (calculations by formula 3–4) with 95% confidence to represent the combined human impacts.
where rNH•PT is the partial correlation between NDVI and human activity after removing the climate variable (precipitation and temperature). Other parameter meanings can be seen in the section ”Climate correlation analysis” (EquationEquation (2)(2)
(2) ).
Results
Characteristics of spatiotemporal changes of NDVI
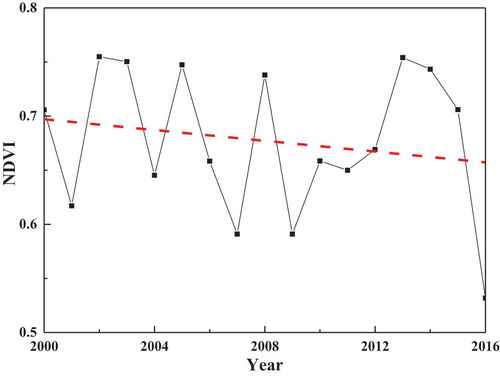
On average, the NDVI values of our study area exhibited a significant downward trend at an average rate of 0.249%·a−1 (note: a means annual change rate.) (p < 0.05) from 2000 to 2016, and this trend showed obviously volatility (). In , the characteristics of fluctuations in NDVI, precipitation, and temperature are similar. The highest NDVI value during the 17-year study period (average NDVI = 0.755) was recorded in 2002. During 2003–2016, three NDVI valleys were observed in 2004, 2007, and 2016, with values of 0.562, 0.539, and 0.481, respectively.
Figure 3. NDVI temporal trend from 2000 to 2016 (n = 17). The Y-axis is average value of NDVI during the growing season (July and August). The red dashed line represents the linear fitting trend of NDVI.
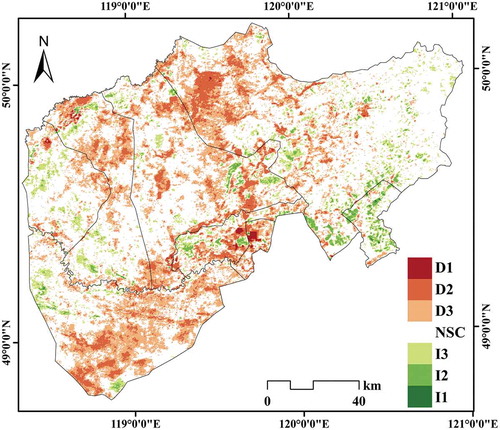
From , we can see that about 31.17% of pixels exhibiting downward NDVI trends with a maximum degradation rate of 4.65%·a−1, and 8.33% showing upward trends at a rate no greater than 2.09%·a−1. In the southern part of Chen Barag Banner (Bayankuren Town, Baorixile Town), NDVI decreasing trends were particularly strong. While the increasing trend was generally concentrated in the forested areas of eastern Chen Barag Banner (Evenk Ethnic Sumu and Tenihe Sumu) and the cropping regions of western Chen Barag Banner (Xiwuzhuer Sumu and Dongwuzhuer Sumu).
Figure 4. Spatial characteristics and significance of vegetation changes from 2000 to 2016. Significant classes for pixels exhibiting increasing NDVI are I1 (α > 0; p < 0.01), I2 (α > 0; 0.01 ≤ p < 0.025), and I3 (α > 0; 0.025 ≤ p < 0.05), while those for pixels with decreasing NDVI are D1 (α < 0; p < 0.01), D2 (α < 0; 0.01 ≤ p < 0.025), and D3 (α < 0; 0.025 ≤ p < 0.05). NSC indicates no significant change (p > 0.05).
Spatiotemporal response of vegetation to climate variability
The direction and significance of the pixel-wise correlation between NDVI and climate variables in Chen Barag Banner from 2000 to 2016 are shown in . Precipitation is positively correlated with NDVI, while the correlation between NDVI and temperature is weak negative. The positive correlation between precipitation and NDVI ()) is widespread throughout the study region, with 62.75% of pixels exhibiting a significant positive correlation. This was particularly apparent in the rangelands of western and northern Chen Barag Banner and cropping regions in Evenk Ethnic Sumu and Tenihe Sumu. ) illustrates the areas with negative correlation between average temperature and NDVI values across the study area, especially in dryland pasture regions. This indicates that the spatial response of NDVI to changes in precipitation and temperature quite differs in different regions.
Figure 5. Direction and significance of the spatial correlations between NDVI and (a) cumulative precipitation and (b) mean temperature during the growing season from 2000 to 2016. Pixels with significant negative NDVI trends are classified as N1 (p < 0.01), N2 (0.01 ≤ p < 0.025), and N3 (0.025 ≤ p < 0.05), while those exhibiting significant positive NDVI trends are classified into P1 (p < 0.01), P2 (0.01 ≤ p < 0.025), and P3 (0.025 ≤ p < 0.05). NSC indicates no significant correlation (p > 0.05). Areas 1 and 2 are the area of not significantly affected by precipitation and temperature. Areas 3 and 4 are the area of negatively correlated with precipitation but positively correlated with temperature.
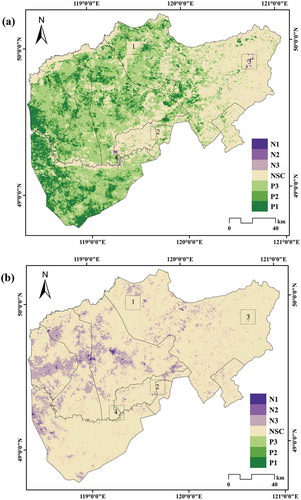
In regions 1 and 2 (), although correlations between NDVI and climate variables were weak and insignificant, the NDVI of the pixels in this region decreased significantly. This indicates that climatic factors alone cannot fully explain the temporal trend of vegetation change in our study area, especially in some areas where NDVI significantly decreased. This suggests that vegetation changes may be affected by multiple driving factors, including non-climatic factors such as human activities, soil type, and geomorphic features.
Some pixels in regions 3 and 4 () are negatively correlated with precipitation but positively correlated with temperature. Land use and land cover data of Chen Barag Banner ()) indicate that most of these pixels belong to waterbodies; thus ,they are not important for our study.
Contribution of human activities to vegetation changes
Residual analysis
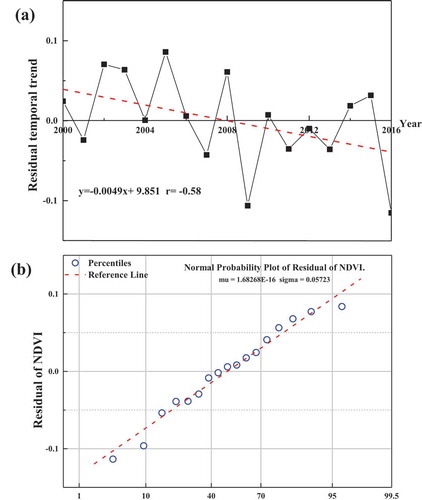
As shown in , the residual NDVI value exhibits a decreasing trend at 0.491%·a−1 (p < 0.05), with a correlation coefficient r > |0.5|. The result shows that the residual NDVI values followed a normal distribution. This suggests that other factors, besides climatic factors, were driving the vegetation changes for the entire study area. Furthermore, non-climate factors appeared to have negative effect on vegetation and their contribution to vegetation changes was continuously increasing.
Figure 6. Characteristics of temporal NDVI residual values: (a) temporal trend of the residual value from 2000 to 2016 and (b) the probability distribution of the residual values.
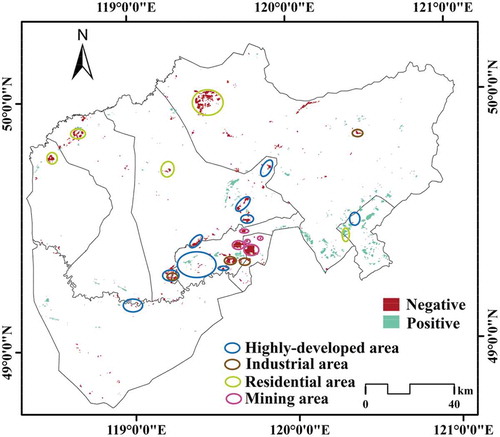
For pixel-wise analysis, shows the spatial distribution of NDVI residuals at a 95% confidence level. The regional differences in NDVI responses to human activities can be clearly observed. A Google Earth image of the study area was utilized to randomly select sample points in areas with frequent human activities to explain the residual results. The matching accuracy is 83.7%. Pixels showing a negative temporal trend in NDVI residuals belong to regions with the highest human activity level, as shown in . Depending on the diversified production mode, human-induced temporal vegetation changes can be bi-directional. On one hand, areas with negative residual changes accounted for 73.09% of the residual area. Human activities were the primary cause of vegetation degradation, especially in Bayankuren town and Baorixile town, where severe vegetation degradation has occurred at a rate of 3%·a−1 during the 17-year study period. Furthermore, large-scale open-pit coal mining has affected the ecological balance in this region, causing threats to the growth of vegetation (with a degradation rate of 4.65%·a−1). On the other hand, areas showing a positive residual trend accounted for 26.91%. Most of these areas were farmlands and primarily concentrated in Tenihe Sumu. shows that Tenihe Sumu is a typical farming area where a series of major ecological environment management projects have been successively launched (e.g. “three-north shelterbelt forest program” (1978), “grain for green program” (1998), “soil& water conservation project” (2000), “phase four of green great wall program”) (Jiang, Han, and Wu Citation2006; Qi et al. Citation2012; Zhang Citation2014).
Figure 7. Spatial distribution of NDVI residuals and their correlation with the main types of human activities. Highly developed area (blue circle) refers to a relatively prosperous area, such as urban residential area and tourist area; Residential area (yellow circle) mainly refers to herdsmen’s living area and grazing land; Mining area (purple circle) refers to the larger-scale open-pit mining area.
Relationship between vegetation changes and socioeconomic variables
We selected eight socioeconomic variables to represent major human activities that may affect vegetation changes during the 17-year study period. As shown in , all the socioeconomic variables exhibited an upward trend from 2000 to 2016. Increase in open-pit coal mining was the most obvious one at an annual growth rate of almost 8 million tons per year from 2008 to 2016 ()). We can see from ) that the peak eco-engineering construction periods in Chen Barag Banner were 2004 to 2006 and 2008 to 2011. Although almost all the socioeconomic variables exhibited an upward trend during the study period, investments toward ecological projects have decreased rapidly since 2011. In ), we can see that the number of livestock quickly increased rapidly from 2001 to 2006 and reached its peak in 2006, then stabilized at 0.675 million in 2016.
Figure 8. Temporal trends of socioeconomic variables from 2000 to 2016: (a) population density (the left-hand Y-axis) and urbanization rate (the right-hand Y-axis); (b) the economic development rate of secondary industry, includes industry (the right-hand Y-axis) and coal mining (the left-hand Y-axis shows the value of coal production, the right-hand Y-axis shows the value of mineral density); (c) the trend of the eco-engineering construction area; (d) the economic development trend of primary industry (the number of livestock). Equations for indexes’ are in Table 1.
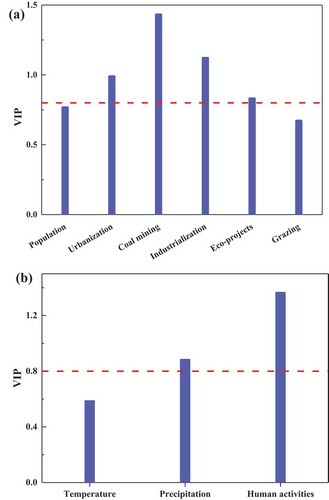
The correlations between the socioeconomic variables and NDVI values are shown in . NDVI increases as the areas of eco-engineering projects (“artificial planting” and “return farmland to grassland”) increases (p < 0.05). Its individual effect size is determined via the VIP value in the PLS model, the results as shown in ). In general, NDVI temporal profiles were negatively correlated with the socioeconomic variables. Open-pit mining and industrial development have a significant negative correlation with NDVI (p < 0.05; VIP = 1.431 and 1.120, respectively). There is also a significant negative correlation between urbanization and NDVI (p < 0.05, VIP = 0.988).
Figure 9. Scatter plots illustrating the relationships between NDVI and socioeconomic variables from 2000 to 2016 (n = 17). (a–h) Correlations between randomly selected temporal NDVI profiles and population density, urbanization, coal mining, industrialization, grazing, and ecological engineering.
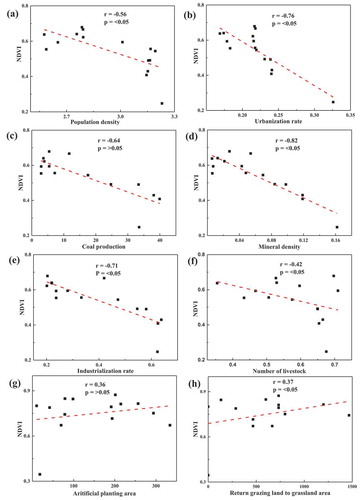
Figure 10. Contribution of driving factors on vegetation changes: (a) the weight of socioeconomic variables contribution on vegetation changes and (b) the weight of climatic variables and human activities contribution on vegetation changes. Here, the red dashed lines indicate that the VIP value is 0.8.
Complex response analyzes of combined human-climate factors
shows the partial correlation coefficients of NDVI (dependent variable) and the three independent variables (temperature, precipitation, and human activities) for the entire study area. The contributions of the different driving forces to temporal vegetation changes are illustrated in ). Human activities and precipitation contribute significantly to vegetation changes, with human activities being the highest weighted driving factor of vegetation change. The VIP values of human activities and precipitation are 1.37 and 0.87, respectively, which are higher than the level values (0.8). However, the VIP value of temperature was lower than its level value and the contribution of temperature to vegetation changes was not significant. The effect size (weight) and sequence relationship of each driving factor of vegetation changes during the study period were determined to be in the order human activities (r = -0.785, p < 0.01, VIP = 1.37), precipitation (r = 0.541, p < 0.05, VIP = 0.87), and temperature (r = -0.319, p > 0.05, VIP = 0.59).
Table 2. Correlation coefficient matrix of the driving factors and NDVI.
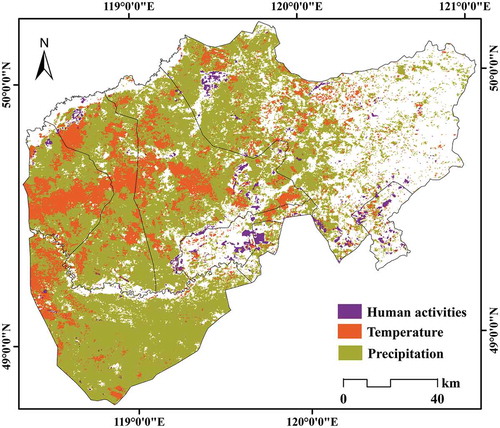
The spatial distribution of vegetation response to the different driving forces is shown in . The responses of NDVI to different driving factors are quite different. Human activities attributed to 10.57% of the total area. In near-river regions of the north and south Chen Barag Banner, human activities are frequent and have the highest contribution on vegetation changes.
Figure 11. Spatial distribution of the dominance driving factors for vegetation change. Locations shown in different color indicate different dominant driving factors of human activities, precipitation, and temperature. The blank area represents no significant correlation with the driving factors.
Discussion
Socioeconomic factors selection
The selection of socioeconomic factors was based on literature reviewed and local knowledge. Regional social and economic development is known to spatially affect vegetation distribution and patterns, especially during the process of vegetation removal through coal mining, urban expansion, and grazing. As distance increases, this effect was expected to decrease (Noa et al. Citation2019). On the other hand, the main purpose of ecological projects is to improve vegetation greenness and coverage, as well as species diversity in the local, and its effect increases with the expansion of vegetation area. A number of studies used socioeconomic factors in explaining the changes in the ecological environment. For example, Li et al. (Citation2020) selected rural population, urbanization rate, road density as socioeconomic factors to assess their impact on the ecological land in Central Plains, China. Ibanez et al. (Citation2020) explored the relationship between the commercial grassland and socioeconomic factors by performing a sensitivity analysis. Zegeye, Teketay, and Kelbessa (Citation2014) explored the socioeconomic factors affecting the vegetation resources of Lake Ziwei Island by using field observation data. They pointed out that the vegetation resources were dwindling due to free grazing, farmland expansion, soil erosion, and tree cutting for various purposes, all of which are driven by population growth. Based on these previous researches, we selected the most socioeconomic variables to represent primary human activities. The inclusion of ecological projects is a new contribution compared to previous studies because they have different (positive) impacts on vegetation changes.
Trends of vegetation changes from 2000 to 2016
In this research, to avoid confounding factors such as farming cycles, we used the max NDVI value of the growing season (July and August) to representing vegetation status. This is different from other studies where the actual phenological stages of vegetation cover were examined. For example, Hielkema, Prince, and Astle (Citation1986) correlated rainfall amounts with NDVI values, measured at fixed calendar days representing begin, peaking, and end of the green-period. For the period 2000 to 2016, our results revealed a decreasing NDVI trend in Chen Barge Banner. Such result is consistent with those from several previous published studies based on trend analyzes of remote sensing data (Mu et al. Citation2013). Pixel-wise NDVI trend analyzes showed spatial heterogeneity of vegetation changes during the 17-year study period. In the forested areas of eastern Chen Barag Banner (Evenk Ethnic Sumu and Tenihe Sumu) and the cropping regions of western Chen Barag Banner (Xiwuzhuer Sumu and Dongwuzhuer Sumu), we observed significant upward trends of NDVI values. However, the vegetation cover in the southern parts of the study area (Bayankuren town and Baorixile town) showed significantly decreasing trends.
Response of vegetation change to climatic variables
Chen Barag Banner is located in a farming-pastoral zone, where most of the area (except the eastern part) belongs to the typical desert grassland. In which, plant species are highly sensitive to climate change (Yang et al. Citation2014), especially changes in precipitation. The response of vegetation growth to precipitation in Chen Barag Banner is stronger than that of temperature, which is consistent with the results of other studies (Mu et al. Citation2013; Chuai et al. Citation2013). As expected, NDVI was found to be positively correlated with precipitation over a large part of the study area. As a result of soil desertification and high daily evaporation, temperature has a negative impact on vegetation changes, while precipitation has become the main restricting factor of vegetation growth in most areas. The results differ from those of Szabó et al. (Citation2019) where the authors showed that the vegetation index has a strong correlation with the maximum temperature in Hungary. We noted that for certain areas (areas 1, 2 as shown in ) there was no significant correlation between vegetation change and climatic factors. For those areas, human factors (e.g. mining, land use, and land cover changes) may have stronger influences.
Vegetation with significant increase trends can be attributed to ecological policies and practices during the study period (Jiang, Han, and Wu Citation2006). These results indicate that focusing solely on climate variables without considering the effects of human activities on vegetation may have misleading implications for grassland ecological management and sustainable development. Mu et al.’s (Citation2013) indicated that human activities have great impacts on vegetation dynamics, which weakens the dependence of plant growth on climate factors. It is emphasized that quantitative evaluation of human activities has far-reaching significance for the relative contribution of vegetation dynamics in Inner Mongolia. Song et al. (Citation2018) also pointed out that land-use change is a complex process with combined inputs from human activity and climate. Thus, although some studies have attempted to understand the drivers of grassland vegetation changes, and establishes correlations with physical variables such as climatic factors (temperature, precipitation, evaporation, and sunshine hours), it would be difficult to draw generalized conclusion without considering human activities (grazing, surface coal mining, urbanization, and eco-engineering). As Wang et al.’s (Citation2016) mentioned in the driving force analysis of grassland degradation in Qinghai China: climate and human activities, as the potential driving forces for grassland vegetation variations, should be thoroughly examined using a long-term monitoring and the main causes need to be determined for vegetation dynamics.
Driving forces of human activities
Negative trends linked to human activities
In residual analysis, we found that the negative trends were mainly related to the human activities', such as direct removing/occupying surface vegetation and soil, in general. Since 2001, with the large-scale open-pit mining, urban expansion, and industrial development, substantial surface vegetation coverages have removed directly, resulting in a serious degradation in some local vegetation cover. Especially in Baorixile open-pit coal mine area (built and put into operation in 2000 with a planned coal field area of 171.56 km2 (ShenHua Baorixile energy company open-pit coal mine Citation2011)), the vegetation degradation rate reached 4.65%·a−1. These results are consistent with recent vegetation trends reported by Song et al. (Citation2018), who considered the reduced vegetation cover in many arid and semi-arid ecosystems across the world caused by human activities. However, this is different from Wang et al.’s (Citation2016) report, whose results show that the climate factor was the dominant driving force of grassland degradation in Qinghai. Therefore, the driving forces of grassland degradation are regional dependent and sensitive to temporal scales.
We also found that population density (e.g. urban population density) and grazing showed negative impacts on NDVI, which is similar to the results from Noa et al. (Citation2019), who pointed out that vegetation-cover in dryland region of Israel has a negative correlation with population density and livestock. However, population density and livestock variables were not significant in Chen Barag Banner, which is different from Li, Wu, and Huang’s (Citation2012) results on vegetation degradation in Xilingol steppe, Inner Mongolia.
In 2017 and 2018, we went to Chen Barag Banner and Xilinhot (the location of Xilingol League government) for field investigation. We conducted a questionnaire survey on grassland change through questionnaire survey and field sampling. The feedback from most local residents indicates that grazing indeed affects the growth of grassland vegetation, but it is not the only one of the main driving factors for grassland degradation in this study region. As Wang et al. (Citation2017) pointed out, grassland degradation caused by so-called “overgrazing” is significantly lower than the negative effects of climate change. Therefore, the results of the field investigation are consistent with our research results of using remote sensing images to establish mathematical models, which also verifies the feasibility of our research methods.
Positive trends linked to human activities
Enhancing ecological protection of grasslands through ecological construction and sustainable development practices, and continuous promotion of ecological projects in grasslands are important. As Wang's et al. (Citation2016) research indicated that human activities were the dominant factor of grassland ecological restoration in Qinghai. We confirmed the effectiveness of the implementation of ecological projects in Chen Barag Banner ( and ). Our results validate the previous research proposed by Xu et al. (Citation2018) who pointed out vegetation reclamation projects (e.g. “three-north shelterbelt forest program”) have significantly increased vegetation coverage in this area. In addition, our results confirmed that precipitation and ecological engineering reported by Hao et al. (Citation2014) and Zhou et al. (Citation2017) mainly cause the result of the increase of grassland vegetation.
The areas where human activities are positively influencing on vegetation covers are mainly located in the southeast of Chen Barag Banner. Over the past decade, Inner Mongolia responded positively to the ecological protection policy implemented, the project development reached its peak in 2002 and 2009, respectively. Example projects include “promote ecological construction and environmental protection” (Yin and Yin Citation2010), the “three-north shelterbelt forest program” (Xu et al. Citation2018), and “returning farmland to grassland/forest” (Hao et al. Citation2014). Among these projects, Hulunbuir’s natural shelter forest construction area is the largest. In 2006, Hulunbuir began to implement the project of “returning farmland to grassland (/forest)” (Li et al. Citation2013; Hao et al. Citation2014), and the vegetation coverage in this region has increased by 15% to 20% during 1998 to 2015. However, in our study area, only 26.9% of the area has been improved, which is much lower than the area of vegetation degradation. Overall, in recent years, the total area of ecological engineering construction in the study area has been decreasing, which should capture the attention of policymakers.
Limitation and novelty
The use of a limited number of datasets in our study poses a few limitations. First, we only got and used mean monthly datasets from six meteorological stations. Increasing the number of data points and observation points will potentially yield results that are more accurate. Second, we used medium-resolution satellite images to determine overall driving forces of vegetation changes in Chen Barag Banner. However, remote sensing images of high spatial and temporal resolutions will be required for a comprehensive understanding of multi-impact and smaller-scale areas (e.g. Baorixile town) and the driving mechanism for environmental changes. Third, we have not studied the effects of groundwater and soil moisture on grassland vegetation. The driving mechanism of grassland degradation in Inner Mongolia is complex, and therefore the impact of groundwater on environmental degradation should not be underestimated (Yang et al. Citation2015). Last but not least, snow melting is one of the important water sources in this region and also one of the important factors affecting the grassland. However, snow cover data are not readily available. In Inner Mongolia, winter is cold and long. The temperature can reach -26°C in winter, which makes the fieldwork more difficult. In future research, this aspect may be explored.
Despite the above-mentioned limitations, our research provided a modeling framework that integrates various human and climate variables. Owing to global climate change and intensification of human activities, grassland vegetation degradation has become inevitable. Our findings offer insights into the vegetation dynamics and spatial heterogeneity of driving mechanism in ecologically fragile areas of eastern grassland in China. We highlight the importance of the long-term ecological projects in grasslands of eastern China (Yin et al. Citation2018). Furthermore, our results can potentially support environmental regulatory decision-making and sustainable development at a regional-national scale (Bryan et al. Citation2018; Moghadam et al. Citation2020). Several new findings from this study are summarized as follows:
The integration of geospatial/socioeconomic data and thoroughness of statistical modeling can improve our understanding of interactions among the underlying driving forces of the vegetation changes.
Though the spatial extent of large-scale open-pit mining is relatively small compared to other types of human activities (e.g. urban expansion, industrial construction, grazing, etc.), the magnitude of their impact on vegetation dynamics is much stronger.
Our results suggested that grazing became a less important driving factor for grassland degradation, which can be attributed to the evaluation and adjustment of grazing policy. The ecological engineering project showed positive effect on grassland vegetation.
Conclusion
This study examined vegetation change trends and their driving factors in Chen Barag Banner, Inner Mongolia. A combination of long time-series MODIS-NDVI, meteorological, and socioeconomic data were used in MLR and PLS models. The spatiotemporal characteristics of human-induced and climate-triggered vegetation changes were determined, and the contribution of each driving factor was quantified. We found that long-term temporal vegetation trends in Chen Barag Banner were attributable to both climate variables and human activities, and the response of vegetation change to different driving forces exhibited a significant spatial heterogeneity.
During our 17-year study period, NDVI was significantly positively correlated with precipitation (r = 0.541, p < 0.05). However, temporal NDVI profiles exhibited a weak negative correlation with temperature (r = -0.319, p > 0.05). The impacts of human activities on the grassland vegetation were primarily negative, gradually increasing, with obvious regional characteristics. For factors with negative impacts, their corresponding spatial extents from the smallest to largest are industrial development, coal mining, urban expansion, and grazing. Coal mining, industrial development, and urban expansion were observed to have local, long-term, and direct destructive effects on vegetation (r>|-0.7|, p < 0.05). However, the implementation of ecological projects had a positive impact on grassland vegetation (r = 0.37, p < 0.05). Therefore, we suggest that ecological protection policies should be formulated according to the spatial differences of driving forces, divided into regional ecological protection dominated by climatic factors, ecological restoration, and prevention of human actives affected areas, so as to achieve environmental regulation and sustainable development in Chen Barag Banner.
Supplemental Material
Download MS Word (16 KB)Disclosure statement
No potential conflict of interest was reported by the authors.
Supplementary material
Supplemental data for this article can be accessed here.
Additional information
Funding
References
- Abdi, H. 2010. “Partial Least Squares Regression and Projection on Latent Structure Regression (PLS Regression).” Wiley Interdisciplinary Reviews. Computational Statistics. 2(1):97–106.
- Angerer, J., G. Han, I. Fujisaki, and K. Havstad. 2008. “Climate Change and Ecosystems of Asia with Emphasis on Inner Mongolia and Mongolia.” Rangelands. 30(3):46–51.
- Beck, P. S., C. Atzberger, K. A. Hogda, B. Johansen, and A. K. Skidmore. 2006. “Improved Monitoring of Vegetation Dynamics at Very High Latitudes: A New Method Using MODIS NDVI.” Remote Sensing of Environment. 100(3):321–334.
- Bivand, R. S., E. Pebesma, and V. G. Rubio. 2013. Applied Spatial Data Analysis with R, 414. Springer New York. doi: 10.1007/978-1-4614-7618-4.
- Bryan, B. A., L. Gao, Y. Ye, X. Sun, J. D. Connor, N. D. Crossman, M. Stafford-Smith, et al. 2018. “China’s Response to a National Land-system Sustainability Emergency.” Nature. 559(7713):193–204. doi:10.1038/s41586-018-0280-2
- Burrell, A. L., J. P. Evans, and Y. Liu. 2017. “Detecting Dryland Degradation Using Time Series Segmentation and Residual Trend Analysis (TSS-RESTREND).” Remote Sensing of Environment. 197:43–57. doi:10.1016/j.rse.2017.05.018
- Chuai, X., X. J. Huang, W. J. Wang, and G. Bao. 2013. “NDVI, Temperature and Precipitation Changes and Their Relationships with Different Vegetation Types during 1998–2007 in Inner Mongolia, China.” International Journal of Climatology. 33(7):1696–1706.
- Evans, J., and R. Geerken. 2004. “Discrimination between Climate and Human-induced Dryland Degradation.” Journal of Arid Environments. 57(4):535–554.
- Farres, M., S. Platikanov, S. Tsakovski, and R. Tauler. 2015. “Comparison of the Variable Importance in Projection (VIP) and of the Selectivity Ratio (SR) Methods for Variable Selection and Interpretation.” Journal of Chemometrics. 29(10):528–536.
- Gao, H. 2002. “Statistical Analyses for Multiple Correlation Variables of Two Sets (3) (Partial Least-squares Regression and PLS Procedure).” Application of Statistics and Management. 21(2):58–64.
- Gao, Y., M. Giese, S. Lin, B. Sattelmacher, Y. Zhao, and H. Brueck. 2008. “Belowground Net Primary Productivity and Biomass Allocation of a Grassland in Inner Mongolia Is Affected by Grazing Intensity.” Plant and Soil. 307(1–2):41–50.
- Geerken, R., and M. Ilaiwi. 2004. “Assessment of Rangeland Degradation and Development of a Strategy for Rehabilitation.” Remote Sensing of Environment. 90(4):490–504.
- Geladi, P., and B. R. Kowalski. 1986. “Partial Least-squares Regression: A Tutorial.” Analytica Chimica Acta. 185:1–17. doi:10.1016/0003-2670(86)80028-9
- Hao, L., G. Sun, Y. Liu, Z. Gao, J. He, T. Shi, and B. Wu. 2014. “Effects of Precipitation on Grassland Ecosystem Restoration under Grazing Exclusion in Inner Mongolia, China.” Landscape Ecology. 29(10):1657–1673. doi:10.1007/s10980-014-0092-1
- Helton, J. C., J. D. Johnson, C. J. Sallaberry, and C. B. Storlie. 2006. “Survey of Sampling-based Methods for Uncertainty and Sensitivity Analysis.” Reliability Engineering & System Safety. 91(10–11):1175–1209.
- Herrmann, S. M., A. Anyamba, and C. J. Tucker. 2005. “Recent Trends in Vegetation Dynamics in the African Sahel and Their Relationship to Climate.” Global Environmental Change-human and Policy Dimensions. 15(4):394–404.
- Hielkema, J. U., S. D. Prince, and W. L. Astle. 1986. “Rainfall and Vegetation Monitoring in the Savanna Zone of the Democratic-republic of Sudan Using the NOAA Advanced Very High-resolution Radiometer.” International Journal of Remote Sensing. 7(11):1499–1513.
- Holben, B. N. 1986. “Characteristics of Maximum-value Composite Images from Temporal AVHRR Data.” International Journal of Remote Sensing. 7(11):1417–1434.
- Huete, A. R., K. Didan, T. Miura, E. P. Rodriguez, X. Gao, and L. G. Ferreira. 2002. “Overview of the Radiometric and Biophysical Performance of the MODIS Vegetation Indices.” Remote Sensing of Environment. 83(1–2):195–213.
- Ibanez, J. Q., J. Martinezvalderrama, J. F. Contador, and M. P. Fernandez. 2020. “Exploring the Economic, Social and Environmental Prospects for Commercial Natural Annual Grasslands by Performing a Sensitivity Analysis on a Multidisciplinary Integrated Model.” Science of the Total Environment. 705:135860. doi:10.1016/j.scitotenv.2019.135860
- Jiang, G., X. Han, and J. Wu. 2006. “Restoration and Management of the Inner Mongolia Grassland Require a Sustainable Strategy.” AMBIO: A Journal of the Human Environment. 35(5):269–270.
- Kang, L., X. Han, Z. Zhang, and O. Sun. 2007. “Grassland Ecosystems in China: Review of Current Knowledge and Research Advancement.” Philosophical Transactions of the Royal Society B-Biological Sciences. 362(1482):997–1008.
- Li, A., J. Wu, and J. Huang. 2012. “Distinguishing between Human-induced and Climate-driven Vegetation Changes: A Critical Application of RESTREND in Inner Mongolia.” Landscape Ecology. 27(7):969–982.
- Li, G., C. Jiang, J. Du, Y. Jia, and J. Bai. 2020. “Spatial Differentiation Characteristics of Internal Ecological Land Structure in Rural Settlements and Its Response to Natural and Socio-economic Conditions in the Central Plains, China.” Science of the Total Environment. 709. doi:10.1016/j.scitotenv.2019.135932
- Li, S., F. Yu, M. J. Werger, M. Dong, S. Ramula, and P. A. Zuidema. 2013. “Understanding the Effects of a New Grazing Policy: The Impact of Seasonal Grazing on Shrub Demography in the Inner Mongolian Steppe.” Journal of Applied Ecology. 50(6):1377–1386.
- Li, X., R. Li, G. Li, H. Wang, Z. Li, X. Li, and X. Hou. 2016. “Human-induced Vegetation Degradation and Response of Soil Nitrogen Storage in Typical Steppes in Inner Mongolia, China.” Journal of Arid Environments. 124:80–90. doi:10.1016/j.jaridenv.2015.07.013
- Moghadam, S. H., Q. Weng, H. Liu, and R. Valavi. 2020. “Modeling the Spatial Variation of Urban Land Surface Temperature in Relation to Environmental and Anthropogenic Factors: A Case Study of Tehran, Iran.” GIScience & Remote Sensing. doi:10.1080/15481603.2020.1736857
- Mu, S., Y. Chen, J. Li, W. Ju, I. O. Odeh, and X. Zou. 2013. “Grassland Dynamics in Response to Climate Change and Human Activities in Inner Mongolia, China between 1985 and 2009.” Rangeland Journal. 35(3):315–329.
- Nemani, R. R., C. D. Keeling, H. Hashimoto, W. M. Jolly, S. C. Piper, C. J. Tucker, R. B. Myneni, and S. W. Running. 2003. “Climate-driven Increases in Global Terrestrial Net Primary Production from 1982 to 1999.” Science. 300(5625):1560–1563. doi:10.1126/science.1082750
- Noa, O., P. Tarin, P. Natalya, P. Aviva, T. Asaf, and K. Arnon. 2019. “Time Series Analysis of Vegetation-cover Response to Environmental Factors and Residential Development in a Dryland Region.” GIScience & Remote Sensing. 56(3):362–387.
- Parmesan, C., and G. Yohe. 2003. “A Globally Coherent Fingerprint of Climate Change Impacts across Natural Systems.” Nature. 421(6918):37–42.
- Pastorguzman, J., J. Dash, and P. M. Atkinson. 2018. “Remote Sensing of Mangrove Forest Phenology and Its Environmental Drivers.” Remote Sensing of Environment. 205:71–84. doi:10.1016/j.rse.2017.11.009
- Pettorelli, N., J. O. Vik, A. Mysterud, J. Gaillard, C. J. Tucker, and N. C. Stenseth. 2005. “Using the Satellite-derived NDVI to Assess Ecological Responses to Environmental Change.” Trends in Ecology & Evolution. 20(9):503–510.
- Phiri, M., A. Y. Shiferaw, and G. S. Tesfamichael. 2020. “Biome-level Relationships between Vegetation Indices and Climate Variables Using Time-series Analysis of Remotely-sensed Data.” GIScience & Remote Sensing. 57(4):464–482.
- Prasad, V. K., K. V. Badarinath, and A. Eaturu. 2008. “Effects of Precipitation, Temperature and Topographic Parameters on Evergreen Vegetation Greenery in the Western Ghats, India.” International Journal of Climatology. 28(13):1807–1819.
- Qi, J., J. Chen, S. Wan, and L. Ai. 2012. “Understanding the Coupled Natural and Human Systems in Dryland East Asia.” Environmental Research Letters. 7(1):1.
- Qian, T., H. Bagan, T. Kinoshita, and Y. Yamagata. 2014. “Spatial–temporal Analyses of Surface Coal Mining Dominated Land Degradation in Holingol, Inner Mongolia.” IEEE Journal of Selected Topics in Applied Earth Observations and Remote Sensing. 7(5):1675–1687.
- Rouse, J. W., R. H. Haas, J. A. Schell, and D. W. Deering. 1974. “Monitoring Vegetation Systems in the Great Plains with ERTS.” NASA Goddard Space Flight Center 3d ERTS-1 Symposium, 309–317. Washington, DC.
- Shao, Y., G. N. Taff, and R. S. Lunetta. 2011. “Review of Selected Moderate-Resolution Imaging Spectroradiometer Algorithms, Data Products, and Applications.” Advances in Remote Sensing. 31–55.
- Shao, Y., R. S. Lunetta, B. Wheeler, J. S. Iiames, and J. B. Campbell. 2016. “An Evaluation of Time-series Smoothing Algorithms for Land-cover Classifications Using MODIS-NDVI Multi-temporal Data.” Remote Sensing of Environment. 174:258–265. doi:10.1016/j.rse.2015.12.023
- ShenHua Baorixile energy company open-pit coal mine. 2011. “Annual Report on Safe and Efficient Mine Construction in China’s Coal Industry.” China Coal Industry Association. 316–317. https://kns.cnki.net/kns/brief/default_result.aspx
- Song, X. P., M. C. Hansen, S. V. Stehman, P. V. Potapov, A. Tyukavina, E. F. Vermote, and J. R. Townshend. 2018. “Global Land Change from 1982 to 2016.” Nature. 560(7720):639–643.
- Szabó, S., L. Elemér, Z. Kovács, Z. Püspöki, A. Kertész, K. S. Singh, and B. Balázs. 2019. “NDVI Dynamics as Reflected in Climatic Variables: Spatial and Temporal Trends – A Case Study of Hungary.” GIScience & Remote Sensing. 56(4):624–644.
- Wan, H., Y. Shao, J. B. Campbell, and X. Deng. 2019. “Mapping Annual Urban Change Using Time Series Landsat and NLCD.” Photogrammetric Engineering and Remote Sensing. 85(10):715–724. doi:10.14358/PERS.85.10.715
- Wang, Z., X. Deng, W. Song, Z. Li, and J. Chen. 2017. “What Is the Main Cause of Grassland Degradation? A Case Study of Grassland Ecosystem Service in the Middle-south Inner Mongolia.” Catena. 150:100–107. doi:10.1016/j.catena.2016.11.014
- Wang, Z., Y. Zhang, Y. Yang, W. Zhou, C. Gang, Y. Zhang, L. Li, et al. 2016. “Quantitative Assess the Driving Forces on the Grassland Degradation in the Qinghai–Tibet Plateau, in China.” Ecological Informatics. 33:32–44. doi:10.1016/j.ecoinf.2016.03.006
- Watkinson, A. R., and S. J. Ormerod. 2001. “Grasslands, Grazing and Biodiversity: Editors’ Introduction.” Journal of Applied Ecology. 38(2):233–237.
- Wilson, N. R., and L. M. Norman. 2018. “Analysis of Vegetation Recovery Surrounding a Restored Wetland Using the Normalized Difference Infrared Index (NDII) and Normalized Difference Vegetation Index (NDVI).” International Journal of Remote Sensing. 39(10):3243–3274.
- Wu, J., Q. Zhang, A. Li, and C. Liang. 2015. “Historical Landscape Dynamics of Inner Mongolia: Patterns, Drivers, and Impacts.” Landscape Ecology. 30(9):1579–1598.
- Xu, G., J. Zhang, P. Li, Z. Li, K. Lu, X. Wang, F. Wang, Y. Cheng, and B. Wang. 2018. “Vegetation Restoration Projects and Their Influence on Runoff and Sediment in China.” Ecological Indicators. 95:233–241. doi:10.1016/j.ecolind.2018.07.047
- Yang, T., P. Li, X. Wu, X. Hou, P. Liu, and G. Yao. 2014. “Assessment of Vulnerability to Climate Change in the Inner Mongolia Steppe at a County Scale from 1980 to 2009.” Rangeland Journal. 36(6):545–555.
- Yang, X., L. A. Scuderi, X. Wang, L. J. Scuderi, D. Zhang, H. Li, S. Forman, et al. 2015. “Groundwater Sapping as the Cause of Irreversible Desertification of Hunshandake Sandy Lands, Inner Mongolia, Northern China.” Proceedings of the National Academy of Sciences of the United States of America. 112(3):702–706. doi:10.1073/pnas.1418090112
- Yin, H., D. Pflugmacher, A. Li, Z. Li, and P. Hostert. 2018. “Land Use and Land Cover Change in Inner Mongolia-understanding the Effects of China’s Re-vegetation Programs.” Remote Sensing of Environment. 204:918–930. doi:10.1016/j.rse.2017.08.030
- Yin, R., and G. Yin. 2010. “China’s Primary Programs of Terrestrial Ecosystem Restoration: Initiation, Implementation, and Challenges.” Environmental Management. 45(3):429–441.
- Zegeye, H., D. Teketay, and E. Kelbessa. 2014. “Socio-Economic Factors Affecting Conservation and Sustainable Utilization of the Vegetation Resources on the Islands of Lake Ziway, South-Central Ethiopia.” Natural Resources. 05(14):864–875.
- Zhang, H., J. Fan, W. Cao, W. Harris, Y. Li, W. Chi, and S. Wang. 2018. “Response of Wind Erosion Dynamics to Climate Change and Human Activity in Inner Mongolia, China during 1990 to 2015.” Science of the Total Environment. 639:1038–1050. doi:10.1016/j.scitotenv.2018.05.082
- Zhang, Y. 2014. “Achievements, Problems and Policy Recommendations of National Key Ecological Projects—a Case Study on Inner Mongolia Autonomous Region.” Research of Agricultural Modernization. 35(2):178–182.
- Zhou, W., H. Yang, L. Huang, C. Chen, X. Lin, Z. Hu, and J. Li. 2017. “Grassland Degradation Remote Sensing Monitoring and Driving Factors Quantitative Assessment in China from 1982 to 2010.” Ecological Indicators. 83:303–313. doi:10.1016/j.ecolind.2017.08.019