
 ?Mathematical formulae have been encoded as MathML and are displayed in this HTML version using MathJax in order to improve their display. Uncheck the box to turn MathJax off. This feature requires Javascript. Click on a formula to zoom.
ABSTRACT
Quantifying total carbon (TC) stocks in soil across various mangrove ecosystems is key to understanding the global carbon cycle to reduce greenhouse gas emissions. Estimating mangrove TC at a large scale remains challenging due to the difficulty and high cost of soil carbon measurements when the number of samples is high. In the present study, we investigated the capability of Sentinel-2 multispectral data together with a state-of-the-art machine learning (ML) technique, which is a combination of CatBoost regression (CBR) and a genetic algorithm (GA) for feature selection and optimization (the CBR-GA model) to estimate the mangrove soil C stocks across the mangrove ecosystems in North Vietnam. We used the field survey data collected from 177 soil cores. We compared the performance of the proposed model with those of the four ML algorithms, i.e., the extreme gradient boosting regression (XGBR), the light gradient boosting machine regression (LGBMR), the support vector regression (SVR), and the random forest regression (RFR) models. Our proposed model estimated the TC level in the soil as 35.06–166.83 Mg ha−1 (average = 92.27 Mg ha−1) with satisfactory accuracy (R2 = 0.665, RMSE = 18.41 Mg ha−1) and yielded the best prediction performance among all the ML techniques. We conclude that the Sentinel-2 data combined with the CBR-GA model can improve estimates of the mangrove TC at 10 m spatial resolution in tropical areas. The effectiveness of the proposed approach should be further evaluated for different mangrove soils of the other mangrove ecosystems in tropical and semi-tropical regions.
1. Introduction
Mangrove forests in the intertidal zones of the tropical and semi-tropical areas are highly productive ecosystems; they provide a wide range of functions and vital services to coastal populations such as reducing the effects of tsunamis (Danielsen et al. Citation2005) and mitigating the damage of tropical cyclones (Mazda et al. Citation1997). These forests can store a significant amount of carbon in soil sediments (Donato et al. Citation2011) and thus are considered a key component of “Blue Carbon,” which plays an important role in mitigating the impacts of global warming and climate change (Boone et al. Citation2013; Alongi Citation2012). Understanding mangrove soil carbon stocks plays important role in sustainably conserving mangroves and protecting these forests from deforestation and forest degradation as mangroves have been destroyed in the past five decades as a result of human activities, rapid urbanization, weak governance, and aquaculture overexpansion (Duke et al. Citation2007; Giri and Muhlhausen Citation2008; Sasmito et al. Citation2019; Friess et al. Citation2019). In Southeast Asia, over 100,000 ha of mangrove forests have been lost between 2000 and 2012 (Richards and Friess Citation2016; Hamilton and Friess Citation2018). The mangrove forest area in Vietnam in the early 20th century has decreased drastically by 400,000 ha (Le Xuan et al. Citation2003), and in North Vietnam, from 1964 to 1997, it decreased by 17,094 ha because of the conversion to aquaculture (Pham and Yoshino Citation2016).
Traditionally, the soil total carbon (TC) content of mangroves is estimated through soil sample collection and laboratory analysis. The straightforward measurements can be accurate; however, they cannot be used for large-scale and rapid monitoring of TC during mangrove conversion processes or mangrove changes because they are costly and time-consuming, particularly in mixed and dense mangrove forests. As a result, the spatial distribution and reliable statistical data of mangrove TC stocks have rarely been reported in the current literature. Many studies have performed soil carbon estimation using the optical proximal emersion and remote sensing techniques (Gholizadeh and Kopačková Citation2019). The optical proximal emersion techniques consider the applications of different sensors to obtain signals from the soil using the sensor’s receiver in contact with the soil (Gholizadeh et al. Citation2018; Gholizadeh and Kopačková Citation2019) and use spectral-based measurements such as earth observation (EO) data. These approaches provide cost-effective methods for monitoring dynamic changes in mangrove ecosystems. The remote sensing techniques use electromagnetic radiation to obtain information regarding an object such as soil type without any physical contact (Jin et al. Citation2017). In other studies, many spectral bands were employed for soil carbon estimation using visible-near infrared (VI-NIR) and short-wave infrared (SWIR) imaging systems mounted on space-borne, airborne sensors, and unmanned aerial systems (UAS) (Pinheiro et al. Citation2017; Liu, Min, and Buchroithner Citation2017; Gholizadeh et al. Citation2018; Angelopoulou et al. Citation2019). Nonetheless, these methods produce relatively low performance and cannot be used for estimating TC on a large scale, resulting in the lack of spatial distribution of TC in mangrove forests. Thus, accurate, cost-effective, rapid, and nondestructive prediction models that use EO data to estimate the mangrove TC across different ecosystems in the tropics are needed for sustainable conservation programs. Such models will support efforts to mitigate the impacts of climate change and develop strategies for pilot Blue Carbon projects and the Reducing Emissions from Deforestation and Forest Degradation (REDD+) programs (Pendleton et al. Citation2012; Ahmed and Glaser Citation2016).
Multispectral EO data have been widely employed in monitoring soil carbon because of the advantages over proximal and airborne hyperspectral remotely sensed data, such as the availability of frequent revisit times and capturing large-scale areas (Gholizadeh et al. Citation2018; Bhunia, Shit, and Pourghasemi Citation2019; Odebiri et al. Citation2020). Recently, various machine learning (ML) techniques for mapping and monitoring soil carbon stocks in mountainous landscapes and agricultural land using optical space-borne sensors such as Landsat 8 OLI (Were et al. Citation2015; Odebiri et al. Citation2020), Landsat 7 ETM+ (Mirzaee et al. Citation2016), and Landsat 4–5 TM (Bhunia, Shit, and Pourghasemi Citation2019) have been developed. However, the use of multispectral data in the quantitative analysis of soil carbon remains challenging due to some limitations associated with the use of satellite sensors to capture soil carbon such as atmospheric, radiometric corrections, soil moisture, and forest cover (Angelopoulou et al. Citation2019), particularly in mangrove ecosystems. Thus, in this study, we developed a prediction model and a novel framework based on CatBoost regression (CBR) and genetic algorithms (GA), namely CBR-GA, to quantify the total soil carbon (TC) content in mangrove ecosystems across the northern coast of Vietnam using Sentinel-2 (S-2) data.
We selected the CBR model because it is an advanced gradient boosting decision trees (GBDT) algorithm recently proposed by Prokhorenkova et al. (Citation2018) that can handle many features and achieve promising results in numerous classification and regression tasks in a variety of machine learning techniques (Dorogush, Ershov, and Gulin Citation2018). The CBR model has recently been applied as an effective method for nonlinear supervised learning problems in different domains with noisy labels and complex dependencies (Prokhorenkova et al. Citation2018) such as athletes’ gender prediction (Walsh, Heazlewood, and Climstein Citation2019), evapotranspiration (ET) estimation (Huang et al. Citation2019), and mangrove aboveground biomass estimation (Pham et al. Citation2020b). Despite its strong predictive performance and robustness, the CBR model has never been used for retrieving mangrove TC stocks. We hypothesize that the CBR algorithm may be useful for estimating mangrove TC due to the unique characteristics of mangrove soil properties. Furthermore, the ability of existing GBDT algorithms for estimating mangrove TC stocks has not been quantitatively evaluated in the current literature. More importantly, a quantitative comparison of the GBDT algorithms and traditional well-known ML algorithms for the mangrove TC stock retrieval at different mangrove ecosystems has not yet been reported. Investigation of advanced GBDT techniques for mangrove TC retrievals using free-of-charge EO data is often required to achieve up-to-date mangrove TC stock maps in the tropics to assist in monitoring, reporting, and verification (MRV) schemes in climate change mitigation strategies. Thus, this study aims to fill these gaps in the literature by combining the CBR model with a genetic algorithm (GA) and comparing the performance of the CBR-GA model with other GBDT algorithms. Our results demonstrate the capability of the proposed method in estimating mangrove TC stocks and improving the mangrove soil carbon estimations toward achieving sustainable development goals (SDGs) in the tropics. To our knowledge, this is the first attempt to estimate the mangrove TC stocks at 10 m spatial resolution on a large scale using EO data from many soil samples in different mangrove ecosystems in North Vietnam. The results will provide a baseline and promote the effective implementation of monitoring, reporting, and verification (MRV) as part of the REDD+ and Payment for Ecosystem Services (PES) strategies. Consequently, the results will provide insights for developing regional and national Blue Carbon trading markets and guiding sustainable mangrove conservation in tropical and semi-tropical regions.
2. Materials and datasets
2.1. Study area
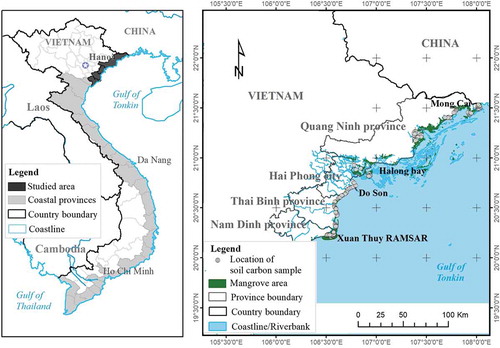
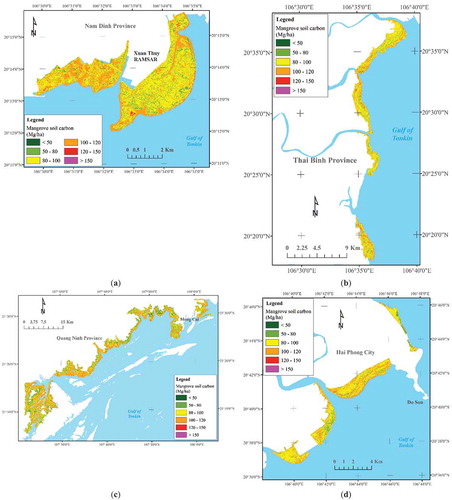
This study was conducted in mangrove ecosystems across four coastal provinces in North Vietnam, namely, Nam Dinh, Thai Binh, Hai Phong, and Quang Ninh (). The geographical coordinates are 19°30ʹ–21°30ʹ north latitude and 106°01ʹ–108°00ʹ south longitude. The study areas are located in the western coastal zone of the Gulf of Tonkin. Among four coastal regions, the Xuan Thuy National Park is located in Nam Dinh Province, which is the first wetlands site of international importance (RAMSAR) in Vietnam built in 1982 (Leslie et al. Citation2018). Mangrove forests of the former three coastal provinces belong to the Red River Delta biosphere reserve, which has suitable sediment conditions, mainly silty-clay soils accumulated from the Hong and Thai Binh rivers for mangrove ecosystem development. In Quang Ninh Province, soil sediments are shallow and mainly associated with parental limestones. The climate of the four study sites belongs to sub-tropical and semi-tropical monsoon with two seasons. The dry season is from November to April, and the rainy season is from May to October (Veettil et al. Citation2019). The average temperature is 23°C, annual rainfall is 1300–1400 mm, and humidity is about 80% (Li et al. Citation2006). The mangrove ecosystems in the present study are diverse and distributed between zones I and II among the four Vietnamese mangrove zones (Nguyen and San Citation1993), which are the second largest mangrove forests in the country.
Figure 1. Map of the study area across mangrove ecosystems in North Vietnam
The mangrove ecosystems comprise the mangrove forests and the adjacent intertidal area. There are about 10 mangrove species found in the coastal zones, the most dominant of which are Sonneratia caseolaris, Kandelia obovata, Bruguiera gymnorrhiza, Avicennia marina, Rhizophora stylosa, and Aegiceras corniculatum (Nguyen Citation2004).
2.2. Earth observation data acquisition and image processing
2.2.1 Earth observation data collection and image processing
Sentinel-2 (S-2) multispectral imaging (MSI) data were used for retrieving mangrove TC in four provinces ().
Table 1. Earth observation data acquisition used in this study
The Sentinel-2 Level-1 C imagery was acquired from the Copernicus Open Access Hub (https://scihub.copernicus.eu) of the European Space Agency (ESA) in November and December 2018 when the field survey was conducted during the dry season in North Vietnam. The S-2 images were geo-coded in UTM/WGS84, Zone 48 north projection at top of atmosphere (TOA) reflectance (Drusch et al. Citation2012). The S-2 Level-1 C data were processed to Level-2A data at the bottom of atmospheric (BOA) correction using the ESA’s Sen2Cor algorithm http://step.esa.int/main/third-party-plugins-2/sen2cor/. All the S-2 images that include multispectral bands were resampled to a ground sampling distance (GSD) of 10 m. The Python environment was employed for machine learning modeling while the SNAP Sentinel Application Platform toolbox and QGIS were used for processing the S-2 data. The modeling was performed using Scikit-learn in Python 3.7 environment.
2.2.2. Image transformation of Sentinel-2 imagery
Image transformation techniques for multispectral data have been commonly and frequently employed to map and predict forest soil carbon in previous studies (Gholizadeh et al. Citation2018; Yang et al. Citation2016; Were et al. Citation2015; Bhunia, Shit, and Pourghasemi Citation2019). The most common transformation techniques applied to optical data are the vegetation and soil radiometric indices because each index may have a strong correlation with different soil properties such as soil moisture, color, and texture (Gholizadeh et al. Citation2018). In the present study, we selected eight vegetation indices and three common soil radiometric indices presented in for a TC retrieval model because they are widely employed for retrieving forest biophysical parameters in tropical areas reported in previous studies (Manna et al. Citation2014; Wu et al. Citation2016; López-Serrano et al. Citation2016; Gholizadeh et al. Citation2018; Richardson et al. Citation2017). A total of 22 variables, including 11 multispectral bands from S-2 MSI, 8 vegetation indices, and 3 soil radiometric indices were computed as predictor variables for TC retrieval and used to construct the model and verify model performance.
Table 2. Vegetation and soil radiometric indices used in this study
Spectral surface reflectance values of multispectral bands and vegetation indices together with soil radiometric indices derived from the S-2 images were extracted for each soil sampling plot (). Since the sampling plot size was 100 m2, we resampled all the spectral bands of the S-2 data to a ground sampling distance (GSD) of 10 m.
In this study, we proposed a novel framework for mangrove TC retrieval using ML techniques and S-2 MSI data as shown in .
Figure 2. Methodological framework proposed for TC retrieval in mangrove ecosystems using machine learning techniques and S-2 MSI data
3. Methods
3.1 Soil sample collection and total soil carbon (TC) stocks analysis
Soil carbon was collected from the mangrove sediments during the dry season in November and December 2018. Four coastal provinces across various mangrove ecosystems in North Vietnam were included in the analysis because they represent estuarine, fringing, and island mangroves. Field surveys of total soil carbon (TC) were carried out, and a total of 177 soil cores were collected; each core consisted of 2–4 layers depending on the soil characteristics of each study site. At each site, soil cores were collected to a depth of 100 cm in an undisturbed area of the center of each sampling plot at the lowest tidal level in the mudflat using an Eijkelkamp gouge auger. We used the Garmin eTreX Global Positioning System (GPS) with an accuracy of ± 2 m to record the location of the sampling plot.
Soil core samples were sectioned into different layers from the surface (0–15 cm, 15–30 cm, 30–50 cm, and 50–100 cm) as proposed by Kauffman and Donato (Citation2012). Then, all samples were stored in polythene bags and preserved in a cooler box before being transferred to the laboratory for analysis. Soil samples were dried at 40°C for 72 h and then disintegrated and homogenized using an agate mortar and pestle before being passed through a 0.1 mm sieve. For TC measurements, the dried soil samples were correctly weighed using a ceramic boat and an analytical balance. Subsequently, each soil sample was covered with a ceramic fiber lid (Pham, Yoshino, and Bui Citation2017). Then, the samples were placed into the loading position and measured using the manual mode at 900°C.
The TC stock of the mangroves was quantified by multiplying the dry bulk density (BD) by the TC content (%) at a depth interval (Kauffman and Donato Citation2012). The BD was calculated using the ratio of the dry mass per volume of the wet sample (EquationEq. 1)(1)
(1) .
The TC stock per sampled depth interval was then obtained by using EquationEq. 2(2)
(2) .
The TC content was analyzed via the combustion method using a non-dispersive infrared (NDIR) sensor and a TC analyzer (Shimadzu TOC-VCPH connected the solid sample module SSM 5000A) to detect CO2 (Schumacher Citation2002). The replicated measurements of the standards at different concentrations were used to obtain a standard deviation of <10%. A total of 652 soil samples were analyzed for all mangrove ecosystems in North Vietnam. The certified reference materials (CRM) of marine sediments (MESS-3) were also examined to validate the accuracy of the methods used. All measurements of the samples based on the TC standard method were analyzed at least three times to achieve a standard deviation of within 10% ().
Table 3. Total carbon (TC) of the certified reference materials (CRM) of marine sediments (MESS-3) and TC from experimental measurements
3.2. Generation of training and test datasets
After finalizing the soil carbon analysis, we summarized the soil carbon data for different soil layers to obtain the total mangrove soil carbon stocks (TC) for each core soil (Kauffman and Donato Citation2012). A total of 177 soil cores were randomly split into training (80%) and testing (20%) datasets. The former dataset was used to model the relationship between the TC and the predictors derived from the S-2 data, vegetation indices (VIs), and soil radiometric indices (SIs), whereas the latter dataset was used to evaluate the predictive performance of the ML models developed. In the present study, we selected the gradient boosting decision trees (GBDT) technique, i.e., CatBoost regression (CBR), extreme boosting regression (XGBR), light gradient boosting regression (LGBR), and the well-known algorithms such as support vector regression (SVR) and random forest regression (RFR) for benchmark model comparison. All predictor variables were normalized using the normalization function in Scikit-learn library in Python 3.7 (Pedregosa et al. Citation2011).
3.3. Machine learning algorithms
3.3.1. Extreme gradient boosting (XGB)
The XGB is a supervised learning algorithm that can solve a range of data science problems as a fast and accurate technique (Chen and Guestrin Citation2016). The XGB algorithm is a relatively new technique that belongs to the family of gradient boosting machine learning models (Chen and Guestrin Citation2016). The algorithm can handle both classification and regression tasks for weak supervised learning through additive training strategies. The XGB technique aims at overcoming the over-fitting problem and optimizing the performance, and it has recently become a winner in many machine learning competitions (Nielsen Citation2016; Pham et al. Citation2020a).
In the XGB benchmark, the process of additive learning is divided into two phases. The first learning phase is fitted to the entire input data, whereas the second one is fitted to the residuals for solving the drawbacks of the weak supervised learning algorithms. The fitting process is repeated several times until the stopping criteria are achieved. The XGB algorithm requires many hyperparameters, which must be selected and tuned beforehand. In the present study, we calculated the optimal hyperparameters in Python 3.7 with the grid search and five-fold cross-validation (CV) function.
3.3.2. Light gradient boosting machine (LGBM)
The LGBM is an algorithm that belongs to the gradient boosting decision trees (GBDT) family, which was proposed by Microsoft MSRA (Ke et al. Citation2017). LGBM is an efficient GBDT technique, which has been used in solving different classification, regression, and sorting problems (Ma et al. Citation2018; Sun, Liu, and Sima Citation2018). There are two phases in the LGBM algorithm: gradient boosting and exclusive feature bundling. In the LGBM regression (LGBMR) model, trees grow vertically, whereas in other GBDT-based models such as XGBR, trees grow horizontally, which makes the LGBMR model is an effective, practical, and faster method with low computational cost in processing large-scale data, compared to XGBR (Ke et al. Citation2017).
In the LGBMR benchmark, the prediction performance can be significantly influenced by hyperparameters. Therefore, before applying LGBMR, we determined the range of variations in the hyperparameters to perform the computation using the grid search with five-fold CV in Python 3.7 environment.
3.3.3. CatBoosting regression (CBR)
CBR is a novel gradient boosting decision tree algorithm recently proposed by Yandex and can handle data with categorical features and minimize the over-fitting problem by selecting the best tree structure for calculating the leaf values (Dorogush, Ershov, and Gulin Citation2018). The CatBoost model is a powerful machine learning technique recently released as an open-source library. This algorithm achieves excellent empirical results in both classification and regression problems by implementing ordered boosting, which is a modification of standard GBRT algorithms (Prokhorenkova et al. Citation2018). In the CatBoost regression (CBR) model, random permutations of the training dataset and the gradients used for choosing an optimal tree structure are generated to enhance the robustness of the algorithm and prevent overfitting (Dorogush, Ershov, and Gulin Citation2018).
The learning efficiency of the CBR algorithm is controlled by its model hyperparameters including max depth, learning_rate, and the number of iterations. The selection of the optimal hyperparameters is challenging and time-consuming depending on the user’s experience. Thus, in the present study, we presented a GA to automate the search of the hyperparameters and a number of optimal features with five-fold CV to improve the model performance.
3.3.4. Random forest (RF)
The RF is a well-known ML algorithm developed by Breiman (Citation2001) and widely applied to classification and regression problems. This algorithm begins with a range of bootstrap samples (ntree) from the original dataset and then different predictors (mtry), which are randomly sampled, and operates in the training phase where each ntree creates a regression tree and the algorithm chooses the best split among many variables. The RF algorithm creates multiple uncorrelated trees for training, using a random subset of two-thirds of all the samples and leaves one-third of the samples (out-of-bag) for validation. The samples are randomly collected with replacement in numbers of collection. A tree is grown using in-bag samples with m variables to optimize the finest split for each node. Then, the tree can grow to the largest extent in the case of no pruning. The model produces (1) the out-of-bag error and (2) the variable importance to evaluate the accuracy of the prediction and indicate the contribution of each variable. The random forest regression (RFR) model is a well-known method for non-parametric and non-linear data and has been widely used in forest above-ground biomass (AGB) estimation (Pham, Lien and Lars Citation2017; Silveira et al. Citation2019) and in soil carbon retrievals (Richardson et al. Citation2017).
3.3.3. Support vector regression (SVR)
The support vector machine (SVM) was introduced by Vapnik (Citation2013) and adopts the statistical learning theory and the kernel-based approach. The SVM algorithm can handle non-linear data and solve classification and regression tasks. The key benefit of support vector regression (SVR) is that it can produce high prediction accuracy with a small number of training samples (Mountrakis, Jungho, and Ogole Citation2011). The SVR is used for TC prediction as follows:
where k (xi; x) is the kernel function, xi represents the training vector, α is the Lagrange multiplier, and b is the regression bias.
The quality of mangrove TC retrieval is evaluated using the ε-insensitive loss function developed by Vapnik (Citation2013). The performance of the SVR model is highly influenced by the selection of the kernel functions. To minimize the bias, the radial basis function (RBF) kernel was used in this work as the SVR, which is the most commonly used regression technique for the retrieval of forest biophysical parameters (Wu et al. Citation2016; Vafaei et al. Citation2018; Pham et al. Citation2018). In this study, optimal hyperparameters for implementing the SVR model were determined by the grid search with the five-fold CV method using Scikit-learn in Python.
3.4. Genetic algorithm (GA) for optimal feature selection
Optimal feature selection using the GA was implemented to automatically identify the optimal variables for mangrove soil carbon retrieval in the study area. The GA applies the idea from Darwin’s theory of evolution for natural selection by employing the computer capacity to automate the tuning of a number of parameters of an ML model (Davis Citation1991). The most important concept of the GA is the chromosome, which consists of ML model parameters to define a solution (called individual).
The basic operation performed during the training of the CBR-based model consists of the following steps: (1) a total number of 177 soil cores (individuals) are initialized to form a population, (2) individuals with the highest fitness values are selected to generate a mating pool, (3) from the mating pool, parents are selected using either sequential or random selection methods, and (4) several operators called crossover and mutation are then applied to each pair of parents to generate their offspring. This process keeps high-quality individuals to generate more individuals and evolves to obtain the desired solutions.
In this work, we first tested the ML models with all the features (predictor variables) with hyperparameter tuning using grid search with five-fold CV. Based on the highest predictive performance i.e. the lowest root-mean-square error (RMSE), we selected the best ML model for mangrove soil carbon retrieval. Then, we used the GA with the best predictive model to select the optimal features with a combination derived from the S-2, VIs, and SIs data for the mangrove soil carbon stock estimation. Finally, we tested all the selected ML models with optimal features for comparison.
3.5. Model performance evaluation
We employed root-mean-square-error (RMSE) and coefficient of determination (R2) for model assessment and comparison of different ML techniques in TC retrieval because these statistical indices are the most commonly utilized ones in any regression problem to evaluate the discrepancies between the measurements (the TC field-based measurements) and the predicted TC data (Were et al. Citation2015; Yang et al. Citation2016)
RMSE (EquationEq. 4)(4)
(4) and R2 (EquationEq. 5)
(5)
(5) values are considered as standard criteria for measuring errors or biases of ML regression tasks. Higher R2 and lower RMSE values often represent the better regression model (Jachowski et al. Citation2013; Pham, Yoshino, and Bui Citation2017).
where ŷi and yi are the estimated and measured mangrove soil carbon for the ith plot, respectively; n is the total number of sampling plots, and ӯ is the measured mean values of the mangrove soil carbon stocks.
In the current work, we employed the Akaike’s Information Criterion (AIC) and the Bayesian Information Criterion (BIC) to determine which regression model gives the most accurate TC estimates among different machine learning methods because they have been widely used for selecting and comparing different regression models (Claeskens and Hjort Citation2008; Pham, Yoshino, and Bui Citation2017). Both the AIC and the BIC provide effective methods for choosing the best regression models. The model shows lower AIC and BIC values indicated a better-fitting model (Burnham, Anderson, and Huyvaert Citation2011; Pham, Yoshino, and Bui Citation2017).
We calculated the AIC and the BIC values using (EquationEq. 6)(6)
(6) and (EquationEq. 7)
(7)
(7) . Models were ranked from the lowest to the highest AIC and BIC scores; the model with the lowest AIC and BIC values was considered the best.
where SSE is the sum of squares errors, n is the number of sampling plots, and K is the number of parameters; K = p + 1 where p is the number of predictors.
4. Results
4.1. Results of the field survey
4.1.1. Characteristics of total carbon stocks measured in soil of the study area
The characteristics of the TC stocks of 177 soil cores consisting of 2–4 layers in four coastal provinces (Nam Dinh, Thai Binh, Hai Phong, and Quang Ninh) are shown in and . The mean values of the TC stocks varied between 38.07 and 210.17 Mg ha−1, with the highest mean TC observed in Hai Phong (121.33 ± 43.16 Mg ha−1), followed by Thai Binh (92.14 ± 26.41 Mg ha−1), Nam Dinh (84.45 ± 24.12 Mg ha−1), and Quang Ninh (78.12 ± 33.28 Mg ha−1). The mean TC was the lowest in Quang Ninh but it was not much different from those in Nam Dinh and Thai Binh while the mean TC stock in Hai Phong was the highest. We observed richer soil in the lower 50 cm and in all the sedimentary cores of TC in mangrove ecosystems. The mean soil carbon stocks down to 100 cm in the study area range from 78.12 to 121.33 Mg C ha−1 ().
Figure 3. Downcore variations in mangrove sediment properties at 100 cm depth
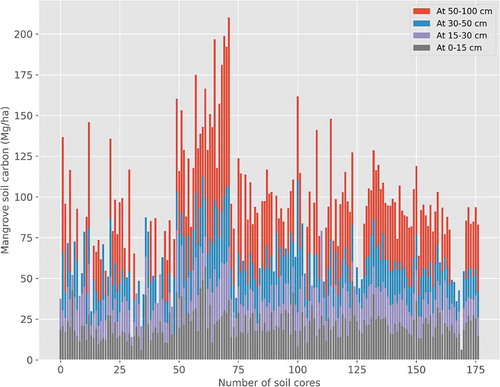
Table 4. Characteristics of mangrove TC stocks in the study site
4.1.2. Variations in total carbon stocks in soil
The variations in TC stocks in the mangrove soil strongly depend on depth (). The TC stocks of the soil in the depth of 0–15 cm changed slightly compared to those in the other depths. Total TC in the depth of 0–15 cm is relatively higher than in the other depths, except for 50–100 cm. It is noted that the depth of 50–100 cm is the most important layer, which consists of a large amount of the total carbon stocks in a soil core.
The TC stocks in Nam Dinh indicate a decreasing trend from 0–15 and 15–30 cm to the deeper layers. Nevertheless, TC content increases slightly from 15–30 cm to 50–100 cm. The trends in the TC content in Quang Ninh are similar to those in Nam Dinh although TC in 50–100 cm is much higher than in Nam Dinh. The TC stocks in Hai Phong are the most complicated. The TC content decreases significantly from the bottom of the core to 30–50 cm. Then, TC decreases slightly from 30–50 cm to 15–30 cm before it dramatically fluctuates up to the surface layer ().
(X-axis: the number of soil cores, Y-axis: mangrove soil carbon: additive carbon for four depths)
Correlation analysis of variables and measured TC
shows that among 11 multispectral bands, the vegetation red-edge band 5 (703.8–704.1 nm) showed the strongest correlation with mangrove soil carbon, followed by the red band (664 nm) and the green band (559 nm). In addition, two SWIR bands (1610–2202 nm) showed relatively strong correlations with soil carbon. Several new vegetation indices derived from the S-2 data i.e., IRECl and MCARI showed relatively strong correlations with mangrove soil carbon content. Strong negative correlations were observed between three soil radiometric indices (BI, RI, CI) and mangrove soil carbon stocks ().
Table 5. Pearson’s correlation analysis of multispectral bands, spectral indices, and measured TC in training phase
4.3. Modeling results, assessment, and comparison
We computed and tested four scenarios (SC) using the S-2 imagery, VIs, and SIs in the training and testing phases. The optimal number of features was achieved by using 16 variables in SC2 including 10 multispectral bands, 3 vegetation indices (SAVI, MCARI, EVI-2), and 3 soil radiometric (BI, RI, CI bands) (). The CBR-GA model in SC2 yielded the best prediction performance in terms of R2 and RMSE. The proposed model shows satisfactory results with R2 value of 0.665 and RMSE of 18.41 Mg ha−1.
Table 6. Model performance of the CBR technique in testing phase
Overall, our proposed model performed well and outperformed other ML techniques (XGBR, LGBMR, SVR, and RFR) in the study area ( and ). The CBR-GA model produced the highest prediction performance among the five ML models, with R2 = 0.665 and RMSE = 18.41 Mg ha−1 (). Conversely, the SVR model yielded the lowest performance, with R2 and RMSE values of 0.180 and 28.79 Mg ha−1, respectively. In addition, the AIC and the BIC values of the CBR-GA model were lowest among the five ML models (AIC = 241.75 and BIC = 267.08) whereas these corresponding numbers were highest observed by the SVR model (AIC = 273.91 and BIC = 299.25).
Figure 4. Scatter plots of the measured (X-axis) versus the estimated (Y-axis) mangrove soil carbon in the five ML models using S-2 data in the testing phase
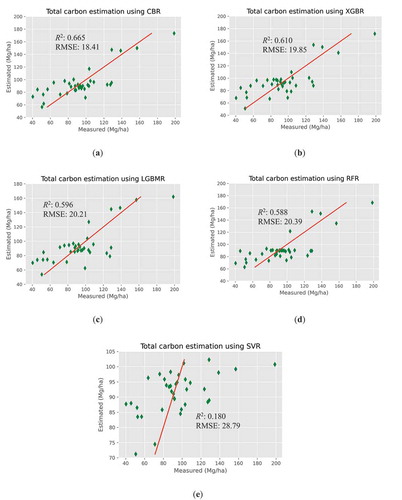
Table 7. Machine learning models’ performance for the TC retrieval of mangrove ecosystems
(a) CBR, (b) XGBR, (c) LGBMR, (d) RFR, (e) SVR
4.4. Mangrove TC maps
Since the proposed model outperformed other ML models in retrieving TC, we employed the CBR-GA model for estimating the TC of the mangrove ecosystems across the northern coast of Vietnam. The final results were converted to the GeoTiff format to visualize in the QGIS. The TC maps were interpreted for six classes (), ranging from 35.06 to 166.83 Mg ha−1 (average = 92.27 Mg C ha−1) and the highest soil carbon was found in the Red River Delta, which contains three coastal provinces (Nam Dinh, Thai Binh, and Hai Phong) and the lowest soil carbon was observed near the sea and the mountainous limestone areas of Quang Ninh Province (). The results reveal that the estimation of the spatial distribution of the TC generated by the CBR-GA model is consistent with the actual measured mean (~91.01 Mg ha−1). However, the TC range was lower than the actual distribution range (). The estimated TC of mangrove forests was mainly distributed in the high tidal zones of the river mouth and the core zone of the RAMSAR site. The predicted TC results matched the field observations, reflecting that the river deltas are the most suitable areas for mangrove regrowth and regeneration.
Figure 5. Prediction of spatial patterns of mangrove soil carbon maps in the study area
5. Discussion
5.1. Variations of mangrove TC stocks
The mean mangrove TC stocks ranged between 78.12 Mg ha−1 and 121.33 Mg ha−1 (). These numbers were lower than 159.45 ± 3.96 Mg C ha−1 in the mangrove area but higher than 87.59 ± 1.08 Mg C ha−1 in the bare sediment reported in Nam Dinh Province by Hien et al. (Citation2018), owing to the large spatial variability in mangrove soil carbon in four provincial zones. In the mangrove zone, the TC content was low, ~1.66%, in the upper 50 cm, compared to ~2.2% reported by Kristensen et al. (Citation2008). Our results are almost similar to those reported by Tue et al. (Citation2012) in Xuan Thuy National Park in Nam Dinh Province. The TC content in Nam Dinh varied from 0.08% to 2.18%, with an average of 1.09 ± 0.32% for the mangrove core zone, while in the other zones, such as buffer and transition zones, the TC content was lower.
We observed the highest TC content in mangrove soil in the lower depth layers ranged from over 50 cm, which is consistent with the results reported by (Donato et al. Citation2011). Intertidal mangrove expansion causing soil enrichment in TC may influence soil characteristics. However, mangrove TC stocks strongly depend on depth and ecosystem locations. The TC stocks in Nam Dinh indicate a decreasing trend from 0–15 and 15–30 cm to the deeper layers. Nevertheless, TC content increases slightly from 15–30 cm to 50–100 cm. The TC stocks in Nam Dinh are in good agreement with the reported results in previous studies (Tue et al. Citation2018). It is noted that other results in Hai Phong, Thai Binh, and Quang Ninh have not been reported yet in the current literature. This is the first time the TC values of mangrove ecosystems in the remaining provinces (Hai Phong, Thai Binh, and Quang Ninh) in the Northern coast of Vietnam were reported. Our results may be an important indicator to understand the current status of soil carbon stocks in these coastal provinces to assist the sustainable mangrove conservation and management in the tidal areas.
5.2. Model results and significant contributions to the literature
Our proposed model shows an R2 value of 0.665 and an RMSE value of 18.41 Mg ha−1, indicating a satisfactory result compared to the previous studies that estimated soil organic carbon using S-2 data (Angelopoulou et al. Citation2019) and mapped the mangrove forest soil carbon stocks (Sanderman et al. Citation2018). Prior studies attempted to develop statistical models for retrieving the soil carbon stocks using space-borne EO data such as Landsat TM (Bhunia, Shit, and Pourghasemi Citation2019), Landsat ETM+ (Mirzaee et al. Citation2016), Landsat-8 OLI (Were et al. Citation2015; Odebiri et al. Citation2020), and Sentinel-2A (Gholizadeh et al. Citation2018; Castaldi et al. Citation2019). A recent work conducted in four agricultural sites in the Czech Republic using S-2A combined partial least square regression (PLSR) and SVR models, whereas a more recent study attempted to predict soil carbon in croplands in European countries using the S-2 data with the RF model, indicating the potential use of S-2 data for soil carbon estimation. However, the R2 values of these studies were not reported (Gholizadeh et al. Citation2018; Castaldi et al. Citation2019). Our results show that the use of the S-2 space-borne free-of-charge multispectral sensor combined with the state-of-the-art CBR-GA model can improve estimates of mangrove TC stocks at 10 m spatial resolution and produce high prediction performance.
Remarkably, our proposed model result is relatively higher than that of a study on mapping the mangrove soil carbon using the RFR algorithm (R2 = 0.63) (Sanderman et al. Citation2018). This study used the initial mangrove organic carbon stocks (OCS) derived from the SoilGrid 250 m as the most important indicator and resampled to 30 m GSD to meet the Landsat bands for the prediction model (Sanderman et al. Citation2018). The study reported by Sanderman et al. (Citation2018) did not consider specific depth intervals and their corresponding bulk density (BD) values, which can only be obtained by soil sample collection, and used an existing soil database with low spatial resolution, resulting in errors. Our prediction results were derived based on the field survey measurements in four depth layers and intensive laboratory analysis combined with the S-2 free-of-charge data and a state-of-the-art ML technique. Therefore, our proposed model and framework () may provide an effective, timely, and rapid approach in monitoring mangrove blue carbon and in promoting global policy implementations for long-term mangrove conservation and restoration in the context of nature-based solutions to climate change impacts.
5.3. Variable importance for the use of multispectral remote sensing
Overall, vegetation indices and soil radiometric indices derived from Sentinel-2 MSI are more sensitive to mangrove TC stocks than those of band reflectances in this study. One possible reason is that the mangrove soils are generally wet, which might dominate the soil reflective signals. Among 11 multispectral bands of S-2 data, Band 3 (Green) and Band 5 (Red-edge 1), followed by Band 11 (SWIR1) and Band 12 (SWIR2) play an important role in mangrove soil carbon retrieval ()) caused by the strong absorption features of different soil types at NIR-SWIR spectra due to bending and stretching of the O-H and N-H groups, and C-H bonds (Ben-Dor, Inbar, and Chen Citation1997; Ben-Dor and Banin Citation1995). The findings are in agreement with those of the previous studies (Gholizadeh et al. Citation2018) and (Liu, Min, and Buchroithner Citation2017), reflecting that shortwave infrared spectra are sensitive to soil properties such as soil carbon content. Soils having dark hues associated with alluvium or sediments for similar moisture and parental materials may have large carbon contents than soils with pale hues or sand of parental limestone materials (Gholizadeh et al. Citation2020). Note that different mangrove soil colors were measured at four depth intervals and different geographic locations in four coastal provinces in North Vietnam (). We observed dark soils, which mostly come from silty-clay sediments with high carbon content collected at the mangrove areas near the Red River Delta ()) whereas pale hues and gray sandy soils with low carbon content were collected near the sea mouth or the parental limestone materials ()).
Figure 6. Mangrove soil colors measured at four depths and different locations in the study area
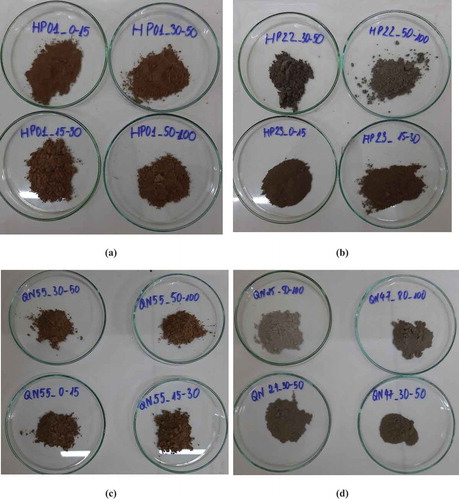
Figure 7. Relative variable importance in percentage of features derived from the S-2 data
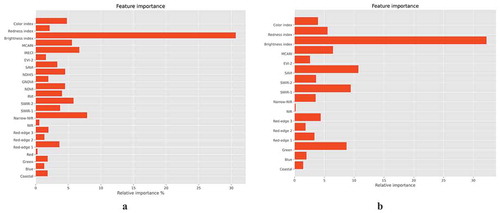
Mangrove soil carbon content is sensitive to various vegetation indices (VIs) and soil radiometric indices (SIs). All eight VIs and three SIs contribute significantly to the proposed model performance for estimating mangrove TC stocks. The SAVI, the MCARI, and the EVI-2 were consistently the most important indices when retrieving mangrove TC stocks with the CBR model with all features and the CBR-GA model with optimal features ()). The SAVI showed a significant correlation to mangrove TC stocks. Our results were consistent with the findings reported by Wang et al. (Citation2020) and Odebiri et al. (Citation2020) for estimating soil carbon stocks of forest ecosystems in China and South Africa, implying that the SAVI may be useful for estimating mangrove TC in other mangrove ecosystems. The new vegetation index (MCARI) derived from the S-2 data is the most sensitive index to the mangrove soil carbon content in the study area. This index may be useful for TC estimation in other mangrove ecosystems in the tropics. The IRECl was strongly correlated with mangrove TC stocks using the CBR model with all features (). Our results show that among three soil radiometric indices, BI was strongly correlated with mangrove soil carbon, reflecting the potential indicators for mangrove soil carbon retrieval. Similar observations were reported by Gholizadeh et al. (Citation2018). The BI soil radiometric index is the most important variable, followed by the RI and the CI for the mangrove TC retrieval in the study area ()).
5.4. Factors influencing accuracy and transferability of mangrove soil carbon estimation models
Mapping the spatial distribution of mangrove species plays a vital role in identifying high carbon sequestration in both above and below ground. This would be a key step in recommending the policymakers on which species needs to conserve and to help identify disturbed sites where it can be restored (Wu et al. Citation2020). The generation of mangrove communities spatial distribution and the estimation of their total C budget using multispectral remote sensing data are highly necessary to recognize and protect the high carbon storage values of areas and to help identify disturbed sites where can be restored, locations of areas may be threatened, thus promoting Blue Carbon projects in supporting sustainable conservation strategies in dealing with climate change impacts (Macreadie et al. Citation2019). The accuracy of mangrove soil carbon estimation models may improve when considering the spatial distribution of mangrove communities as one of the key features. Further research should focus on mapping the mangrove tree species on a large scale using multisource remote sensing data to improve estimates of mangrove soil carbon stock retrieval.
Transfer learning has widely used for image recognition and computer vision (Pan and Yang Citation2010; Oquab et al. Citation2014; Hu et al. Citation2015). Recent studies attempted to map soil properties using multisource data such as hyperspectral and the LUCAS database consisted of topsoil layer at 0–30 cm depth (Liu, Ji, and Buchroithner Citation2018; Padarian, Minasny, and McBratney Citation2019; Yang et al. Citation2020). Several studies proposed deep neural network models to transfer soil reflectance spectrum into regression models aiming at reducing the high dimensionality of hyperspectral data and reduce computation time (Liu, Min, and Buchroithner Citation2017) and applying deep learning neural networks for local soil spectroscopy (Padarian, Minasny, and McBratney Citation2019; Yang et al. Citation2020). These studies pointed out the superior performance of the transfer-based models using transfer learning techniques and Convolutional neural networks (CNN) combined with recurrent Neural Networks (RNN) for predicting soil properties using Vis-NIR spectroscopy. However, deep learning and transfer learning methods in remote sensing often require many soil samples. It is noted that there was no existed soil carbon at a high spatial resolution of 10 m for various mangrove ecosystems across tropical and semi-tropical regions. Thus, in-depth investigations using transfer learning and deep learning neural networks using large-scale earth observation data should be tested in future studies.
5.5. Policy recommendations for successful BC projects
Our results provided up-to-date data on mangrove soil carbon stocks and mapped the spatial distributions of mangrove TC along the coastal zones in North Vietnam using free-of-charge space-borne multispectral data and the state-of-the-art machine learning technique, which is highly necessary to identify and rank hotspots representing priority areas for mangrove conservation. The prediction of spatial mangrove distribution maps () shows that mangrove TC stocks of the Ramsar site in Xuan Thuy National Park, Nam Dinh Province are relatively low compared to those of the three provinces in North Vietnam, requiring policy-relevant solutions and actions from local governments for better management, restoration, and protection of mangrove blue carbon ecosystems of the National Park.
Importantly, our method developed in this study is significantly contributed to the current literature as a novel framework and a baseline to rapidly and cost-effectively monitor mangrove BC ecosystems and can be easily replicated in different mangrove forest areas in the tropics. Further in-depth investigations that will apply the proposed method to other mangrove ecosystems should be evaluated at large scales and under different geographical soil characteristics in the tropics. These studies will be required in assisting blue carbon offset schemes by voluntary carbon credits and payments (Macreadie et al. Citation2019) as many countries and national agencies currently lack regional blue carbon storage and sequestration reliable data (Vanderklift et al. Citation2019).
6. Conclusions
Our work is the first study that employed the Sentinel-2 MSI data together with a novel boosting technique, i.e., the combined CBR model and the GA, to estimate total soil carbon (TC) across the mangrove ecosystems of four coastal provinces in North Vietnam. Our findings show that the CBR-GA model outperforms other machine learning techniques in the retrieval of mangrove TC. In addition, the three GBDT models (CBR, XGBR, and LGBMR) showed satisfactory performance in terms of R2 and RMSE and produced better prediction results than the SVR model in the study area. This work also demonstrates that a combination of Sentinel-2 data and certain vegetation indices, particularly a new MCARI derived from S-2, and soil radiometric indices with the CBR model can accurately estimate mangrove TC (R2 = 0.665, RMSE = 18.41 Mg ha−1). Satellite image processing and the programming code in Python language developed in the current study can be freely accessed. Therefore, the method developed in this study can be easily replicated in different mangrove forest areas in the tropics. Further in-depth investigations that will apply the proposed method to other mangrove ecosystems should be evaluated at large scales and under different geographical soil characteristics in the tropics.
Highlights
A novel framework using S-2 MSI data and ML for mangrove soil carbon was proposed.
This is the first study that employed the S-2 data to estimate mangrove soil carbon in Vietnam.
S-2 combined with the CBR-GA model outperformed other machine learning techniques.
S-2 provides large spatial coverage for mangrove soil assessment in the tropics.
Author Contributions
T.D.P. conceived and designed the study. T.D.P., N.N.L., N.T.H. led the satellite image processing. Field data collection was led by T.D.P. with assistance from N.N.L., T.T.T.N. Soil experiment design and analysis were performed by T.D.Ph. and T.T.T.N. Model development was led by T.D.P., N.N.L., and N.T.H. The data analysis and generation of results were conducted by T.D.P., N.N.L., and N.T.H. The writing of the manuscript was led by T.D.P. and T.D.Ph. with input from all co-authors.
Acknowledgements
We would like to express our sincere gratitude to local authorities who assist us during the field survey across the coast in North Vietnam. Special thanks are extended to Prof. Daniel A. Friess at the Department of Geography, National University of Singapore (NUS) for the useful comments and suggestions on the manuscript.
Disclosure statement
The authors declare no competing interest.
References
- Ahmed, N., and M. Glaser. 2016. “Coastal Aquaculture, Mangrove Deforestation and Blue Carbon Emissions: Is REDD+ a Solution?” Marine Policy 66: 58–66. doi:10.1016/j.marpol.2016.01.011.
- Alongi, D. M. 2012. “Carbon Sequestration in Mangrove Forests.” Carbon Management 3 (3): 313–322. doi:10.4155/cmt.12.20.
- Angelopoulou, T., N. Tziolas, A. Balafoutis, G. Zalidis, and D. Bochtis. 2019. “Remote Sensing Techniques for Soil Organic Carbon Estimation: A Review.” Remote Sensing 11 (6): 676. doi:10.3390/rs11060676.
- Ben-Dor, E., and A. Banin. 1995. “Near-Infrared Analysis as a Rapid Method to Simultaneously Evaluate Several Soil Properties.” Soil Science Society of America Journal 59 (2): 364–372. doi:10.2136/sssaj1995.03615995005900020014x.
- Ben-Dor, E., Y. Inbar, and Y. Chen. 1997. “The Reflectance Spectra of Organic Matter in the Visible Near-infrared and Short Wave Infrared Region (400–2500 Nm) during a Controlled Decomposition Process.” Remote Sensing of Environment 61 (1): 1–15. doi:10.1016/S0034-4257(96)00120-4.
- Bhunia, G. S., P. K. Shit, and H. R. Pourghasemi. 2019. “Soil Organic Carbon Mapping Using Remote Sensing Techniques and Multivariate Regression Model.” Geocarto International 34 (2): 215–226. doi:10.1080/10106049.2017.1381179.
- Boone, K. J., C. Heider, J. Norfolk, and F. Payton. 2013. “Carbon Stocks of Intact Mangroves and Carbon Emissions Arising from Their Conversion in the Dominican Republic.” Ecological Applications 24 (3): 518–527. doi:10.1890/13-0640.1.
- Breiman, L. 2001. “Random Forests.” Machine Learning 45 (1): 5–32. doi:10.1023/a:1010933404324.
- Burnham, K. P., D. R. Anderson, and K. P. Huyvaert. 2011. “AIC Model Selection and Multimodel Inference in Behavioral Ecology: Some Background, Observations, and Comparisons.” Behavioral Ecology and Sociobiology 65 (1): 23–35. doi:10.1007/s00265-010-1029-6.
- Castaldi, F., A. Hueni, S. Chabrillat, K. Ward, G. Buttafuoco, B. Bomans, K. Vreys, M. Brell, and B. van Wesemael. 2019. “Evaluating the Capability of the Sentinel 2 Data for Soil Organic Carbon Prediction in Croplands.” ISPRS Journal of Photogrammetry and Remote Sensing 147: 267–282. doi:10.1016/j.isprsjprs.2018.11.026.
- Chen, T., and C. Guestrin. 2016. “XGBoost: A Scalable Tree Boosting System.” In Proceedings of the 22nd ACM SIGKDD International Conference on Knowledge Discovery and Data Mining, 785–794. San Francisco, California, USA: ACM.
- Claeskens, G., and N. L. Hjort. 2008. Model Selection and Model Averaging. Vol. 330. Cambridge, United Kingdom University Press Cambridge.
- Danielsen, F., M. K. Sørensen, M. F. Olwig, V. Selvam, et al. 2005. “The Asian Tsunami: A Protective Role for Coastal Vegetation”. Science 310: 643. doi:10.1126/science.1118387.
- Daughtry, C. S. T., C. L. Walthall, M. S. Kim, E. Brown de Colstoun, and J. E. McMurtrey. 2000. “Estimating Corn Leaf Chlorophyll Concentration from Leaf and Canopy Reflectance.” Remote Sensing of Environment 74 (2): 229–239. doi:10.1016/S0034-4257(00)00113-9.
- Davis, L. 1991. Handbook of Genetic Algorithms. New York City, the United States: Van Nostrand Reinhold
- Delegido, J., J. Verrelst, L. Alonso, and J. Moreno. 2011. “Evaluation of Sentinel-2 Red-Edge Bands for Empirical Estimation of Green LAI and Chlorophyll Content.” Sensors 11 (7): 7063–7081. doi:10.3390/s110707063.
- Donato, D. C., J. B. Kauffman, D. Murdiyarso, S. Kurnianto, M. Stidham, and M. Kanninen. 2011. “Mangroves among the Most Carbon-rich Forests in the Tropics.” Nature Geoscience 4. doi:10.1038/ngeo1123.
- Dorogush, A. V., V. Ershov, and A. Gulin. 2018. “CatBoost: Gradient Boosting with Categorical Features Support.” arXiv Preprint arXiv:1810.11363.
- Drusch, M., U. Del Bello, S. Carlier, O. Colin, V. Fernandez, F. Gascon, B. Hoersch, et al. 2012. “Sentinel-2: ESA’s Optical High-Resolution Mission for GMES Operational Services.” Remote Sensing of Environment 120 :25–36. doi:10.1016/j.rse.2011.11.026.
- Duke, N. C., J.-O. Meynecke, S. Dittmann, A. M. Ellison, K. Anger, U. Berger, S. Cannicci, et al. 2007. “A World Without Mangroves?” Science 317 (5834): 41–42. doi:10.1126/science.317.5834.41b.
- Escadafal, R. 1989. “Remote Sensing of Arid Soil Surface Color with Landsat Thematic Mapper.” Advances in Space Research 9 (1): 159–163. doi:10.1016/0273-1177(89)90481-X.
- Frampton, W. J., J. Dash, G. Watmough, and E. J. Milton. 2013. “Evaluating the Capabilities of Sentinel-2 for Quantitative Estimation of Biophysical Variables in Vegetation.” ISPRS Journal of Photogrammetry and Remote Sensing 82: 83–92. doi:10.1016/j.isprsjprs.2013.04.007.
- Friess, D. A., R. Kerrylee, C. E. Lovelock, K. W. Krauss, S. E. Hamilton, S. Y. Lee, R. Lucas, J. Primavera, A. Rajkaran, and S. Shi. 2019. “The State of the World’s Mangrove Forests: Past, Present, and Future.” Annual Review of Environment and Resources 44 (1): 89–115. doi:10.1146/annurev-environ-101718-033302.
- Gholizadeh, A., and V. Kopačková. 2019. “Detecting Vegetation Stress as a Soil Contamination Proxy: A Review of Optical Proximal and Remote Sensing Techniques.” International Journal of Environmental Science and Technology 16 (5): 2511–2524. doi:10.1007/s13762-019-02310-w.
- Gholizadeh, A., R. A. Mohammadmehdi Saberioon, V. Rossel, L. Boruvka, and A. Klement. 2020. “Spectroscopic Measurements and Imaging of Soil Colour for Field Scale Estimation of Soil Organic Carbon.” Geoderma 357: 113972. doi:10.1016/j.geoderma.2019.113972.
- Gholizadeh, A., D. Žižala, M. Saberioon, and B. Luboš. 2018. “Soil Organic Carbon and Texture Retrieving and Mapping Using Proximal, Airborne and Sentinel-2 Spectral Imaging.” Remote Sensing of Environment 218: 89–103. doi:10.1016/j.rse.2018.09.015.
- Giri, C., and J. Muhlhausen. 2008. “Mangrove Forest Distributions and Dynamics in Madagascar (1975–2005).” Sensors 8 (4): 2104–2117. doi:10.3390/s8042104.
- Gitelson, A. A., Y. J. Kaufman, and M. N. Merzlyak. 1996. “Use of a Green Channel in Remote Sensing of Global Vegetation from EOS-MODIS.” Remote Sensing of Environment 58 (3): 289–298. doi:10.1016/S0034-4257(96)00072-7.
- Hamilton, S. E., and D. A. Friess. 2018. “Global Carbon Stocks and Potential Emissions Due to Mangrove Deforestation from 2000 to 2012.” Nature Climate Change 8 (3): 240–244. doi:10.1038/s41558-018-0090-4.
- Hien, H. T., C. Marchand, J. Aimé, and N. T. K. Cuc. 2018. “Seasonal Variability of CO2 Emissions from Sediments in Planted Mangroves (Northern Viet Nam).” Estuarine, Coastal and Shelf Science 213: 28–39. doi:10.1016/j.ecss.2018.08.006.
- Hu, F., G.-S. Xia, H. Jingwen, and L. Zhang. 2015. “Transferring Deep Convolutional Neural Networks for the Scene Classification of High-Resolution Remote Sensing Imagery.” Remote Sensing 7 (11): 14680–14707. doi:10.3390/rs71114680.
- Huang, G., W. Lifeng, M. Xin, W. Zhang, J. Fan, Y. Xiang, W. Zeng, and H. Zhou. 2019. “Evaluation of CatBoost Method for Prediction of Reference Evapotranspiration in Humid Regions.” Journal of Hydrology 574: 1029–1041. doi:10.1016/j.jhydrol.2019.04.085.
- Huete, A. R. 1988. “A Soil-adjusted Vegetation Index (SAVI).” Remote Sensing of Environment 25 (3): 295–309. doi:10.1016/0034-4257(88)90106-X.
- Jachowski, N. R. A., S. Y., . Q. Michelle, D. A. Friess, D. Duangnamon, E. L. Webb, and A. D. Ziegler. 2013. “Mangrove Biomass Estimation in Southwest Thailand Using Machine Learning.” Applied Geography 45: 311–321. doi:10.1016/j.apgeog.2013.09.024.
- Jiang, Z., A. R. Huete, K. Didan, and T. Miura. 2008. “Development of a Two-band Enhanced Vegetation Index without a Blue Band.” Remote Sensing of Environment 112 (10): 3833–3845. doi:10.1016/j.rse.2008.06.006.
- Jin, X., K. Song, J. Du, H. Liu, and Z. Wen. 2017. “Comparison of Different Satellite Bands and Vegetation Indices for Estimation of Soil Organic Matter Based on Simulated Spectral Configuration.” Agricultural and Forest Meteorology 244-245: 57–71. doi:10.1016/j.agrformet.2017.05.018.
- Kauffman, J. B., and D. C. Donato. eds. 2012. Protocols for the Measurement, Monitoring and Reporting of Structure, Biomass, and Carbon Stocks in Mangrove Forests: CIFOR.
- Ke, G., Q. Meng, T. Finley, T. Wang, W. Chen, M. Weidong, Y. Qiwei, and T.-Y. Liu. 2017. Lightgbm: A Highly Efficient Gradient Boosting Decision Tree. Paper presented at the Advances in Neural Information Processing Systems, Long Beach, California, USA.
- Kristensen, E., S. Bouillon, T. Dittmar, and C. Marchand. 2008. “Organic Carbon Dynamics in Mangrove Ecosystems: A Review.” Aquatic Botany 89 (2): 201–219. doi:10.1016/j.aquabot.2007.12.005.
- Le Xuan, T., Y. Munekage, Q. T. Q. Dao, N. H. Tho, and P. T. A. Dao. 2003. “Environmental Management in Mangrove Areas.” Environmental Informatics Archives 1: 38–52.
- Leslie, M., S. T. Nguyen, T. K. D. Nguyen, T. T. Pham, T. T. N. Cao, T. Q. Le, T. T. Dang, et al. 2018. “Bringing Social and Cultural Considerations into Environmental Management for Vulnerable Coastal Communities: Responses to Environmental Change in Xuan Thuy National Park, Nam Dinh Province, Vietnam.” Ocean & Coastal Management 158 :32–44. doi:10.1016/j.ocecoaman.2018.03.022.
- Li, Z., Y. Saito, E. Matsumoto, Y. Wang, S. Tanabe, and Q. L. Vu. 2006. “Climate Change and Human Impact on the Song Hong (Red River) Delta, Vietnam, during the Holocene.” Quaternary International 144 (1): 4–28. doi:10.1016/j.quaint.2005.05.008.
- Liu, L., M. Ji, and M. Buchroithner. 2018. “Transfer Learning for Soil Spectroscopy Based on Convolutional Neural Networks and Its Application in Soil Clay Content Mapping Using Hyperspectral Imagery.” Sensors 18 (9): 3169. doi:10.3390/s18093169.
- Liu, L., J. Min, and M. Buchroithner. 2017. “Combining Partial Least Squares and the Gradient-Boosting Method for Soil Property Retrieval Using Visible Near-Infrared Shortwave Infrared Spectra.” Remote Sensing 9 (12): 1299. doi:10.3390/rs9121299.
- López-Serrano, P. M., C. A. López-Sánchez, J. G. Álvarez-González, and G.-G. Jorge. 2016. “A Comparison of Machine Learning Techniques Applied to Landsat-5 TM Spectral Data for Biomass Estimation.” Canadian Journal of Remote Sensing 42 (6): 690–705. doi:10.1080/07038992.2016.1217485.
- Ma, X., J. Sha, D. Wang, Y. Yuanbo, Q. Yang, and X. Niu. 2018. “Study on a Prediction of P2P Network Loan Default Based on the Machine Learning LightGBM and XGboost Algorithms according to Different High Dimensional Data Cleaning.” Electronic Commerce Research and Applications 31: 24–39. doi:10.1016/j.elerap.2018.08.002.
- Macreadie, P. I., J. A. Andrea Anton, N. B. Raven, R. M. Connolly, D. A. Friess, J. J. Kelleway, J. J. Kelleway, et al. 2019. “The Future of Blue Carbon Science.” Nature Communications 10 (1): 3998. doi:10.1038/s41467-019-11693-w.
- Manna, S., S. Nandy, A. Chanda, A. Akhand, S. Hazra, and V. K. Dadhwal. 2014. “Estimating Aboveground Biomass in Avicennia Marina Plantation in Indian Sundarbans Using High-resolution Satellite Data.” Journal of Applied Remote Sensing 8 (1): 083638. doi:10.1117/1.JRS.8.083638.
- Mathieu, R., M. Pouget, B. Cervelle, and R. Escadafal. 1998. “Relationships between Satellite-Based Radiometric Indices Simulated Using Laboratory Reflectance Data and Typic Soil Color of an Arid Environment.” Remote Sensing of Environment 66 (1): 17–28. doi:10.1016/S0034-4257(98)00030-3.
- Mazda, Y., M. Magi, M. Kogo, and P. N. Hong. 1997. “Mangroves as a Coastal Protection from Waves in the Tong King Delta, Vietnam.” Mangroves and Salt Marshes 1 (2): 127–135. doi:10.1023/a:1009928003700.
- Mirzaee, S., S. Ghorbani-Dashtaki, J. Mohammadi, H. Asadi, and F. Asadzadeh. 2016. “Spatial Variability of Soil Organic Matter Using Remote Sensing Data.” CATENA 145: 118–127. doi:10.1016/j.catena.2016.05.023.
- Mountrakis, G., I. Jungho, and C. Ogole. 2011. “Support Vector Machines in Remote Sensing: A Review.” ISPRS Journal of Photogrammetry and Remote Sensing 66 (3): 247–259. doi:10.1016/j.isprsjprs.2010.11.001.
- Nguyen, H. P. 2004. Mangrove Ecosystem in the Red River Coastal Zone: Biodiversity, Ecology, Socio-economic, Management and Education, 509. Hanoi: Agricultural Publishing House.
- Nguyen, H. P., and H. T. San. 1993. Mangroves of Vietnam, 173. Bangkok, Thailand: IUCN.
- Nielsen, D. 2016. “Tree Boosting with XGBoost-Why Does XGBoost Win” Every” Machine Learning Competition?”, NTNU.
- Odebiri, O., O. Mutanga, J. Odindi, K. Peerbhay, and S. Dovey. 2020. “Predicting Soil Organic Carbon Stocks under Commercial Forest Plantations in KwaZulu-Natal Province, South Africa Using Remotely Sensed Data.” GIScience & Remote Sensing 57 (4): 450–463. doi:10.1080/15481603.2020.1731108.
- Oquab, M., L. Bottou, I. Laptev, and J. Sivic. 2014. Learning and Transferring Mid-level Image Representations Using Convolutional Neural Networks. Paper presented at the 2014 IEEE Conference on Computer Vision and Pattern Recognition, 23-28 June 2014, Columbus, Ohio, the United States.
- Padarian, J., B. Minasny, and A. B. McBratney. 2019. “Transfer Learning to Localise a Continental Soil vis-NIR Calibration Model.” Geoderma 340: 279–288. doi:10.1016/j.geoderma.2019.01.009.
- Pan, S. J., and Q. Yang. 2010. “A Survey on Transfer Learning.” IEEE Transactions on Knowledge and Data Engineering 22 (10): 1345–1359. doi:10.1109/TKDE.2009.191.
- Pedregosa, F., G. Varoquaux, A. Gramfort, V. Michel, B. Thirion, O. Grisel, M. Blondel, P. Prettenhofer, R. Weiss, and V. Dubourg. 2011. “Scikit-learn: Machine Learning in Python.” Journal of Machine Learning Research 12 (Oct): 2825–2830.
- Pendleton, L., D. C. Donato, B. C. Murray, W. Stephen Crooks, A. Jenkins, S. Sifleet, C. Craft, et al. 2012. “Estimating Global “Blue Carbon” Emissions from Conversion and Degradation of Vegetated Coastal Ecosystems.” PLoS ONE 7 (9): e43542. doi:10.1371/journal.pone.0043542.
- Pham, T. D., N. N. Le, N. T. Ha, L. V. Nguyen, J. Xia, N. Yokoya, T. T. To, H. X. Trinh, L. Q. Kieu, and W. Takeuchi. 2020a. “Estimating Mangrove Above-Ground Biomass Using Extreme Gradient Boosting Decision Trees Algorithm with Fused Sentinel-2 and ALOS-2 PALSAR-2 Data in Can Gio Biosphere Reserve, Vietnam.” Remote Sensing 12 (5): 777. doi:10.3390/rs12050777.
- Pham, T. D., N. Yokoya, J. Xia, N. T. Ha, N. N. Le, T. T. T. Nguyen, T. H. Dao, T. T. P. Vu, T. D. Pham, and W. Takeuchi. 2020b. “Comparison of Machine Learning Methods for Estimating Mangrove Above-Ground Biomass Using Multiple Source Remote Sensing Data in the Red River Delta Biosphere Reserve, Vietnam.” Remote Sensing 12 (8): 1334. doi:10.3390/rs12081334.
- Pham, T. D., and K. Yoshino. 2016. “Impacts of Mangrove Management Systems on Mangrove Changes in the Northern Coast of Vietnam.” Tropics 24: 4. doi:10.3759/tropics.24.
- Pham, T. D., K. Yoshino, and D. T. Bui. 2017. “Biomass Estimation of Sonneratia Caseolaris (L.) Engler at a Coastal Area of Hai Phong City (Vietnam) Using ALOS-2 PALSAR Imagery and GIS-based Multi-layer Perceptron Neural Networks.” GIScience & Remote Sensing 54 (3): 329–353. doi:10.1080/15481603.2016.1269869.
- Pham, T. D., K. Yoshino, N. Le, and D. Bui. 2018. “Estimating Aboveground Biomass of a Mangrove Plantation on the Northern Coast of Vietnam Using Machine Learning Techniques with an Integration of ALOS-2 PALSAR-2 and Sentinel-2A Data.” International Journal of Remote Sensing 39 (22): 7761–7788. doi:10.1080/01431161.2018.1471544.
- Pham, T. D., H. H. Nguyen, N. V. Nguyen, T. T. Vu, T. N. M. Pham, T. H. Y. Doan, M. H. Nguyen, and T. M. V. Ngo. 2017. “Adsorptive Removal of Copper by Using Surfactant Modified Laterite Soil.” Journal of Chemistry 2017: 1–10. doi: 10.1155/2017/1986071. 2017.
- Pham, Lien, T. H., and B. Lars. 2017. “Monitoring Mangrove Biomass Change in Vietnam Using SPOT Images and an Object-based Approach Combined with Machine Learning Algorithms.” ISPRS Journal of Photogrammetry and Remote Sensing 128: 86–97. doi:10.1016/j.isprsjprs.2017.03.013.
- Pinheiro, É. F. M., M. B. Ceddia, C. M. Clingensmith, S. Grunwald, and G. M. Vasques. 2017. “Prediction of Soil Physical and Chemical Properties by Visible and Near-Infrared Diffuse Reflectance Spectroscopy in the Central Amazon.” Remote Sensing 9 (4): 293. doi:10.3390/rs9040293.
- Prokhorenkova, L., G. Gusev, A. Vorobev, A. V. Dorogush, and A. Gulin. 2018. CatBoost: Unbiased Boosting with Categorical Features. Paper presented at the Advances in Neural Information Processing Systems, Montreal Convention Centre, Montreal, Canada.
- Richards, D. R., and D. A. Friess. 2016. “Rates and Drivers of Mangrove Deforestation in Southeast Asia, 2000–2012.” Proceedings of the National Academy of Sciences 113 (2): 344–349. doi:10.1073/pnas.1510272113.
- Richardson, H. J., D. J. Hill, D. R. Denesiuk, and L. H. Fraser. 2017. “A Comparison of Geographic Datasets and Field Measurements to Model Soil Carbon Using Random Forests and Stepwise Regressions (British Columbia, Canada).” GIScience & Remote Sensing 54 (4): 573–591. doi:10.1080/15481603.2017.1302181.
- Rouse, J. _. W., Jr, R. H. Haas, J. A. Schell, and D. W. Deering. 1974. “Monitoring Vegetation Systems in the Great Plains with ERTS.”
- Sanderman, J., T. Hengl, G. Fiske, K. Solvik, M. F. Adame, L. Benson, J. J. Bukoski, et al. 2018. “A Global Map of Mangrove Forest Soil Carbon at 30 M Spatial Resolution.” Environmental Research Letters 13 (5): 055002. doi:10.1088/1748-9326/aabe1c.
- Sasmito, S. D., J. N. Pierre Taillardat, C. C. Clendenning, D. A. Friess, D. Murdiyarso, L. B. Hutley, and L. B. Hutley. 2019. “Effect of Land-use and Land-cover Change on Mangrove Blue Carbon: A Systematic Review.” Global Change Biology 25 (12): 4291–4302. doi:10.1111/gcb.14774.
- Schumacher, B. A. 2002. Methods for the Determination of Total Organic Carbon (TOC) in Soils and Sediments. EPA/600/R-02/069 (NTIS PB2003-100822). Washington, DC: Ecological Risk Assessment Support Center, Office of Research and Development (ORD).
- Silveira, E. M. O., S. H. G. Silva, F. W. Acerbi-Junior, M. C. Carvalho, L. M. T. Carvalho, J. R. S. Scolforo, and M. A. Wulder. 2019. “Object-based Random Forest Modelling of Aboveground Forest Biomass Outperforms a Pixel-based Approach in a Heterogeneous and Mountain Tropical Environment.” International Journal of Applied Earth Observation and Geoinformation 78: 175–188. doi:10.1016/j.jag.2019.02.004.
- Sun, X., M. Liu, and Z. Sima. 2018. “A Novel Cryptocurrency Price Trend Forecasting Model Based on LightGBM.” Finance Research Letters. doi:10.1016/j.frl.2018.12.032.
- Tucker, C. J. 1979. “Red and Photographic Infrared Linear Combinations for Monitoring Vegetation.” Remote Sensing of Environment 8 (2): 127–150. doi:10.1016/0034-4257(79)90013-0.
- Tue, N. T., N. T. Ngoc, T. D. Quy, H. Hamaoka, M. T. Nhuan, and K. Omori. 2012. “A Cross-system Analysis of Sedimentary Organic Carbon in the Mangrove Ecosystems of Xuan Thuy National Park, Vietnam.” Journal of Sea Research 67 (1): 69–76. doi:10.1016/j.seares.2011.10.006.
- Tue, N. T., P. T. Nguyen, D. M. Quan, L. V. Dung, T. D. Quy, M. T. Nhuan, and N. D. Thai. 2018. “Sedimentary Composition and Organic Carbon Sources in Mangrove Forests along the Coast of Northeast Vietnam.” Regional Studies in Marine Science 17: 87–94. doi:10.1016/j.rsma.2017.12.001.
- Vafaei, S., J. Soosani, K. Adeli, H. Fadaei, H. Naghavi, T. D. Pham, and D. T. Bui. 2018. “Improving Accuracy Estimation of Forest Aboveground Biomass Based on Incorporation of ALOS-2 PALSAR-2 and Sentinel-2A Imagery and Machine Learning: A Case Study of the Hyrcanian Forest Area (Iran).” Remote Sensing 10 (2): 172. doi:10.3390/rs10020172.
- Vanderklift, M. A., J. R. Raymundo Marcos-Martinez, A. Butler, M. Coleman, A. Lawrence, A. D. Heidi Prislan, L. Steven, and S. Thomas. 2019. “Constraints and Opportunities for Market-based Finance for the Restoration and Protection of Blue Carbon Ecosystems.” Marine Policy 107: 103429. doi:10.1016/j.marpol.2019.02.001.
- Vapnik, V. 2013. The Nature of Statistical Learning Theory:. Springer science & business media. New York City, the United States: Springer-Verlag New York.
- Veettil, B. K., R. D. Ward, N. X. Quang, N. T. T. Trang, and T. H. Giang. 2019. “Mangroves of Vietnam: Historical Development, Current State of Research and Future Threats.” Estuarine, Coastal and Shelf Science 218: 212–236. doi:10.1016/j.ecss.2018.12.021.
- Walsh, J., I. T. Heazlewood, and M. Climstein. 2019. “Regularized Linear and Gradient Boosted Ensemble Methods to Predict Athletes’ Gender Based on a Survey of Masters Athletes.” Model Assisted Statistics and Applications 14 (1): 47–64. doi:10.3233/MAS-180454.
- Wang, S., Q. Zhuang, X. Jin, Z. Yang, and H. Liu. 2020. “Predicting Soil Organic Carbon and Soil Nitrogen Stocks in Topsoil of Forest Ecosystems in Northeastern China Using Remote Sensing Data.” Remote Sensing 12 (7): 1115. doi:10.3390/rs12071115.
- Were, K., D. T. Bui, Ø. B. Dick, and B. R. Singh. 2015. “A Comparative Assessment of Support Vector Regression, Artificial Neural Networks, and Random Forests for Predicting and Mapping Soil Organic Carbon Stocks across an Afromontane Landscape.” Ecological Indicators 52: 394–403. doi:10.1016/j.ecolind.2014.12.028.
- Wu, C., H. Shen, A. Shen, J. Deng, M. Gan, J. Zhu, X. Hongwei, and K. Wang. 2016. “Comparison of Machine-learning Methods for Above-ground Biomass Estimation Based on Landsat Imagery.” Journal of Applied Remote Sensing 10 (3): 035010. doi:10.1117/1.JRS.10.035010.
- Wu, M., H. Ziying, S. Fung, Y. Cao, D. Guan, Y. Peng, and S. Y. Lee. 2020. “Species Choice in Mangrove Reforestation May Influence the Quantity and Quality of Long-term Carbon Sequestration and Storage.” Science of the Total Environment 714: 136742. doi:10.1016/j.scitotenv.2020.136742.
- Yang, J., X. Wang, R. Wang, and H. Wang. 2020. “Combination of Convolutional Neural Networks and Recurrent Neural Networks for Predicting Soil Properties Using Vis–NIR Spectroscopy.” Geoderma 380: 114616. doi:10.1016/j.geoderma.2020.114616.
- Yang, R.-M., G.-L. Zhang, F. Liu, L. Yuan-Yuan, F. Yang, F. Yang, M. Yang, Y.-G. Zhao, and L. De-Cheng. 2016. “Comparison of Boosted Regression Tree and Random Forest Models for Mapping Topsoil Organic Carbon Concentration in an Alpine Ecosystem.” Ecological Indicators 60: 870–878. doi:10.1016/j.ecolind.2015.08.036.