
 ?Mathematical formulae have been encoded as MathML and are displayed in this HTML version using MathJax in order to improve their display. Uncheck the box to turn MathJax off. This feature requires Javascript. Click on a formula to zoom.
ABSTRACT
The frequent occurrence of a forest fire can be detrimental to the functioning of ecologically fragile regions such as the Western Himalaya. This study assesses the spatio-temporal variability and trends of fire occurrence in forests, shrubland, and grassland in relation to anthropogenic activities and climate oscillations over Uttarakhand and Himachal Pradesh; the most fire-affected states in the Western Himalaya. The Pre-monsoon (March to June) temporal distribution of fire occurrence is bimodal with the first and second fire peaks occurring in the last week of April and late May/early June, respectively. The length of fire season was found to have reduced by ~ 10 days in 2010s compared to 2000s with the increasing burned area concentration over a shorter period (~110 days). The Mann-Kendall Tau (τ) and Sen’s-slope suggested an increasing trend (τ = 0.3, Sen’s slope = 46.78 km2 year−1, p = 0.02) of burn area over Uttarakhand where most fire activity occurs. The Getis-Ords (Gi*) statistic was derived by using Fire Radiative Power (FRP) data to infer the spatial distribution of hot and cold clusters which were found to be greatest (Gi* = 1–10) in evergreen needleleaf forest which also accounted for a marginally higher mean per-pixel FRP than other land cover types. Analyses of the role of climatic variables on fire activity revealed moderate positive and negative correspondence between the burned area and average maximum-temperature (R = 0.57, p = 0.01) and total precipitation (R = – 0.53, p = 0.02), respectively. Assessment of the variation of fire activity with global climatic oscillation indices found the Niño-3.4 index to have the strongest, albeit modest, relationship (R = 0.51) with burned area anomalies. This study highlights the increase in fire intensity in the fragile forests of the Western Himalayan region and the requirement for further research into the role of climate and anthropogenic activities on fire occurrence in order to best preserve regional biodiversity and develop an effective forest management strategy.
1. Introduction
Landscape fire occurrence is influenced by both anthropogenic activity and climate variability and is primarily concentrated around tropical and subtropical biomes (Moritz et al. Citation2012). As a global phenomenon, wildfire occurrence results from the interaction of climate, weather, physiography, fuel characteristics, and anthropogenic activity (Flannigan et al. Citation2009). Fire is an integral part of many ecosystems (Fernandes, Rego, and Rigolot Citation2011; Stott, Goldammer, and Werner Citation1990) but currently, climate change and increasing human activities have bolstered fire frequency which can have an adverse impact on the ecosystem and environmental functioning (Flannigan et al. Citation2009; Whitlock et al. 2010). Along with alteration of the land surface characteristics, fires also release large quantities of aerosols and trace gases into the atmosphere which alters atmospheric composition and reduce air quality (Ramanathan et al. Citation2005; Crutzen et al. Citation1979; Keywood et al. Citation2013; Crippa et al. Citation2016). The majority of global fire activity occurs in the tropics, with savannas being the most affected land cover type (Dwyer, Gregoire, and Malingreau Citation1998; Maurin et al. Citation2014) although large-scale fires frequently occur throughout the tropical forests of South America and Southeast Asia (Roberts Citation2001).
The spatio-temporal variability of fire severity can have long-term consequences on flora and fauna, including forest structure, composition, diversity, and productivity (Parashar and Biswas, 2018), and the physical and chemical composition of the soil (Knicker Citation2007). The surface characteristics (e.g. elevation, topography, slope), environmental (e.g. forest type, fuel type, loading, and moisture, etc.), and climatic or weather (precipitation, temperature, wind, humidity, solar radiation, etc.) conditions, directly and indirectly influence fire behavior (Rothermel Citation1983) and fire regime (Negi and Kumar Citation2016). The decrease in precipitation during the dry season reduces the surface and fuel moisture which increases fire risk which, during periods of prolonged drought, can result in larger and more destructive landscape fires (Mandel et al. Citation2014; Randerson et al. Citation2006). Furthermore, regional climatic fluctuations due to climatic oscillations, such as El Niño and La Niña, impact local, regional to global fire regimes (Mason et al. Citation2017; Alencar, Nepstad, and Diaz Citation2006) and fire severity (Simard and Haines 1985; Skinner et al. Citation2006; Fuller and Murphy Citation2006). Along with environmental connection, fire severity and fire regime are tightly coupled with anthropogenic activities such as increasing population density (Marlon et al. Citation2008), the rapid growth of wildland-urban interface (Radeloff et al., 2018), land clearance (Bowman et al., 2020) and human modifications (Haas, Calkin, and Thompson Citation2013). Whilst nearly 90% of the fire ignitions in the United States are due to human activity, climate change has increased the length of the fire season and the size of the burned area (Rogers et al. Citation2020; National Research Council Citation2010). The situation is predicted to get worse under a warmer climate and increased population pressure, with increased fire occurrence, greater burned area, and longer fire seasons across the globe (Flannigan et al. Citation2006).
Fire activity has been increasing in many countries in South and Southeast Asia over the last two decades, particularly in India, Pakistan, Indonesia, and Myanmar (Vadrevu et al. Citation2019). A total of 520,861 active-fire detections were reported between 2003 and 2017 across India (Sannigrahi et al. Citation2020) which are now considered a major cause of forest degradation in central India (Chandra and Bhardwaj Citation2015), western Himalaya (Dobriyal and Bijalwan Citation2017), and the Northeast Himalaya (Puri et al. Citation2011). The Western Himalaya is a fragile biodiversity hotspot where the landscape is composed of evergreen broad and needle leaf forest, deciduous broadleaf forest, mixed forest, shrubland, and grassland (Reddy et al. Citation2015; Roy et al. Citation2015). The prevalence of coniferous forest cover (~16% of the forested area) (Dobriyal and Bijalwan Citation2017) plays a vital role in maintaining primary productivity in the region through the deposition of needles (Singh and Parida Citation2019; Singh et al. Citation2019) which also serves as the main source of flammable fuel (Dobriyal and Bijalwan Citation2017). During the pre-monsoon season (March to June), higher temperatures and reduced precipitation (Singh and Mal Citation2014) increase the severity of fires over recent decades which are responsible for widespread forest degradation and biodiversity loss (Dobriyal and Bijalwan Citation2017; Prabhakar, Somanathan, and Mehta Citation2006; Roy Citation2005).
Remote sensing data and geospatial techniques are key tools in the identification, monitoring, and assessment of landscape fires (Chuvieco Citation2009; Reddy et al. 2019; Bar et al., Citation2020). Detection of the burned area using remotely sensed data is typically carried out using surface reflectance measurements and, in some cases thermal observations. Burned area algorithms often discriminate between burned surfaces, where the over-story vegetation has been removed to varying degrees and replaced with char and ash, and unburned surfaces using spectral reflectance or vegetation indices (VIs) (Roy et al. 1999; Stroppiana et al. Citation2002; Giglio et al. Citation2010). A number of operation datasets such as MOD14GN, MOD14A1, MOD14A2, MOD14CMQ, MYD14CMQ, MCD14ML, MCD64CMQ, and MCD64A1 have been developed using Moderate Resolution Imaging Spectroradiometer (MODIS) data which provide burned area measurements at spatial resolutions of 250–1000 m and daily temporal resolution (Giglio, Schroeder, and Justice Citation2016; Chuvieco et al. Citation2016; Urbanski et al. Citation2018). On the other hand, active-fire detection utilizes thermal observations in the middle and longwave infrared to detect pixels that contain one or more fires that are actively burning at the time of satellite overpass. Unlike burned area products, active-fire algorithms detect thermal anomalies during each overpass, providing information on the diurnal variation in fire activity, and can do so in near real-time. In addition to the direct detection of fires and fire-affected areas, remote sensing data are also a key resource in the assessment of the fire risk (Matin et al. Citation2017; Bar et al., Citation2020), fuel-type mapping (García et al. Citation2017), burn severity assessment (Meng et al. Citation2017) and in the analysis of vegetation recovery (SParks et al. Citation2018; Szpakowski and Jensen Citation2019).
Several studies have investigated the dynamics of fire behavior and fire risk in the Western Himalaya region (Joseph, Anitha, and Murthy Citation2009; Babu, Roy, and Prasad Citation2016; Gupta et al. Citation2018; Bar et al., Citation2020) but these studies have been limited to a few years (~ 3–10) of analysis and do not explicitly assess the role between regional and global climatic variation and fire intensity (e.g. burn area). This study for the first time investigates the spatial and temporal dynamics of landscape fire in the Western Himalaya region over the past 19 years (2001–2019) and assesses the role of regional and global climatic oscillations on fire activities. The overarching objectives of this study are to: (i) characterize the spatial distribution and temporal dynamics of landscape fire, (ii) assess the extent to which regional and global climatic oscillations regulate the fire regime, and (iii) investigate the influence of anthropogenic activity, such as land management practices, on fire occurrence using human modification (HM) and population density data.
2. Materials and methods
2.1 Study area
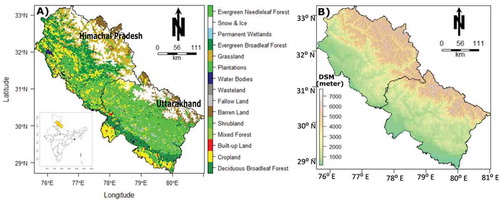
The Western Himalayas is a region rich in biodiversity but fire is a common anthropogenic and naturally driven phenomenon (Dobriyal and Bijalwan Citation2017). This study was restricted to two states in Western Himalaya: Uttarakhand and Himachal Pradesh (), the most fire-prone states of the region, where the dominant forest types are evergreen broadleaf, needle leaf forest, and deciduous broadleaf forest (Reddy et al. Citation2015). The extension of the region is 75° 34ʹ 12” E to 81° 1ʹ 48” E longitude and 28° 42ʹ 0” N to 33° 15ʹ 36” N latitude. Surface fires are a frequent occurrence in the Chir pine (Pinus roxburghii Sarg) forest in northern regions of the Western Himalaya due to their foliage, which is highly flammable and has a large surface-to-volume ratio, and the mountainous terrain (Brown, Bhattacharyya, and Shah Citation2011). The topography of the region is characterized by steep mountain ridges and narrow valleys, with an elevation between 173 and 7764 m ().The climate of the region ranges from tropical to temperate (Singh and Mal Citation2014; Parida, Pandey, and Patel Citation2020) with a warmer summer from March to June (during pre-monsoon) when most fire activity occurs. The average maximum temperature varies from 15°C to 40°C (peaks in May and June) whilst the annual precipitation ranges from 600 to 2000 mm with most falling between July and September (Mohd et al. Citation2017; Kumar, Shanu, and Jahangeer Citation2017).
Figure 1. (a) Land use and land cover (LULC) map of 2005 of Uttarakhand and Himachal Pradesh extracted from (Roy et al. Citation2015) and (b) ALOS World 3D (30 m) digital surface model (DSM)
2.2 Datasets
Fire activity was characterized using the MODIS burned area (MCD64 at 500 m spatial resolution; Giglio et al. Citation2018) and active fire (MYD14A1 at 1 km spatial resolution; Giglio, Schroeder, and Justice Citation2016) and the 250 m MODIS Fire (Climate Change Initiative) CCI product (Chuvieco et al. Citation2018). Land use and land cover (LULC) data, regional climatic data (maximum temperature and precipitation), and climatic oscillation indices (i.e. Niño-3.4, Niño-4, and Dipole mode index) were used which are summarized in . All the spatial data were processed in World Geodetic System 84 (WGS84) coordinate system.
Table 1. Data used to accomplish the vegetation fire studies over different land use and land cover type (LULC) in India
2.2.1 Land use land cover (LULC) and Digital Surface Model (DSM) data
A decadal LULC dataset (Roy et al. Citation2015) for the year 2005 was utilized for categorizing fires into forest, shrubland, or grassland fires. This LULC dataset contains 19 land cover classes at a spatial resolution of 100 m and, was derived from a combination of Landsat-5 Enhanced Thematic Mapper (ETM+) and India Remote Sensing satellites (IRS) Linear Imaging self-Scanning System (LISS-III) data set. The product, which is explained in detail in Roy et al. (Citation2015), has been validated and found to have an overall accuracy of 94% and a kappa coefficient of 0.94. The regional land cover consists of six cover types () comprising forest (i.e. Evergreen Needleleaf (ENF), Evergreen Broadleaf (EBF), Deciduous Broadleaf (DBF), and Mixed forest (MF)), Shrubland, and Grassland. The 30 m World 3D Topographic dataset (version 2.2), derived using Advanced Land Observing Satellite (ALOS) data (Takaku et al. Citation2007), was used to investigate the spatial distribution of fire intensity with elevation ().
2.2.2 Burned area products
Burned area spatial and temporal dynamics in Uttarakhand and Himachal Pradesh were assessed using two burned area products: MCD64A1 and Fire CCIv5.1. The MODIS 500 m burned area product (MCD64A1, collection 6) detects burned area using a hybrid approach that utilizes temporal composites of a vegetation index and active-fire detections to identify fire-affected pixels. Validation using Landsat burned area datasets indicates that the MCD64A1 product has low errors of omission (0.37 km2) and commission (0.23 km2) (Giglio et al. Citation2018). The MODIS-derived global burned area dataset, Fire CCI v5.1 was also used in this study which developed as part of the Climate Change Initiative (Chuvieco et al. Citation2018) makes use of the 250 m spatial resolution red and near-infrared wavebands of MODIS onboard Terra in addition to active-fire information to detect burned area. This product has higher errors of omission and commission (0.4 km2 and 0.4 km2, respectively) than the MCD64A1 product but the improved spatial resolution facilitates the detection of small (< 100 ha) burned area (Chuvieco et al. Citation2018). Monthly burned area data covering the main fire season (March–June) was downloaded for both products for each year (19 years) to assess the total pre-monsoonal burn area over the region.
2.2.3 Fire radiative power data
Fire Radiative Power (FRP, MW) retrievals, which describes the rate of radiative energy release during combustion, from the Aqua MODIS Thermal Anomalies product (MYD14A1) were employed to investigate the influence of land cover type on fire characteristics. MYD14A1 is a level-3 composite product that provides daily active-fire detections and FRP retrievals at 1 km2 spatial resolution over 8 days. The FRP data between March and June from 2003 to 2019 were extracted for further analysis. FRP is retrieved in the collection of 6 product using the middle-infrared (MIR) radiance method present in equation-1 (Wooster et al. Citation2005).
where and
are the MIR spectral radiance of the active fire and ambient background pixels (W m−2 sr−1 µm−1) respectively, σ is the Stefan-Boltzmann constant (5.67x10⁻⁸ J s−1 m−2 K−4), α denotes a sensor-specific empirical constant (α = 3.0 × 10 − 9 W m−2 sr−1 μm−1 K−4), ε and εMIR are the broadband and middle-infrared spectral emissivity’s, respectively, and
is the pixel area (m2). FRP retrievals have been shown to be related to the fuel consumption rate (Smith and Wooster Citation2005) and smoke and trace gas emissions (Freeborn et al. Citation2008).
2.2.4 Gridded human population and global human modification (HM) data
Previous research suggests that anthropogenic activity contributes to ~ 90% of the fire ignitions in the study region (Dobriyal and Bijalwan Citation2017). Gridded population density (GPWv411) data for 2005, 2010, and 2015, estimated from extrapolation of census data (Morton Citation2019), and a global Human Modification (gHM) dataset from 2016 (Kennedy et al. Citation2019) were used to investigate the relationship between fire occurrence and the scale of anthropogenic activity. The gHM index, which varies between 0 and 1, provides a cumulative measure of human land modification using metrics including population density, built-up area, transport and utilities (road, railways, and power lines) networks, nighttime lights, and mining locations. Both datasets are available in 30 arc-second (~1 km) spatial resolution.
2.2.5 Climate data
The majority of fires in the region are caused by anthropogenic activity (Dobriyal and Bijalwan Citation2017) whilst environmental and climatic variables contribute to creating the conditions conducive for fires to spread. The role of regional climatic conditions on fire occurrence was assessed using the Indian Meteorological Department (IMD) precipitation data (0.25°×0.25°) and maximum temperature (1°×1°) dataset, downloaded from National Data Center (NDC), Pune. The gridded daily precipitation data, discussed in detail by Pai et al.(Citation2014), was produced by the National Climate Center using 7000 rain-gauge stations data. Inverse Distance Weighted (IDW) interpolation was used to generate a gridded dataset with the weights based on the distance between the station and the grid point (IMD Citation2005). Daily maximum temperature (°C) and precipitation (mm) data during the pre-monsoon (March to June) were extracted to assess their influence on regional fire occurrence.
2.2.6 Global climatic oscillation indices
The regional weather and climatic cycles are governed by macro-scale global climatic oscillations (Mason et al. Citation2017). It is well established that in the last few decades, climatic extremes have enhanced fire activity around the world (Doerr and Santín Citation2016; Mason et al. Citation2017). In this study, the relationship between burned area and the Niño-3.4, Niño-4, and Dipole Mode Index (DMI) climate anomaly indices were investigated. The Niño-3.4 and Niño-4 are indices that characterize the average Sea Surface Temperature (SST) anomalies. The Niño-3.4 represents the average state of equatorial Pacific SSTs from the dateline to the South American coast (5°N – 5°S and 170°W – 120°W) whereas Niño-4 covers central equatorial Pacific (5°N to 5°S and 160°E – 150°W) (Trenberth and Stepaniak Citation2001). Typically, these indices calculation uses average SST over the region then a consecutive 5 monthly running mean method was performed to compute the monthly anomaly. The Niño-3.4 has been used to define El Niño (> 0.4) and La Niño-3.4 (< −0.4) events whilst the Niño-4 region typically has less variation than other Niño regions (Trenberth Citation2020). The Indian Ocean Dipole (IOD) is a tropical ocean-atmosphere phenomenon that leads to climatic variability, particularly over South-East Asia and the Indian continent (Ashok, Guan, and Yamagata Citation2001), East Africa, and Australia. The DMI (e.g. quantitative measures of IOD phenomenon) is defined as the SST differences between the western (from 50°E to 70°E and 10°S to 10°N) and eastern (from 90°E to 110°E and 10°S to 10°N) regions of the Indian Ocean (Saji et al. Citation1999). The monthly anomaly of these indices was downloaded and the median pre-monsoonal (March–June) anomaly was calculated to assess its relationship to fire anomalies over the same period.
2.2.7 Field observations of fire activity
A ground survey, consisting of 25 burn sites, was carried out between 28th May to 2nd June (2019) over parts of Uttarakhand Himalaya to document the site and effects of fire on the landscape. According to the Forest Survey of India (FSI), Nainital, Almora districts are the most fire-affected areas of the south-eastern parts of Uttarakhand (ISFR. Citation2017). The field sites were selected based on the fire risk maps from the FSI over Nainital and Almora districts. The survey plots were defined using three categories, (i) burnt (burnt a few days prior to the campaign), (ii) burning (actively smoldering or flaming), and (iii) unburned. The field survey was conducted during the peak fire period and documented the type, condition, and thickness of the surface fuel layer, effects of the fire, fire spreading mechanism (surface or crown fire), and fire management. The thickness of the fuel was measured by the graduated scale and information on the fire spread was estimated using photographs.
2.3 Methods
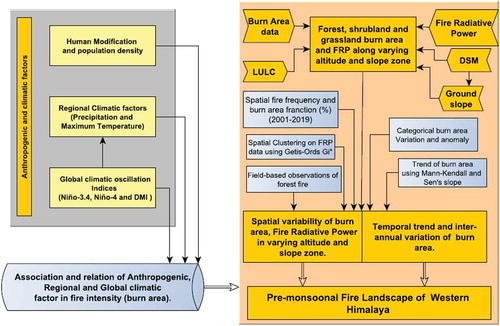
All the spatial datasets were initially processed in Python-2.7 environment using the “ArcPy” package available in ArcGIS-10.3. The basic statistical analysis and inferential statistical methods were conducted using the R-programming platform (R Core Team Citation2020). All the maps and figures were made in R using different packages (e.g. raster, rgdal, rasterVis, ggplot2, ggpubr, plot3D, zpy, spdep, spgwr, and tmap, among others). The conceptual flowchart of the methodology is presented in .
Figure 2. Methodological flow of spatio-temporal variability of forests, shrubland, and grassland fire and its relationship with regional climatic and anthropogenic factors and global climatic oscillations
2.3.1 Temporal analysis of fire
The focus of the study is to analyze the spatial and temporal dynamics of fire occurrence in the Western Himalaya and its relationship with regional climatic conditions and anthropogenic activity. The analysis of the temporal trends in the burned area over the past 19 years was carried out using the Mann-Kendall (MK) nonparametric statistical test which is more robust to outliers and sudden breaks in nonhomogeneous time-series (Önöz and Bayazit Citation2003). Sen’s (Sen Citation1968) slope estimator was applied to estimate the magnitude of burn area trend. The “YuePilon” method (Yue et al. Citation2002) was adopted which reduces the influence of autocorrelation over time-series. The length of the fire season and distribution pattern are important indicators of fire regime and complex fire dynamic (Rogers et al. Citation2020; National Research Council Citation2010). The length and distribution pattern of fire during pre-monsoon was analyzed using a normal probability function over two-time periods (2001–2010 and 2011–2019). An equality test between fire distribution in 2001–2010 and 2011–2019 was determined using the nonparametric Kolmogorov–Smirnov test (K–S test, Marsaglia, Tsang, and Wang Citation2003).
2.3.2 Spatial fire frequency and burn area fraction
The pre-monsoonal (March–June) burn area of Fire-CCI was used to calculate the annual fire occurrence in a 1 × 1 km grid over a 19-years’ (2001–2019) time span. The burn area fraction (%) within a 1 km2 grid was calculated using the 250 m Fire-CCI burn area data and the average (2001–2019) burn area fraction determined using the annual burn fraction. These data were used to characterize the gradient of fire intensity across the landscape.
2.3.3 FRP Hot/Cold spots mapping
FRP magnitude has been found to vary with the land cover type (Vadrevu et al. 2015; Chuvieco et al. Citation2018) and this was investigated in this study using the mean per-pixel FRP (2003–2019). The spatial patterns of the FRP were investigated in relation to land cover type by using the Getis-Ords Gi* spatial statistic to derive hot and coldspot clusters (Getis and Ord Citation2010). When applied to FRP retrievals, the Getis-Ords function describes the spatial autocorrelation of higher and lower “intensity” active fires. A detailed description of Getis-Ords Gi* is available in Reddy et al. (2019).
2.3.4 Correlation and regression analysis
The pre-monsoonal burn area was correlated and regressed with selected climatic variables (i.e. maximum temperature and precipitation). The Pearson correlation coefficient (R) (Nahler Citation2009) statistical function was applied between climatic variables and burn area to quantify the linear association (R) ranging from – 1 to +1. Linear least square regression was employed to compute the contribution (regression coefficient or β) of anthropogenic (population density and human modification), regional (maximum temperature and precipitation), and global climatic indices in fire intensity (burn area).
2.3.5 Standard anomaly estimation
The pre-monsoonal (median of March–June) global climatic oscillations indices (Niño-3.4, 4 and DMI) are analyzed in relation to pre-monsoonal burn area standard anomaly (SA) over 19-years (2001–2019). The SA was estimated using Equationequation 2(2)
(2) .
where is defined as the individual observation of burn area,
is the mean burn area (2001–2019) of the whole observation and
represents the standard deviation.
3. Results
3.1 Spatial and temporal variation in fire
Over the past 19 years (2001–2019), the average annual pre-monsoonal burned area in Uttarakhand and Himachal Pradesh is 867 km2 (sd = 780 km2) and 120 km2 (sd = 124 km2), respectively, which equates to 1.6% and 0.2% of the land surface area of each state, respectively. There was a significant inter-annual variation in the burned area (-B) which ranges between 3 and 451 km2 and 50–3083 km2 in Himachal Pradesh and Uttarakhand, respectively. The overall trend ( and Supplement 1) indicates that burned area is increasing by 2.6 and 46.7 km2 year−1 in Himachal Pradesh and Uttarakhand, respectively. DBF and EBF are the most fire-prone land cover types in Himachal Pradesh and account for 42 and 32% of the total burned area, respectively. In Uttarakhand, ENF and DBF account for 43 and 41% of the total burned area. In Uttarakhand and Himachal Pradesh, the average fire size is small at 0.30 and 0.24 km2 whilst the largest burned area detected was 100.4 and 38.3 km2, respectively.
Table 2. Trends of burn area (including forest, shrubland, and grassland) over the period 2001–2019 as per the Fire_CCI fire data in Uttarakhand and Himachal Pradesh. * indicates over 90% confidence level (CL)
Figure 3. Interannual variability of (a) pre-monsoonal total and (b) land cover wise (DBF: Deciduous Broadleaf Forest, EBF: Evergreen Broadleaf Forest, ENF: Evergreen Needleleaf Forest, Grass: Grassland, MF: Mixed Forest and Shrub: Shrubland) burn area (km2) over Himachal Pradesh (left panel), and Uttarakhand (right panel) from 2001 to 2019 using Fire-CCI product
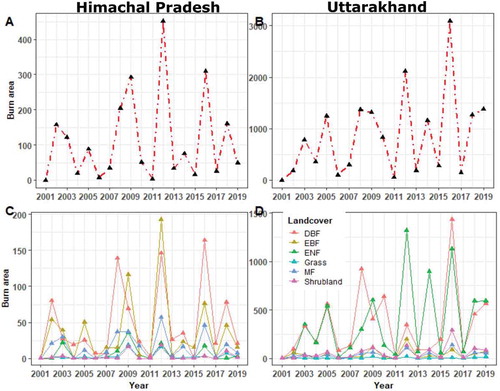
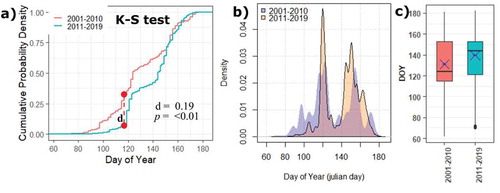
Fire occurrence among different land cover types over western Himalaya is shown in Supplement 2A and 2B and their temporal variation in and . It is clear from , that there has been a large increase in burned area in Uttarakhand between 2011 and 2019. Notably, ENF cover has an 87% increase in the burned area relative to that which occurred between 2001 and 2010. A similar inter-annual burn area pattern has also been noticed in the MCD64A1 burn area dataset (Supplement 3). Burned area is typically low in shrublands and grasslands with DBF being the only land cover type with a moderate degree of fire activity in both regions. Most fires occur in the dry season between March and June where daily total rainfall is < 50 mm and the average maximum temperature is 31.5°C. The nonparametric K-S test revealed that the distribution of burned area in 2001–2010 and 2011–2019 was not equal or significantly dissimilar. The absolute maximum difference of cumulative probability density is 0.19 (p < 0.01) (). The decadal daily fire distribution () shows a bimodal peak in the burned area during pre-monsoon which results from fires occurring in the last week of March and the last week of May to the 1st week of June. The length of fire season, defined as decadal daily start-up days to recession of fire time (shown as the normal distribution curve of ), is ~ 10 days shorter in 2011–2019 compared to 2001–2010 although the burned area is concentrated over a shorter time period ().
Figure 4. (a) Kolmogorov–Smirnov or K-S test between 2001–2010 and 2011–2019 daily fire distribution where d and p value denote as max absolute difference of cumulative probability density and significant level, (b) probability density curve of daily fire events distribution, and (c) boxplot between fire occurrences of two time slots. The blue dot in boxplot indicated the mean of the distribution
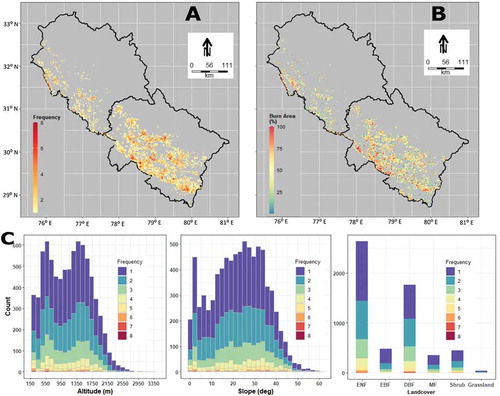
Analysis of the fire frequency between 2001 and 2019 () indicates that fire occurrences in the region are largely sporadic with the highest fire frequency of 8 over a 19-year period. Only 0.1% of burned area detections were detected eight times over the 19-year period and these fires predominantly occur in ENF and DBF. Analysis of the average burned area fraction within 1 km2 area () indicates that 50% of the fire patches having a burned area fraction > 30% (sd = 25%) and these are predominantly found in southern Uttarakhand. There appears to be a little variation in fire frequency with altitude and slope with 70% of the burned area occurring at altitudes between 550 and 1750 m and slopes of 10–40° ().
Figure 5. (a) Spatial fire frequency and (b) average burn area fraction (%) over Himachal Pradesh and Uttarakhand from 2001 to 2019. (c) Altitude, ground slope and land cover (DBF: Deciduous Broadleaf Forest, EBF: Evergreen Broadleaf Forest, ENF: Evergreen Needleleaf Forest, Grass: Grassland, MF: Mixed Forest and Shrub: Shrubland) wise fire frequency distribution
3.2 FRP variation with land cover type and intensity distributions
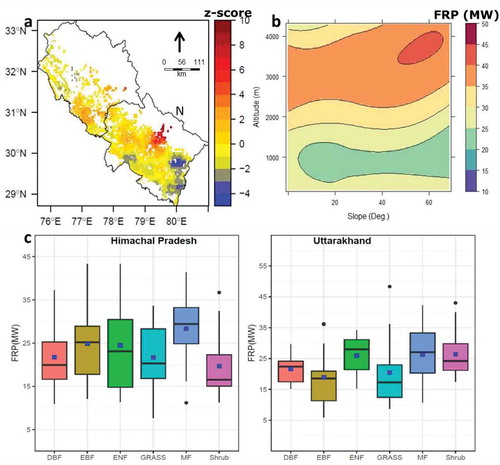
The spatial distribution of the hot and cold clusters derived using the z-score from the Getis-Ords function () applied to the mean pixel FRP indicates that the spatial patterns of the FRP in Himachal Pradesh are more irregular and isolated than that found in Uttarakhand. In the latter, the spatial distribution of FRP displays more spatial clustering and a greater range in FRP magnitude with a number of cold (–2 to – 4) and hot (2–10) clusters. Areas where the z-score centered on zero were related to fewer fires with large uncertainties (p value > 0.6). Histograms of the Gi* or Z score (Supplement 4) for different land cover types indicate that ENF and shrublands have the widest range in z-score and the highest frequency of hot clusters. The altitude and ground slope wise distribution of FRP indicated that fire events were concentrated in ~ 2000–3800 m altitude and 45–65° slope zone had higher energy (). There is a little variation in the average FRP with slope angle (ranges between 10 and 40°) suggesting that most of the forest fires are surface rather than crown fires which are supported by observations from the field assessments (Supplement 7). presents a box plot showing the range in FRP magnitude with land cover type for each state which indicates that fires in Himachal Pradesh typically have a greater range and higher FRP magnitude for most land cover types than Uttarakhand (Supplement 5A and 5B). The FRP magnitude for different land cover types is broadly similar but with mixed forest and ENF have higher FRP.
Figure 6. (a) Hotspot and clodspot spatial analysis over Uttarakhand and Himachal Pradesh by using the mean FRP data over the 16 years (2003–2019), wherein Getis-Ord Gi* statistical function was applied. The Z-score represents the magnitudes of spatial clustering (hot and clodspot) of FRP. The Z-score is statistically significant at p value < 0.1 when Z-score exceeds ± 1. (b) Slope and Altitude wise FRP distribution. (c) Forest type-wise (DBF: Deciduous Broadleaf Forest, EBF: Evergreen Broadleaf Forest, ENF: Evergreen Needleleaf Forest, Grass: Grassland, MF: Mixed Forest and Shrub: Shrubland) FRP variability over Himachal Pradesh and Uttarakhand from 2003 to 2019. The blue dot represents the mean FRP (MW)
3.3 Gridded population density, global human modification (GHM), and spatial coverage of fire
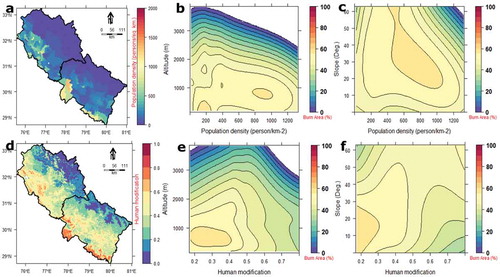
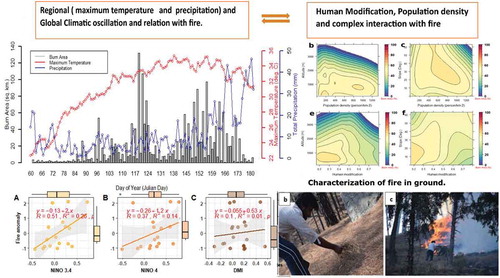
In this section, the spatial association between the human footprint and fire intensity (burn area) was investigated over Himachal Pradesh and Uttarakhand. The demi-decadal mean population density in the region increased from 148 to 173 people per km2 between 2005 and 2015 with the highest population densities found at lower elevations (). According to human modification intensity, increased human activity is found along the southern and central parts of both states () which is also the most fire-prone areas ( - ). The spatial correspondence between the burn area fraction (%) and population density (-c) and human modification intensity (-f) at varying altitudes (m) and slopes (°) is shown as a contour plots. About 40–60% of burn area pixels were associated with moderate population density (200–1000 persons/km2) at lower elevations (< 1000 m) and moderate slopes (10°-50°). The human modification ranged between 0.15 and 0.8 in western Himalaya, but areas of higher burned area fraction corresponded to 0.2–0.5 human modification intensity. The correspondence between mean burn area fraction (%) and human modification and population density is with low coefficients of determination (R2) of 0.12 and 0.13, respectively. Comparatively, the human modification (β coefficient = 39.58%) exhibited a significant (p < 0.01) higher contribution in fire occurrences than population density (β coefficient = 0.089%) (Supplement 6).
Figure 7. (a) Gridded population density (persons per km2) of 2015, (b–c) association of burn area fraction (%) and population density (2015) in varying altitude (m) and slope (°). (d) Human modification (HM) intensity (2016), value of HM ranges from 0 (unmodified) to 1 (maximum modification). (e–f) Association of burn area fraction (%) and intensity of human modification in gradient of altitude and ground slope
3.4 Field-based fire characterization
The mountainous physiography of the Western Himalaya makes it more difficult to control and regulate fire events. The photographs of the field observation were presented in Supplement 7 and the corresponding coordinates and altitude of these sites were tabulated in Supplement 8. The ground observation suggested a good deposition of inflammable dry Chir pine leaves (~ 10–12 inches thickness measured by graduated scale), which helps to ignite (Supplement 7b). Creeping is a mostly dominated type of fire (Supplement 7 c–d) where an ample supply of ground fuel support for spreading of the fire line. To immediately control or put out the fire, the local authority has used the rudimentary method (Supplement 7d). Due to ground or creeping fire, the lower parts of trunks are partially or fully burnt (Supplement 7e–f).
3.5 Climate variability and fire occurrence
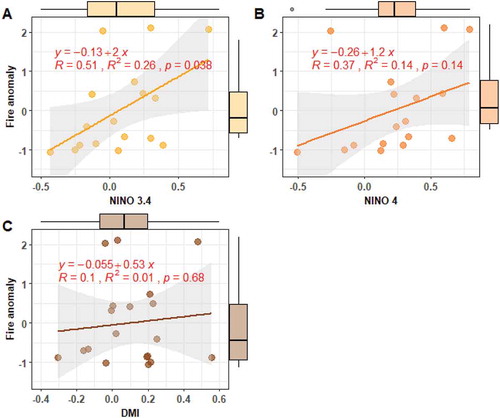
A daily average burn area from March to June (i.e. 60–180 days of the year) computed over the study area and related with the average maximum temperature (°C) and total precipitation (mm) are presented in . The maximum temperature increases from March to June which coincides with periods of time when precipitation is low, during which time most fire activity occurs. A statistical analysis between the pre-monsoonal total burn area (March–June), cumulative precipitation, and average maximum temperature for both regions is shown in . The correlation between the burned area and average maximum temperature (R = 0.57, p = 0.01) and precipitation (R = −0.53, p = 0.2) is moderate. The average maximum temperature is positively related to the burn area whilst the total precipitation is negatively related to the burn area. However, it is evident that there is considerable variability in rainfall and the average maximum temperature with the total burned area (Supplement 9, Supplement 10). The relationship between inter-annual pre-monsoonal burn area standard anomaly (SA), and the global oscillation indices (Niño-3.4, Niño-4, and DMI) was shown in . The association between the burned area and the climate anomalies exhibits a moderate correlation with Niño-3.4 (R = 0.51 and p = 0.03) () whilst the Niño-4 (R = 0.37) and DMI have a weak agreement (R = 0.1) ( and C).
Figure 8. (a) Association among daily mean burn area (km2), maximum temperature (°C) and precipitation (mm). (b) statistical relation of burn area and maximim temperature and precipittaion over Himachal Pradesh and Uttarakhnad
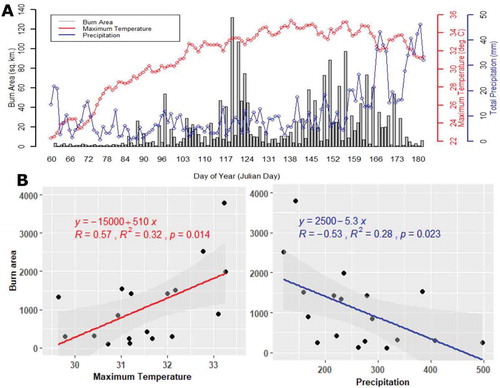
Figure 9. Association and linear relationship between (a) Niño-3.4, (b) Niño-4, and (c) DMI and burned area standard anomaly from 2001 to 2019 in western Himalayan (Uttarakhand and Himachal Pradesh). The boxplot present the axis-wise distribution of fire, Niño-3.4, Niño-4, and DMI anomlay
4. Discussion
The spatial characterization of landscape fire in the Western Himalaya revealed the average pre-monsoonal burned area has increased by 72.94 km2 year-1 with the greatest rate of the increase occurring between 2011 and 2019. The burned area also displayed significant inter-annual variation with peaks in burned area evident in 2005, 2008, 2009, 2012, 2016, and 2018 along with a cohesive agreement with maximum temperature and precipitation (Supplement 9). Other studies have also found an increasing trend in the burned area although in different regions of western Himalaya (Dobriyal and Bijalwan Citation2017; Srivastava and Garg Citation2013). This study found that Uttarakhand accounts for 88% of the fire incidence in the Western Himalaya with most fires occurring in ENF and DBF landcover. The increasing trend in the burned area is also found in the active-fire detections which has been increased by 218 fire counts over the time period. Whilst this is a low number relative to many fire-affected regions, they could pose a threat to the biodiversity of the Western Himalaya (Chitale and Behera Citation2019). Analysis of the temporal distribution of fire occurrence revealed the length of the fire season reduced slightly (almost 10 days) in 2011–2019 compared to 2001–2010 with fire events being more concentrated. The decadal daily fire occurrences depicted a bimodal distribution. The first peak was in late March due to the huge accumulation of fresh litter, and the second peak between late May and 1st week of June due to higher temperature, low humidity, and extreme dryness (Chauhan, Gautam, and Negi Citation2018; Singh et al. Citation2014). The highest concentrations of the burned area were found in the central and southern parts of both states over 550 to 1750 m altitude.
Analysis of MODIS FRP retrievals found similar mean FRP magnitudes and distributions with land cover type. The dominant tree species in ENF is Chir pine (Pinus roxburghii Sarg) whose needles are highly flammable due to their resin which accelerates the ignition and fire intensity. However, the low tree density (Supplementary 7) and lack of ladder fuels to instigate crown fires (Brown, Bhattacharyya, and Shah Citation2011) typically result in low-intensity surface fires. The median FRP (28 MW) in ENF is marginally higher than that found in other land cover types which suggests fire occurrences were surface rather than a crown as the latter typically result in higher FRP magnitudes (Wooster and Zhang Citation2004).
The southern and central (lower elevated) districts of Uttarakhand and Himachal Pradesh have higher population density (200–1800 persons/km2) and increased anthropogenic activities in comparison to the northernmost higher elevated regions (Sati Citation2014), and in these regions, the fire occurrences were greatest. These findings are well corroborated with the earlier findings by Babu, Roy, and Prasad (Citation2016) who concluded that high fire risk was co-located in the elevation ranges from 173 to 2000 m. Most forest fires (around 90%) in this region result from human-made (intentional or accidental) (Chauhan, Gautam, and Negi Citation2018; Dobriyal and Bijalwan Citation2017; Liu, Goodrick, and Heilman Citation2014) but environmental and climatic variables also play a very important role (Srivastava and Garg Citation2013). Here we found moderate to week linkages between regional climatic variables (temperature and precipitation) and the burned area which is in line with the study by Vadrevu et al. (Citation2019) but over the south and south-east Asia. Other studies have also found limited agreement between fire occurrences and regional climate (Srivastava and Garg Citation2013) which may be masked by the other environmental and climatic factors (such as topography, forest type, fuel characteristics, wind, relative humidity, and solar radiation, among others) and strong anthropogenic influence on fire intensity.
Analysis of the relationship between a number of climate indices and burned area revealed some correspondence with warmer (El Niño) and cooler (La Niña) periods with anomalies in fire occurrences in western Himalaya. Peaks in the burned area were found to occur in some of El Niño years (e.g. 2005, 2006, 2016, and 2018) although there is some inconsistency which was also observed by Vadrevu et al. (Citation2019) over the south and southeast Asia. The highest correspondence was found between the Niño-3.4 index whereas the Niño-4 and DMI had a weak correspondence with fire intensity which has been attributed to regional affecting factors (Srivastava and Garg Citation2013). These findings are in line with the literature that the El Niño correlates with forest fires (Fuller and Murphy Citation2006; Skinner et al. Citation2006; Simard and Haines 1985) but in a different region. This tendency seems to be a response to the increase in fires favored by the high temperature, deficit rainfall, and drought, which are also the crucial characteristics of El Niño years (Alencar, Nepstad, and Diaz Citation2006).
This study used burned area and active-fire data to investigate the spatial and temporal dynamics of fire activities and the role of the local meteorology and climate in these dynamics over western Himalaya. The moderate spatial resolution of the fire observation (250 m and 500 m) may omit smaller and less intense fires that are more difficult to detect, particularly when burning under forest canopies (Pereira et al. Citation2004). Future investigations should assess the utility of higher spatial resolution burned area (e.g. from Sentinel-2) and active-fire data (e.g. from Visible Infrared Imaging Radiometer Suite) to monitor landscape fire in the region to determine the level of omission when using moderate resolution data. Higher spatial resolution meteorological data, currently to 1° (temperature) and 0.25° (precipitation), may improve understanding the impact of local meteorology on fire intensity and how this links with anthropogenic activity. The decadal LULC data have limited availability and, to perform a forest type and other landcover classification a good number of ground samples were required that is why the study was only used LULC of 2005 which could reduce the precision of categorical burn area segregation in extreme years.
5. Conclusions
The space-time dynamics of western Himalaya’s forest fire landscape has peculiar characteristics. The present study assesses the spatio-temporal variability of forest, shrubland, and grassland fire in the two most fire-affected states of western Himalaya (Uttarakhand and Himachal Pradesh) over a 19 year period and its relation to regional climatic variability (maximum temperature and precipitation) and global climatic oscillations (Niño-3.4, Niño-4 and DMI). The overall trend in the burned area estimated from the Fire-CCI and MCD64A1 datasets is one of the increasing fire occurrences which presents a risk to the fragile forest environment of the region. Whilst the trend in the burned area is increasing there is considerable variability both inter-annually and within forest type. Analysis of MODIS FRP retrievals indicates little variation in mean FRP with land cover type which may be indicative of the fires being surface rather than crown fires due to the lower tree cover density and lack of ladder fuels. However, the spatial clustering using Getis-Ords found most hotspots are associated with ENF which may result from the prevalence of surface needles in these forests. Most burned area is found at lower elevations on the southern slopes of western Himalaya which falls in an intermediate region with respect to the level of human modification and population density. The regional climatic conditions (maximum temperature and precipitation) were positively and negatively related to the total burned area although further analysis is needed to disentangle the role of climate and anthropogenic factors on fire occurrence and to better understand the impact of fire on this fragile mountainous environment.
Highlights
Forest fire burn area has increased by 72.94 km2 yr−1 over Western Himalaya.
Length of the fire season in 2010–2019 was ~10 days shorten in comparison to 2001–2010.
Temperature has greater control in the fire landscape than precipitation.
Fire occurrences were moderate to weakly in correspondence with regional climatic and human activities.
Creeping was a major fire type to induce tree mortality and forest distraction.
Supplemental Material
Download MS Word (2.7 MB)Acknowledgments
The authors are thankful to the European Space Agency (ESA), Earth Data of NASA for Fire CCI, MCD64A1 fire datasets, and IMD climatic data. First author thanks to UGC for assisting NET-JRF fellowship (3289/(SC NET-JAN 2017) for doctoral research. We are also thankful to Nanital District Forest Officer (DFO) for their eminent help during fieldwork.
CRediT authorship contribution statement: S.B and B.R.P.: Conceptualization, Investigation, Methodology, Software, Analysis, Writing and editing–original draft. A.C.P. and P.A.: Conceptualization, Supervision, Methodology, Software, Writing – review and editing. G.R and J.D.: Conceptualization, Supervision, Data support, Writing – review and editing.
Disclosure statement
The authors declare no potential conflict of interest.
Supplementary material
Supplemental data for this article can be accessedhere.
Additional information
Funding
References
- Alencar, A., D. Nepstad, and M. C. V. Diaz. 2006. “Forest understory fire in the brazilian amazon in ENSO and Non-ENSO years: Area burned and committed Carbon Emissions.” Earth Interactions 10 (6): 1–17. doi:10.1175/EI150.1.
- Ashok, K., Z. Guan, and T. Yamagata. 2001. “Impact of the indian ocean dipole on the relationship between the indian monsoon rainfall and ENSO.” Geophysical Research Letters 28 (23): 4499–4502. doi:10.1029/2001GL013294.
- Babu, K. V. S., A. Roy, and P. R. Prasad. 2016. “Forest fire risk modeling in Uttarakhand Himalaya Using TERRA satellite datasets.” European Journal of Remote Sensing 49 (1): 381–395. doi:10.5721/EuJRS20164921.
- Bar, S., B. R. Parida, and A. C. Pandey. 2020. “Landsat-8 and Sentinel-2 Based Forest Fire Burn Area Mapping Using Machine Learning Algorithms on GEE Cloud Platform over Uttarakhand, Western Himalaya.” Remote Sensing Applications: Society and Environment 18: May Elsevier B.V.: 100324 doi:10.1016/j.rsase.2020.100324.
- Brown, P. M., A. Bhattacharyya, and S. K. Shah. 2011. “Potential for developing fire histories in chir pine (pinus roxburghii) forests in the Himalayan Foothills.” Tree-Ring Research 67 (1): 57–62. doi:10.3959/2009-15.1.
- Chandra, K. K., and A. K. Bhardwaj. 2015. “Incidence of forest fire in india and its effect on terrestrial ecosystem dynamics, nutrient and microbial status of soil.” International Journal of Agriculture and Forestry 5 (2): 69–78. doi:10.5923/j.ijaf.20150502.01.
- Chauhan, J. S., A. S. Gautam, and R. S. Negi. 2018. “natural and anthropogenic impacts on forest structure: a case study of Uttarakhand state.” The Open Ecology Journal 11 (1): 38–46. doi:10.2174/1874213001811010038.
- Chitale, V., and M. D. Behera. 2019. “How will forest fires impact the distribution of endemic plants in the himalayan biodiversity hotspot?” Biodiversity and Conservation 28 (8–9): 2259–2273. doi:10.1007/s10531-019-01733-8.
- Chuvieco, E. 2009. Earth Observation of Wildland Fires in Mediterranean Ecosystems. Berlin: Springer Berlin Heidelberg. doi:10.1007/978-3-642-01754-4.
- Chuvieco, E., J. Lizundia-Loiola, M. L. Pettinari, R. Ramo, K. Tansey, K. Tansey, F. Mouillot, et al. 2016. “A new global burned area product for climate assessment of fire impacts.” Global Ecology and Biogeography 25 (5): 619–629. doi:10.1111/geb.12440.
- Chuvieco, E., J. Lizundia-Loiola, M. L. Pettinari, R. Ramo, M. Padilla, K. Tansey, F. Mouillot, et al. 2018. “Generation and analysis of a new global burned area product based on MODIS 250 M reflectance bands and thermal anomalies.” Earth System Science Data 10 (4): 2015–2031. doi:10.5194/essd-10-2015-2018.
- Council, N. R. 2010. Advancing the Science of Climate Change. Washington, D.C: National Academies Press. doi:10.17226/12782.
- Crippa, P., S. Castruccio, S. Archer-Nicholls, G. B. Lebron, M. Kuwata, A. Thota, S. Sumin, E. Butt, C. Wiedinmyer, and D. V. Spracklen. 2016. “Population exposure to hazardous air quality due to the 2015 fires in equatorial asia.” Scientific Reports 6 (1): 1–9. doi:10.1038/srep37074.
- Crutzen, P. J., L. E. Heidt, J. P. Krasnec, W. H. Pollock, and W. Seiler. 1979. “Biomass burning as a source of atmospheric gases CO, H2, N 2O, NO, CH3Cl and COS.” Nature 282 (5736): 253–256. doi:10.1038/282253a0.
- Dobriyal, M. J. R., and A. Bijalwan. 2017. “Forest fire in western himalayas of India: a review.” New York Science Journal 10: 6. doi:10.7537/marsnys100617.06.
- Doerr, S. H., and C. Santín. 2016. “Global trends in wildfire and its impacts: perceptions versus realities in a changing world.” Philosophical Transactions of the Royal Society B: Biological Sciences 371 (1696): 20150345. doi:10.1098/rstb.2015.0345.
- Dwyer, E., J. M. Gregoire, and J. P. Malingreau. 1998. “A global analysis of vegetation fires using satellite images: spatial and temporal dynamics.” Ambio 27: 175–181.
- Fernandes, P. M., F. C. Rego, and E. Rigolot. 2011. “The FIRE PARADOX project: towards science-based FIRE management in Europe.” Forest Ecology and Management 261 (12): 2177–2178. doi:10.1016/j.foreco.2010.12.024.
- Flannigan, M. D., B. D. Amiro, K. A. Logan, B. J. Stocks, and B. M. Wotton. 2006. “Forest fires and climate change in the 21ST Century.” In Mitigation and Adaptation Strategies for Global Change 11 (4): 847–859. doi:10.1007/s11027-005-9020-7.
- Flannigan, M. D., M. A. Krawchuk, W. J. De Groot, B. M. Wotton, and L. M. Gowman. 2009. “Implications of changing climate for global wildland fire.” International Journal of Wildland Fire 18 (5): 483–507. doi:10.1071/WF08187.
- Freeborn, P. H., M. J. Wooster, W. M. Hao, C. A. Ryan, B. L. Nordgren, S. P. Baker, and C. Ichoku. 2008. “Relationships between energy release, fuel mass loss, and trace gas an aerosol emissions during laboratory biomass fires.” Journal of Geophysical Research Atmospheres 113 (1): 1–17. doi:10.1029/2007JD008679.
- Fuller, D. O., and K. Murphy. 2006. “The Enso-Fire dynamic in insular southeast Asia.” Climatic Change 74 (4): 435–455. doi:10.1007/s10584-006-0432-5.
- García, M., S. Saatchi, A. Casas, A. Koltunov, S. L. Ustin, C. Ramirez, and H. Balzter. 2017. “Extrapolating forest canopy fuel properties in the california rim fire by combining Airborne LiDAR and landsat OLI Data.” Remote Sensing 9 (4): 394. doi:10.3390/rs9040394.
- Getis, A., and J. K. Ord. 2010. “The Analysis of Spatial Association by Use of Distance Statistics.” In Advances in Spatial Science. doi:10.1007/978-3-642-01976-0_10.
- Giglio, L., J. T. Randerson, G. R. Van Der Werf, P. S. Kasibhatla, G. J. Collatz, D. C. Morton, and R. S. Defries. 2010. “Assessing Variability and Long-Term trends in burned area by merging multiple satellite fire products.” Biogeosciences 7 (3): 1171–1186. doi:10.5194/bg-7-1171-2010.
- Giglio, L., L. Boschetti, D. P. Roy, M. L. Humber, and C. O. Justice. 2018. “The collection 6 MODIS burned area mapping algorithm and product.” Remote Sensing of Environment 217: 72–85. doi:10.1016/j.rse.2018.08.005. November.
- Giglio, L., W. Schroeder, and C. O. Justice. 2016. “The Collection 6 MODIS Active Fire Detection Algorithm and Fire Products.” Remote Sensing of Environment 178: 31–41. June. The Authors. doi:10.1016/j.rse.2016.02.054.
- Gupta, S., A. Roy, D. Bhavsar, R. Kala, S. Singh, and A. S. Kumar. 2018. “Forest fire burnt area assessment in the biodiversity rich regions using geospatial technology: Uttarakhand Forest Fire Event 2016.” Journal of the Indian Society of Remote Sensing 46 (6): 945–955. Springer India. doi10.1007/s12524-018-0757-3.
- Haas, J. R., D. E. Calkin, and M. P. Thompson. 2013. “A national approach for integrating wildfire simulation modeling into wildland urban interface risk assessments within the United States.” Landscape and Urban Planning 119: 44–53. doi:10.1016/j.landurbplan.2013.06.011.
- IMD (2005) http://apdrc.soest.hawaii.edu/doc/india_rain_ref_report.pdf ( Accessed 18 November 2020).
- ISFR. 2017. “India State of Forest Report (ISFR) 2017 by Forest Survey of India. Ministry of Environment and Forests & Climate Change, Government of India.” New Delhi. Available online: https://fsi.nic.in/isfr2017/isfr-forest-fire-2017.pdf ( accessed on 9 July 2020).
- Joseph, S., K. Anitha, and M. S. R. Murthy. 2009. “Forest Fire in India: A Review of the Knowledge Base.” Journal of Forest Research 14 (3): 127–134. doi:10.1007/s10310-009-0116-x.
- Kennedy, C. M., J. R. Oakleaf, D. M. Theobald, S. Baruch-Mordo, and J. Kiesecker. 2019. “Managing the Middle: A Shift in Conservation Priorities Based on the Global Human Modification Gradient.” Global Change Biology 25 (3): 811–826. doi:10.1111/gcb.14549.
- Keywood, M., M. Kanakidou, A. Stohl, F. Dentener, G. Grassi, C. P. Meyer, K. Torseth, et al. 2013. “Fire in the Air: Biomass Burning Impacts in a Changing Climate.” Critical Reviews in Environmental Science and Technology 43 (1): 40–83. doi:10.1080/10643389.2011.604248.
- Knicker, H. 2007. “How Does Fire Affect the Nature and Stability of Soil Organic Nitrogen and Carbon? A Review.” Biogeochemistry 85 (1): 91–118. doi:10.1007/s10533-007-9104-4.
- Kumar, V., Shanu, and Jahangeer. 2017. “Statistical Distribution of Rainfall in Uttarakhand, India.” Applied Water Science 7 (8): 4765–4776. doi:10.1007/s13201-017-0586-5.
- Liu, Y., S. Goodrick, and W. Heilman. 2014. “Wildland Fire Emissions, Carbon, and Climate: Wildfire–Climate Interactions.” Forest Ecology and Management 317 (April): 80–96. Elsevier B.V. doi10.1016/j.foreco.2013.02.020.
- Mandel, J., S. Amram, J. D. Beezley, G. Kelman, A. K. Kochanski, V. Y. Kondratenko, B. H. Lynn, B. Regev, and M. Vejmelka. 2014. “Recent Advances and Applications of WRF-SFIRE.” Natural Hazards and Earth System Sciences 14 (10): 2829–2845. doi:10.5194/nhess-14-2829-2014.
- Marlon, J. R., P. J. Bartlein, C. Carcaillet, D. G. Gavin, S. P. Harrison, P. E. Higuera, F. Joos, M. J. Power, and I. C. Prentice. 2008. “Climate and Human Influences on Global Biomass Burning over the past Two Millennia.” Nature Geoscience 1 (10): 697–702. doi:10.1038/ngeo313.
- Marsaglia, G., W. W. Tsang, and J. Wang. 2003. “Evaluating Kolmogorov’s Distribution.” Journal of Statistical Software 8 (18): 251–259. doi:10.18637/jss.v008.i18.
- Mason, S. A., P. E. Hamlington, B. D. Hamlington, W. M. Jolly, and C. M. Hoffman. 2017. “Effects of Climate Oscillations on Wildland Fire Potential in the Continental United States.” Geophysical Research Letters 44 (13): 7002–7010. doi:10.1002/2017GL074111.
- Matin, M. A., V. S. Chitale, M. S. R. Murthy, K. Uddin, B. Bajracharya, and S. Pradhan. 2017. “Understanding Forest Fire Patterns and Risk in Nepal Using Remote Sensing, Geographic Information System and Historical Fire Data.” International Journal of Wildland Fire 26 (4): 276. doi:10.1071/WF16056.
- Maurin, O., T. J. Davies, J. E. Burrows, B. H. Daru, K. Yessoufou, A. M. Muasya, M. van der Bank, and W. J. Bond. 2014. “Savanna Fire and the Origins of the ‘Underground Forests’ of Africa.” New Phytologist 204 (1): 201–214. doi:10.1111/nph.12936.
- Meng, R., J. Wu, K. L. Schwager, F. Zhao, P. E. Dennison, B. D. Cook, K. Brewster, T. M. Green, and S. P. Serbin. 2017. “Using High Spatial Resolution Satellite Imagery to Map Forest Burn Severity across Spatial Scales in a Pine Barrens Ecosystem.” Remote Sensing of Environment 191: 95–109. doi:10.1016/j.rse.2017.01.016.
- Mohd, W., John, V. K. Sarda, and S. K. Jain. 2017. “Assessment of Trends and Variability of Rainfall and Temperature for the District of Mandi in Himachal Pradesh, India.” Slovak Journal of Civil Engineering. doi:10.1515/sjce-2017-0014.
- Moritz, M. A., A. Parisien, E. Batllori, M. A. Krawchuk, J. V. Dorn, D. J. Ganz, and K. Hayhoe. 2012. “Climate Change and Disruptions to Global Fire Activity.” Ecosphere 3 (6): art49. art49. doi10.1890/ES11-00345.1.
- Morton, G. D. 2019. “The Power of Lump Sums: Using Maternity Payment Schedules to Reduce the Gender Asset Gap in Households Reached by Brazil’s Bolsa Família Conditional Cash Transfer.” World Development 113 (1): 352–367. doi:10.1016/j.worlddev.2018.08.012.
- Nahler, H. 2009. “Pearson Correlation Coefficient.” In Dictionary of Pharmaceutical Medicine, 132. Vienna: Springer Vienna. doi:10.1007/978-3-211-89836-9_1025.
- Negi, M. S., and A. Kumar. 2016. “Assessment of Increasing Threat of Forest Fires in Uttarakhand, Using Remote Sensing and Gis Techniques.” Global Journal of Advanced Research 3 (6): 457–468.
- Önöz, B., and M. Bayazit. 2003. “The Power of Statistical Tests for Trend Detection.” Turkish Journal of Engineering and Environmental Sciences. doi:10.3906/sag-1205-120.
- Pai, D. S., L. Sridhar, M. R. Badwaik, and M. Rajeevan. 2014. “Analysis of the Daily Rainfall Events over India Using a New Long Period (1901–2010) High Resolution (0.25° × 0.25°) Gridded Rainfall Data Set.” Climate Dynamics 45 (3–4): 755–776. doi:10.1007/s00382-014-2307-1.
- Parida, B. R., A. C. Pandey, and N. R. Patel. 2020. “Greening and Browning Trends of Vegetation in India and Their Responses to Climatic and Non-Climatic Drivers.” Climate 8 (8): 92. doi:10.3390/cli8080092.
- Parks, A. M., C. A. Kolden, A. M. S. Smith, L. Boschetti, D. M. Johnson, and M. A. Cochrane. 2018. “Fire Intensity Impacts on Post-Fire Temperate Coniferous Forest Net Primary Productivity.” Biogeosciences. doi:10.5194/bg-15-1173-2018.
- Pereira, J. M., B. Mota, J. L. Privette, K. K. Caylor, J. M. Silva, A. C. Sá, and W. Ni-Meister. 2004. “A Simulation Analysis of the Detectability of Understory Burns in Miombo Woodlands.” Remote Sensing of Environment 93 (3): 296–310. doi:10.1016/j.rse.2004.01.009.
- Plummer, S., P. Lecomte, and M. Doherty. 2017. “The ESA Climate Change Initiative (CCI): A European Contribution to the Generation of the Global Climate Observing System.” Remote Sensing of Environment 203: 2–8. doi:10.1016/j.rse.2017.07.014. December.
- Prabhakar, R., E. Somanathan, and B. S. Mehta. 2006. “How Degraded Are Himalayan Forests?” Current Science 91 (1): 61–67.
- Puri, K., G. Areendran, K. Raj, S. Mazumdar, and P. K. Joshi. 2011. “Forest Fire Risk Assessment in Parts of Northeast India Using Geospatial Tools.” Journal of Forestry Research 22 (4): 641–647. doi:10.1007/s11676-011-0206-4.
- Ramanathan, V., C. Chung, D. Kim, T. Bettge, L. Buja, J. T. Kiehl, W. M. Washington, Q. Fu, D. R. Sikka, and M. Wild. 2005. “Atmospheric Brown Clouds: Impacts on South Asian Climate and Hydrological Cycle.” Proceedings of the National Academy of Sciences 102 (15): 5326–5333. doi:10.1073/pnas.0500656102.
- Randerson, J. T., H. Liu, M. G. Flanner, S. D. Chambers, Y. Jin, P. G. Hess, G. Pfister, et al. 2006. “The Impact of Boreal Forest Fire on Climate Warming.” Science 314 (5802): 1130–1132. doi:10.1126/science.1132075.
- R Core Team. 2020. “R: A Language and Environment for Statistical Computing.” Vienna: Austria: R Foundation for Statistical Computing. Retrieved from https://www.R-project.org/
- Reddy, C. S., C. S. Jha, P. G. Diwakar, and V. K. Dadhwal. 2015. “Nationwide Classification of Forest Types of India Using Remote Sensing and GIS.” Environmental Monitoring and Assessment 187 (12): 777. doi:10.1007/s10661-015-4990-8.
- Roberts, S. J. 2001. “Tropical Fire Ecology.” Progress in Physical Geography 25 (2): 286–291. doi:10.1191/030913301673370581.
- Rogers, B. M., J. K. Balch, S. J. Goetz, C. E. R. Lehmann, and M. Turetsky. 2020. “Focus on Changing Fire Regimes: Interactions with Climate, Ecosystems, and Society.” Environmental Research Letters 15 (3): 030201. doi:10.1088/1748-9326/ab6d3a.
- Rothermel, R. C. 1983. “How to Predict the Spread and Intensity of Forest and Range Fires.” US Department of Agriculture, Forest Service, General Technical Report. doi:10.2737/INT-GTR-143.
- Roy, D. P. 1999. “Multi-Temporal Active-Fire Based Burn Scar Detection Algorithm.” International Journal of Remote Sensing 20 (5): 1031–1038. doi:10.1080/014311699213073.
- Roy, P., A. Roy, P. Joshi, M. Kale, V. Srivastava, S. Srivastava, R. Dwevidi, et al. 2015. “Development of Decadal (1985-1995-2005) Land Use and Land Cover Database for India.” Remote Sensing 7 (3): 2401–2430. doi:10.3390/rs70302401.
- Roy, P. S. 2005. “Forest Fire and Degradation Assessment Using Satellite Remote Sensing and Geographic Information System.” In Satellite Remote Sensing and GIS Applications in Agricultural Meteorology, 361–400. Switzerland: WMO Geneva.
- Sahu, L. K., V. Sheel, K. Pandey, R. Yadav, P. Saxena, and S. Gunthe. 2015. “Regional Biomass Burning Trends in India: Analysis of Satellite Fire Data.” Journal of Earth System Science 124 (7): 1377–1387. doi:10.1007/s12040-015-0616-3.
- Saji, N. H., B. N. Goswami, P. N. Vinayachandran, and T. Yamagata. 1999. “A Dipole Mode in the Tropical Indian Ocean.” Nature 401 (6751): 360–363. doi:10.1038/43854.
- Sannigrahi, S., F. Pilla, B. Basu, A. S. Basu, K. Sarkar, S. Chakraborti, P. K. Joshi, et al. 2020. “Examining the Effects of Forest Fire on Terrestrial Carbon Emission and Ecosystem Production in India Using Remote Sensing Approaches.” Science of the Total Environment 725 (July): 138331. doi:10.1016/j.scitotenv.2020.138331.
- Sati, V. P. 2014. “Population and Sustainability Issues in Mountains: A Case for the Uttaranchal Himalaya.” Himalayan Ecology 14: 30–36.
- Sen, P. K. 1968. “Estimates of the Regression Coefficient Based on Kendall’s Tau.” Journal of the American Statistical Association 63 (324): 1379–1389. doi:10.1080/01621459.1968.10480934. December., 1968.
- Shepard, D. 1968. “A Two-Dimensional Interpolation Function for Irregularly-Spaced Data.” Proceedings of the 1968 23rd ACM National Conference. ACM 1968. doi:10.1145/800186.810616.
- Simard, A. J., D. A. Haines, and W. A. Main. 1985. “Relations between El Nino/Southern Oscillation Anomalies and Wildland Fire Activity in the United States.” Agricultural and Forest Meteorology 36 (2): 93–104. doi:10.1016/0168-1923(85)90001-2.
- Singh, N., and B. R. Parida. 2019. “Environmental Factors Associated with Seasonal Variations of Night-Time Plant Canopy and Soil Respiration Fluxes in Deciduous Conifer Forest, Western Himalaya, India.” Trees - Structure and Function 33 (2): 599–613. doi:10.1007/s00468-018-1804-y.
- Singh, N., B. R. Parida, J. S. Charakborty, and N. R. Patel. 2019. “Net Ecosystem Exchange of CO2 in Deciduous Pine Forest of Lower Western Himalaya, India.” Resources 8 (2): 1–20. doi:10.3390/resources8020098.
- Singh, N., N. R. Patel, B. K. Bhattacharya, P. Soni, B. R. Parida, and J. S. Parihar. 2014. “Analyzing the Dynamics and Inter-linkages of Carbon and Water Fluxes in Subtropical Pine (Pinus Roxburghii) Ecosystem.” Agricultural and Forest Meteorology 197: 206–218. doi:10.1016/j.agrformet.2014.07.004.
- Singh, R. B., and S. Mal. 2014. “Trends and Variability of Monsoon and Other Rainfall Seasons in Western Himalaya, India.” Atmospheric Science Letters 15 (3): 218–226. doi:10.1002/asl2.494.
- Skinner, W. R., A. Shabbar, M. D. Flannigan, and K. Logan. 2006. “Large Forest Fires in Canada and the Relationship to Global Sea Surface Temperatures.” Journal of Geophysical Research 111 (D14): D14106. doi:10.1029/2005JD006738.
- Smith, A. M. S., and M. J. Wooster. 2005. “Remote Classification of Head and Backfire Types from MODIS Fire Radiative Power and Smoke Plume Observations.” International Journal of Wildland Fire 14 (3): 249. doi:10.1071/WF05012.
- Srivastava, P., and A. Garg. 2013. “Forest Fires In India : Regional And Temporal Analyses.” Journal of Tropical Forest Science 25 (2): 151–156. 25:228–239. JSTOR. https://www.jstor.org/stable/23617038
- Stott, P. A., J. G. Goldammer, and W. L. Werner. 1990. “The Role of Fire in the Tropical Lowland Deciduous Forests of Asia.” In Fire in the Tropical Biota, edited by Goldammer Johann Georg, 84: 32–44. Berlin, Heidelberg: Springer Berlin Heidelberg. doi:10.1007/978-3-642-75395-4_3.
- Stroppiana, D., S. Pinnock, J. M. C. Pereira, and J. M. Grégoire. 2002. “Radiometric Analysis of SPOT-VEGETATION Images for Burnt Area Detection in Northern Australia.” Remote Sensing of Environment 82 (1): 21–37. doi:10.1016/S0034-4257(02)00021-4.
- Sudhakar, R. C., N. G. Bird, S. Sreelakshmi, T. M. Manikandan, M. Asra, P. H. Krishna, C. S. Jha, P. V. N. Rao, and P. G. Diwakar. 2019. “Identification and Characterization of Spatio-Temporal Hotspots of Forest Fires in South Asia.” Environmental Monitoring and Assessment. doi:10.1007/s10661-019-7695-6.
- Szpakowski, D. M., and J. L. R. Jensen. 2019. “A Review of the Applications of Remote Sensing in Fire Ecology.” Remote Sensing 11 (22): 2638. doi:10.3390/rs11222638.
- Takaku, J., N. Futamura, T. Iijima, T. Tadono, and M. Shimada. 2007. “High Resolution DSM Generation from ALOS PRISM.” In International Geoscience and Remote Sensing Symposium (IGARSS). doi:10.1109/IGARSS.2007.4423215.
- Trenberth, K. 2020. “The Climate Data Guide: Nino SST Indices (Nino 1+2, 3, 3.4, 4; ONI and TNI).” Retrieved from https://climatedataguide.ucar.edu/climate-data/nino-sst-indices-nino-12-3-34-4-oni-and-tni ( accessed on 21 January 2020).
- Trenberth, K. E., and D. P. Stepaniak. 2001. “Indices of El Niño Evolution.” Journal of Climate 14 (8): 1697–1701. doi:10.1175/1520-0442(2001)014<697:lioeno>2.0.CO;2.
- Urbanski, S., B. Nordgren, C. Albury, B. Schwert, D. Peterson, B. Quayle, and W. M. Hao. 2018. “A VIIRS Direct Broadcast Algorithm for Rapid Response Mapping of Wildfire Burned Area in the Western United States.” Remote Sensing of Environment 219: 271–283. doi:10.1016/j.rse.2018.10.007. December.
- Vadrevu, K. P., I. Csiszar, E. Ellicott, L. Giglio, K. V. S. Badarinath, E. Vermote, and C. Justice. 2013. “Hotspot Analysis of Vegetation Fires and Intensity in the Indian Region.” IEEE Journal of Selected Topics in Applied Earth Observations and Remote Sensing 6 (1): 224–238. doi:10.1109/JSTARS.2012.2210699.
- Vadrevu, K. P., K. Lasko, L. Giglio, W. Schroeder, S. Biswas, and C. Justice. 2019. “Trends in Vegetation Fires in South and Southeast Asian Countries.” Scientific Reports 9 (1): 1–13. doi:10.1038/s41598-019-43940-x.
- Whitlock, C., P. E. Higuera, D. B. McWethy, and C. E. Briles. 2010. “Paleoecological Perspectives on Fire Ecology: Revisiting the Fire-Regime Concept.” The Open Ecology Journal 3 (2): 6–23. doi:10.2174/1874213001003020006.
- Wooster, M. J., G. Roberts, G. L. W. Perry, and Y. J. Kaufman. 2005. “Retrieval of Biomass Combustion Rates and Totals from Fire Radiative Power Observations: FRP Derivation and Calibration Relationships between Biomass Consumption and Fire Radiative Energy Release.” Journal of Geophysical Research Atmospheres 110 (D24). doi:10.1029/2005JD006318.
- Wooster, M. J., and Y. H. Zhang. 2004. “Boreal Forest Fires Burn Less Intensely in Russia than in North America.” Geophysical Research Letters 31 (20). doi:10.1029/2004GL020805.
- Yue, S., P. Pilon, B. Phinney, and G. Cavadias. 2002. “The Influence of Autocorrelation on the Ability to Detect Trend in Hydrological Series.” Hydrological Processes 16 (9): 1807–1829. doi:10.1002/hyp.1095.