
 ?Mathematical formulae have been encoded as MathML and are displayed in this HTML version using MathJax in order to improve their display. Uncheck the box to turn MathJax off. This feature requires Javascript. Click on a formula to zoom.
ABSTRACT
Surface urban heat island (SUHI) is a major anthropogenic alteration of Earth’s surface and can influence the local thermal environment by altering the surface energy flux balances. Researchers have paid much attention to SUHI studies in the last decades; still, its geospatial variability over a larger area is poorly understood. Detailed research is required to understand the mechanism and dynamics of SUHI along with its different driving variables. Hence in this study, we quantified the diurnal, seasonal, and interannual variation of SUHI intensity (SUHII) over 150 major Indian cities situated over different climatic zones using MODIS data from 2003 to 2018. The results reveal urban cool islands occurrence over the hot desert, hot steppe, and tropical monsoon climatic zone during daytime in both summer (−0.25 to −0.17°C) and winter (−0.33 to 0.17°C) season. In contrast, nighttime SUHII shows clear evidence of positive urban heat island irrespective of climatic region and seasonal variation of 0.48–1°C in summer and 0.46–1.32°C in winter is seen. The Mann–Kendall and Sen’s slope estimator tests are used to detect the trend of the SUHII during the study period, which suggests a higher percentage of cities showing an increasing trend of SUHII for urban heat islands than the cities of the urban cool island. Pearson’s correlation and stepwise multiple linear regression model determine the possible SUHII controlling variable over different climatic zones. During the daytime, the SUHII’s distribution is controlled by vegetation, evapotranspiration, and thermal inertia in the summer/winter season. Whereas, it is linked tightly to built-up intensity, white sky albedo, and thermal inertia in both seasons during nighttime. Overall, we found that the stepwise multiple linear regression model can explain the SUHII variance more in the daytime (>0.8) than in nighttime (>0.7, except for tropical cities) and more in understanding the SUHII behaviors for cool cities as compared to hot cities. Moreover, this study also quantifies the significant control of thermal inertia and soil moisture in understating urban heat and cool island behavior over different climatic zones.
1. Introduction
The world has experienced rapid urbanization and excessive population growth, which causes several environmental issues (Y. Zhou et al. Citation2015; Zhou et al. Citation2018). The world's urban population had been increased drastically from 30% in 1950 to 55% in 2018, and it is expected that with the present growth rate, the world’s urban population will reach up to 68% in 2050 (United Nation, Citation2018). India, China, and Nigeria, just three countries together, will have to be accounted for more than 35% of urbanites in between 2018 and 2050 (United Nations, Citation2018). In India, there is around 32% of total population lives in dense metropolitan areas, which is projected to be increased by manifold at the end of 2050. Thus it becomes essential to study the different environmental problems accross urban and their surrounding rural area of Indian cities and their possible driving mechanism. One of such environmental issue is urban heat island (UHI) phenamenon, where by an urban area behaves as an anomalous island of rising temperature with respect to their surrounding rural area. Generally, UHI has two types: air UHI, measured by automatic weather station data, and surface UHI (SUHI), measured by remote sensing sensors and aircraft. The boundary of SUHI is defined by a sharp decrease in the land surface temperature (LST) along the urban-rural gradient. The concept of SUHI can be well understood by studying the thermal characteristics of the urban environment (Oke Citation1987; Balew and Korme Citation2020; Chen and Zhang Citation2017; Simwanda et al. Citation2019; Guha et al. Citation2018; Ranagalage et al. Citation2018; Estoque, Murayama, and Myint Citation2017; Dissanayake et al. Citation2016, Citation2019). Surface modification due to urbanization leads to increases in the urban surface’s imperviousness, making the urban surface warmer as compared to surrounding non-urbanized areas (Oke Citation1976; Chen and Zhang Citation2017; Balew and Korme Citation2020). UHI is observed worldwide in many cities (Hung et al. Citation2006; Peng et al. Citation2012; Zhou et al. Citation2014, Citation2018). Dissanayake et al. (Citation2016) study the impact of land use land cover (LULC) change on LST over Addis Ababa, Ethiopia, and suggest that the city has undergone rapid urbanization which increases mean LST and boosting UHI effect. The analysis of LULC and LST using Landsat data reveal a higher LST over paved surfaces and agricultural land as compared to lower LST of the water body and vegetation in Bahir Dar city (Balew and Korme Citation2020). These results were also supported by a recent study on LST and LULC, including Kandy city of Sri Lanka (Dissanayake et al. Citation2019), Harare city of Zimbabwe (Kowe et al. Citation2021), Florence and Naples city of Italy (Guha et al. Citation2018), Babol city of Iran (Weng et al. Citation2019), Pune city of India (Gohain, Mohammad, and Goswami Citation2021), Sioux Falls metropolitan area of United States (Xian et al. Citation2021), and many others. The effect of local climate zones is significant in investigating the SUHI phenomenon (Zhao et al. Citation2020). This rising SUHI has an adverse effect on the surface radiation budget (Kuang et al. Citation2019), and increases the energy consumption (Lowe Citation2016; X. Zhao, Li, and Ma Citation2012), which causes an increase in anthropogenic heat emission (Debbage and Shepherd Citation2015) and thus effective ecological balance (Rizwan, Dennis, and Chunho Citation2008; Balew and Korme Citation2020; Dissanayake et al. Citation2016). This adverse effect of UHI on climate imposes new challenges for sustainable urban planning (Dissanayake et al. Citation2016; Balew and Korme Citation2020; Simwanda et al. Citation2019; Mohammad and Goswami Citation2021b), which would of great interest to policymakers, urban planners, and researchers (Debbage and Shepherd Citation2015; Huang, Wang, and Budd Citation2009; Zhou et al. Citation2014). Therefore, it becomes crucial to study UHI and its impact on different climatic conditions.
The regional-level study of SUHIs can be broadly categorized into two groups. The first group discusses the spatial and temporal variation of SUHI and explores the different indicators or drivers responsible for such SUHI variation. The drivers include various biophysical indicators, e.g. normalized difference vegetation index (NDVI), enhanced vegetation index (EVI) (Imhoff et al. Citation2010; Susca, Gaffin, and Dell’Osso Citation2011; Weng, Lu, and Schubring Citation2004; Zhou et al. Citation2016; Shastri et al. Citation2017; Kumar et al. Citation2017); surface properties, e.g. white sky albedo (WSA) (Peng et al. Citation2012; Cao et al. Citation2016), impervious surface area (ISA) (Zhang et al. Citation2010); evapotranspiration (ET) (Shastri et al. Citation2017); air temperature and precipitation (L. Zhao et al. Citation2014; Zhou et al. Citation2014; Y. Li et al. Citation2019); various descriptive indicators of cities, e.g. city size (Huang, Wang, and Budd Citation2009; Y. Li et al. Citation2019; Zhou et al. Citation2018); and different LULC metrics (Yang, Huang, and Li Citation2017). Numerous studies have signified the importance of LULC in SUHI intensification (Connors, Galletti, and Chow Citation2013; Weng, Lu, and Schubring Citation2004; Zhou, Huang, and Cadenasso Citation2011). For example, densely built-up areas and impervious surfaces have a higher LST (Balew and Korme Citation2020; Chen and Zhang Citation2017; Dissanayake et al. Citation2016, Citation2019; Estoque, Murayama, and Myint Citation2017; Guha et al. Citation2018; Ranagalage et al. Citation2018). Simultaneously, the vegetation and water bodies provide the cooling effect and lower the LST (Sanga-Ngoie, Iizuka, and Kobayashi Citation2012). In the second group, the assessment of SUHI in cities is studied according to different climatic zone, demarcating the importance of climate present over a city on their SUHI effect (Mohammad, Pir; Goswami Citation2020; Gallo et al. Citation1993; Hung et al. Citation2006; Li et al. Citation2004; H. Li et al. Citation2019; Peng et al. Citation2012; Chakraborty and Lee Citation2019).
However, little attention has been paid to SUHI studies considering the different drivers and the climatic zone together. To our knowledge, only a few studies have been reported worldwide, considering both drivers and climatic zone together. The detailed description of these studies has been reported in , demarcating data used and period considered, drivers and technique and the study’s main findings. In the Indian context, only two significant studies have been reported on a regional SUHI study. One is Shastri et al.’s Citation2017 study, where he presents day/night and summer/winter SUHI variation regarding NDVI and ET as the main drivers. The second is Kumar et al. (Citation2017) study, where he signifies the importance of agriculture and irrigation in SUHI intensification as per climatic zone. He also considered aerosol as one of the SUHI driving parameters. Still, the detailed discussion in terms of the climatic zone and SUHI drivers are missing. Both these studies have a different observed magnitude of SUHI due to different criteria for assessing rural boundary in SUHI calculation. Many more parameters are essential while discussing SUHI variation over the different climatic zone, which has not been included in these studies.
Table 1. List of studies discussing SUHI across different climatic zone considering different potential drivers
This research is a comprehensive study of SUHI study over Indian cities considering the concept of the climatic zone and maximum possible drivers of SUHI, which has been studied worldwide, but not in India. These cities were selected based on the aerial extent, population, and geographical location situated over seven different climatic zones. A long-time duration from 2003 to 2018 (16 years) is considered in this research. The discussion on SUHI diurnal, seasonal, and temporal variation is presented in this study. We have examined the relationship between the SUHI and its associated influencing factors as per the climatic zone and tried to explain the significant factors responsible for SUHI variation over a particular climatic zone. The different factors or drivers considered are built-up area, EVI, ET, WSA, thermal inertia (TI), nighttime lights, soil moisture (SM). The research output of the present study will give an understating of the SUHI behaviors (both diurnal and seasonal) and the process and mechanism responsible for causing such SUHI variability. This kind of information is essential for city planners and policy makers while formulating UHI mitigation strategies. This study will provide them with information concerning the time and the proper location, where UHI mitigation strategies are of utmost required as compared to other cities. This study focuses on understating the regional-level SUHI variability over Indian cities. However, during policymaking and urban development planning, a more detailed analysis is required using high-resolution data sets such as Landsat, as seen from recent detail-level studies (Dissanayake et al. Citation2019; Balew and Korme Citation2020; Mohammad, Goswami, and Bonafoni Citation2019; Simwanda et al. Citation2019; Mohammad and Goswami Citation2021b; Elmes et al. Citation2020).
This study’s novelty is the SUHI investigation, including the climatic and maximum drivers of SUHI, especially in India. In this study, TI responsible for ground heat flux variation is considered, which has not been explored in SUHI studies till now, either in India or worldwide (). Our research suggests TI as one of the crucial parameters in understanding SUHI diurnal variation.
2. Study area
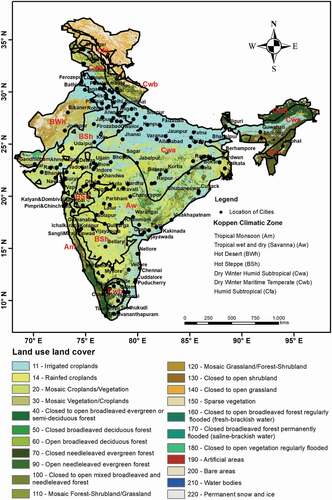
India’s total land area is around 3.287 million km2, making it the seventh-largest country of the world. It is divided into two halves by the passing of the Tropic of Cancer through the middle of the country , with the northern part in the temperate zone and the southern in the tropical zone. It has a variable climatic condition with the prevalence of monsoon-type climate.
Our study comprises 150 of India’s major cities, which may be grouped into seven major climatic zones as per Köppen–Geiger classification zone of India (Peel, B. L. Finlayson, and McMahon Citation2007). However, a more significant number of sub-climatic zones are present in India. The location map of the selected cities situated over different climatic zone is shown in (). To investigate the spatial-temporal variation of SUHI, these 150 cities grouped into seven different climatic zones: tropical monsoon (Aw), tropical wet and dry (savanna) (Aw), hot desert (BWh), hot steppe (BSh), dry winter humid subtropical (Cwa), dry winter maritime temperate (Cwb), and humid subtropical (Cfa). A detailed description of each city is provided in Table S1 of the supplementary material.
Figure 1. Spatial distribution of selected 150 Indian cities with respect to different Köppen–Geiger classification zone. The LULC map obtained from the climate change initiative (CCI) of the European Space Agency (ESA) is reported in the background
3. Data and methods
3.1 Data used
MODIS LST and emissivity data make it feasible for the diurnal, seasonal, and interannual study of SUHI because it has wider coverage along with higher temporal resolution. This study, uses 8-day global land surface temperature and emissivity product of MODIS-Aqua and Terra (MYD11A2 and MOD11A2) satellite at 1 km spatial resolution (exactly 0.982 km). Terra and Aqua satellite overpass over the study region is around 10:30 and 13:30 local solar time during daytime, while around 22:30 and 01:30 local solar time during nighttime. We average the daytime images (10:30 and 13:30) repressing day LST and nighttime images (22:30 and 01:30) representing night-LST.The LST is estimated using split-window algorithm under clear-sky conditions with a bias of less than 0.5 K (Wan Citation2014; Pablos et al. Citation2016). In this work, the quality control data flags to select pixels with an average LST error ≤1 K was considered. The LST of each city has been analyzed separately for the summer and winter seasons. The summer month is lasting from April to June over northwestern India. Whereas the hottest month is April in western and southern regions, and May for the northern regions. In order to avoid the choosing of the different hottest months over different parts of India, we choose the three months average as summer (April, May, and June) season. In a similar manner the month of December, January and February and winter (December, January, and February) season. Moreover, the same time frame makes the cities of different zones of India comparable to each other. The data from July to November is not considered in the SUHI study due to frequent cloud and rain occurrence, which affect the overall data quality (Keeratikasikorn and Bonafoni Citation2018).
LULC data were obtained from CCI-ESA, which provides annual land cover maps at 300 m spatial resolution. The total built-up area for each city has been extracted yearly from 2003 to 2018. In this study, we have used the vegetation greenness information for each city and its surrounding rural area. Previous studies show that the monitoring of EVI is more influencing driving factor of SUHI, than NDVI (D. Zhou et al. Citation2016; Wu et al. Citation2019). EVI data were obtained from the MOD13A3 (monthly) product with 1 km spatial resolution from 2003 to 2018.
ET data were obtained from the operational simplified surface energy balance (SSEB) model (Senay, Budde, and Verdin Citation2011), which is based on the hot/cold pixel principles of the SEBAL (Bastiaanssen et al. Citation1998) and METRIC (Gowda et al. Citation2008) models. This ET data is a monthly product with 1 km spatial resolution. WSA data is obtained from the 16 day composite (MCD43C3) product of MODIS with 500 m spatial resolution.
TI is the degree of slowness in which the temperature of a body approaches its surroundings, which has been used in this study for the first time to study the SUHI phenomenon. TI is a function of bulk density, conductivity, and specific heat. These properties cannot be measured directly with the remote sensing satellites, so we have used apparent thermal inertia (ATI), which can be easily calculated from the difference in day–night LST and albedo maps of the MODIS product (Sohrabinia, Rack, and Zawar-Reza Citation2014).
Remotely sensed nighttime light (NL) data obtained from Defence Meteorological Satellite Program’s Operational Linescan System (DMSP/OLS) were used as a proxy for anthropogenic heat releases in both urban and rural area. The annual data were compiled, and the mean values of NL during this period are considered as SUHI potential drivers. Surface SM data is also considered in this study from soil moisture active passive (SMAP) measurement, which provides direct sensing of soil moisture of top 5 cm from the Earth's surface. In this study, we have used SM from both the AM (descending) and PM (ascending) overpass with a spatial resolution of 9 km from 2015 to 2018.
3.2 Methods
3.2.1 Selection criteria for urban and rural area
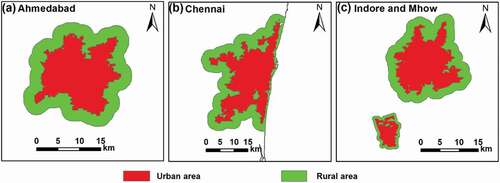
The boundary of urban area is extracted from the MODIS annual land cover (MCD12Q1) layer as per the IGBP (International Geosphere-Biosphere Programme) classification at each 4-year successive interval (2003, 2007, 2011, and 2015). During the investigation of SUHII from 2003 to 2018, we could not use the same urban and rural boundary throughout the 16 years time as the boundary changes. So we considered the urban and surrounding rural boundary of 2003, 2007, 2011, and 2015 representing the boundary in 2003–2006, 2007–2010, 2011–2014, and 2015–2018, respectively. We have considered only those urban patches that cover a minimum area of 25 km2. A buffer of the urban area was chosen in such a way that the area of urban and the rural polygon approximately remain the same (). The rural pixels were excluded from the buffer if : (a) classified as water body; (b) the elevation difference is greater than ±50 m with respect to the average urban altitude (Zhou et al. Citation2016; Yao et al. Citation2018b, Citation2018a); or (c) it was located within the buffer of another city.
Figure 2. Schematic diagram of selection of urban and rural areas, using (a) Ahmedabad as larger patch city, (b) Chennai as coastal patch city, and (c) comparison of large Indore and small Mhow city together with different width of rural buffer
3.2.2 Surface urban heat island assessment
The SUHII is defined as the temperature difference in LST between the urban and it's surrounding rural area (Clinton and Gong Citation2013; Peng et al. Citation2012). Some previous studies considered rural buffer situated over some distance away from the urban–rural boundary (Imhoff et al. Citation2010; Kumar et al. Citation2017; Zhang et al. Citation2010), which overestimated the SUHI. In this study, the nearest buffer of rural from the urban area is used and the SUHII is estimated as below using EquationEq. 1(1)
(1) :
where (x, y) indicates the location (longitude, latitude) of a pixel. LST(x, y)urban represents the pixel in the urban area and LSTrural, the mean LST of the rural pixels within the buffer area. The positive heating effect of SUHI is represented by a positive SUHII value, while a negative value indicates a cooling effect of SUHI.
3.2.3 Estimation of ATI from MODIS
The ATI was calculated based on the day-night LST and albedo data with proper corrections for the geographic latitude and acquisition date. ATI is calculated using EquationEq. 2(2)
(2) (Wang and Qu Citation2009; Doninck et al. Citation2011; Verstraeten et al. Citation2006; Chang et al. Citation2012).
where S is the solar correction factor, is the broadband albedo, and DTA represents the LST difference calculated between the warmest and coolest temperature over a certain time period (Verstraeten et al. Citation2006; Chang et al. Citation2012). Therefore, in this work, DTA is computed as (EquationEq. 3
(3)
(3) )
where and
were obtained from the MODIS day and night LST product.
The solar correction factor, S, is defined using EquationEq. 4(4)
(4)
where is the local latitude, and
is the solar declination, calculated for each day of the year (Van Doninck et al. Citation2011). The solar declination,
, is calculated using EquationEq. 5
(5)
(5)
where d is the Julian day of the year.
3.2.4 Exploring the potential drivers of SUHI
Six different key variables were used in this study as potential SUHII drivers. The primary cause of the UHI is the modification of urban surface to an impervious surface resulting in an increase of surface temperature and thus responsible for spatial and temporal SUHI variation (Zhou et al. Citation2019). In our work, we have considered built-up intensity (BI) extracted from the land covers maps of CCI-ESA as the SUHI driver. The urban and rural difference in enhanced vegetation index (ΔEVI), evapotranspiration (ΔET), and white sky albedo (ΔWSA) were considered as potential drivers affecting SUHI. TI, a significant thermal property of material, can be used as a SUHI driving factor, which has not been investigated so far regarding heat island and climatic zone study. We have considered the urban–rural difference of TI (ΔTI) in our research as a SUHI driver. The anthropogenic heat release from the Earth’s surfaces, represented by night-time lights is a major SUHI affecting drivers and its urban-rural difference, ΔNL is used in this study as a potential driver for SUHI. Lastly, we have also included SM as a driver of SUHI, and the relationship of SM with SUHII is shown as per different climatic zone.
3.2.5 Statistical analysis of SUHII and its drivers
The study uses nonparametric Mann–Kendall (MK) test developed by Mann (Citation1945) and Kendall (Citation1975) to detect the trend in SUHI. The MK test has been extensively used in time-series analysis in recent years and always proved to be best in detecting the linear and non-linear trend (Mohammad, Goswami, and Bonafoni Citation2019; Wu et al. Citation2019; Mohammad and Goswami Citation2021a; Yang, Huang, and Tang Citation2019). The MK test statistics shows whether a significant or nonsignificant trend is present in the data sets at a specific significant level (Radhakrishnan et al. Citation2017) and has been used in many recent studies for detecting trend in long-term data sets (Mohammad and Goswami Citation2019; Yang, Huang, and Tang Citation2019; Malik et al. Citation2020). Additionally, the magnitude of the trend present in the datasets is determined by Sen’s slope estimator test (Sen Citation1968). The detailed governing equation of MK and Sen’s slope test is provided in Appendix S2 of the supplementary material.
To explore the association between SUHII and its potential drivers, this study considered stepwise multiple linear regression model, as used in previous studies of Chinese cities (Yue et al. Citation2019; Zhou et al. Citation2014); to estimate the relative contribution of each driver to the SUHI magnitude with respect to a different climatic zone. The diurnal and seasonal SUHII represents the dependent variables in the model. Four dependent variables of interest for the SUHI were considered: summer daytime, winter daytime, summer nighttime, and winter nighttime. There were six independent variables in the regression model: BI, urban and rural difference in EVI, ET, WSA, TI, and NL (ΔEVI, ΔET, ΔWSA, ΔTI, and ΔNL).
Stepwise multiple linear regressions will allow us to find the relative contribution of each variables in explaining the SUHII variance and selecting the best explanatory variables for SUHII. The general regression equation can be described using EquationEq. 6(6)
(6)
where a–f are the regression coefficients, and is the stochastic error of the regression.
Moreover, Pearson’s correlation coefficient between the SUHII and it's driving variables were also calculated. The significance of the correlation is also calculated with the help of the p values. Three different significance level is considered in this study: 99% significant level (p < 0.01); 95% significant level (0.01 < p < 0.05); and 90% significant level (0.05 < p< 0.1). The variables having Pearson’s correlation coefficient value greater than 0.3 are used as an independent input variable in the stepwise multiple linear regression model.
4. Results
4.1. Diurnal and seasonal variation of SUHII
The seasonal and diurnal variation of the mean SUHII over 150 major Indian cities in seven different climatic zone is shown in . The SUHI intensity of Indian cities varies significantly diurnally and seasonally over the last 16 years. The SUHII varies from negative to positive during the daytime, while only positive SUHII is observed in the nighttime. It means, during the day, both UHI and urban cool island (UCI) phenomena are evident over the Indian cities. UHI/UCI’s phenomenon is controlled by the different climatic dynamics prevailing over the different climatic zone. So, we analyzed the SUHII variation as per the Köppen–Geiger climatic zone over 150 major Indian cities.
Figure 3. Mean surface urban heat island intensity (SUHII) over 150 major Indian cities in (a) summer daytime, (b) summer nighttime, (c) winter daytime, and (d) winter nighttime across different Köppen climatic zone during 2003–2018
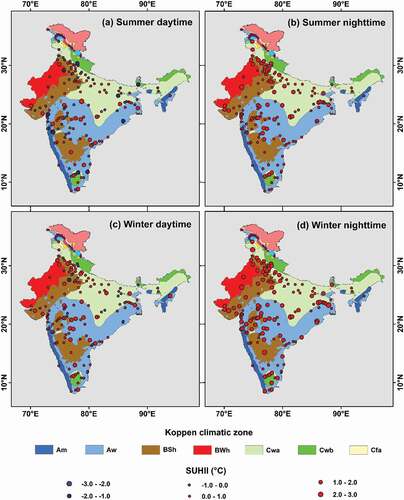
The cities of a humid subtropical zone (Cfa) (1.8°C), dry winter maritime temperate zone (Cwb) (0.57°C), dry winter humid subtropical zone (Cwa) (0.35°C), tropical wet and dry zone (Aw) (0.07°C) exhibit higher and positive mean SUHII as compared to negative SUHII of tropical monsoon zone (Am) (−0.17°C), hot steppe zone (BSh) (−0.17°C), and hot desert zone (BWh) (−0.25°C) in summer daytime (, ) during 2003–2018.
Table 2. Mean SUHII (for all the cities) in °C, over different climatic zones during 2003–2018
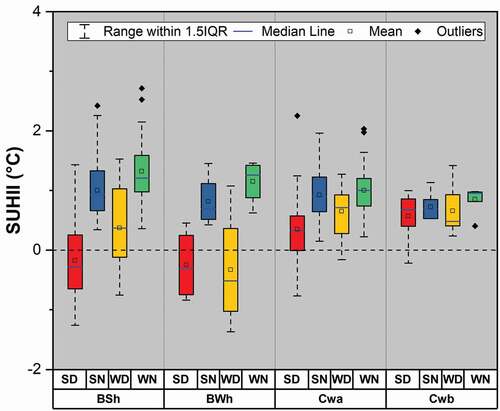
Figure 4. Box plot showing the variation of SUHII in different Köppen climatic zone during 2003–2018 (SD: summer daytime; SN: summer nighttime; WD: winter daytime; and WN: winter nighttime)
In the winter daytime, only the hot desert climatic zone exhibits a negative SUHII of −0.33°C. In contrast, the humid subtropical zone cities, dry winter maritime temperate zone, dry winter humid subtropical zone, tropical wet and dry zone, hot steppe zone, and tropical monsoon zone witnessed positive mean SUHII during the last 16 years ().
In the summer daytime, approximately 64.1% of cities in the hot steppe zone and 44.44% in tropical wet and dry zone witnessed a cool urban island (UCI) effect. This number has been substantially decreased to 33.33% and 20.37% in winter daytime. In the hot desert zone, the UCI percentage has increased from 50% in summer to 75% in winter during the daytime.
The distribution of SUHII in the different climatic zone during nighttime is entirely different from daytime SUHII. All the cities situated in different climatic zones exhibit significant positive SUHII during the nighttime (both in summer and winter), and not even a single city shows the UCI effect. During the nighttime, it is noticeable that the mean SUHII during winter is higher than in summer, which is not true during the daytime. As seen from the range of SUHII during nighttime and daytime, it is evident that the nighttime SUHII is more stable and with less seasonal fluctuation.
In general, the average SUHI intensity of 150 Indian cities over different climatic zone follows a sequence of winter nighttime> summer nighttime> winter daytime > summer daytime. Though a small difference might exist in a different climatic zone, the overall SUHII follows the above general sequence.
4.2. Interannual variability and temporal trend of SUHII
The annual variation of SUHII during 2003–2018 over 150 Indian cities is shown in , and their temporal trends and . The result of interannual variability suggests a clear remarkable behavior in day–night SUHI over the seasons. It has been seen that during daytime in both seasons, the occurrence of both UHI and UCI is seen. Whereas, in the nighttime, clear evidence of positive UHI is seen over the cities (). More of the city’s SUHI magnitude (>90%) lies in two ranges (1–2°C and 2–3°C) in the nighttime, as seen from . It is also noticeable that during the daytime a higher number of cities across the years shows the UCI phenomenon in the summer season as compared to winter (compare the −1 to 0°C SUHI ranges in ).
Table 3. Temporal trend of SUHII (for all the cities) in the different climatic zone during 2003–2018
Figure 5. Annual variation of SUHII (°C) over selected 150 cities during 2003–2018 in (a) summer daytime, (b) summer nighttime, (c) winter daytime, and (d) winter nighttime (number of cities on X-axis is as per the serial number of cities in Table S1, provided in the supplementary material)
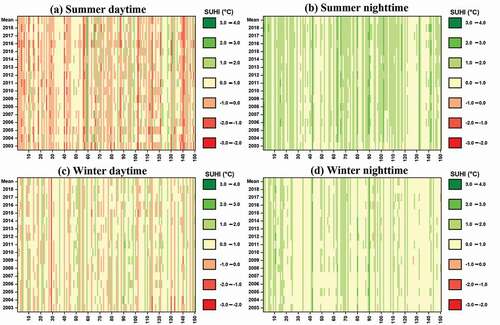
Figure 6. Temporal trend of SUHII over 150 Indian cities during (a) summer daytime, (b) summer nighttime, (c) winter daytime, and (d) winter nighttime across different Köppen climatic zone from 2003 to 2018
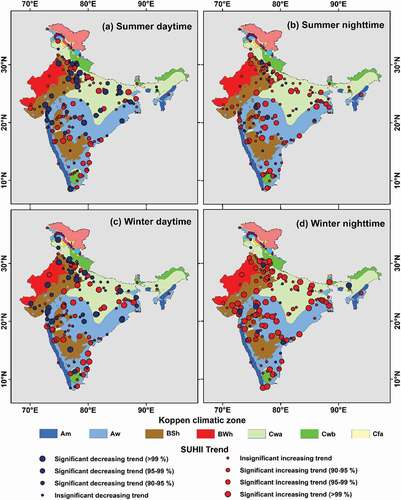
During the daytime, a decreasing trend was observed in most cities compared to nighttime for summer/winter (). Cities of BSh and BWh climatic zone show decreasing SUHII trend, while the cities of Cwa, Aw, and Cwb show an increasing trend during 2003 to 2018 in both the seasons in daytime. The Sen’s slope results also suggest a decreasing SUHII over BSh and BWh climatic zone and an increasing trend over Cwa, Cwb, and Aw climatic zone during the last 16 years ().
During the daytime, the percentage of cities showing the decreasing trend has been increased from summer to winter in the hot steppe (from 53.85 to 58.97%), hot dessert (from 50 to 75%), and dry winter humid subtropical (from 34.88 to 51.16%) climatic zone. Moreover, the percentage of increasing/decreasing trend remains the same for dry winter maritime temperate (59.26%) and tropical wet and dry (40.74%) climate. A substantially reduced from 65.12% to 48.84% SUHII is found in dry winter humid subtropical zone from summer to winter season during the daytime.
During nighttime, the percentage of cities showing an increasing trend is high as compared to daytime. Nearly more than 75% of the cities show increasing SUHII trends in the most climatic zone except tropical monsoon and hot desert zone in summer/winter season during nighttime. This exceptional is mainly due to the lower sample size (here cities) chosen within the zone. Sen’s slope also suggests a decreasing trend in tropical monsoon and hot desert climatic zone ().
In winter nighttime, the percentage of cities with increasing SUHII trend has increased significantly compared to summer nighttime. Tropical wet and dry (90.74%), dry winter humid subtropical (88.37%), dry winter maritime temperate (85.71%), and hot steppe (84.62%) climatic zone witnessed increasing SUHII trend from summer to winter during nighttime. Tropical monsoon, hot desert, and humid subtropical zone show a decreasing trend during the nighttime (a limited sample). Sen’s slope suggests a more or less similar type of SUHII trend as that of nighttime.
4.3 Response of SUHI intensity to different drivers
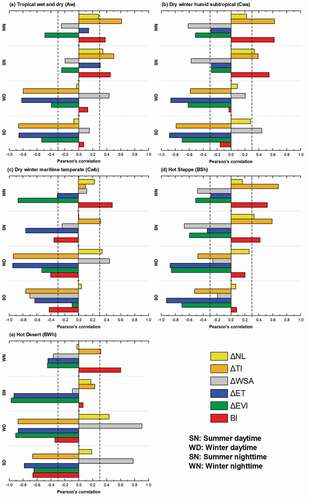
Six different variables were analyzed and correlated with exploring the cause of SUHI variation over the different climatic zone in summer/winter and daytime/nighttime, namely, built-up (BI), ΔEVI, ΔET, ΔWSA, ΔTI, and ΔNL (Δ is the urban–rural difference). The results of Pearson’s correlation coefficient indicate that different variables were responsible for the SUHII variations during daytime/nighttime and summer/winter situated over different climatic zones (). For considering a suitable driver affecting SUHII in stepwise multiple regression model, we fixed a correlation criterion of above 0.3. The relevant drivers used as an input in the model and the results of stepwise multiple linear regression are presented in . The overall daytime model performs well as compared to nighttime models. The model does not perform for the hot desert (BWh) climatic zone because of a smaller number of sample points as only four cities are falling within this zone.
Table 4. Results of stepwise multiple linear regression for all the cities in 2003–2018. Pearson’s correlation coefficients between the SUHII and the selected driving variables are reported, as well as the overall R2 and p-value of stepwise multiple linear regression
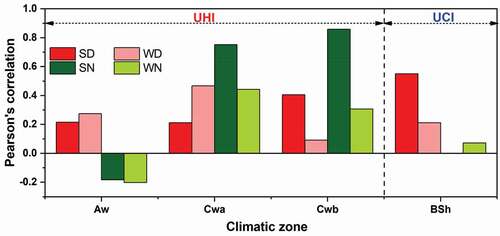
Figure 7. Pearson’s correlation between SUHII and six drivers (BI, ΔEVI, ΔET, ΔWSA, ΔTI, and ΔNL) over (a) tropical wet and dry (Aw), (b) dry winter humid subtropical (Cwa), (c) dry winter maritime temperate (Cwb), (d) hot steppe (BSh), and (e) hot desert (BWk) climatic zone in summer daytime (SD), winter daytime (WD), summer nighttime (SN), and winter nighttime (WN)
4.3.1 Drivers for urban heat island (in Aw, Cwa, and Cwb climatic zone)
During the daytime, SUHII is negatively correlated with ΔEVI, ΔET, and ΔTI, as shown in ), more in summer than in winter, in Aw climatic zone and positively with ΔWSA. Conversely, in the nighttime, SUHII is seen to be positively correlated with BI, ΔTI, and ΔNL and less negatively with ΔEVI in both the seasons. The regression model suggests that the model’s overall performance is better in the daytime (87% in summer and 83% in winter) than nighttime (51% in summer and 69% in winter), considering the chosen driving variables in Aw climatic zone.
Pearson’s correlation results suggest a negative correlation of ΔEVI, ΔET, and ΔTI with SUHI magnitude during daytime in Cwa climatic zone, more correlation in summer than in winter ()). ΔWSA is found to be positive correlated with SUHII during summer daytime in this climatic zone. While during the nighttime, SUHII is seen to be positively correlated with BI, ΔTI, and ΔNL and negatively with ΔEVI and ΔWSA in both summer and winter season in Cwa climatic zone. The overall model efficiency in explaining the SUHII variance in this climatic zone is more explanatory during the daytime, (R2 = 0.94 in summer and 0.87 in winter) than nighttime (R2 = 0.51 in summer and 0.70 in the winter).
In the daytime, SUHII is negatively correlated with ΔET, ΔTI, and BI, more in winter than in summer in Cwb climatic zone, as shown in ). A slight negative correlation with ΔEVI and a positive with ΔNL is observed during winter daytime in this climatic zone. The behavior of ΔWSA is opposite in both summer (negatively correlated) and winter season (positively correlated). During nighttime, a positive correlation of BI and a negative correlation of ΔET is seen with SUHI magnitude in both seasons over this zone. A significant negative correlation of SUHII with ΔEVI is observed in winter, while a low positive correlation of ΔTI in summer is seen during nighttime in this climatic zone. The overall model accuracy in the summer and winter seasons is 90% and 81%, respectively, during the daytime. In comparison, the accuracy decreases to 82% and 85% in respective seasons during nighttime over this climatic zone.
4.3.2 Drivers for an urban cool island (in BSh and BWh climatic zone)
During daytime in BSh climatic zone, SUHII is found to be negatively correlated with ΔEVI, ΔET, and ΔTI, more correlation in summer than in winter except for ΔEVI, where winter showed a higher negative correlation ()). In the nighttime, a significant positive correlation of SUHII with BI, ΔTI, and ΔNL (summer only) and a negative correlation with ΔEVI, ΔWSA, and ΔET (summer only) is observed over this climatic zone. The model efficiency for the SUHII variance over BSh climatic zone was higher in the daytime, with 91% in summer and 94% in winter, as compared to nighttime having 89% in summer and 86% in winter.
A significant negative correlation was seen between SUHII and ΔEVI, ΔET, ΔTI, and BI, during daytime in both the seasons over BWh climatic zone. SUHII in the daytime also shows a positive correlation with ΔWSA and ΔNL (winter only) over this climatic zone ()). In the nighttime, ΔEVI and ΔET are seen to be negatively correlated (more in summer than in winter) with SUHII in this zone. A positive correlation of SUHII with BI and ΔTI, while negative with ΔWSA, is witnessed over this climate in winter nighttime only.
4.4 Diurnal control of thermal inertia on SUHII
The urban–rural difference in TI (ΔTI) is indirectly represents the ground heat flux, as it is related to the degree of slowness to which the temperature of a body (urban concrete material) approaches that of its surrounding (rural). It is a measurement of how rapidly or slowly an urban material gains or loses heat compared to its nearby environment and can be considered an essential parameter in understating SUHI diurnal variability. It is a measure of the sub-surface’s ability to store heat during the day and re-radiate it during the night.
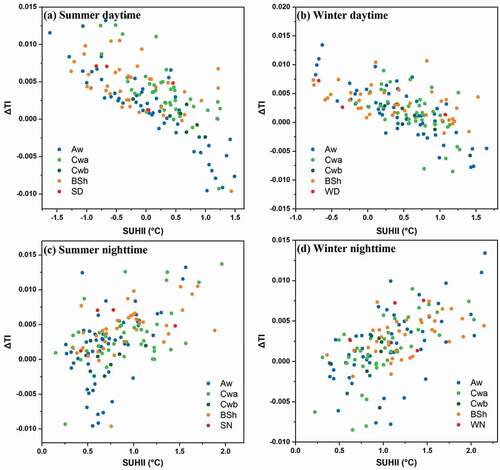
The relationship of SUHII with ΔTI is quite interesting, as it has shown a negative correlation with daytime SUHII and positive with nighttime SUHII in both the seasons ( and ). During daytime, a significantly higher negative correlation is observed for an UHI, while a lower correlation for an UCI. In the nighttime, the positive correlation does not vary that much for both UHI and UCI. This signifies that the surface temperature of a material with lower TI such as water, vegetation (in rural areas) can rise rapidly as compared to a material with higher TI, such as buildings and roads (of urban areas), that can rise very slowly.
Figure 8. SUHII and thermal inertia (TI) relationship across the different climatic zone in (a) summer daytime, (b) winter daytime, (c) summer nighttime, and (d) winter nighttime
4.5 Effect of soil moisture on SUHII
SM represents the soil’s water content and thus can be an essential property in controlling the SUHI variation, especially in those rural areas having predominantly soil cover. The relationship of SUHI magnitude with the urban–rural difference in soil moisture (ΔSM) is shown in . A positive correlation is observed between SUHII and ΔSM during the daytime, more in summer than in winter in BSh climatic zone, indicating the UCI phenomenon. Within Cwa and Cwb climatic zone, with UHI, a higher positive correlation is observed during nighttime as compared to daytime, especially in the summer season. During winter, daytime correlation dominates in Cwa climatic zone, while in the Cwb zone, nighttime correlation dominates. In Aw climatic zone, the behavior is quite different with a positive correlation in the daytime and negative in the nighttime in both the season.
Figure 9. SUHI and soil moisture (SM) relationship for UHI/UCI across the different climatic zone in summer daytime (SD), winter daytime (WD), summer nighttime (SN), and winter nighttime (WN)
5. Discussion
5.1 The dissimilarity of daytime and nighttime SUHII
The diurnal, seasonal, and trend of SUHI have been presented in this study to understand the response of SUHI in different climatic zones. Different climate zones may cause different patterns in the SUHI variation. The diurnal and seasonal behaviors of SUHI can be found in previous studies (D. Zhou et al. Citation2014; Clinton and Gong Citation2013; Wang et al. Citation2015), but the discussion in context with the climatic zone is missing. In the Indian context, Kumar et al. (Citation2017) and Shastri et al. (Citation2017) have reported the SUHI scenario over major cities of India. Kumar et al. (Citation2017) have considered rural reference buffer as the area situated some distance away from the urban, which overestimated the result and is not in accordance with our study or as reported by Shastri et al. (Citation2017).
Our study suggests that the overall mean SUHII of all Indian cities during summer/winter or daytime/nighttime vary from the −0.33°C to 1.32°C, which is also supported by the study of Peng et al. (Citation2012), (mean SUHII was in between 0°C to 2°C for 95% of the cities worldwide). Overall the SUHI intensity was higher during the nighttime as compared to daytime in both summer and winter seasons. During nighttime, the prominent SUHI is due to a higher degree of impervious material having higher thermal capacity, resulting in more considerable longwave radiation from urban areas. A positive correlation is observed between the urban LST and ISA during nighttime as compared to negative correlation in the daytime, also reported in other studies of city New York (Gaffin et al. Citation2008), Delhi (Mallick, Rahman, and Singh Citation2013), Hyderabad–Bikaner–Varanasi–Vadodara (Bala et al. Citation2019). The prevalence of UHI or UCI in the daytime is characterized by its climatic zones and its rural surrounding (Mohammad and Goswami Citation2021b). The control of SUHI intensity in climatic zones of global cities is assessed and found to be efficient in controlling the SUHI phenomenon (Chakraborty and Lee Citation2019; Miles and Esau Citation2020). Besides the behaviors of UHI and UCI are also seen from the city size distribution (Zhou, Rybski, and Kropp Citation2017). Clear evidence of UHI and UCI’s contrasting behaviors is seen with city size in this study (Figure S3 in supplementary material). Some studies also suggest that the increase in minimum temperature was higher than the maximum temperature in urban areas which causes lower diurnal range of temperature could be a probable cause of higher nighttime SUHII (Oleson, Bonan, and Feddema Citation2010).
Moreover, a negative SUHI or UCI is observed over cities of the hot steppe, hot desert, and tropical monsoon climatic zone, more in summer than in winter. In contrast, no such cool island is evident during nighttime in both summer and winter. Such a cool island is controlled by rural area’s dynamics, which have less vegetation and dominated cropland, reducing ET (Mohammad, Goswami, and Bonafoni Citation2019). Kumar et al. (Citation2017) and Shastri et al. (Citation2017) also suggest the occurrence of UCI over the western and central semi-arid cities of India during the daytime. The occurrence of UCI is also seen from the recent research of Raj et al. (Citation2020), where the cities of dry and arid climatic zones shown negative SUHI value during daytime in both the summer and winter seasons.
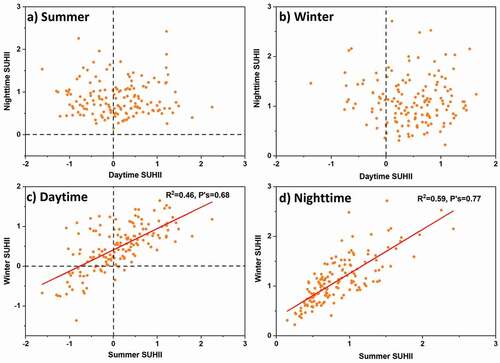
The factors driving the SUHI during the day and night are different as there is no correlation seen between the daytime and night-time SUHII in summer and winter ()). On the other hand, a positive correlation between the summer and winter SUHII during the daytime (R2 = 0.46, P’s = 0.68) and nighttime (R2 = 0.59, P’s = 0.77) is seen (), signifying that the drivers for summer and winter variation of SUHII are almost similar. Previous studies analyzed daytime and nighttime variation of SUHI and their possible drivers as a consequence of exchange of surface energy flux between the urban and surrounding rural area, which is expressed as net-all wave radiation + anthropogenic heat release = latent heat flux + sensible heat flux + ground heat flux (Arnfield Citation2003; Clinton and Gong Citation2013; Oke Citation1987). An increase in ISA leads to a reduction in latet heat flux and enhance in sensible heat flux, which causes the daytime SUHI variation (Arnfield Citation2003; Clinton and Gong Citation2013; Oke Citation1976; Peng et al. Citation2012; Voogt and Oke Citation2003), while ground heat flux storage in the urban area is causing the nighttime variation (Clinton and Gong Citation2013; Voogt and Oke Citation2003).
Figure 10. Relationships of SUHII (°C) between the daytime and nighttime during summer (a) and winter (b), and between summer and winter during the daytime (c) and nighttime (d) across India’s 150 major cities averaged over the period 2003–2018
The primary source of heat during the summer daytime is the net all wave radiation from the sun (Oke Citation1987; Rizwan, Dennis, and Chunho Citation2008). During summer daytime, urban area with a high percentage of ISA and less vegetation cause higher urban LST due to an increase in sensible heat flux and decrease in latent heat flux; whilst suburban area with high vegetation has lower LST due to evaporative cooling effect (Peng et al. Citation2012; Susca, Gaffin, and Dell’Osso Citation2011; Weng, Lu, and Schubring Citation2004), resulting in positive SUHII, as reported in humid subtropical (1.8°C), dry winter maritime temperate (0.57°C), dry winter humid subtropical (0.35°C), and tropical wet and dry (0.07°C) climatic zone of our present research. The negative SUHII is also observed over tropical monsoon (−0.17°C), hot steppe (−0.17°C), and hot desert (−0.25°C) climatic zone during summer daytime, which witness hotter rural area due to the absence of vegetation and predominantly dominant of cropland (Mohammad, Goswami, and Bonafoni Citation2019). The phenomenon of UCI is also reported over some urban areas of northwestern China (D. Zhou et al. Citation2015,Hawkins et al. Citation2004), central Asia (Peng et al. Citation2012), South America (Wu et al. Citation2019), and India (Kumar et al. Citation2017; Mohammad, Goswami, and Bonafoni Citation2019; Shastri et al. Citation2017). Nighttime generally has higher SUHI than daytime because of higher heat storage in the urban material resulting in higher thermal capacity of the urban-core area compared to surrounding non-urban areas (Oleson, Bonan, and Feddema Citation2010). A similar type of behavior is observed in winter daytime and nighttime. It can be explained with the help of the summer season’s above agreement as to the driving mechanism of both the season in the same as suggested in . The higher daytime and nighttime SUHI in winter compared to summer can be explained by the dominance of agriculture in non-urban areas resulting in slightly higher NDVI, thus providing a cooling effect in the non-urban area during the winter season. This is the crucial cropping season (rabi season) in India, especially from November to March. At the end of March, these crops get harvested having lower NDVI (Kumar et al. Citation2017), and conversion of cropland to bare land causes higher rural LST as compared to an urban area (Lim et al. Citation2005), resulting in negative SUHI or UCI in summer daytime in hot steppe and hot desert climatic zone.
5.2 Possible mechanisms of SUHI diurnal and seasonal variability
Overall results of regression model suggests that the chosen parameters are more efficient in understating the UCI phenomenon over the UHI phenomenon in Indian cities of different climatic zone. A detailed discussion on each chosen parameter is summarized below.
5.2.1 Built-up intensity
Higher BI keeps urban surface warmer as compared to the rural area of low BI because urban buildings, streets, human activities can trap more heat, and the heat lost was less because of decreasing vertical heat flux change (Oke Citation1976; Yow Citation2007; Mehrotra et al. Citation2021). The BI of the hot desert (BWh) zone shows a significant dominant control on SUHI, especially in summer daytime. Whereas in the nighttime, BI witness a good correlation with SUHI of positive heat islands as seen from the climatic zone of humid and maritime (Cwa and Cwb) climatic zones. A more considerable difference in BI between urban and rural area is responsible for having more intense SUHI in nighttime, as most of the stored ground heat is released from the urban surfaces during nighttime (Yuan and Bauer Citation2007; Junxiang Li et al. Citation2011; Hung et al. Citation2006). The present study also supports the mechanism, revealing a significant positive correlation of SUHII with ΔBI in the nighttime in both summer/winter seasons.
5.2.2 Vegetation activity
As compared to the urban surfaces, the rural area with higher vegetation cover can increase the latent heat flux via the process of transpiration, which provides cooling and thus lowering the LST of the urban area (D. Li et al. Citation2019; Li et al. Citation2011; Yuan and Bauer Citation2007; Hung et al. Citation2006; Peng et al. Citation2019). The results presented in and support this mechanism as ΔEVI correlated negatively and strongly with SUHII during summer daytime. While in the winter season, the correlation of ΔEVI with SUHII is lower and insignificant due to low vegetation. The vegetation is found to be an effective cooling parameter in rural surroundings during daytime resulting in positive SUHI over Cwa and Cwb climatic zones (Kabano, Lindley, and Harris Citation2021). The nighttime SUHII has a very less insignificant correlation with SUHII, which is expected to owe primarily due to the absence of transpiration during the night (Arnfield Citation2003; Peng et al. Citation2012). Thus, in the BSh and BWh climatic zones, vegetation cannot be an influential determinant of SUHI.
5.2.3 Evapotranspiration
The evaporation from the water surfaces and transpiration from green leaves provides cooling to the rural area, resulting in positive SUHI over the cities (S. Peng et al. Citation2012; Mohammad, Goswami, and Bonafoni Citation2019; Raj et al. Citation2020). Our study also suggests the above mechanism showing the negative correlation of SUHII with the ΔET in both the season, more in summer than in winter ( and ). The evaporative cooling is a much more dominant controlling parameter in the daytime for hot and dry climatic zones (BSh and BWh), while in the nighttime, it controls SUHI to a lesser extent in Cwa and Cwb climatic zone. Indeed, the cities of tropical climate (Aw) reveal positive feedback at night. ET is an essential factor in the mitigation of SUHI, especially in positive SUHI affected cities where the increase of ET in the urban area (by increasing more and more green surfaces) can reduce the surface temperature.
5.2.4 White sky albedo
An increase in urbanization decreases the surface albedo primarily due to the urban canopy effect (Karimi et al. Citation2020). The new material used in the construction of roads, buildings can reduce heat loss through the urban surfaces and result in increasing heat storage of urban materials (Arnfield Citation2003; Zhou et al. Citation2014; Jin, Dickinson, and Zhang Citation2005; Stewart and Oke Citation2012; Taleghani and Berardi Citation2018). Since the source of heat contributing to nighttime SUHII is mainly driven by the surface heat flux which originates from the heat stored during the daytime (Stewart and Oke Citation2012; Shepherd, Citation2005). Our findings also verified this mechanism with the sizable negative correlation of difference in urban and rural WSA (i.e. ΔWSA) with the SUHII at night during both the season (). Furthermore, the albedo is found to be more evident in winter than summer, which is due to the greater ΔWSA. The greater difference is the manifestation of vegetation defoliation and the presence of snow and ice during winter. Albedo is an efficient parameter for SUHI mitigation measurement over cities of hot desert climate (BWh) in the daytime and subtropical climate (Cwa) in the nighttime.
5.2.5 Nighttime lights
The anthropogenic heat flux, indirectly influences the SUHI as it can be easily converted into sensible heat flux. NL is a proxy for anthropogenic heat emission (Li et al. Citation2020; Zheng, Weng, and Wang Citation2021; Raj et al. Citation2020; Yuanzheng et al. Citation2019). A significant positive correlation is observed between the ΔNL and SUHII in our study, supporting the above mechanism. This can be seen from the cities of tropical (Aw), subtropical (Cwa), and hot steppe (BWh) climatic zone in the nighttime.
5.2.6 Thermal inertia
TI is the measurement of heat loss and gain of a material compared to the surrounding area that represents the change in ground heat flux over a surface and has an adverse effect on SUHI intensity. The urban area’s material has more considerable TI suggesting a bigger thermal capacity than that of the rural area, which means the urban material has more significant heat storage (Chen, Du, and Dong Citation2008; Guoyin and Mingyi Citation2009). During the day, the temperature change is going lower with time, so the temperature in the urban area could not be increased rapidly; in contrast to the temperature of materials in the rural area with small TI can be increased quickly (Guoyin and Mingyi Citation2009). During the daytime, the rural area reveals higher TI compared to an urban area and resulting in the negative correlation of ΔTI with the SUHII during both summer/winter seasons (). While during nighttime, the rural area loses heat quickly and becomes cool compared to the hotter urban surface with higher TI with a high holding capacity of heat flux. Due to this reason, a significant positive correlation is observed between ΔTI and SUHII at night during both seasons. The TI is a more significant controlling variable during daytime compared to nighttime in explaining the SUHI variability, as reported in and . In daytime, the negative correlation of ΔTI with SUHI is higher for the cities of Cwa and Cwb climatic zone. Indeed, a much lower correlation is seen over BSh and BWh climatic zone. During nighttime similar trend is seen but with positive feedback to SUHI.
5.2.7 Soil moisture
Higher SM has been offered to have lower SUHI intensity. This is due to the increase in the thermal admittance of rural soils, which increases the resistance of rural soils to temperature change and limits the temperature divergence of urban-rural gradient (Oke and Runnalls Citation2000; Schatz and Kucharik Citation2014). Our study suggests that SM had a significant positive correlation with SUHI intensity during summer nights compared to winter nights for the cities having a positive UHI effect (). SM has shown positive feedback to SUHI for the cities of the hot steppe climatic (BSh) zone, where a negative UHI is seen in the daytime. The daytime has the least significant fluctuating correlation with the SUHII. It has shown positive determinants of SUHI for the cities of humid (Cwa) and maritime (Cwb) climatic zones, more in the nighttime as compared to daytime. The tropical cities (Aw) show contrasting behavior with a positive response in the daytime and a negative in the nighttime to SM. While for UCI, where less SM is present in a rural area, the positive daytime correlation dominates over nighttime in summer and winter.
6. Conclusion
This study analyzed the diurnal, seasonal, and interannual behavior of SUHIIs in 150 major cities across India’s climatic regions using remote sensing data from 2003 to 2018. Because India is characterized by different climatic patterns over different parts of the country, this research delivers valuable understanding of the behaviour and mechanism of SUHI phenomenon on a regional scale. Further, this result will also help understand the possible mechanism and dynamics of urban heat and cool island (UHI/UCI) prevailing over different climatic regions. Pearson’s correlation analysis and stepwise multiple linear regression techniques are used to identify the most suitable SUHII affecting variable over different climate considering BI, the urban–rural difference in enhanced vegetation index (ΔEVI), evapotranspiration (ΔET), white sky albedo (ΔWSA), thermal inertia (ΔTI), nighttime lights (ΔNL), and soil moisture (ΔSM) as the input variables.
The results obtained from the present study revealed that the intensity of SUHI was higher in the nighttime than the daytime SUHII during 2003–2018, in the summer/winter season, except in the humid subtropical climatic zone. The results also indicated that the diurnal SUHII differs substantially across different climatic zones. It shows a higher and positive SUHII in dry winter humid subtropical, dry winter maritime temperate, tropical wet and dry and humid subtropical climate zone during the daytime. In contrast, the cities of hot desert, hot steppe, and tropical monsoon climatic zone witnessed UCI during daytime more significantly in summer than in winter. On the contrary, the SUHI phenomenon is more pronounced in nighttime with positive SUHII values, during both summer/winter seasons in all climatic regions. The diurnal SUHII varied considerably with the season, with a relatively higher intensity in winter than summer. The results of trend analysis suggests a significant increasing trend of SUHII in dry winter humid subtropical, dry winter maritime temperature, and tropical wet and dry climatic regions; while the decreasing trend in the hot desert and hot steppe climatic zone.
The results of correlation analysis and regression model indicate that the SUHI phenomenon varies differently over Indian cities. The diurnal and seasonal behavior of SUHI is driven by different variables in different climatic zones. It is observed that the vegetation and ET, which is controlling the latent heat flux over the surface, are mainly responsible for the daytime SUHII variation in both the season, more in summer than in winter. Whereas, on the other hand, variation in nighttime SUHII, especially in summer is controlled by BI, surface albedo, and nighttime lights, The main novelty of the present research is the use of TI in understanding the dynamics of SUHII, which directly represent the change in ground heat flux, not previously explored in the literature, especially in Indian cities on a regional scale. The results obtained signifies the importance of TI in controlling the diurnal SUHII variation. The outcome of the study suggests a negative control of TI in SUHII variation during daytime and positive at nighttime during both seasons irrespective of climatic regions. An added value of this research is the analysis of SM in SUHII studies for Indian cities. Wet-soil rural sites produced positive daytime SUHIs which is due to higher latent heat flux and thermal inertia of rural material. While dry rural soils, produces smaller daytime SUHIs (even negative) which is due to the rural soils with lower TI. This phenomena is responsible for a rapid rural warming at daytime and cooling in nighttime, which cause weak daytime and strong nighttime SUHI.
Our result highlights the diurnal and seasonal variation of SUHII along with its different driven parameters that control SUHII’s variation over different climatic regions. This study reveals the role of vegetation and ET in controlling the daytime SUHI whereas BI, surface albedo, and nighttime lights in nighttime SUHI. This research also signifies the importance of TI and SM in controlling the diurnal SUHI variation over Indian cities of different climatic zones. Altogether, these selected variables helped to understand the mechanism and dynamics of SUHII across space and time without complex modeling. The mitigation of SUHI can be achieved with increase in urban vegetation activity, which provides shading and natural cooling (Gatto et al. Citation2020); increase ET by increasing the water surfaces in the urban areas (Ampatzidis and Kershaw Citation2020; Gunawardena, Wells, and Kershaw Citation2017), increase in the surface albedo of urban material (Karimi et al. Citation2020). Moreover the increase in SM of rural sites while reducing anthropogenic heat emissions in urban sites, and increase in the TI of urban materials will provide mitigation to UHIs as suggested from the findings of the present study.
Highlights
The diurnal, seasonal, and interannual variation of SUHII is assessed over 150 major Indian cities situated over different climatic regions.
Seven different variables are explored together to understand the variability of SUHII using stepwise multiple linear regression model.
The daytime SUHII is significant control by vegetation and evapotranspiration while built-up intensity, albedo, and nighttime lights control nighttime SUHII.
Thermal inertia shows negative correlation with daytime SUHII and positive with nighttime.
Soil moisture is found to be essential for understating UHI and UCI phenomenon.
Conflicts of interest
The author(s) declare that they have no known competing financial interests or personal relationships that could have appeared to influence the work reported in this paper.
Supplemental Material
Download MS Word (71.4 KB)Acknowledgements
The authors are grateful to the editor and the anonymous reviewers for their valuable and constructive comments and suggestions to improve the quality of the manuscript. The authors would like to acknowledge the Department of Earth Sciences, Indian Institute of Technology, Roorkee, India, for providing necessary infrastructure facilities. The authors also acknowledge MHRD and DST NRDMS (Grant number- NRDMS/01/179/2015(C)), New Delhi, for providing the necessary financial support.
Data and codes availability statement
The data and codes that support the findings of this study are available on request from the corresponding author.
Supplementary material
Supplemental data for this article can be accessed here.
Additional information
Funding
References
- Ampatzidis, P., and T. Kershaw. 2020. “A Review of the Impact of Blue Space on the Urban Microclimate.” Science of the Total Environment 730: 139068. doi:https://doi.org/10.1016/j.scitotenv.2020.139068.
- Arnfield, A. J. 2003. “Two Decades of Urban Climate Research: A Review of Turbulence, Exchanges of Energy and Water, and the Urban Heat Island.” International Journal of Climatology 23 (1): 1–26. doi:https://doi.org/10.1002/joc.859.
- Bala, R., R. Prasad, V. P. Yadav, and J. Sharma. 2019. “Spatial Variation of Urban Heat Island Intensity in Urban Cities Using Modis Satellite Data.” ISPRS - International Archives of the Photogrammetry, Remote Sensing and Spatial Information Sciences XLII-4/W16 (October): 147–151. doi:https://doi.org/10.5194/isprs-archives-xlii-4-w16-147-2019.
- Balew, A., and T. Korme. 2020. “Monitoring Land Surface Temperature in Bahir Dar City and Its Surrounding Using Landsat Images.” The Egyptian Journal of Remote Sensing and Space Science 23 (3): 371–386. doi:https://doi.org/10.1016/j.ejrs.2020.02.001.
- Bastiaanssen, W. G. M. G. M., M. Menenti, R. A. Feddes, A. A. M. Holtslag, H. Pelgrum, J. Wang, Y. Ma, et al. 1998. “A Remote Sensing Surface Energy Balance Algorithm for Land (SEBAL): 1. Formulation.” Journal of Hydrology 212–213 (1–4): 198–212. doi:https://doi.org/10.1016/S0022-1694(98)00253-4.
- Cao, C., X. Lee, S. Liu, N. Schultz, W. Xiao, M. Zhang, and L. Zhao. 2016. “Urban Heat Islands in China Enhanced by Haze Pollution.” Nature Communications 7 (1): 1–7. doi:https://doi.org/10.1038/ncomms12509.
- Chakraborty, T., and X. Lee. 2019. “A Simplified Urban-Extent Algorithm to Characterize Surface Urban Heat Islands on A Global Scale and Examine Vegetation Control on Their Spatiotemporal Variability.” International Journal of Applied Earth Observation and Geoinformation 74 (October 2018): 269–280. doi:https://doi.org/10.1016/j.jag.2018.09.015.
- Chang, T. Y., Y. C. Wang, C. C. Feng, A. D. Ziegler, T. W. Giambelluca, and Y. A. Liou. 2012. “Estimation of Root Zone Soil Moisture Using Apparent Thermal Inertia with MODIS Imagery over a Tropical Catchment in Northern Thailand.” IEEE Journal of Selected Topics in Applied Earth Observations and Remote Sensing 5 (3): 752–761. doi:https://doi.org/10.1109/JSTARS.2012.2190588.
- Chen, X., and Y. Zhang. 2017. “Impacts of Urban Surface Characteristics on Spatiotemporal Pattern of Land Surface Temperature in Kunming of China.” Sustainable Cities and Society 32: 87–99. doi:https://doi.org/10.1016/j.scs.2017.03.013.
- Chen, Y., M. Du, and R. Dong. 2008. “Correlation between Urban Heat Island Effect and the Thermal Inertia Using Aster Data in Beijing, China.” The International Archives of the Photogrammetry, Remote Sensing and Spatial Information Sciences XXXVII (B7): 1723–1728.
- Clinton, N., and P. Gong. 2013. “MODIS Detected Surface Urban Heat Islands and Sinks: Global Locations and Controls.” Remote Sensing of Environment 134: 294–304. doi:https://doi.org/10.1016/j.rse.2013.03.008.
- Connors, J. P., C. S. Galletti, and W. T. L. Chow. 2013. “Landscape Configuration and Urban Heat Island Effects: Assessing the Relationship between Landscape Characteristics and Land Surface Temperature in Phoenix, Arizona.” Landscape Ecology 28 (2): 271–283. doi:https://doi.org/10.1007/s10980-012-9833-1.
- Debbage, N., and J. M. Shepherd. 2015. “The Urban Heat Island Effect and City Contiguity.” Computers, Environment and Urban Systems 54: 181–194. doi:https://doi.org/10.1016/j.compenvurbsys.2015.08.002.
- Dissanayake, D. M. S. L. B., T. Morimoto, M. Ranagalage, and Y. Murayama. 2019. “Land-Use/Land-Cover Changes and Their Impact on Surface Urban Heat Islands: Case Study of Kandy City, Sri Lanka.” Climate 7 (8): 1–20. doi:https://doi.org/10.3390/cli7080099.
- Dissanayake, D. M. S. L. B., T. Morimoto, Y. Murayama, and M. Ranagalage. 2016. “Impact of Landscape Structure on the Variation of Land Surface Temperature in Sub-Saharan Region : A Case Study of Addis Ababa Using Landsat Data.” Sustainability 11 (8): 2257. doi:https://doi.org/10.3390/su11082257.
- Doninck, J. V., J. Peters, B. De Baets, E. M. De Clercq, E. Ducheyne, and N. E. C. Verhoest. 2011. “The Potential of Multitemporal Aqua and Terra MODIS Apparent Thermal Inertia as a Soil Moisture Indicator.” International Journal of Applied Earth Observation and Geoinformation. doi:https://doi.org/10.1016/j.jag.2011.07.003.
- Elmes, A., M. Healy, N. Geron, M. M. Andrews, J. Rogan, D. G. Martin, F. Sangermano, C. A. Williams, and B. Weil. 2020. “Mapping Spatiotemporal Variability of the Urban Heat Island across an Urban Gradient in Worcester, Massachusetts Using in-Situ Thermochrons and Landsat-8 Thermal Infrared Sensor (TIRS) Data.” GIScience and Remote Sensing 57 (7): 845–864. doi:https://doi.org/10.1080/15481603.2020.1818950.
- Estoque, R. C., Y. Murayama, and S. W. Myint. 2017. “Effects of Landscape Composition and Pattern on Land Surface Temperature: An Urban Heat Island Study in the Megacities of Southeast Asia.” Science of the Total Environment 577: 349–359. doi:https://doi.org/10.1016/j.scitotenv.2016.10.195.
- Gaffin, S. R., C. Rosenzweig, R. Khanbilvardi, L. Parshall, S. Mahani, H. Glickman, R. Goldberg, R. Blake, R. B. Slosberg, and D. Hillel. 2008. “Variations in New York City’s Urban Heat Island Strength over Time and Space.” Theoretical and Applied Climatology 94 (1–2): 1–11. doi:https://doi.org/10.1007/s00704-007-0368-3.
- Gallo, K. P., A. L. McNab, T. R. Karl, J. F. Brown, J. J. Hood, and J. D. Tarpley. 1993. “The Use of NOAA AVHRR Data for Assessment of the Urban Heat Island Effect.” Journal of Applied Meteorology 32 (5): 899–908. doi:https://doi.org/10.1175/1520-0450(1993)032<0899:tuonad>2.0.CO;2.
- Gatto, E., R. Buccolieri, E. Aarrevaara, F. Ippolito, R. Emmanuel, L. Perronace, and J. L. Santiago. 2020. “Impact of Urban Vegetation on Outdoor Thermal Comfort : Comparison between a Mediterranean City (Lecce, Italy) and a Northern European City (Lahti, Finland).” Forest 11 (228): 11020228. doi:https://doi.org/10.3390/f11020228.
- Gohain, K. J., P. Mohammad, and A. Goswami. 2021. “Assessing the Impact of Land Use Land Cover Changes on Land Surface Temperature over Pune City, India.” Quaternary International 575–576 (March 2020): 259–269. doi:https://doi.org/10.1016/j.quaint.2020.04.052.
- Gowda, P. H., J. Chävez, T. A. Howell, T. H. Marek, and L. L. New. 2008. “Surface Energy Balance Based Evapotranspiration Mapping in the Texas High Plains.” Sensors 8 (8): 5186–5201. doi:https://doi.org/10.3390/s8085186.
- Guha, S., H. Govil, A. Dey, and N. Gill. 2018. “Analytical Study of Land Surface Temperature with NDVI and NDBI Using Landsat 8 OLI and TIRS Data in Florence and Naples City, Italy.” European Journal of Remote Sensing 51 (1): 667–678. doi:https://doi.org/10.1080/22797254.2018.1474494.
- Gunawardena, K. R., M. J. Wells, and T. Kershaw. 2017. “Utilising Green and Bluespace to Mitigate Urban Heat Island Intensity.” Science of the Total Environment 584–585: 1040–1055. doi:https://doi.org/10.1016/j.scitotenv.2017.01.158.
- Guoyin, C., and D. Mingyi. 2009. “Relationship between Thermal Inertia and Urban Heat Sink in Beijing Derived from Satellite Images.” Joint Urban Remote Sensing Event 1–5. doi:https://doi.org/10.1109/URS.2009.
- Hawkins, T. W., A. J. Brazel, W. L. Stefanov, W. Bigler, and E. M. Saffell. 2004. “The Role of Rural Variability in Urban Heat Island Determination for Phoenix, Arizona.” Journal of Applied Meteorology 43 (3): 476–486. doi:https://doi.org/10.1175/1520-0450(2004)043<0476:trorvi>2.0.co;2.
- Huang, S. L., S. H. Wang, and W. W. Budd. 2009. “Sprawl in Taipei’s Peri-Urban Zone: Responses to Spatial Planning and Implications for Adapting Global Environmental Change.” Landscape and Urban Planning 90 (1–2): 20–32. doi:https://doi.org/10.1016/j.landurbplan.2008.10.010.
- Hung, T., D. Uchihama, S. Ochi, and Y. Yasuoka. 2006. “Assessment with Satellite Data of the Urban Heat Island Effects in Asian Mega Cities.” International Journal of Applied Earth Observation and Geoinformation 8 (1): 34–48. doi:https://doi.org/10.1016/j.jag.2005.05.003.
- Imhoff, M. L., P. Zhang, R. E. Wolfe, and L. Bounoua. 2010. “Remote Sensing of the Urban Heat Island Effect across Biomes in the Continental USA.” Remote Sensing of Environment 114 (3): 504–513. doi:https://doi.org/10.1016/j.rse.2009.10.008.
- Jin, M., R. E. Dickinson, and D. L. Zhang. 2005. “The Footprint of Urban Areas on Global Climate as Characterized by MODIS.” Journal of Climate 18 (10): 1551–1565. doi:https://doi.org/10.1175/JCLI3334.1.
- Kabano, P., S. Lindley, and A. Harris. 2021. “Evidence of Urban Heat Island Impacts on the Vegetation Growing Season Length in a Tropical City.” Landscape and Urban Planning 206 (October 2020): 103989. doi:https://doi.org/10.1016/j.landurbplan.2020.103989.
- Karimi, A., H. Sanaieian, H. Farhadi, and S. Norouzian-Maleki. 2020. “Evaluation of the Thermal Indices and Thermal Comfort Improvement by Different Vegetation Species and Materials in a Medium-Sized Urban Park.” Energy Reports 6: 1670–1684. doi:https://doi.org/10.1016/j.egyr.2020.06.015.
- Keeratikasikorn, C., and S. Bonafoni. 2018. “Satellite Images and Gaussian Parameterization for an Extensive Analysis of Urban Heat Islands in Thailand.” Remote Sensing 10 (5): 1–19. doi:https://doi.org/10.3390/rs10050665.
- Kendall, M. G. 1975. Rank Correlation Methods. London.: Charles Griffin.
- Kim, H., D. Gu, and H. Y. Kim. 2018. “Effects of Urban Heat Island Mitigation in Various Climate Zones in the United States.” Sustainable Cities and Society 41 (January): 841–52. doi:https://doi.org/10.1016/j.scs.2018.06.021
- Kowe, P., O. Mutanga, J. Odindi, and T. Dube. 2021. “Effect of Landscape Pattern and Spatial Configuration of Vegetation Patches on Urban Warming and Cooling in Harare Metropolitan City, Zimbabwe.” GIScience and Remote Sensing 58 (2): 261–280. doi:https://doi.org/10.1080/15481603.2021.1877008.
- Kuang, W., A. Liu, Y. Dou, L. Guiying, and L. Dengsheng. 2019. “Examining the Impacts of Urbanization on Surface Radiation Using Landsat Imagery.” GIScience and Remote Sensing 56 (3): 462–484. doi:https://doi.org/10.1080/15481603.2018.1508931.
- Kumar, R., V. Mishra, J. Buzan, R. Kumar, D. Shindell, and M. Huber. 2017. “Dominant Control of Agriculture and Irrigation on Urban Heat Island in India.” Scientific Reports 7 (1): 1–10. doi:https://doi.org/10.1038/s41598-017-14213-2.
- Li, D., W. Liao, A. J. Rigden, X. Liu, D. Wang, S. Malyshev, and E. Shevliakova. 2019a. “Urban Heat Island: Aerodynamics or Imperviousness?” Science Advances 5 (4): 1–5. doi:https://doi.org/10.1126/sciadv.aau4299.
- Li, H., Y. Zhou, X. Wang, X. Zhou, H. Zhang, and S. Sodoudi. 2019b. “Quantifying Urban Heat Island Intensity and Its Physical Mechanism Using WRF/UCM.” Science of the Total Environment 650: 3110–3119. doi:https://doi.org/10.1016/j.scitotenv.2018.10.025.
- Li, J., C. Song, L. Cao, F. Zhu, X. Meng, and W. Jianguo. 2011. “Impacts of Landscape Structure on Surface Urban Heat Islands: A Case Study of Shanghai, China.” Remote Sensing of Environment 115 (12): 3249–3263. doi:https://doi.org/10.1016/j.rse.2011.07.008.
- Li, J., F. Wang, F. Yingchun, B. Guo, Y. Zhao, and Y. Huafei. 2020. “A Novel SUHI Referenced Estimation Method for Multicenters Urban Agglomeration Using DMSP/OLS Nighttime Light Data.” IEEE Journal of Selected Topics in Applied Earth Observations and Remote Sensing 13: 1416–1425. doi:https://doi.org/10.1109/JSTARS.2020.2981285.
- Li, Q., H. Zhang, X. Liu, and J. Huang. 2004. “Urban Heat Island Effect on Annual Mean Temperature during the Last 50 Years in China.” Theoretical and Applied Climatology 79 (3–4): 165–174. doi:https://doi.org/10.1007/s00704-004-0065-4.
- Li, Y., L. Wang, M. Liu, G. Zhao, H. Tian, and Q. Mao. 2019c. “Associated Determinants of Surface Urban Heat Islands across 1449 Cities in China.” Advances in Meteorology 2019: 1–14. doi:https://doi.org/10.1155/2019/4892714.
- Lim, Y. K., M. Cai, E. Kalnay, and L. Zhou. 2005. “Observational Evidence of Sensitivity of Surface Climate Changes to Land Types and Urbanization.” Geophysical Research Letters 32 (22): 1–4. doi:https://doi.org/10.1029/2005GL024267.
- Lowe, S. A. 2016. “An Energy and Mortality Impact Assessment of the Urban Heat Island in the US.” Environmental Impact Assessment Review 56: 139–144. doi:https://doi.org/10.1016/j.eiar.2015.10.004.
- Malik, S., S. C. Pal, A. Sattar, S. K. Singh, B. Das, R. Chakrabortty, and P. Mohammad. 2020. “Trend of Extreme Rainfall Events Using Suitable Global Circulation Model to Combat the Water Logging Condition in Kolkata Metropolitan Area.” Urban Climate 32: 100599. doi:https://doi.org/10.1016/j.uclim.2020.100599.
- Mallick, J., A. Rahman, and C. K. Singh. 2013. “Modeling Urban Heat Islands in Heterogeneous Land Surface and Its Correlation with Impervious Surface Area by Using Night-Time ASTER Satellite Data in Highly Urbanizing City, Delhi-India.” Advances in Space Research 52 (4): 639–655. doi:https://doi.org/10.1016/j.asr.2013.04.025.
- Mann, H. B. 1945. “Nonparametric Tests Against Trend.” Econometrica 13 (3): 245–259. doi:https://doi.org/10.1016/j.annrmp.2004.07.001.
- Mehrotra, S., D. Subramanian, R. Bardhan, and A. Jana. 2021. “Effect of Surface Treatment and Built Form on Thermal Profile of Open Spaces: A Case of Mumbai, India.” Urban Climate 35 (November 2020): 100736. doi:https://doi.org/10.1016/j.uclim.2020.100736.
- Miles, V., and I. Esau. 2020. “Surface Urban Heat Islands in 57 Cities across Different Climates in Northern Fennoscandia.” Urban Climate 31 (August 2019): 100575. doi:https://doi.org/10.1016/j.uclim.2019.100575.
- Mohammad, P., and A. Goswami. 2019. “Temperature and Precipitation Trend over 139 Major Indian Cities: An Assessment over a Century.” Modeling Earth Systems and Environment 5 (4): 1481–1493. doi:https://doi.org/10.1007/s40808-019-00642-7.
- Mohammad, P., and A. Goswami. 2020. “Surface Urban Heat Island Variation over Major Indian Cities across Different Climatic Zone.” In EGU General Assembly Conference Abstracts, 6444. held online 4–8 May 2020: 22nd EGU General Assembly.
- Mohammad, P., and A. Goswami. 2021a. “A Spatio-Temporal Assessment and Prediction of Surface Urban Heat Island Intensity Using Multiple Linear Regression Techniques over Ahmedabad City, Gujarat.” Journal of the Indian Society of Remote Sensing 49 (5): 1091–1108. doi:https://doi.org/10.1007/s12524-020-01299-x.
- Mohammad, P., and A. Goswami. 2021b. “Spatial Variation of Surface Urban Heat Island Magnitude along the Urban-Rural Gradient of Four Rapidly Growing Indian Cities.” Geocarto International 1–23. doi:https://doi.org/10.1080/10106049.2021.1886338.
- Mohammad, P., A. Goswami, and S. Bonafoni. 2019. “The Impact of the Land Cover Dynamics on Surface Urban Heat Island Variations in Semi-Arid Cities : A Case Study in Ahmedabad City, India, Using Multi-Sensor/Source Data.” Sensors 19 (17): 3701. doi:https://doi.org/10.3390/s19173701.
- Oke, T. R. 1976. “The Distinction between Canopy and Boundary-Layer Urban Heat Islands.” Atmosphere 14 (4): 268–277. doi:https://doi.org/10.1080/00046973.1976.9648422.
- Oke, T. R. 1987. Boundary Layer Climates. New York: Methuen.
- Oke, T. R., and K. E. Runnalls. 2000. “Dynamics and Controls of the Near-Surface Heat Island of Vancouver, British Columbia.” Physical Geography 21 (4): 283–304. doi:https://doi.org/10.1080/02723646.2000.10642711.
- Oleson, K. W., G. B. Bonan, and J. Feddema. 2010. “Effects of White Roofs on Urban Temperature in a Global Climate Model.” Geophysical Research Letters 37 (3). doi:https://doi.org/10.1029/2009GL042194.
- Pablos, M., J. Martínez-Fernández, M. Piles, N. Sánchez, M. Vall-llossera, and A. Camps. 2016. “Multi-Temporal Evaluation of Soil Moisture and Land Surface Temperature Dynamics Using in Situ and Satellite Observations.” Remote Sensing 8 (7): 587. doi:https://doi.org/10.3390/rs8070587.
- Peel, M. C., B. L. Finlayson, and T. A. McMahon. 2007. “Updated World Map of the Koppen-Geiger Climate Classification.” Permafrost and Periglacial Processes 11 (3): 1633–1644. doi:https://doi.org/10.1002/ppp.421.
- Peng, S., S. Piao, P. Ciais, P. Friedlingstein, C. Ottle, F. M. Bréon, H. Nan, L. Zhou, and R. B. Myneni. 2012. “Surface Urban Heat Island across 419 Global Big Cities.” Environmental Science and Technology 46 (2): 696–703. doi:https://doi.org/10.1021/es2030438.
- Peng, S., Z. Feng, H. Liao, B. Huang, S. Peng, and T. Zhou. 2019. “Spatial-Temporal Pattern Of, and Driving Forces For, Urban Heat Island in China.” Ecological Indicators 96 (September 2017): 127–132. doi:https://doi.org/10.1016/j.ecolind.2018.08.059.
- Radhakrishnan, K., I. Sivaraman, S. K. Jena, S. Sarkar, and S. Adhikari. 2017. “A Climate Trend Analysis of Temperature and Rainfall in India.” Climate Change and Environmental Sustainability 5 (2): 146. doi:https://doi.org/10.5958/2320-642x.2017.00014.x.
- Raj, S., S. K. Paul, A. Chakraborty, and J. Kuttippurath. 2020. “Anthropogenic Forcing Exacerbating the Urban Heat Islands in India.” Journal of Environmental Management 257 (December 2019): 110006. doi:https://doi.org/10.1016/j.jenvman.2019.110006.
- Ranagalage, M., D. Dissanayake, Y. Murayama, R. C. Xinmin Zhang, P. E. Estoque, and T. Morimoto. 2018. “Quantifying Surface Urban Heat Island Formation in the World Heritage Tropical Mountain City of Sri Lanka.” ISPRS International Journal of Geo-Information 7 (9): 341. doi:https://doi.org/10.3390/ijgi7090341.
- Rizwan, A. M., Y. C. L. Dennis, and L. Chunho. 2008. “A Review on the Generation, Determination and Mitigation of Urban Heat Island.” Journal of Environmental Sciences 20 (1): 120–128. doi:https://doi.org/10.1016/S1001-0742(08)60019-4.
- Sanga-Ngoie, K., K. Iizuka, and S. Kobayashi. 2012. “Estimating CO2 Sequestration by Forests in Oita Prefecture, Japan, by Combining LANDSAT ETM+ and ALOS Satellite Remote Sensing Data.” Remote Sensing 4 (11): 3544–3570. doi:https://doi.org/10.3390/rs4113544.
- Schatz, J., and C. J. Kucharik. 2014. “Seasonality of the Urban Heat Island Effect in Madison, Wisconsin.” Journal of Applied Meteorology and Climatology 53 (10): 2371–2386. doi:https://doi.org/10.1175/JAMC-D-14-0107.1.
- Sen, K. P. 1968. “Estimates Of The Regression Coefficient Based On Kendall ’ s Tau Pranab Kumar Sen.” Journal of the American Statistical Association 63 (324): 1379–1389. doi:https://doi.org/10.1080/01621459.1968.10480934.
- Senay, G. B., M. E. Budde, and J. P. Verdin. 2011. “Enhancing the Simplified Surface Energy Balance (SSEB) Approach for Estimating Landscape ET: Validation with the METRIC Model.” Agricultural Water Management 98 (4): 606–618. doi:https://doi.org/10.1016/j.agwat.2010.10.014.
- Shastri, H., B. Barik, S. Ghosh, C. Venkataraman, and P. Sadavarte. 2017. “Flip Flop of Day-Night and Summer-Winter Surface Urban Heat Island Intensity in India.” Scientific Reports 7 (April 2016): 1–11. doi:https://doi.org/10.1038/srep40178.
- Shepherd, J. M. 2005. “A Review of Current Investigations of Urban-Induced Rainfall and Recommendations for the Future.” Earth Interactions 9 (12): 1–27. doi:https://doi.org/10.1175/EI156.1.
- Simwanda, M., M. Ranagalage, R. C. Estoque, and Y. Murayama. 2019. “Spatial Analysis of Surface Urban Heat Islands in Four Rapidly Growing African Cities.” Remote Sensing 11 (14): 1–20. doi:https://doi.org/10.3390/rs11141645.
- Sohrabinia, M., W. Rack, and P. Zawar-Reza. 2014. “Errata: Soil Moisture Derived Using Two Apparent Thermal Inertia Functions over Canterbury, New Zealand.” Journal of Applied Remote Sensing 8 (1): 089999. doi:https://doi.org/10.1117/1.jrs.8.089999.
- Stewart, I. D., and T. R. Oke. 2012. “Local Climate Zones for Urban Temperature Studies.” Bulletin of the American Meteorological Society 93 (12): 1879–1900. doi:https://doi.org/10.1175/BAMS-D-11-00019.1.
- Susca, T., S. R. Gaffin, and G. R. Dell’Osso. 2011. “Positive Effects of Vegetation: Urban Heat Island and Green Roofs.” Environmental Pollution 159 (8–9): 2119–2126. doi:https://doi.org/10.1016/j.envpol.2011.03.007.
- Taleghani, M., and U. Berardi. 2018. “The Effect of Pavement Characteristics on Pedestrians’ Thermal Comfort in Toronto.” Urban Climate 24: 449–459. doi:https://doi.org/10.1016/j.uclim.2017.05.007.
- United Nations. 2018. World urbanization prospects: the 2018 revision. [accessed on 2020 Aug 7]. Available from: https://population.un.org/wup/Publications/Files/WUP2018-Report.pdf
- Verstraeten, W. W., F. Veroustraete, C. J. Sande, I. Grootaers, and J. Feyen. 2006. “Soil Moisture Retrieval Using Thermal Inertia, Determined with Visible Andthermal Spaceborne Data, Validated for European Forests.” Remote Sensing of Environment 101 (3): 299–314. doi:https://doi.org/10.1016/j.rse.2005.12.016.
- Voogt, J. A., and T. R. Oke. 2003. “Thermal Remote Sensing of Urban Climates.” Remote Sensing of Environment 86 (3): 370–384. doi:https://doi.org/10.1016/S0034-4257(03)00079-8.
- Wan, Z. 2014. “New Refinements and Validation of the Collection-6 MODIS Land-Surface Temperature/Emissivity Product.” Remote Sensing of Environment 140: 36–45. doi:https://doi.org/10.1016/j.rse.2013.08.027.
- Wang, J., B. Huang, D. Fu, and P. M. Atkinson. 2015. “Spatiotemporal Variation in Surface Urban Heat Island Intensity and Associated Determinants across Major Chinese Cities.” Remote Sensing 7 (4): 3670–3689. doi:https://doi.org/10.3390/rs70403670.
- Wang, L., and J. J. Qu. 2009. “Satellite Remote Sensing Applications for Surface Soil Moisture Monitoring: A Review.” Frontiers of Earth Science in China 3 (2): 237–247. doi:https://doi.org/10.1007/s11707-009-0023-7.
- Weng, Q., D. Lu, and J. Schubring. 2004. “Estimation of Land Surface Temperature-Vegetation Abundance Relationship for Urban Heat Island Studies.” Remote Sensing of Environment 89 (4): 467–483. doi:https://doi.org/10.1016/j.rse.2003.11.005.
- Weng, Q., M. K. Firozjaei, A. Sedighi, M. Kiavarz, and S. K. Alavipanah. 2019. “Statistical Analysis of Surface Urban Heat Island Intensity Variations: A Case Study of Babol City, Iran.” GIScience and Remote Sensing 56 (4): 576–604. doi:https://doi.org/10.1080/15481603.2018.1548080.
- Wu, X., G. Wang, R. Yao, L. Wang, Y. Deqing, and X. Gui. 2019. “Investigating Surface Urban Heat Islands in South America Based on MODIS Data from 2003-2016.” Remote Sensing 11 (10). doi:https://doi.org/10.3390/rs11101212.
- Xian, G., H. Shi, R. Auch, K. Gallo, Q. Zhou, W. Zhuoting, and M. Kolian. 2021. “The Effects of Urban Land Cover Dynamics on Urban Heat Island Intensity and Temporal Trends.” GIScience and Remote Sensing: 1–15. doi:https://doi.org/10.1080/15481603.2021.1903282.
- Yang, Q., X. Huang, and J. Li. 2017. “Assessing the Relationship between Surface Urban Heat Islands and Landscape Patterns across Climatic Zones in China.” Scientific Reports 7 (1): 1–11. doi:https://doi.org/10.1038/s41598-017-09628-w.
- Yang, Q., X. Huang, and Q. Tang. 2019. “The Footprint of Urban Heat Island Effect in 302 Chinese Cities: Temporal Trends and Associated Factors.” Science of the Total Environment 655: 652–662. doi:https://doi.org/10.1016/j.scitotenv.2018.11.171.
- Yao, R., L. Wang, X. Huang, J. Chen, L. Jiarui, and Z. Niu. 2018a. “Less Sensitive of Urban Surface to Climate Variability than Rural in Northern China.” Science of the Total Environment 628–629: 650–660. doi:https://doi.org/10.1016/j.scitotenv.2018.02.087.
- Yao, R., L. Wang, X. Huang, Y. Niu, Y. Chen, and Z. Niu. 2018b. “The Influence of Different Data and Method on Estimating the Surface Urban Heat Island Intensity.” Ecological Indicators 89 (January): 45–55. doi:https://doi.org/10.1016/j.ecolind.2018.01.044.
- Yow, D. M. 2007. “Urban Heat Islands: Observations, Impacts, and Adaptation.” Geography Compass 1 (6): 1227–1251. doi:https://doi.org/10.1111/j.1749-8198.2007.00063.x.
- Yuan, F., and M. E. Bauer. 2007. “Comparison of Impervious Surface Area and Normalized Difference Vegetation Index as Indicators of Surface Urban Heat Island Effects in Landsat Imagery.” Remote Sensing of Environment 106 (3): 375–386. doi:https://doi.org/10.1016/j.rse.2006.09.003.
- Yuanzheng, L. I., W. Lan, Z. Liping, L. I. U. Min, and Z. Guosong. 2019. “Monitoring Intra-Annual Spatiotemporal Changes in Urban Heat Islands in 1449 Cities in China Based on Remote Sensing.” Chinese Geographical Science 29 (December): 905–916. doi:https://doi.org/10.1007/s11769-019-1080-9.
- Yue, W., X. Liu, Y. Zhou, and Y. Liu. 2019. “Impacts of Urban Configuration on Urban Heat Island: An Empirical Study in China Mega-Cities.” Science of the Total Environment 671: 1036–1046. doi:https://doi.org/10.1016/j.scitotenv.2019.03.421.
- Zhang, P., M. L. Imhoff, R. E. Wolfe, and L. Bounoua. 2010. “Characterizing Urban Heat Islands of Global Settlements Using MODIS and Nighttime Lights Products.” Canadian Journal of Remote Sensing 36 (3): 185–196. doi:https://doi.org/10.5589/m10-039.
- Zhao, C., L. R. Jennifer, Q. W. Jensen, N. Currit, and R. Weaver. 2020. “Use of Local Climate Zones to Investigate Surface Urban Heat Islands in Texas.” GIScience and Remote Sensing 1–19. doi:https://doi.org/10.1080/15481603.2020.1843869.
- Zhao, L., X. Lee, R. B. Smith, and K. Oleson. 2014. “Strong Contributions of Local Background Climate to Urban Heat Islands.” Nature 511 (7508): 216–219. doi:https://doi.org/10.1038/nature13462.
- Zhao, X., N. Li, and C. Ma. 2012. “Residential Energy Consumption in Urban China: A Decomposition Analysis.” Energy Policy 41: 644–653. doi:https://doi.org/10.1016/j.enpol.2011.11.027.
- Zheng, Q., Q. Weng, and K. Wang. 2021. “Characterizing Urban Land Changes of 30 Global Megacities Using Nighttime Light Time Series Stacks.” ISPRS Journal of Photogrammetry and Remote Sensing 173 (January): 10–23. doi:https://doi.org/10.1016/j.isprsjprs.2021.01.002.
- Zhou, B., D. Rybski, and J. P. Kropp. 2017. “The Role of City Size and Urban Form in the Surface Urban Heat Island.” Scientific Reports 7 (1): 1–9. doi:https://doi.org/10.1038/s41598-017-04242-2.
- Zhou, D., J. Xiao, S. Bonafoni, C. Berger, K. Deilami, Y. Zhou, S. Frolking, R. Yao, Z. Qiao, and J. A. Sobrino. 2019. “Satellite Remote Sensing of Surface Urban Heat Islands: Progress, Challenges, and Perspectives.” Remote Sensing 11 (1): 1–36. doi:https://doi.org/10.3390/rs11010048.
- Zhou, D., S. Zhao, L. Zhang, G. Sun, and Y. Liu. 2015a. “The Footprint of Urban Heat Island Effect in China.” Scientific Reports 5: 2–12. doi:https://doi.org/10.1038/srep11160.
- Zhou, D., S. Zhao, L. Zhang, and S. Liu. 2016. “Remotely Sensed Assessment of Urbanization Effects on Vegetation Phenology in China’s 32 Major Cities.” Remote Sensing of Environment 176 (April): 272–281. doi:https://doi.org/10.1016/j.rse.2016.02.010.
- Zhou, D., S. Zhao, S. Liu, L. Zhang, and C. Zhu. 2014. “Surface Urban Heat Island in China’s 32 Major Cities: Spatial Patterns and Drivers.” Remote Sensing of Environment 152: 51–61. doi:https://doi.org/10.1016/j.rse.2014.05.017.
- Zhou, W., G. Huang, and M. L. Cadenasso. 2011. “Does Spatial Configuration Matter? Understanding the Effects of Land Cover Pattern on Land Surface Temperature in Urban Landscapes.” Landscape and Urban Planning 102 (1): 54–63. doi:https://doi.org/10.1016/j.landurbplan.2011.03.009.
- Zhou, Y., L. Xuecao, G. R. Asrar, S. J. Smith, and M. Imhoff. 2018. “A Global Record of Annual Urban Dynamics (1992–2013) from Nighttime Lights.” Remote Sensing of Environment 219 (September): 206–220. doi:https://doi.org/10.1016/j.rse.2018.10.015.
- Zhou, Y., S. J. Smith, K. Zhao, M. Imhoff, A. Thomson, B. Bond-Lamberty, G. R. Asrar, X. Zhang, H. Chunyang, and C. D. Elvidge. 2015b. “A Global Map of Urban Extent from Nightlights.” Environmental Research Letters 10 (5): 1–11. doi:https://doi.org/10.1088/1748-9326/10/5/054011.