
 ?Mathematical formulae have been encoded as MathML and are displayed in this HTML version using MathJax in order to improve their display. Uncheck the box to turn MathJax off. This feature requires Javascript. Click on a formula to zoom.
ABSTRACT
Recent improvements in the spatial, temporal, and spectral resolution of satellite images necessitate (semi-)automated classification and information extraction approaches. Therefore, we developed an integrated fuzzy object-based image analysis and deep learning (FOBIA-DL) approach for monitoring the land use/cover (LULC) and respective changes and compared it to three machine learning (ML) algorithms, namely the support vector machine (SVM), random forest (RF), and classification and regression tree (CART). We investigated LULC impacts on drought by analyzing Landsat satellite images from 1990 to 2020 for the Urmia Lake area in northern Iran. In the FOBIA-DL approach, following the initial segmentation steps, object features were identified for each LULC class. We then derived their respective attributes using fuzzy membership functions and deep convolutional neural networks (DCNNs), a deep learning method. The Fuzzy Synthetic Evaluation and Dempster-Shafer Theory (FSE-DST) also applied to validate and carryout the spatial uncertainties. Our results indicate that the FOBIA-DL, with an accuracy of 90.1% to 96.4% and a spatial certainty of 0.93 to 0.97, outperformed the other approaches, closely followed by the SVM. Our results also showed that the integration of Fuzzy-OBIA and DCNNs could improve the strength and robustness of the OBIA’s decision rules, while the FSE-DST approach notably improved the spatial accuracy of the object-based classification maps. While object-based image analysis (OBIA) is already considered a paradigm shift in GIScience, the integration of OBIA with fuzzy and deep learning creates more flexibility and robust OBIA decision rules for image analysis and classification. This research integrated popular data-driven approaches and developed a novel methodology for image classification and spatial accuracy assessment. From the environmental perspective, the results of this research support lake restoration initiatives by decision-makers and authorities in applications such as drought mitigation, land use management and precision agriculture programs.
1. Introduction
Remote sensing methods have become indispensable for the environmental evaluation and monitoring of larger areas. The range of satellite sensors and the volume of remote sensing data has increased, as has the user base and the variety of methods and methodologies to process large amounts of data. The number of satellites and particular initiatives, such as the European Copernicus program with its Sentinel satellites, enable the acquisition of higher temporal resolution data (Cresson Citation2018). Some scientists have even identified revolutionary effects resulting from the transfer of technological developments from other areas to the remote sensing domain (Sudmanns et al. Citation2020). A brief review of research in this field reveals a wide range of existing satellite image analyzes and respective demands for applications. Particularly the more recent publications emphasize the need for cost-effective and fast data-driven methods (Chen et al. Citation2014; Zou et al. Citation2015; Chen, Zhao, and Jia Citation2015; Romero, Gatta, and Camps-Valls Citation2016; Cheng, Zhou, and Han Citation2016; Marmanis et al. Citation2016; Yu, Wu, and Luo Citation2017; Kussul et al. Citation2017; SharSharma et al. Citation2017; Vetrivel et al. Citation2018; Talukdar et al. Citation2020; Xia et al. Citation2020; Ghasemi, Karimzadeh, and Feizizadeh Citation2021). There is a growing demand for and interest in accurate and semi-automated data-driven approaches in the domain of remote sensing. The fields of remote sensing and earth observation science strive to propose, develop, and optimize new techniques and methods for data acquisition, information extraction and classification. The range of methods and techniques widens significantly by drawing from other fields, such as computer science or computer vision. More and more machine learning methods contribute to the field of remote sensing.
Machine learning (ML) methods are increasingly used for remote sensing image processing tasks (Cresson Citation2018; Abdi Geshlagi, and Feizizadeh Citation2021; Feizizadeh et al. Citation2021). According to Ma et al. (Citation2019) and Talukdar et al. (Citation2020), since around 2015, machine learning techniques and, in particular, DL algorithms have received significant attention in the remote sensing community. Technically speaking, the DL method represent a high potential for exploring the nonlinear patterns in dada. This technique has also the capability to be trained various image context features efficiently which leads to coincides it as it as effective data driven approach. Artificial neural networks are based on biological neural networks in several ways, with CNNs (a form of artificial neural network) being influenced by animal visual cortex (Chartrand et al. Citation2017; Yamashita et al. Citation2018). These methods have been efficiently used in many applications, such as land use and land cover (LULC) classification, change detection, agricultural crop monitoring, landslide detection and environmental degradation. In the remote sensing domain, ML techniques are widely used for LULC classifications. In brief, monitoring and prediction of LULC dynamics are used for evaluating and understanding landscape transformations (Mas et al. Citation2017), providing critical information for a wide range of activities and applications (e.g. land use planning, food security assessment, environmental degradation, global warming, natural hazards mitigation, climate change studies etc) (Hoan et al. Citation2018; Dutta et al. Citation2019). We, therefore, need efficient, fast, semi/automated and cost-effective data-driven approaches for monitoring and mapping LULC (Naboureh et al. Citation2017).
Object-Based Image Analysis (OBIA) has been considered an alternative approach to the traditional pixel-based image processing methods that constitute the range of remote sensing approaches. OBIA (also called Geographic Object-Based Image Analysis, or GEOBIA), which has been called a paradigm shift in remote sensing (Blaschke Citation2010), incorporates segmentation concepts in an essential initial step. It integrates spatial and spectral information and concepts through grouping and deriving object-based features, paving the way for spatial modeling (Blaschke Citation2010; Blaschke, Kelly, and Merschdorf Citation2015). Initially, OBIA methods aimed to precisely map the Earth’s multi-scale features (e.g. building, tree and the field) using high spatial resolution imagery through evolving image objects and combined radiometric and spatial analyses. The spatial dimensions of objects such as distances, neighborhoods, patterns, topologies, and geometric characteristics can then be used in a classification. More recently, semantics and ontologies have gained more prominence in the field of OBIA, partially triggered by interoperability requirements for the use of auxiliary data from geographic information systems (GIS). The OBIA methodology has also been characterized by its central role of almost natural language equivalent rule sets that also play an important role in fusing remote sensing and spatial assessment techniques (Blaschke, Kelly, and Merschdorf Citation2015). Early research indicated that OBIA, while being capable of achieving high precision, also requires maximum human supervision and that the best arrangement for an image usually cannot be extrapolated to another distinct image (Guirado et al. Citation2017).
OBIA is widely known as one of the most efficient methodologies that combines supervised learning, expert knowledge, and data-driven approaches (for an overview, see Kucharczyk et al. Citation2020). The efficiency of OBIA is based on the integration of spatial and spectral properties together with spatial modeling capabilities. However, in some applications, such as LULC mapping, uncertainty and ambiguous tends to be inevitable due to the large variety and similarity of the spatial and spectral characteristics when classifying LULC maps (Feizizadeh and Kienberger Citation2017). The vagueness, uncertainty and ambiguity of the input data are essentially intertwined with the problem and precision of the inferences, which depend on the quality of LULC maps (Maboudi et al. Citation2018). To overcome this issue, the integration of OBIA with fuzzy decision rules could provide an efficient image classification approach that has also been addressed by earlier research (e.g. Hofmann, Blaschke, and Strobl Citation2011; Aksoy and Ercanoglu Citation2012; Najafi et al. Citation2018; Feizizadeh Citation2018; Maboudi et al. Citation2018; Moradpour et al. Citation2020; Feizizadeh et al. Citation2020; Najafi, Feizizadeh, and Navid Citation2021). Fuzzy logic is an effective approach that interprets vague, ambiguous, and uncertain information (e.g. image objects with similar object values for describing the LULC classes) when implementing OBIA rule sets for the task of LULC classification. Fuzzy membership values of the image objects are heuristic information that enables us to classify objects efficiently (Maboudi et al. Citation2018; Feizizadeh et al. Citation2021).
The combination of fuzzy membership values and OBIA features (in short, FOBIA) facilitates the robust classification decision rules of OBIA. However, the FOBIA approach is still semi-automated, and the recent progress in deep learning methods enables efficient and automated feature analysis approaches. Deep learning and convolutional neural networks (CNN) in particular, allow us to capture the feature information using the network system and to improve the accuracy of the results. The CNN technique is based on the direct transfer of the data to the network while aiming to achieve an efficient performance by means of eliminating the large and challenging feature engineering stage of the whole process (Xia et al. Citation2020).
In terms of LULC mapping, the semantic segmentation of digital satellite images permits satellite image pixels to be classified into several LULC classes based on the similarity of their spectral properties. Thus, deep convolutional neural networks (DCNNs) methods have recently been implemented to solve some of the remaining issues that have been reported (Schmidhuber Citation2015; LeCun, Bengio, and Hinton Citation2015). DL-CNN have been successfully applied in computer vision tasks such as image processing (Alhassan et al. Citation2019). This algorithm’s capability to detect “low-level and high-level” features within the hierarchical approach makes this technique an efficient method for dealing with complex computer vision issues such as semantic segmentation of images, which is critical for LULC mapping (Henry et al. Citation2019; Alhassan et al. Citation2019). In this regard, central to the emerging paradigm shift toward data-intensive science, machine learning approaches are becoming increasingly significant in remote sensing. Particularly deep learning has proven to be both a major success and an exceptionally powerful tool in various domains (Zhu et al. Citation2017; Kazemi Garajeh et al. Citation2021). Likewise, since around 2017, deep learning algorithms and OBIA have been used in at least a loose combination, particularly for identifying objects in computer vision, with promising results (Guirado et al. Citation2017). However, only more recently have scientists coupled DCNN models and OBIA directly. Ghorbanzadeh et al. (Citation2020) used DCNN models as input data for an OBIA knowledge-based semantic classification method. Unlike standard pixel-based classification methods that are usually applied for the DCNN model, their integrated approach aggregates DCNNs results on separately delineated objects as the basic units of a rule-based classification.
Considering the recent advances in remote sensing and Earth observation technologies, efficient and cost-effective data-driven machine-based approaches need to be proposed and applied. Thus, to analyze the capability of integrated fuzzy object-based image analysis with deep learning (FOBIA-DL) and machine learning algorithms for LULC monitoring, this research compares the efficiency of an integrated FOBIA-DL against the three well-known machine learning algorithms of support vector machine (SVM), random forest (RF), and classification and regression tree (CART). The LULC changes and associated impact on the severe and recurring droughts in the Urmia Lake region in northern Iran were also evaluated from the environmental perspective. The lake drought is a critical environmental problem in Iran because it causes extensive soil salinity and reduces the productivity of agricultural lands, giving rise to salt-dust storms and threatening food security and the lives and livelihoods of the 7.5 million inhabitants residing in the Urmia Lake Basin.
2. Study area
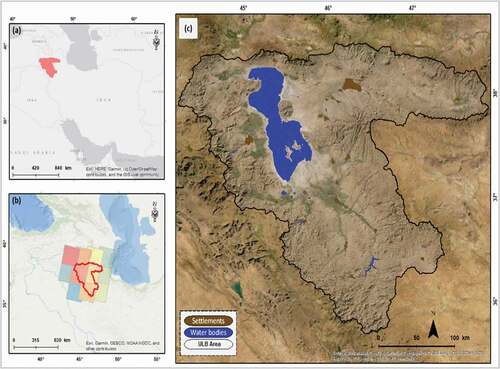
The study area is the Urmia Lake Basin (ULB) located in northwest Iran. Situated at an elevation of 1286 m above sea level, Urmia Lake is the 25th largest lake and the second-largest hypersaline lake in the world (), with an area of originally 5200 km2. Urmia Lake is a shallow saline lake surrounded by the East and West Azerbaijan Provinces. According to the latest national census, about 7 million (10% of Iran’s total population) are residing in the two provinces adjacent to the lake. ULB is renowned for horticulture, agriculture, animal husbandry, manufacturing of handicrafts, mining, apiculture, industry, and business, for tourism and recreational activities, and regionally it is important for Artemia harvesting and salt extraction (Ghorbanzadeh et al. Citation2019a). The climate in the ULB is extreme and continental, primarily influenced by the mountains around the lake. Significant seasonal fluctuations in the air temperature occur in this semi-arid area. The mean annual precipitation is 341 mm. The region’s lowest and highest temperature varies from 0 to −23°C in winter and can reach up to 40°C during the summer. From this perspective, Urmia Lake is a vital resource for the region, as it helps to moderate extreme temperatures and makes the climate conducive to the growth of fungi and fauna. On the other hand, sea breeze circulation, penetrating inland and local heights, has a pronounced impact on the local climate and creates local clouds at low levels (Mardi et al. Citation2018; Kazemi Garajeh et al. Citation2021). Due to extensive land use/cover change, extending agricultural activities and population growth in the ULB, Urmia Lake is now facing several environmental problems. Historical data shows that the lake has been drying up since 2000, which has already caused several environmental problems. Extensive soil salinization, dust storms and health issues are some of the observed environmental threats in the ULB.
Figure 1. Location of the study area
3. Dataset
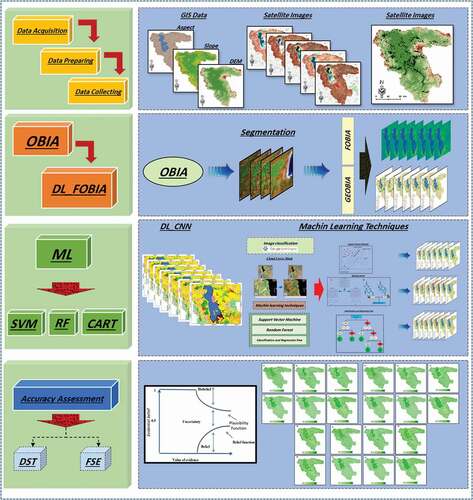
As indicated before, the main objective of this research is to apply and compare the efficiency of FOBIA-DL against the SVM, RF, and CART ML algorithms for a trend analysis of LULC changes and spatial modeling of the environmental issues associated with LULC changes. depicts the main aspects of the research methodology. To achieve the research objectives, we analyzed a time series of Landsat satellite images together with ground control points and a GIS dataset comprised of a digital elevation model (DEM) and its derivates (slope, aspect). The DEM data was developed from topography maps at a scale of 1/25,000 and a spatial resolution of 10 meters.
To capture and monitor the extensive horticultural and agricultural activities, we obtained satellite images for July of 1990, 1995, 2000, 2005, 2010, 2015 and 2020 () . The month of July was selected because this is the time of the year when the pasture lands experience growth, which makes it easier to distinguish them from agricultural crops in spectral imagery. For each study year, we obtained 3 satellite images (from between the 5th and the 30th of July), and the most suitable images were selected based on the cloud coverage and image enmeshment properties. To use the satellite images as a time series, we applied pre-processing steps (e.g. layers stack, mosaic, atmospheric and radiometric correction). The LULC classes to be monitored from 1990 to 2020 were defined based on the characteristics of the study area, as bare lands, cultivated lands, dry and fallow lands, orchards, pasture and rangelands, rock outcrops, salty lands and settlement areas, water body and wet lands.
Table 1. List of satellite images and their details
To train and analyze the accuracy of the intended data-driven approaches, a total of 35,000 sample points were taken into account for LULC mapping in the considered study period from 1990–2020. 70% of the dataset (24,500 points) was used as training data and 30% (9500 points) as ground control points for the accuracy assessment. This step was carried out separately for each study year (1990, 2000, 2005, 2010, 2015 and 2020) with 5000 training data points for each year. We obtained the training data and ground control points for the year 2020 during a field visit based on the random sampling, whereas for 2015, 2010, 2005, and 2000 we obtained historical GPS data from the Organization of Agriculture Jahad (OAJ) of West and East Azerbaijan provinces. For this goal, we employed analog aerial photography in the scale of 1/10,000-1/20,000 and the agricultural LULC and cadaster maps (with 1/2000 scale) and historical Google Earth images to collect the training and ground control points.
Figure 2. Methodological research scheme
4. Object-based image analysis
4.1. Image segmentation
Image segmentation is typically the initial step of OBIA workflows in which pixels are grouped into image objects. The generated objects contain information about their shape, geometric-, textural – and statistical properties, and about the relationships between the objects and the thematic layers (Baatz et al. Citation2004). The choice of segmentation parameters will directly affect the size and type of the image objects (Aksoy and Ercanoglu Citation2012). The multi-resolution segmentation algorithm is considered an efficient segmentation algorithm in OBIA and is very widely used, particularly through its integration in the prominent commercial software eCognition. This multi-resolution segmentation is a bottom-up region growing process that merges similar pixels and homogenous regions into objects. An important aspect is the so-called scale parameter, which specifies a heterogeneity threshold for the spectral information but also incorporates shape and compactness parameters that can be defined by the user (Eisank, Smith, and Hillier Citation2014). Determining the most efficient scale, shape, and compactness parameters has always been a serious challenge in the segmentation process for OBIA (Feizizadeh et al. Citation2021). The scale, shape and compactness are critical parameters that ultimately determine the size of an image object. How these parameters are defined depends on the purpose of the study, the data quality, and the characteristics of the case study area. To obtain efficient parameters, OBIA employs several user-defined segmentation scales for image analysis and classification. Such user-defined parameters might have a certain inherent uncertainty. To overcome this uncertainty, Drǎguţ, Tiede, and Levick (Citation2010) proposed estimating the scale parameter (ESP) as a tool to compute segmentation scales and parameters statistically. The ESP tool allows for a fast estimation of scale parameters for a multi-resolution segmentation. The ESP aims to generate segments based on the user-defined values (e.g. shape, compactness, and scale parameter) and the computed local variance (LV) as the mean standard deviation of the objects (Drǎguţ, Tiede, and Levick Citation2010). Therefore, the graphics of LV can be applied to compute the suitable scale parameters in relation to the data properties of the scene. The rate of change (ROC) can be obtained from Equationequation 1(1)
(1) to assess the dynamics of LV from one object level to another:
Where L = LV at the target level and L – 1 = LV at next lower level.
The ROC is a technical indicator employed in stock market analyses to compute ‘the value of stock’s price’. We assume that the peak point of the rate of change of the local variance graph shows the surface of the image objects that can be segmented in the most appropriate manner (Lees Citation2006). In this study, the ESP tool was applied to obtain the optimal scale parameter of the segmentation process. To obtain the final scale parameter, several scale parameters were examined and considered before selecting the most appropriate scale based on both spatial features and derivative values. The segmentation was repeated for three scales (15, 20 and 25) while using the same shape factor (0.6) and compactness factor (0.4).
4.2. Object-based features applied for LULC mapping
The object-based features were used to derive the LULC class information from the satellite images to develop the LULC maps. We applied spectral, spatial, geometric and contextual object features to detect the target LULC classes. We also used field operation data to examine the efficiency of each algorithm for deriving the LULC classes. The field operation data were collected by GPS to be used as training data for all classes. We used the existing LULC map of the study area along with historical aerial photography and time series cadaster maps of the agricultural lands to obtain historical training data. Accordingly, for each period of the study year, 3000 training sites (in sum 21,000 points) were used as sample data to obtain the thresholds of the object features and to train the deep learning algorithms. The object features also need to be identified and applied through a semi-automated rule set. Thus, it is critical to identify the context and efficiency of object-based features to map each LULC class. Therefore, we took the training data into account, along with the efficiency of related spatial and spectral object features for each LULC class obtained through fuzzy-based threshold values. Based on the spectral and spatial characteristics of each LULC class, the respective object features were identified, and their efficiency was evaluated by correlating the training data with the membership value of each object feature. represents some of the selected object features and their respective computed values. We used 50 samples for each LULC class to obtain the threshold values. The samples were collocated in the field using GPS. Then, the object feature values for all samples of each LULC class were computed. The majority of feature values were computed, and the threshold values were determined as shown in . The equation and their components for the selected object features are also represented in . In addition to the object features, we also applied a number of spectral indices, namely the Green Normalized Difference Vegetation Index (GNDVI), Specific Leaf Area Vegetation Index (SLAVI), Modification of Normalized Difference Water Index (MNDWI), Normalized Built-up Index (NDBI), Relief and TRI indices ().
Table 2. LULC classes and their respective thresholds obtained for object features
Table 3. The implemented object features and their correlation between properties and quantifiable attributes
4.3. Fuzzy-OBIA based deep learning implementation
Deep learning (DL), as discussed in the introduction section, is a paradigm shift in remote sensing. Ma et al. (Citation2019), in their comprehensive meta-analysis and review of deep learning applications in remote sensing, pointed out that since 2015 the remote sensing community has shifted its attention to DL algorithms. DL techniques have been successfully applied in several application domains, such as LULC classification (Liu et al. Citation2018; Tsagkatakis et al. Citation2019; Ma et al. Citation2019), change detection and time series analysis (Liu, Pan, and Dezert Citation2016; Das and Ghosh Citation2016; Cai et al. Citation2018), landslide mapping (Feizizadeh et al. Citation2017; Ghorbanzadeh et al. Citation2019b) and the retrieval of precipitation data.
In the context of remote sensing image processing, we consider an integration of OBIA and DL algorithms as a promising solution for LULC classification problems. Such an integrated approach will allow us to employ OBIA’s class modeling capabilities, together with the power of DL. Several studies (Zhao et al. Citation2017; Zhu et al. Citation2017; Tong et al. Citation2018; Huang, Zhao, and Song Citation2018; Ma et al. Citation2019) confirmed that CNNs are effective DL algorithms that can, in principle, be integrated with OBIA. According to Zhu et al. (Citation2017), CNNs can be used to extract mid – and high-level abstract features from raw object images based on convolutional and assembling layers (i.e. feature maps produced by object features in OBIA, such as mean, standard deviation, shape index, etc.). Earlier studies that integrated CNNs and OBIA for image classification have already confirmed that the particular combination of object feature representations trained by CNNs is an efficient approach for large-scale semantic image segmentation, recognition, classification and change detection analysis (Zhu et al. Citation2017).
The CNNs can be used for a variety of applications, particularly in the domain of remote sensing time series analysis (e.g. change detection mapping); the time index t can be used as an integer value. The convolution can be determined as follows:
EquationEquation 2(2)
(2) can be applied for time series image analysis in image processing.
In this research, we considered the DCNN framework proposed by Namatēvs (Citation2017), whereby 5 layers in 5 steps were adapted based on the approach implementation setting in Python environment to carry out the Fuzzy-OBIA-DL-CNN. The 5 steps are as follow:
A) Input layer: every DCNN input layer is a multidimensional array of data. In the context of image processing, the input layer can be considered as image pixels or their transformation, such as object features values. In this research, we employed the outcome of Fuzzy-OBIA as input layers for our DCNN implementation. Therefore, after identifying the relevant object features for the LULC classes, the fuzzy membership values for whole image objects were computed and exported to Python as input for the DCNN.
B) Convolutional layers or convolutional stage: this layer is the main building block of DCNNs that extracts distinct features from the input layer by employing the training data. In our case, we employed the computed FOBIA values to compute the object feature spaces for each of the considered LULC classes. In this step, we also introduced 5000 training data for each study year.
C) Non-linear layer or detection stage: this is a critical stage that detects each linear activation through the non-linear activation function by introducing the non-linearity into neural networks and training models that are more complex (e.g. FOBIA-based LULC classification).
D) The pooling (also known as down sampling or subsampling) layer aims to reduce the size of the feature maps (e.g. object based features) through compressing features and the computational complexity of the network. Technically, this step produces down-sampled versions of the input map in order to reduce the dimensionality of the object-based feature maps (e.g. the relevant features for the LULC classification were identified and are listed in ). In the case of our DCNN implementation, this step leads to a reduced dimensionality of the initial input layers of the fuzzy-based object feature maps for classifying themes into LULC classes.
E) Fully connected layer: this is the last step of a CNN implementation when developing a generic multi-layer network. In this step, the outcomes of all four previous layers are connected to all activations (the LULC classes in our case) to extract features to train another classifier using the training data. To implement the FOBIA-DL, this step employs the computed fuzzy membership values for LULC classes and performs the classification using the DCNN. Thus, in this step, we reduce the dimensionality of the fuzzy-based feature maps (the fourth layer is the output of step D) being classified to obtain the LULC map based on the obtained training dataset.
4.4. Implementation of machine learning algorithms
To compare the efficiency of Fuzzy-OBIA-DL with machine learning algorithms, we also tested the following three machine learning (ML) algorithms: support vector machine (SVM), random forest (RF), and classification and regression tree (CART). Due to the popularity of the ML algorithms for satellite image classification, several ML algorithms have been proposed and applied in earlier research (Talukdar et al. Citation2020; Ebrahimy et al. Citation2021; Ghorbanzadeh et al. Citation2020; Omarzadeh et al. Citation2021; Valizadeh Kamran et al. Citation2021). The ML algorithms allow analyzing complex data spaces (e.g. satellite images), which makes them effective data-driven approaches. In addition, the ML techniques make use of ensembles of classification techniques, which leads to further flexibility and efficiency for the classification of remote sensing imagery (Doyle et al, Citation2021). We compared the efficiency of three ML algorithms against the integrated FOBIA-DL. To apply the ML algorithms, we used the satellite images (from the years 1990, 1995, 2000, 2005, 2010, 2015, and 2020) and training data to generate the LULC maps based on each ML algorithm. We used Python to classify and create the LULC maps based on 35,000 training data – and control points for the FOBIA-DL (5000 training data – and control points for each study year), and the outcome was 7 LULC maps (1 for each study year) for each of the ML algorithms.
5. Accuracy assessment
The accuracy assessment is a critical step in image classification, which is not complete without the accuracy assessment and validation of results (Lillesand and Kiefer Citation2001; Blaschke et al., Citation2014). In the context of the accuracy assessment, the error matrix, which is assigned based on ground control data, is the most common and widely applied method for the validation of classified maps in remote sensing (Zhou and Troy Citation2008). This approach is based on the computation of several measures, including the “overall accuracy,” the producer’s accuracy’ as well as the “user’s accuracy” (Janssen and Vanderwel Citation1994; Comber et al. Citation2012; Kassouk et al. Citation2014). The error matrix is a well-known and frequently applied accuracy assessment in the field of remote sensing. Despite its popularity, the error matrix has been criticized for its inherent uncertainty (Aronoff Citation1985; Foody Citation2002, Citation2006; Feizizadeh et al. Citation2017). Feizizadeh (Citation2018) pointed out that a confusion matrix might even face more uncertainty when it is used for accuracy assessment of the object-based classification maps. In this context, it must be emphasized that OBIA makes use of fuzzy decision rules and membership functions to classify objects. It can, therefore, be considered as a “soft classifier” technique. Thus, due to the segmentation process and the scale regulation, as well as the fuzzy decision rules, the results of an object-based classification are challenging to validate using a binary mode and be assigned to “true” and “false” categories (Albrecht, Lang, and Hölbling Citation2010; Feizizadeh Citation2018). Feizizadeh (Citation2018) proposed a novel approach based on Fuzzy Dempster-Shafer Theory for spatial uncertainty analysis and accuracy assessment of object-based image classification to overcome these issues. This approach uses Fuzzy Synthetic Evaluation (FSE) as the fuzzy decision rule and Dempster-Shafer Theory (DST) for validation and spatial uncertainty assessment. In this approach, the FSE technique calculates the matches and non-matches between a classified map and reference data (e.g. ground truth data).
5.1. Fuzzy synthetic evaluation
The FSE approach makes use of two groups of data (ground truth data and the respective rate computed for each data point to calibrating the overall and per-class accuracy of classified maps) in the two-step process. The first step employs the Difference fuzzy function to calculate the classification confidence and the observed level of error for each class. The second step weights the Difference function categories to compute the accuracy value. The confidence of the classified maps can then be obtained based on the results from these steps and the observed ratio of match between the control data and reference data. To compute the ratio of match between the control data and reference data, we employed the interpretation of confidence ratings (ICR), which was initially proposed by Sarmento, Carrao, and Caetano (Citation2008) and adapted for OBIA by Feizizadeh (Citation2018). represents the Difference function and its respective default ICR values for each category. Based on this approach, the overall accuracy and the confidence of each class of object-based classified image can be computed by applying the weighted sum of the sample observation ratios in each class derived using ICR values (Feizizadeh Citation2018). For further details regarding the FSE and its implementation, we refer to Feizizadeh et al. (Citation2017) and Feizizadeh (Citation2018). To apply the FSE approach in this research, we employed 1500 ground control points for each study year. These validation data were used together with the ICR values to compute the final accuracy values, which are shown in . The 1500 ground control points constitute 30% of the 5000 training data points, as discussed in the dataset section.
Table 4. Difference function and its respective default values for each category (Feizizadeh Citation2018)
Table 5. Results of the accuracy assessment and ICR values for the FOBIA-DL based classified LULC maps
5.2. Dempster-shafer theory for spatial accuracy assessment
The Dempster-Shafer Theory (DST) is a mathematical function based on the Bayesian probability theory that can be applied for spatial accuracy assessment and spatial uncertainty mapping. The DST makes use of the concepts of three functions, namely the basic belief assignments (BBA), the belief function, and the plausibility function. The capabilities of the DST makes it an efficient technique for modeling imprecision and for spatial uncertainty analysis (Liu, Pan, and Dezert Citation2015). The applicability of DST for spatial uncertainty mapping has been reported by a number of researchers (Feizizadeh and Blaschke Citation2014b; Feizizadeh et al. Citation2017; Shokati and Feizizadeh Citation2018; Feizizadeh Citation2018). As early researchers pointed out, the DST technique allows us to determine the spatial uncertainty of the classified maps. Thus, we can conclude that the DST approach offers an extension of the probability framework for computing the uncertainty of classified images in the domain of remote sensing (Liu, Pan, and Dezert Citation2016). Technically, the DST can compute the epistemic uncertainty that affects the expert knowledge of the probability P() within the alternative model
,
=
, …, n. According to this approach, lower and upper bounds shows the inherent uncertainty associated with P(
). In this context, the lower bound determines the belief Bel(
), which represents the degree of belief that supports the
. The upper band, which is also known as the plausibility,
(
), allows computing
, which is supposed to be the correct model “up to that value.” Thus, contrary to the probability processes, the probability mass is used to obtain the individual elementary events. Therefore, the DST technique or theory of evidence is used to carry out the BBA m (A) on sets A (the focal sets) of the power set P(Z) of the event space Z, i.e. on sets of outcomes rather than on single elementary events. In more detail, m(A) indicates the degree of belief that a specific element x belongs to set A only, and not to any subset of A. The bpa satisfies the following requirements (Baraldi and Zio Citation2010; Liu, Pan, and Dezert Citation2016):
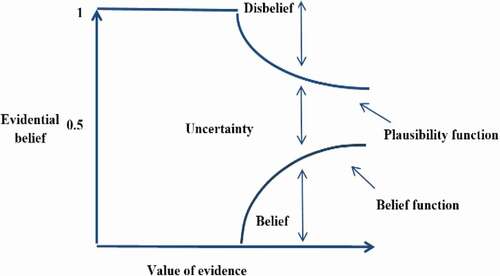
To carry out the spatial uncertainty analysis, the belief function computes the lower bound value for a (known) probability. The plausibility function also obtains the upper bound value for an (unknown) probability. The difference between the plausibility (Pl) and the belief (Bel) function can be computed to determine the spatial uncertainty (Feizizadeh Citation2018). depicts a schematic representation of the DST formwork. In our research, after developing the LULC maps using different data-driven approaches, the DST was applied to determine the spatial uncertainty of the classifications.
Figure 3. DST Framework of the spatial uncertainty modeling
6. Results
In the previous sections, we described how we applied the integrated approach of FOBIA and CNNs and compared the resulting LULC maps against those created with the ML algorithms (SVM, RF and CART). The LULC maps were developed for the years 1990, 1995, 2000, 2005, 2010, 2015, and 2020 (). We used the FSE-DST approach to validate the results, which are given in . Since it was not feasible to present the ICR values of all LULC classes in the final 28 maps due to the sheer numbers (8 IRC values for each class in the LULC map), we only presented the computed ICR values for the LULC classes of the 7 maps produced using the FOBIA-DL approach as an example. The IRC values for the LULC classes of the other 21 maps are available in the online version as an appendix. shows the obtained overall FSE values from the IRCs given in for all classes in the 28 produced maps. As the computed FSEs show, the FOBIA-DL outperformed all other classifications with minimum and maximum achieved accuracies of 90.1% and 96.4%, respectively. The second-best performing classification technique was the SVM, which achieved minimum and maximum accuracies of 88.1% and 91.9%, respectively. The RF method achieved minimum and maximum accuracies of 80.2% and 89.3%, respectively. The CART method was the technique with the lowest classification performance, achieving minimum and maximum accuracies of 74.1% and 86.7%, respectively.
Figure 4. Results of the LULC classification Fuzzy-OBIA-DL, a) 2020, b) 2015, c) 2010, d) 2005, e) 2000, f) 1995 and g) 1990
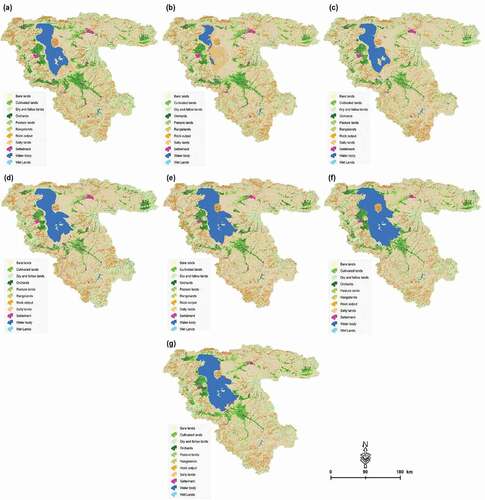
Figure 5. Results of the LULC classification based on the SVM, a) 2020, b) 2015, c) 2010, d) 2005, e) 2000, f) 1995 and g) 1990
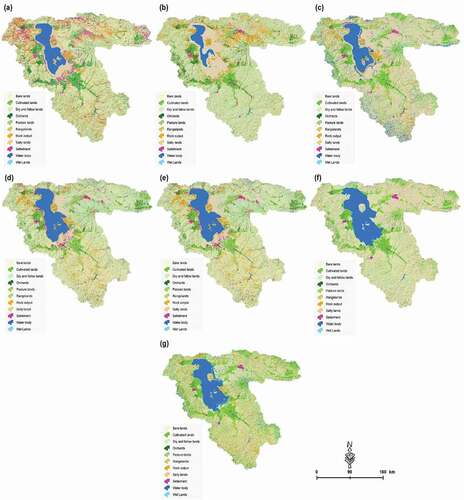
Figure 6. Results of the LULC classification Based on the RF, a) 2020, b) 2015, c) 2010, d) 2005, e) 2000, f) 1995 and g) 1990
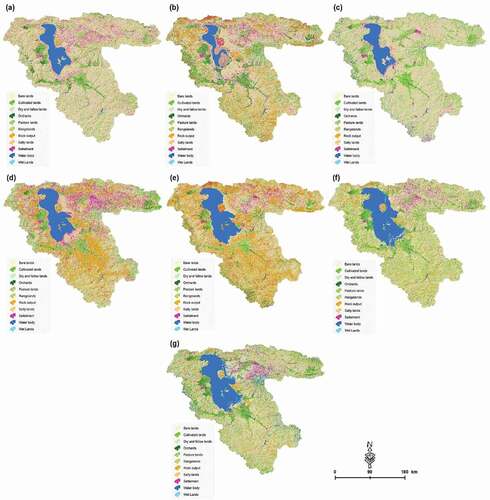
Figure 7. Results of the LULC classification based on the CART, a) 2020, b) 2015, c) 2010, d) 2005, e) 2000, f) 1995 and g) 1990
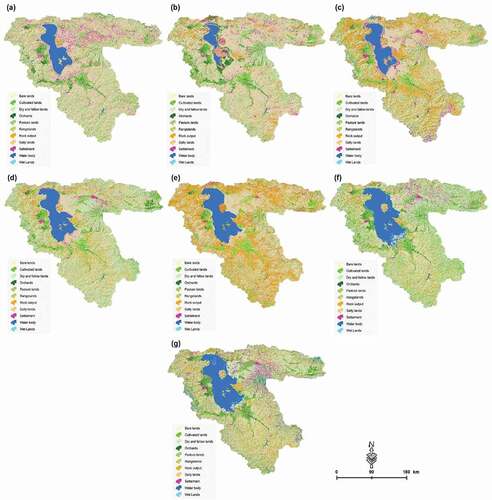
Table 6. Results of the accuracy assessment and ICR values for the FOBIA-DL based classified LULC maps
As a second validation approach, we determined the spatial uncertainty based on the DST method. The spatial uncertainties of the LULC maps are illustrated in . also shows the DST results for each data-driven method. The FOBIA-DL method achieved the highest reliability with a minimum and maximum value of 0.93 and 0.97, respectively. The SVM’s reliability was also computed to be in the range of 0.81 to 0.89, which makes it the second most efficient data-driven approach. The RF method achieved reliability values between 0.72 and 0.79, and the CART technique yielded the lowest reliability with values between 0.62 and 0.68. As the results of both validation approaches (FSE and DST) indicated, the FOBIA-DL was more efficient than the machine learning data-driven techniques of SVM, RF and CART.
Figure 8. Fuzzy-OBIA-DL Spatial uncertainty assessment results for LULC maps based on the DST method: a) 2020, b) 2015, c) 2010, d) 2005, e) 2000, f) 1995 and g) 1990
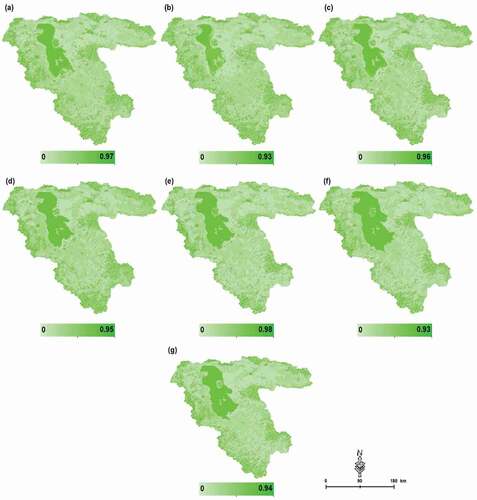
Figure 9. SVM Spatial uncertainty assessment results for LULC maps based on the DST method: a) 2020, b) 2015, c) 2010, d) 2005, e) 2000, f) 1995 and g) 1990
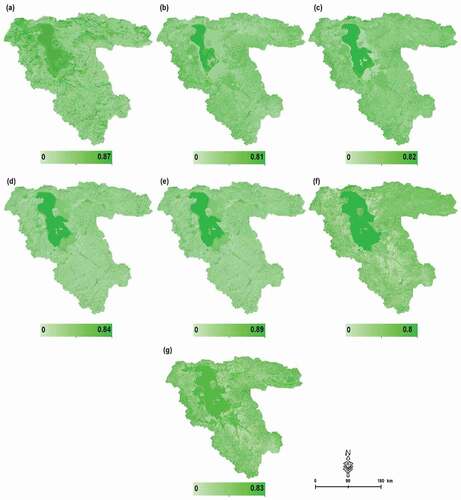
Figure 10. RF Spatial uncertainty assessment results for LULC maps based on the DST method: a) 2020, b) 2015, c) 2010, d) 2005, e) 2000, f) 1995 and g) 1990
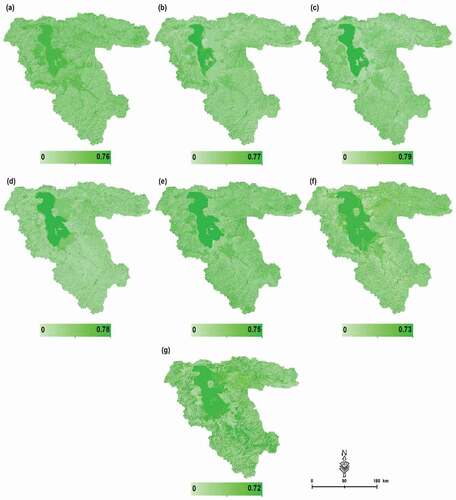
Figure 11. CART Spatial uncertainty assessment results for LULC maps based on the DST method: a) 2020, b) 2015, c) 2010, d) 2005, e) 2000, f) 1995 and g) 1990
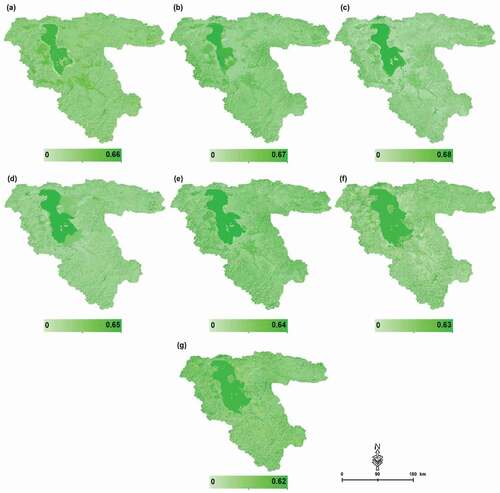
Table 7. Kappa coefficient for each algorithm in each study year
After the validation of the results, we evaluated the LULC classes to determine the trend of LULC changes and their respective impacts on the Urmia Lake drought. shows their respective changes for each study period based on the FOBIA-DL data-driven approach. The LULC analysis results indicate that cultivated areas, orchards, and dry and fallow lands have increased significantly since 1990. Significant changes were also observed in areas of bare land and rangelands. Monitoring LULC also revealed a significant expansion of settlement areas due to the increasing population between 1990 and 2020. On the other hand, our results indicate that wetlands and water bodies faced significant reductions in size, while salt lands increased substantially. The changes in rangelands and pasture land were related to respective changes in the class of rock outcrops.
Table 8. LULC area changes (km2)
According to these results, the surface area of UL was 5114 km2 in 1990 and this surface area increased to a maximum of 6005 km2 in 1995. (991 Km2 = 19% increase from 1990 to 1995). After this first extension period, the UL surface decreased to 4697 km2 in 2000 (1308 km2 = 21.78% reduction from 1995 to 2000). This reduction continued, and the surface area of UL decreased substantially to reach 4307 km2 in 2005 (390 km2 = 8.31% reduction from 2000–2005). Between 2005 and 2010, the UL surface area decreased again to 3026 km2 (1011 km2 = 25% reduction from 2005–2010). However, the most significant reduction in the surface area of UL occurred from 2010 to 2015 when the area of the lake shrunk to 890 km2, and UL lost about 2136 km2 of its surface body (70.58%), exposing extensive salt lands. Fortunately, the surface area of UL increased to 3348 km2 in 2020 (2458 km 2 = 48.06% extension). As we will discuss in the next section, this recent expansion was predominantly caused by raising awareness for reducing water consumption in agricultural activities and as a result of higher precipitation in 2018–2019. However, our investigation showed that despite the recent positive trend in the UL surface area, the lake has still lost 1766 km2 (34.54%) of its surface area between 1990 and 2020.
7. Discussion
The main objective of this research was to apply different data-driven approaches and compare their efficiency for LULC mapping and trend analysis. According to our results, the integrated FOBIA-DL achieved the most accurate results. OBIA offers various spatial and spectral object features, of which the most appropriate ones need to be selected for analysis. Applying the most appropriate features may significantly impact the accuracy and robustness of the results. Earlier studies showed that any improvement in the accuracy of the object-based classification mainly depends on the selection of appropriate features and parameters for classification (Ma et al. Citation2017; Maboudi et al. Citation2018; Kucharczyk et al. Citation2020; Najafi, Feizizadeh, and Navid Citation2021). In this study, we employed different spectral, spatial, and geometric object features as the basis of the LULC classification through DCNN. We applied object-based features, such as vegetation and brightness indices, color insensitivities, shape indicators, compactness, asymmetry, homogeneity, contrast information, and texture analysis using the gray-level co-occurrence matrixes (GLCM). We employed training data to compute a fuzzy membership degree of each object features to classify the LULC classes. Our results confirm the results of earlier studies (e.g. Hofmann, Blaschke, and Strobl Citation2011; Feizizadeh et al. Citation2020; Najafi, Feizizadeh, and Navid Citation2021) and highlight the significance of fuzzy rules integrated with OBIA. The obtained results confirm that the integration of Fuzzy-OBIA can deal with uncertain, incomplete and vague information for steering or controlling processes as well as assigning image objects to LULC classes using the membership functions. In this context, we emphasize that one of the most important factors in achieving a high accuracy with this method is analyzing the effective membership degrees in the classification for each parameter and using the parameters with the highest membership degree. The results confirm that the combination of fuzzy methods and OBIA allows computing the efficiency of each object feature for LULC classification.
OBIA has been proven to be a methodology that can improve the accuracy of remote sensing classifications by employing homogeneous objects resulting from image segmentation and applying spatial and spectral object features to classify these objects (Blaschke Citation2010; Blaschke et al., Citation2014; Kucharczyk et al. Citation2020). Such capability reduces classification errors, particularly the errors between individual pixels that belong to a different LULC class but have a spectral similarity. Thus, classifying objects – rather than pixels – has again proven beneficial. Still, in combination with the power of DL algorithms (i.e. CNNs), further improvements can be achieved. Our results proved that an integration of FOBIA and DL-CNN could make use of the huge range of object features in OBIA and the power of machine-based decision rules in DCNN to classify homogenous objects generated by image segmentation. The obtained results confirm that an integrated FOBIA method improves the robustness of OBIA as a decision-making system and also improves the accuracy of the results. The integration of FOBIA with DCNN supports remote sensing users in developing an efficient automated image classification approach that can be used for a wide range of applications such as LULC, change detection analysis, and environmental mapping. Along with recent improvements in remote sensing and the availability of satellite images with improved spatial, spectral, and temporal resolutions, such an automated approach can be efficient and cost-effective.
In the context of integrating FOBIA with DL methods, the results of this research prove that the integrated approach of FOBIA-DCNNs could deliver the highest accuracy for image classification. The CNNs are deep learning models that have been used in remote sensing since 2014 (Ma et al. Citation2017). Their combination with OBIA and FOBIA created new possibilities and efficient data-driven approaches to satellite image classification (Kucharczyk et al. Citation2020). Deep learning is a form of machine learning that uses multiple layers of artificial neural networks. Artificial neural networks are based on biological neural networks in several ways, whereby CNNs (a form of artificial neural network) are influenced by the animal visual cortex (Chartrand et al. Citation2017; Yamashita et al. Citation2018).
It can automatically extract high-level features from low-level features of the input image. Significant progress is currently being made in remote sensing research devoted to investigating techniques that allow relevant information to be effectively interpreted, analyzed, and extracted (Singh, Verma, and Chaudhari Citation2016). Therefore, strong, robust, and automated decision rules are being supplied by DCNNs. On the other hand, FOBIA can also be used to efficiently derive the spatial and spectral characteristics of the LULC classes. For classifications, the conventional OBIA makes use of general classification techniques, such as the nearest neighbor classifier. On the other hand, the integrated FOBIA and DCNNs method has the advantage of fuzzy membership values, the spatio-spectrally explicit image analysis provided by the FOBIA, and robust decision rule fulfilled by the DCNNs.
Machine learning algorithms have become very popular since the impressive return of neural networks in 2006 (Hinton, and Salakhutdinov Citation2006). When comparing their efficiency, our results showed that the SVM achieved better results than the RF and CART. Machine learning methods have emerged over the past few years as one of the most successful techniques for a wide variety of remote sensing applications. In the scientific community, these approaches have gained substantial interest due to their ability to break records, for example, in the fields of speech – and visual recognition (Vieira, Pinaya, and Mechelli Citation2017). The standard SVM model could be a two-class or multi-class model (an amalgamation of a two-class SVMs chain). The most widely used form of ML approach is the two-class SVM (Tien Bui et al. Citation2020). The SVM contains several kernels for the task of image registration and classification. However, the polynomial and radial basis function (RFB) kernel has been frequently applied in remote sensing applications (Maxwell, Warner, and Fang Citation2018). This kernel is also recognized as the most common technique for LULC classification and achieves better accuracy than conventional methods (Talukdar et al. Citation2020). The RF approach is also one of the most used machine learning techniques (Feizizadeh et al. Citation2021). This algorithm is popular because it can be used for classification and regression as well as for categorical and continuous variables (Woznicki et al. Citation2019). Because of this versatility, RF has been used in a broad range of earth science applications, such as LULC mapping (Betts et al. Citation2017), land use (Araki, Shima, and Yamamoto Citation2018), and land cover and object-oriented mapping (Nitze, Barrett, and Cawkwell Citation2015). RF is an ensemble learning algorithm based on the premise that aggregated bootstrap classifiers perform better than a single classifier in a combination (Feizizadeh et al. Citation2021).
The accuracy assessment has been one of the main challenges in remote sensing for many years (Foody Citation2002, Citation2006; Feizizadeh et al. Citation2017; Feizizadeh Citation2018). To overcome potential flaws, we proposed and applied a new FSE-DST approach for the accuracy assessment. Our results confirmed the efficiency of this approach for the accuracy assessment of remote sensing-based classified maps. The main advantage of the FSE-DST approach is that it utilizes the fuzzy decision rules while subsequently minimizing the uncertainty of a conventional error matrix. Using fuzzy decision rules and membership values to express the confidence of each LULC class creates a mutual relationship between references data and classified images that can be used to go back and forth between analysis and interpretation. In addition, the DST technique allows depicting the spatial accuracy by representing the certainty of every single unit (e.g. object or pixel) in the classified map. Contrarily, a conventional error matrix provides only single accuracy values per class.
From the environmental perspective, various environmental problems within the study area were already known, but this study provides a systematic investigation of the extent and the severity of some major environmental issues. We investigated the shrinkage of the Urmia Lake (UL) and the related extensive LULC changes. The results reveal an increase in the settlement area of 262 km2, which is a very high value. In addition, 933 km2 of land were cultivated, 2685 km2 were turned into dry farming and fallow field systems and another 1081 km2 into orchards. In total, this represents a substantial extension in agricultural activities and residential areas. Due to the impact of the intensive anthropogenic pressure on natural resources, the UL and the surrounding area are now facing a critical situation. Over the course of the 30-year study period (1990–2020), the lake drought resulted in a loss of 34.54% of the lake surface area and exposed a 1766 km2 area of salt flats. The lake’s surface area varies naturally to some extent between the wet and dry seasons, depending on seasonal precipitation. However, the major trend and timeline of the lake drought are unquestionably beyond the seasonal changes, and the rapid LULC changes have already approached a “tipping point” that could lead to sudden lake death (Agha Kouchak et al., Citation2015). It is well understood that the lake drought causes several environmental problems, such as soil and water salinization, that reduce the productivity of agricultural lands and lead to food insecurity for the population of the area. The health of the population is also directly affected by the impacts of dust storms. Thus, by highlighting the environmental impacts of the Urmia Lake drought, government awareness has been raised by social and environmental communities in recent years, and the matter is now receiving significant attention. As the results show, the countermeasures have recently had an effect and, in combination with two years of higher precipitation, reversed the trend of the decreasing lake surface area somewhat.
Awareness and mitigation campaigns mainly focused on water scarcity and drought. The main goal of awareness and mitigation campaigns was to reduce the water consumption in agricultural, residential, and industrial sectors by gaining support for the lake restoration initiative. In 2018, the UL surface increased by about 48%. This is accredited to these awareness and mitigation measures, but also to relatively high rainfall values. According to the 2019 report of the Iranian Meteorological Organization, the average annual precipitation at Urmia Lake Basin (ULB) in 2018 was 328 mm. This is 11.3% more than in 2017 (291 mm). The long-term (30 years) average precipitation in ULB is 238.8 mm and, accordingly, the precipitation in 2018 was about 89.7 mm or 27.35% higher than usual. Despite these relatively humid conditions in 2018, salty land areas still existed in 2020, which potentially lead to dust storms. Due to the geographical characteristics (e.g. topography and semi-arid climate as well as being impacted by the western winds), it is expected that the UL drought will result in dust storms that carry salt over the exposed lakebed and impact the productivity of agricultural lands through soil salinization, thus forcing farmers to give up and move away. Our analysis results are in line with earlier studies (e.g. Delju et al. Citation2012; Agha Kouchak et al., Citation2015; Hamidi-Razi et al. Citation2018; Rahimi Balkanlou et al. Citation2020; Najafi et al. Citation2019) that reported similar environmental problems caused by the UL drought.
8. Conclusion and future works
Intensive progress in Earth observation technologies yielded significant improvements in the spatial, spectral, and temporal resolutions of satellite images, which is increasingly taking remote sensing into the arena of big data technology. Applying conventional image processing techniques to analyze and classify enormous data demands fast, effective, semi-automated and cost-effective data-driven methods (see also Sudmanns et al. Citation2020). In this research, we integrated FOBIA with DCNNs techniques and compared its efficiency to that of other well-known machine learning techniques (SVM, RF and CART). We also compared the accuracies of the different methods using the new spatial accuracy assessment approach of FSE-DST. Our results proved that this integrated approach was robust and effective for image classification. We conclude that an integrated FOBIA – DCNNs methodology allows improving the decision rules of OBIA for classifying the objects into LULC classes. Conventional classification techniques in OBIA (e.g. nearest neighbor, support vector machine, etc.) can be prone to errors or ambiguities when classifying objects with similar attributes. Thus, DCNNs with strong decision rules and the ability to simulate the LULC class based on intensive training data enable a minimization of the ambiguity and uncertainty of object-based classifications even compared to the effective machine learning techniques of SVM, RF and CART.
The proposed FSE-DST approach also supported us in computing the validity of the results and deriving the spatial accuracy more efficiently. We conclude that future research in OBIA applications can benefit from both aspects of our approach, namely a) FOBIA and its integration with DCNNs, and b) accuracy assessment using FSE-DST. The recent progress in remote sensing and the availability of a wide range of satellite images demands novel, cost-effective and efficient data-driven methods for remote sensing analysis.
OBIA turned out to be a paradigm shift in remote sensing (Blaschke, 20,210). Thus, this research is advancing the fields of remote sensing and GIScience by proposing and applying a new integrated approach for satellite image classification and comparing its efficiency against the best-known machine learning techniques. Our approach integrates FOBIA with DL-CNN while also implementing the FSE-DST accuracy assessment method. Therefore, the results of this study support future research that aims to identify the most effective data-driven approach in the remote sensing domain. It may thus help to improve the classification accuracy of LULC mapping and change detection analysis through fuzzy operators and membership functions in combination with an automated DCNN data-driven approach. From the environmental perspective, our results indicate that Urmia Lake has been in a fragile state under the impacts of intensive LULC changes, and that agricultural and residential activities in the ULB have increased drastically. This seems to be a significant driver of the problems – aside from the drought. Based on the results of this research, our future research will focus on monitoring the soil salinity extension and how this affects the productivity of agricultural lands and food security in the ULB. In addition, part of our future research will focus on applying different DL algorithms such as deep multi-layer perceptron and AlexNet and comparing their efficiency when integrating them with FOBIA-DL. In light of the Urmia Lake crises and various national and international lake restoration attempts, our results shall support decision-makers and authorities in a range of applications, such as mitigation, land use allocation and precision agriculture activities. We are currently witnessing the beginning of an integration of OBIA and state-of-the-art machine learning approaches.
Acknowledgements
This research was jointly funded by a research grant from the University of Tabriz (s818) and the Alexander von Humboldt Foundation.
Disclosure statement
No potential conflict of interest was reported by the author(s).
Additional information
Funding
References
- Abedi Gheshlaghi, H., and B. Feizizadeh, 2021. GIS-based ensemble modelling of fuzzy system and bivariate statistics as a tool to improve the accuracy of landslide susceptibility mapping, doi:https://doi.org/10.1007/s11069-021-04673-1.
- Agha Kouchak, A., H. Norouzi, K. Madani, A. Mirchi, A. Azarderakhshe, A. Nazemi, N. Nasrollahi, A. Farahmand, A. Mehran, and E. Hasanzadeh. 2015. “Aral Sea Syndrome Desiccates Lake Urmia: Call for Action.” Journal of Great Lakes Research 41 (1): 307–311. doi:https://doi.org/10.1016/j.jglr.2014.12.007.
- Aksoy, B., and M. Ercanoglu. 2012. “Landslide Identification and Classification by Object-based Image Analysis and Fuzzy Logic: An Example from the Azdavay Region (Kastamonu, Turkey).” Computer Geosciences 38 (1): 87–98. doi:https://doi.org/10.1016/j.cageo.2011.05.010.
- Albrecht, F., S. Lang, and D. Hölbling. 2010. “Spatial Accuracy Assessment of Object Boundaries for Object-based Image Analysis.” The International Archives of the Photogrammetry, Remote Sensing and Spatial Information Sciences 38: 4–10.
- Alhassan, V., C. Henry, S. Ramanna, and C. Storie. 2019. “A Deep Learning Framework for Land-use/land-cover Mapping and Analysis Using Multispectral Satellite Imagery.” Neural Computing & Applications. doi:https://doi.org/10.1007/s00521-019-04349-9.
- Araki, S., M. Shima, and K. Yamamoto. 2018. “Spatiotemporal Land Use Random Forest Model for Estimating Metropolitan NO2 Exposure in Japan.” Science of the Total Environment 634: 1269–1277. doi:https://doi.org/10.1016/j.scitotenv.2018.03.324.
- Aronoff, S. 1985. “The Minimum Accuracy Value as an Index of Classification Accuracy.” Photogrammetric Engineering and Remote Sensing 51: 99–111.
- Baatz, M., U. Benz, S. Dehghani, M. Heynen, A. Höltje, P. Hofmann, I. Lingenfelder, et al. 2004. eCognition Professional User Guide 4. München: Definiens Imaging GmbH.
- Baraldi, P., and E. Zio. 2010. “A Comparison between Probabilistic and Dempster-Shafer Theory Approaches to Model Uncertainty Analysis in the Performance Assessment of Radioactive Waste Repositories”.” Risk Analysis : An Official Publication of the Society for Risk Analysis 30 (7): 1139–1156. doi:https://doi.org/10.1111/j.1539-6924.2010.01416.x.
- Betts, M. G., C. Wolf, W. J. Ripple, B. Phalan, K. A. Millers, A. Duarte, and T. Levi. 2017. “Global Forest Loss Disproportionately Erodes Biodiversity in Intact Landscapes.” Nature 547 (7664): 441–444. doi:https://doi.org/10.1038/nature23285.
- Blaschke, T., B. Feizizadeh, and D. Hölbling. 2014. “Object-Based Image Analysis and Digital Terrain Analysis for Locating Landslides in the Urmia Lake Basin.” Iran, IEEE Journal of Selected Topics in Applied Earth Observations and Remote Sensing 7 (12): 4806–4817. doi:https://doi.org/10.1109/JSTARS.2014.2350036.
- Blaschke, T., G. J. Hay, M. Kelly, S. Lang, P. Hofmann, E. Addink, R. Feitosa, et al. 2014. “Geographic Object-based Image Analysis: A New Paradigm in Remote Sensing and Geographic Information Science.” ISPRS International Journal of Photogrammetry and Remote Sensing 87 (1): 180–191. doi:https://doi.org/10.1016/j.isprsjprs.2013.09.014.
- Blaschke, T., M. Kelly, and H. R. Merschdorf. 2015. “Object Based Image Analysis: Evolution, History, State of the Art, and Future Vision.” In Remote Sensing Handbook, edited by P. S. Thenkabail. Remotely Data Characterization, Classification, and Accuracies, Chapter: 14, 273–293. Thenkabail: Taylor & FrancisEditors.
- Blaschke, T. 2010. “Object Based Image Analysis for Remote Sensing.” ISPRS Journal of Photogrammetry and Remote Sensing 65 (1): 2–16. doi:https://doi.org/10.1016/j.isprsjprs.2009.06.004.
- Cai, Y., K. Guan, J. Peng, S. Wang, C. Seifert, B. Wardlow, and Z. LiA. 2018. “High-performance and In-season Classification System of Field-level Crop Types Using Time-series Landsat Data and a Machine Learning Approach Remote Sens.” Environ 210: 35–47.
- Chartrand, G., P. M. Cheng, E. Vorontsov, M. Drozdzal, S. Turcotte, C. J. Pal, S. Kadoury, and A. Tang. 2017. “Deep Learning: A Primer for Radiologists.” Radiographics 37 (7): 2113–2131. doi:https://doi.org/10.1148/rg.2017170077.
- Chen, Y., X. Zhao, and X. Jia. 2015. “Spectral-spatial Classification of Hyperspectral Data Basedon Deep Belief Network.” IEEE J. Sel. Top. Appl. Earth Obs. Remote Sens 8 (6SI): 2381–2392. doi:https://doi.org/10.1109/JSTARS.2015.2388577.
- Chen, Y., Z. Lin, X. Zhao, G. Wang, and Y. Gu. 2014. “Deep Learning-based Classification Ofhyperspectral Data.” IEEE J. Sel. Top. Appl. Earth Obs. Remote Sens 7 (6): 2094–2107. doi:https://doi.org/10.1109/JSTARS.2014.2329330.
- Cheng, G., P. Zhou, and J. Han. 2016. “Learning Rotation-invariant Convolutional Neuralnetworks for Object Detection in VHR Optical Remote Sensing Images.” IEEE Trans.Geosci. Remote Sens 54 (12): 7405–7415. doi:https://doi.org/10.1109/TGRS.2016.2601622.
- Comber, A., P. Fisher, C. Brunsdon, and A. Khmag. 2012. “Spatial Analysis of Remote Sensing Image Classification Accuracy.” Remote Sensing of Environment 127: 237–246. doi:https://doi.org/10.1016/j.rse.2012.09.005.
- Cresson, R. 2018. “A Framework for Remote Sensing Images Processing Using Deep Learning Technique.” IEEE Geoscience and Remote Sensing Letters 16: 1–6.
- Das, M., and S. K. Ghosh. 2016. “Deep-step: A Deep Learning Approach for Spatiotemporal Prediction of Remote Sensing Data IEEE Geosci.” Remote Sens. Lett 13 (12): 1984–1988. doi:https://doi.org/10.1109/LGRS.2016.2619984.
- Delju, A. H., A. Ceylan, E. Piguet, and M. Rebetez. 2012. “Observed Climate Variability and Change in Urmia Lake Basin.” Iran, Theoretical and Applied Climatology 111 (1–2): 285–296. doi:https://doi.org/10.1007/s00704-012-0651-9.
- Doyle, C., Beach, T., and Luzzadder-Beach, S. 2021. “Tropical Forest and Wetland Losses and the Role of Protected Areas in Northwestern Belize, Revealed from Landsat and Machine Learning.” Remote Sens., 13: 379. doi:https://doi.org/10.3390/rs13030379
- Drǎguţ, L., D. Tiede, and S. R. Levick. 2010. “ESP: A Tool to Estimate Scale Parameter for Multiresolution Image Segmentation of Remotely Sensed Data.” International Journal of Geographical Information Science 24 (6): 859–871. doi:https://doi.org/10.1080/13658810903174803.
- Dutta, D., A. Rahman, S. K. Paul, and A. Kundu. 2019. “Changing Pattern of Urban Landscape and Its Effect on Land Surface Temperature in and around Delhi.” Environmental Monitoring and Assessment 191 (9): 551. doi:https://doi.org/10.1007/s10661-019-7645-3.
- Ebrahimy, H., Naboureh, A., Feizizadeh, B., Aryal, J., and Ghorbanzadeh, O. 2021. “Integration of Sentinel-1 and Sentinel-2 Data with the G-SMOTE Technique for Boosting Land Cover Classification Accuracy.” Applied Sciences, 11: 10309. doi:https://doi.org/10.3390/app112110309
- Eisank, C., M. Smith, and J. Hillier. 2014. “Assessment of Multiresolution Segmentation for Delimiting Drumlins in Digital Elevation Models.” Geomorphology 214: 452–464. doi:https://doi.org/10.1016/j.geomorph.2014.02.028.
- Feizizadeh, B., D. Omarzadeh, M. Kazemi Garajeh, T. Lakes, and T. Blaschke. 2021. “Machine learning data-driven approaches for land use/cover mapping and trend analysis using Google Earth Engine.” Journal of Environmental Planning and Management. doi:https://doi.org/10.1080/15481603.2021.2000350
- Feizizadeh, B., H. Shaabei, K. Dedehaban, T. Blaschke, and F. Neubauer. 2020. “Object-Based Thermal Remote-Sensing Analysis for Fault Detection in Mashhad County, Iran.” Canadian Journal of Remote Sensing 45 (6): 847–861.
- Feizizadeh, B., M. Kazamei, T. Blaschke, and T. Lakes, 2021. An Object Based Image Analysis Applied for Volcanic and Glacial Landforms Mapping in Sahand Mountain, Iran, Catena, DOI:https://doi.org/10.1016/j.catena.2020.105073.
- Feizizadeh, B., and S. Kienberger. 2017. “Spatial Explicit Sensitivity and Uncertainty Analysis for Multicriteria Based Vulnerability Assessment.” Journal of Environmental Planning and Management 60 (11): 2013–2035.
- Feizizadeh, B., and T. Blaschke. 2014. “An Uncertainty and Sensitivity Analysis Approach for GIS-based Multicriteria Landslide Susceptibility Mapping.” International Journal of Geographical Information Science 28 (3): 610–638. doi:https://doi.org/10.1080/13658816.2013.869821.
- Feizizadeh, B., T. Blaschke, D. Tiede, and M. H. Rezaei Moghaddam. 2017. “Evaluation of Fuzzy Operators within an Object-Based Image Analysis Approach for Landslide Change Detection Analysis.” Geomorphology 293: 240–254. DOI:https://doi.org/10.1016/j.geomorph.2017.06.002.
- Feizizadeh, B. 2018. “A Novel Approach of Fuzzy Dempster–Shafer Theory for SpatialUncertainty Analysis and Accuracy Assessment of Object-Based Image Classification.” IEEE Geoscience and Remote Sensing Letters 15 (1): 18–22. doi:https://doi.org/10.1109/LGRS.2017.2763979.
- Foody, G. M. 2006. The Evaluation and Comparison of Thematic Maps Derived from Remote Sensing, 7th International Symposium on Spatial Accuracy Assessment in Natural Resources and Environmental Sciences, Lisbon, Portugal. 18–31.
- Foody, G. M. 2002. “Status of Land Cover Classification Accuracy Assessment.” Remote Sensing of Environment 80 (1): 185–201. doi:https://doi.org/10.1016/S0034-4257(01)00295-4.
- Ghasemi, M., S. Karimzadeh, and B. Feizizadeh. 2021. “Urban Classification Using Preserved Information of High Dimensional Textural Features of Sentinel-1 Images in Tabriz, Iran.” Earth Sciences Information 14 (4): 1745–1762. doi:https://doi.org/10.1007/s12145-021-00617-2.
- Ghorbanzadeh, O., D. Tiede, L. Wendt, M. Sudmanns, and S. Lang. 2020. “Transferable Instance Segmentation of Dwellings in a Refugee Camp-integrating CNN and OBIA.” In European Journal of Remote Sensing 54: 127–140.
- Ghorbanzadeh, O., S. Pourmoradian, T. Blaschke, and B. Feizizadeh. 2019a. “Mapping Potential Nature-based Tourism Areas by Applying GIS-decision Making Systems in East Azerbaijan Province, Iran.” Journal of Ecotourism 2019: 1–23.
- Ghorbanzadeh, O., T. Blaschke, K. Gholamnia, S. R. Meena, D. Tiede, and J. Aryal. 2019b. “Evaluation of Different Machine Learning Methods and Deep-learning Convolutional Neural Networks for Landslide Detection.” Remote Sensing 11 (2): 196. doi:https://doi.org/10.3390/rs11020196.
- Guirado, E., S. Tabik, D. Alcaraz-Segura, J. Cabello, and F. Herrera. 2017. “Deep-learning versus OBIA for Scattered Shrub Detection with Google Earth Imagery: Ziziphus Lotus as Case Study.” Remote Sensing 9 (12): 1–22. doi:https://doi.org/10.3390/rs9121220.
- Hamidi-Razi, H., M. Mazaheri, M. Carvajalino-Fernández, and J. Vali-Samani. 2018. “Investigating the Restoration of Lake Urmia Using a Numerical Modelling Approach.” Journal of Great Lakes Research 87–97. doi:https://doi.org/10.1016/j.jglr.2018.10.002.
- Henry, C. J., C. D. Storie, M. Palaniappan, V. Alhassan, M. Swamy, D. Aleshinloye, A. Curtis, and D. Kim. 2019. “Automated Lulc Map Production Using Deep Neural Networks.” International Journal of Remote Sensing 40 (11): 4416–4440. doi:https://doi.org/10.1080/01431161.2018.1563840.
- Hinton, G. E., and R. R. Salakhutdinov. 2006. “Reducing the dimensionality of data with neural networks.” Science, 313:504–507.
- Hoan, N. T., Y. A. Liou, K. A. Nguyen, R. C. Sharma, D. P. Tran, C. L. Liou, and D. D. Cham. 2018. “Assessing the Effects of Land-Use Types in Surface Urban Heat Islands for Developing Comfortable Living in Hanoi City.” Remote Sens 10 (12): 1965. doi:https://doi.org/10.3390/rs10121965.
- Hofmann, P., T. Blaschke, and J. Strobl. 2011. “Quantifying the Robustness of Fuzzy Rulesets in Object-based Image Analysis.” International Journal of Remote Sensing 32 (22): 7359–7381. doi:https://doi.org/10.1080/01431161.2010.523727.
- Huang, B., B. Zhao, and Y. Song. 2018. “Urban Land-use Mapping Using a Deep Convolutionalneural Network with High Spatial Resolution Multispectral Remote Sensing imagery.Remote.” Environ 214: 73–86.
- Janssen, L. L. F., and F. G. M. Vanderwel. 1994. “Accuracy Assessment of Satellite Derived Land-cover Data: A Review.” Photogrammetric Engineering and Remote Sensing 60 (4): 419–426.
- Kassouk, Z., J. C. Thouret, A. Gupta, A. Solikhin, and S. C. Liew. 2014. “Object-based Classification of a High-spatial Resolution SPOT5 Image for Mapping Geology and Landforms of Active Volcanoes: Semeru Case Study, Indonesia.” Geomorphology 221: 18–33. doi:https://doi.org/10.1016/j.geomorph.2014.04.022.
- Kazemi Garajeh, M., F. Malaky, Q. Weng, B. Feizizadeha, T. Blaschke, and T. Lakes. 2021. “An Automated Deep Learning Convolutional Neural Network Algorithm Applied for Soil Salinity Distribution Mapping in Lake Urmia, Iran.” Science of the Total Environment. doi:https://doi.org/10.1016/j.scitotenv.2021.146253.
- Kucharczyk, M., G. J. Hay, S. Ghaffarian, and C. H. Hugenholtz. 2020. “Geographic Object-Based Image Analysis: A Primer and Future Directions.” Remote Sensing 12 (12): 2012. doi:https://doi.org/10.3390/rs12122012.
- Kussul, N., M. Lavreniuk, S. Skakun, and A. Shelestov. 2017. “Deep Learning Classification Ofland Cover and Crop Types Using Remote Sensing Data.” IEEE Geosci. Remote Sens. Lett 14 (5): 778–782. doi:https://doi.org/10.1109/LGRS.2017.2681128.
- LeCun, Y., Y. Bengio, and G. Hinton. 2015. “Deep Learning.” Nature 521 (7553): 436. doi:https://doi.org/10.1038/nature14539.
- Lees, B. 2006. “The Spatial Analysis of Spectral Data: Extracting the Neglected Data.” Applied GIS 2 (2): 14–1. doi:https://doi.org/10.2104/ag060014.
- Lillesand, T. M., and R. W. Kiefer. 2001. Remote Sensing and Image Interpretation. 4th ed. USA: John Wiley and Sons.
- Liu, Y., X. Chen, Z. Wang, Z. J. Wang, R. K. Ward, and X. Wang. 2018. “Deep Learning for Pixel-level Image Fusion: Recent Advances and Future Prospects.” Inf. Fusion 42: 158–173. doi:https://doi.org/10.1016/j.inffus.2017.10.007.
- Liu, Z., Q. Pan, and J. Dezert. 2015. “Credal C-means Clustering Method Based on Belief Functions.” Knowledge Based Systems 74: 119–132. doi:https://doi.org/10.1016/j.knosys.2014.11.013.
- Liu, Z., Q. Pan, and J. Dezert. 2016. “Hybrid Classification System for Uncertain Data.” IEEE Transactions on Systems, Man, and Cybernetics: Systems. doi:https://doi.org/10.1109/TSMC.2016.2622247.
- Ma, L., T. Fu, T. Blaschke, M. Li, D. Tiede, Z. Zhou, X. Ma, and D. Chen. 2017. “Evaluation of Feature Selection Methods for Object-based Land Cover Mapping of UAV Imagery by RF and SVM Classifiers.” ISPRS International Journal of Geo-Information 6 (2): 51. doi:https://doi.org/10.3390/ijgi6020051.
- Ma, L., Y. Liu, X. Zhang, Y. Ye, G. Yin, and B. A. Johnson. 2019. “Deep Learning in Remote Sensing Applications: A Meta-analysis and Review.” ISPRS Journal of Photogrammetry and Remote Sensing 152: 166–177. doi:https://doi.org/10.1016/j.isprsjprs.2019.04.015.
- Maboudi, M., J. Amini, S. Malihi, and M. Hahn. 2018. “Integrating Fuzzy Object Based Image Analysis and Ant Colony Optimization for Road Extraction from Remotely Sensed Images.” ISPRS Journal of Photogrammetry and Remote Sensing 138: 151–163. doi:https://doi.org/10.1016/j.isprsjprs.2017.11.014.
- Mardi, H., A. Khaghani, A. MacDonald, P. Nguyen, N. Karimi, P. Heidary, N. Karimi, et al. 2018. “The Lake Urmia Environmental Disaster in Iran: A Look at Aerosol Pollution.” Science of the Total Environment 633: 42–49. doi:https://doi.org/10.1016/j.scitotenv.2018.03.148.
- Marmanis, D., M. Datcu, T. Esch, and U. Stilla. 2016. “Deep Learning Earth Observationclassification Using ImageNet Pretrained Networks.” IEEE Geosci. Remote Sens. Lett 13 (1): 105–109. doi:https://doi.org/10.1109/LGRS.2015.2499239.
- Mas, J. F., R. Lemoine-Rodríguez, R. González-López, J. López-Sánchez, A. Piña-Garduño, and E. Herrera-Flores. 2017. “Land Use/land Cover Change Detection Combining Automatic Processing and Visual Interpretation.” Eur. J.Remote Sens 50 (1): 626–635. doi:https://doi.org/10.1080/22797254.2017.1387505.
- Maxwell, A. E., T. A. Warner, and F. Fang. 2018. “Implementation of Machine-learning Classification in Remote Sensing: An Applied Review.” International Journal of Remote Sensing 39 (9): 2784–2817. doi:https://doi.org/10.1080/01431161.2018.1433343.
- Moradpour, H., G. Rostami Paydar, A. Beiranvand Pour, K. Valizadeh Kamran, B. Feizizadeh, A. M. Muslim, and M. S. Hossain. 2020. “Landsat-7 and ASTER Remote Sensing Satellite Imagery for Identification of Iron Skarn Mineralization in Metamorphic Regions.” Geocarto International 1–28. doi:https://doi.org/10.1080/10106049.2020.1810327.
- Naboureh, A., M. H. Rezaei Moghaddam, B. Feizizadeh, and T. Blaschke. 2017. “An Integrated Object-based Image Analysis and CA-Markov Model Approach for Modeling Land Use/land Cover Trends in the Sarab Plain.” Arabian Journal of Geosciences 10 (12): 259. doi:https://doi.org/10.1007/s12517-017-3012-2.
- Najafi, P., B. Feizizadeh, and H. Navid. 2021. “A Comparative Approach of Fuzzy Object Based Image Analysis and Machine Learning Techniques Which are Applied to Crop Residue Cover Mapping by Using Sentinel-2 Satellite and UAV Imagery.” Remote Sensing 13 (5): 937. doi:https://doi.org/10.3390/rs13050937.
- Najafi, P., H. Navid, and B. Feizizadeh. 2019. “Fuzzy Object-Based Image Analysis Methods Using Sentinel-2A and Landsat-8 Data to Map and Characterize Soil Surface Residue.” Remote Sensing 11 (21): 2583. doi:https://doi.org/10.3390/rs11212583.
- Najafi, P., H. Navid, B. Feizizadeh, and I. Eskandari. 2018. “Object-based Satellite Image Analysis Applied for Crop Residue Estimating Using Landsat OLI Imagery.” International Journal of Remote Sensing 39 (19): 6117–6136. doi:https://doi.org/10.1080/01431161.2018.1454621.
- Namatēvs, I. 2017. “Deep Convolutional Neural Networks: Structure, Feature Extraction and Training.” Information Technology and Management Science 20 (1): 40–47. doi:https://doi.org/10.1515/itms-2017-0007.
- Nitze, I., B. Barrett, and F. Cawkwell. 2015. “Temporal Optimisation of Image Acquisition for Land Cover Classification with Random Forest and MODIS Time-series.” International Journal of Applied Earth Observation and Geoinformation 34: 136–146. doi:https://doi.org/10.1016/j.jag.2014.08.001.
- Omarzadeh, D., Pourmoradian, S., Feizizadeh, B., Khallaghi, H., Sharifi, A., and Valizadeh Kamran, K. 2021. “A GIS-Based Multiple Ecotourism Sustainability Assessment of West Azerbaijan Province, Iran.” Journal of Environmental Planning and Management. doi:https://doi.org/10.1080/09640568.2021.1887827
- Rahimi Balkanlou, K., B. Müller, A. F. Cord, F. Panahi, A. Malekian, M. Jafari, and K. Egli. 2020. “Spatiotemporal Dynamics of Ecosystem Services Provision in A Degraded Ecosystem: A Systematic Assessment in the Lake Urmia Basin, Iran.” Science of the Total Environment. doi:https://doi.org/10.1016/j.scitotenv.2020.137100.
- Romero, A., C. Gatta, and G. Camps-Valls. 2016. “Unsupervised Deep Feature Extraction Forremote Sensing Image Classification.” IEEE Transactions on Geoscience and Remote Sensing 54 (3): 1349–1362. doi:https://doi.org/10.1109/TGRS.2015.2478379.
- Sarmento, P., H. Carrao, and M. Caetano, 2008. A Fuzzy Synthetic Evaluation Approach for Land Cover Cartography Accuracy Assessment. The 8th International Symposium on Spatial Accuracy Assessment in Natural Resources and Environmental Sciences, 25-27 June 2008, Shanghai, China .
- Schmidhuber, J. 2015. “Deep Learning in Neural Networks: An Overview.” Neural Networks : The Official Journal of the International Neural Network Society 61: 85–117.
- Sharma, A., X. Liu, X. Yang, and D. Shi. 2017. “A Patch-based Convolutional Neural Networkfor Remote Sensing Image Classification.” Neural Networks 95: 19–28. doi:https://doi.org/10.1016/j.neunet.2017.07.017.
- Shokati, B., and B. Feizizadeh. 2018. “Sensitivity and Uncertainty Analysis of Agro-ecological Modeling for Saffron Plant Cultivation Using GIS Spatial Decision Making Methods.” Journal of Environmental Planning and Management 62 (3): 517–533. doi:https://doi.org/10.1080/09640568.2018.1427561.
- Singh, P., A. Verma, and N. S. Chaudhari. 2016. “Deep Convolutional Neural Network Classifier for Handwritten Devanagari Character Recognition Satapathy, S., Mandal, J., Udgata, S., and Bhateja, V. eds. ” In Information Systems Design and Intelligent Applications, 551–561. New Delhi: Springer.
- Sudmanns, M., D. Tiede, S. Lang, H. Bergstedt, G. Trost, H. Augustin, A. Baraldi, and T. Blaschke. 2020. “Big Earth Data: Disruptive Changes in Earth Observation Data Management and Analysis?” International Journal of Digital Earth 13 (7): 832–850. doi:https://doi.org/10.1080/17538947.2019.1585976.
- Talukdar, S., P. Singha, S. Mahato, S. Shahfahad Pal, Y. L. Liou, and R. Rahman. 2020. “Land-Use Land-Cover Classification by Machine Learning Classifiers for Satellite, Observations-A Review.” Remote Sensing 12 (7): 1135. doi:https://doi.org/10.3390/rs12071135.Tong.
- Tien Bui, D., P. Biswajeet, L. Owe, and R. Inge. 2020. “Landslide Susceptibility Assessment in Vietnam Using Support Vector Machines, Decision Tree, and Naive Bayes Models.” Mathematical Problems in Engineering. doi:https://doi.org/10.1155/2012/974638.
- Tong, X. Y., G. S. Xia, Q. K. Lu, H. F. Shen, S. Y. Li, S. C. You, and L. P. Zhang, 2018. Learning Transferable Deep Models for Land-use Classification with High-resolution Remote Sensing Images. https://arxiv.org/abs/1807.05713.
- Tsagkatakis, G., A. Aidini, K. Fotiadou, M. Giannopoulos, A. Pentari, and P. Tsakalides. 2019. “Survey of Deep-Learning Approaches for Remote Sensing Observation Enhancement Approaches for Remote Sensing Observation Enhancement.” Sensors 19 (18): 3929; 1–39. doi:https://doi.org/10.3390/s19183929.
- Valizadeh Kamran, K., B. Feizizadeh, K. Khorrami, and Y. Ebadi. 2021. “A Comparative Approach of Support Vector Machine Kernel Functions for GIS-based Landslide Susceptibility Mapping.” Applied Geomatics. doi:https://doi.org/10.1007/2Fs12518-021-00393-0.
- Vetrivel, A., M. Gerke, N. Kerle, F. Nex, and G. Vosselman. 2018. “Disaster Damage Detection through Synergistic Use of Deep Learning and 3D Point Cloud Features Derived Fromvery High Resolution Oblique Aerial Images, and Multiple-kernel-learning.” ISPRS J.Photogramm. Remote Sens 140: 45–59. doi:https://doi.org/10.1016/j.isprsjprs.2017.03.001.
- Vieira, S., W. H. Pinaya, and A. Mechelli. 2017. “Using Deep Learning to Investigate the Neuroimaging Correlates of Psychiatric and Neurological Disorders: Methods and Applications.” Neuroscience and Biobehavioral Reviews 74: 58–75. doi:https://doi.org/10.1016/j.neubiorev.2017.01.002.
- Woznicki, S. A., J. Baynes, S. Panlasigui, M. Mehaffey, and A. Neale. 2019. “Development of a Spatially Complete Floodplain Map of the Conterminous United States Using Random Forest.” Science of the Total Environment 647: 942–953. doi:https://doi.org/10.1016/j.scitotenv.2018.07.353.
- Xia, M., T. Tian, Y. Zhang, Y. Xu, and X. Zhang. 2020. “Dilated Multi-scale Cascade Forest for Satellite Image Classification.” International Journal of Remote Sensing 41 (20): 7779–7800.
- Yamashita, R., M. Nishio, R. K. G. Do, and K. Togashi. 2018. “Convolutional Neural Networks: An Overview and Application in Radiology.” Insights into Imaging 9 (4): 611–629. doi:https://doi.org/10.1007/s13244-018-0639-9.
- Yu, X., X. Wu, and C. Luo. 2017. “Deep Learning in Remote Sensing Scene Classification: A Dataaugmentation Enhanced Convolutional Neural Network Framework.” GIScience and RemoteSensing 54 (5): 741–758. doi:https://doi.org/10.1080/15481603.2017.1323377.
- Zhao, W., S. Du, Q. Wang, and W. J. Emery. 2017. “Contextually Guided Very-high-resolutionimagery Classification with Semantic Segments.” ISPRS J. Photogramm. Remote Sens.132: 48–60. doi:https://doi.org/10.1016/j.isprsjprs.2017.08.011.
- Zhou, W., and A. Troy. 2008. “An Object-based Approach for Analysing and Characterizing Urban Landscape at the Parcel Level.” Int. J. Remote Sens 29 (11): 3119–3135. doi:https://doi.org/10.1080/01431160701469065.
- Zhu, X. X., D. Tuia, L. Mou, G.-S. Xia, L. Zhang, F. Xu, and F. Fraundorfer. 2017. “Deep Learning in Remote Sensing: A Comprehensive Review and List of Resources.” IEEE Geoscience and Remote Sensing Magazine 5 (4): 8–36. doi:https://doi.org/10.1109/MGRS.2017.2762307.
- Zou, Q., L. Ni, T. Zhang, and Q. Wang. 2015. “Deep Learning Based Feature Selection Forremote Sensing Scene Classification.” IEEE Geosci. Remote Sens. Lett 12 (11): 2321–2325. doi:https://doi.org/10.1109/LGRS.2015.2475299.