
 ?Mathematical formulae have been encoded as MathML and are displayed in this HTML version using MathJax in order to improve their display. Uncheck the box to turn MathJax off. This feature requires Javascript. Click on a formula to zoom.
ABSTRACT
Rapid urbanization has profoundly impacted social and environmental systems. China is the world’s largest developing country. Projecting future urban expansion in China is critical to alleviate any adverse impacts and achieve sustainable development goals. However, the existing national-scale urban expansion simulations at low or medium resolutions produce significant distortions in urban spatial patterns, limiting the utility of future projections. High-resolution simulation of urban expansion is challenging on a large scale owing to high computational demands. In this study, we used a high-performance cellular automata model (Tensor-FLUS) to simulate the urban expansion of China from 2015 to 2050, at 30 m spatial resolution, under shared socioeconomic pathways. The high-resolution (30 m) urban expansion simulations preserve greater spatial details and avoid 34.07–37.60% underestimation of the urban area, compared with simulation at 1 km resolution. The environmental impact assessments revealed that future urban expansion mainly encroaches on cropland (88.00–88.29%), with a greater likelihood of occupying productive cropland, placing substantial pressure on food production. Although the proportion of occupied natural land is relatively small (11.32–11.60%), newly expanded urban areas will tend to consume woodland and grassland of high ecological value, leading to profound impacts on the ecosystem. In general, the produced high-resolution future simulations can reduce the uncertainty of environmental impact assessment at the national scale. Furthermore, it can provide consistent projection data for research at the provincial or metropolitan scales to support urban planning and local climate change mitigation.
1. Introduction
With rapid urbanization, over half of the global population (55%) already resides in cities, which is forecast to reach 68% by 2050 (Liu et al. Citation2020). Urban expansion is an increasing public concern associated with several social and environmental problems, including biodiversity reduction (Mcdonald, Kareiva, and Forman Citation2008), ecosystem degradation (Ouyang et al. Citation2016), food security crisis (Seto and Ramankutty Citation2016), deforestation (Defries et al. Citation2010), high energy consumption (Güneralp et al. Citation2017), air pollution (Luo et al. Citation2021), greenhouse gas emissions (Hopkins et al. Citation2016), public health emergencies (Frumkin Citation2002), and hazard exposure (Tellman et al. Citation2021). Appropriate adaptation and mitigation measures and informed urban planning must be formulated to reduce the adverse effects of urbanization on the natural environment and socioeconomic system to achieve the sustainable development goals of the United Nations (Li et al. Citation2021b).
Simulating future urban expansion spatially explicit enables researchers to understand future urban growth patterns and assess their social and environmental impacts (Seto, Güneralp, and Hutyra Citation2012). Urban sprawl models are valuable tools for formulating effective plans and measures to address sustainable development issues (Chen et al. Citation2019). Several urban expansion simulation models have been proposed in recent decades, with the cellular automata (CA) model (e.g. the SLEUTH (Dietzel and Clarke Citation2007), CLUE (Verburg et al. Citation2002), GEOMOD (Pontius, Cornell, and Hall Citation2001), FLUS (Liu et al. Citation2017), and LUSD (He et al. Citation2005)) being one of the most widely employed (Li et al. Citation2017b; Santé et al. Citation2010). The CA model simulates urban expansion by allocating aggregate urban demand to spatially explicit cells in a region based on the relationship between driving forces and urban expansion (Li and Yeh Citation2002). Urban demand at an aggregate scale (e.g. province) is estimated externally using different methods (e.g. Markov-Chain (He et al. Citation2018), system dynamics (Liu et al. Citation2017), panel data regression (Chen et al. Citation2020a), and integrated assessment model (Hurtt et al. Citation2020)) employing socioeconomic statistical data.
Extensive efforts have been invested in improving the CA model’s effectiveness and efficiency. For example, several innovative machine learning approaches have been proposed for mining transition rules for high simulation accuracy, including artificial neural network (ANN) (Liu et al. Citation2017), logistic regression (Wu Citation2002), convolutional neural network (He et al. Citation2018), deep forest (Zhuang et al. Citation2022b), maximum entropy model (Zhang and Wang Citation2022), and Bayesian spatially varying coefficient model (Chen et al. Citation2020b). Parallel computing (Guan and Clarke Citation2010), GPU computing (Li et al. Citation2012), vectorization technology (Xia et al. Citation2020), and tensor computing (Zhuang et al. Citation2022a) have been applied to tackle the computing bottleneck problem in high-performance simulations.
Among the existing CA models, FLUS has been one of the most widely used in recent years. FLUS uses an ANN-based pattern analysis strategy (Liang et al. Citation2021). The pattern analysis strategy utilizes land use data for one date to calculate the development suitability of urban areas overcoming the error propagation problem (Li et al. Citation2021a) and making it suitable for long-term urban expansion simulation (Dong et al. Citation2018). Based on the ANN model, FLUS can consider more complex driving factors during simulation (Chen et al. Citation2020a). Furthermore, FLUS determines whether a cell will become urban using a roulette selection mechanism. Compared with CA models based on fixed thresholds (Johnson et al. Citation2021), the roulette selection can reflect the competition and stochasticity of urban expansion. Several studies have used FLUS to project urban expansion and conduct impact assessments. For example, FLUS was applied to simulate urban expansion in the Pearl River Delta and delineate multi-scenario urban growth boundaries to control disorderly urban sprawl (Liang et al. Citation2018). By integrating Markov chain and ecosystem service value analysis, FLUS was used to evaluate the loss of ecosystem service value caused by urban sprawl by 2030 in the Greater Bay Area to help eco-friendly urban planning formulation (Zhang et al. Citation2022). Similarly, FLUS was integrated with InVEST for simulating and evaluating impacts of urbanization on regional carbon storage to support “carbon neutral” in Changchun (Li et al. Citation2022b).
Several previous urban expansion studies based on CA have focused primarily on metropolitan-scale simulations. However, large-scale urban expansion projections are required to support impact assessments at the national or global scale (Johnson et al. Citation2021). A few such studies have been conducted under a variety of scenarios. On a global scale, LUH2 projected land use change at a 0.25° spatial resolution for 2015–2100 under integrated socioeconomic and climate change scenarios, including an urban category (Hurtt et al. Citation2020). Gao and O’Neill (Citation2020) simulated urban expansion globally at a resolution of 0.125° under shared socioeconomic pathways (SSP) scenarios. Seto, Güneralp, and Hutyra (Citation2012) forecasted urban growth by 2030 globally at a 5 km resolution based on a United Nations population and economy prediction scenario, and evaluated urban expansion’s impact on carbon pools and biodiversity. Chen et al. (Citation2020a) predicted a 1 km-resolution global urban land sprawl up to 2100 under the SSP scenario framework, which was further used to understand how global urbanization affects terrestrial vertebrate diversity (Li et al. Citation2022a). On a national scale, Dong et al. (Citation2018) projected China’s land use change at a 1 km resolution for 2010–2100 under eight socioeconomic and emission scenarios, including an urban category. Chen et al. (Citation2019) simulated the future urban growth of China at 1 km resolution by 2050 under SSP scenarios and investigated its impacts on ecosystem services. Liu et al. (Citation2018) forecasted China’s urban expansion at a 500 m resolution based on a historical trajectory scenario. Simulating urban expansion under established scenarios places related applications and analyses in a unified and comparable framework (Chen et al. Citation2020a). The SSP framework proposed by the Intergovernmental Panel on Climate Change (IPCC) is one of the latest scenario frameworks, describing 5 alternative social, demographic, and economic evolution paths for the 21st century (Riahi et al. Citation2017). Therefore, quantifying urban expansion and its consequences under SSP is critical for IPCC global change assessment (Chen Citation2022). However, existing large-scale urban expansion simulations under SSP scenarios are produced at coarse spatial resolutions considerably lower than the local scale (30 m) because of the high computational power required in high-resolution urban expansion simulations.
The problem with coarse spatial resolution is the distortions of urban spatial patterns. A previous study revealed that the urban land area was underestimated by 19.77% in a 10-km resolution urban map in comparison with that at 1 km resolution (Li et al. Citation2017a). Furthermore, urban expansion is a gradual process (Jiao Citation2015; Li et al. Citation2019). However, in urban simulations using a coarse resolution (1 km), capturing the gradual growth process of the city is difficult (Liu et al. Citation2018). In addition, it is challenging to characterize urban forms in coarse-resolution data (Chen et al. Citation2013). Without considering sufficient spatial details, heterogeneity and dynamics of urban growth can lead to problematic uncertainty in impact assessments and limit the utility of the simulation tools in practical applications such as delineating urban growth boundaries (Liang et al. Citation2018) and analyzing energy consumption owing to urban form (Chen et al. Citation2013).
Regardless of the necessity of simulating national urban expansion at high resolution (30 m), few previous studies have generated such data because of the unaffordable computational burden (Guan and Clarke Citation2010). In this study, the size of China’s urban map at 30 m resolution is 161,500 × 134,825, which is 943 times larger than that at 1 km resolution (5906 × 3909) and 43 times larger than the global urban map at 1 km resolution (34,737 × 14,686). The tremendous demand for computing power has prevented large-scale high-resolution urban expansion simulations (Pijanowski et al. Citation2014).
In this paper, a high-performance CA model (Tensor-FLUS) was used to simulate the urban expansion of China from 2015 to 2050 with a 30 m spatial resolution under SSP scenarios and explore the possible impacts of the urban expansion. Over the past decades, China, the world’s largest developing country, has experienced rapid urbanization and will continue to grow rapidly over the following decades. High-resolution urban expansion simulations are able to deliver invaluable knowledge for better urban planning and policy formulation to support sustainable development (Li et al. Citation2017a). The urban expansion simulation at high resolution (30 m) and large scale (China) performed in this study will supplement the literature on urbanization projections under the SSP scenario framework (Popp et al. Citation2017). Based on high-resolution simulations, the impacts of urban expansion were explored in two aspects: first, the encroachment of cropland and ecological land by urban expansion under a detailed land cover classification scheme; second, the potential grain productivity loss. The produced 30-m resolution urban maps of China in 2050 under the 5 SSP scenarios are openly available at https://figshare.com/s/d2e1ab2bc73b5b48e637.
2. Study area and data
2.1 Study area
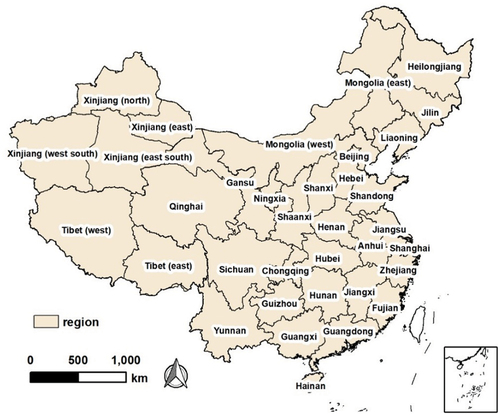
With a total population exceeding 1.4 billion (ranked first) and a land area exceeding 9.6 million km2 (ranked third), China is one of the largest countries in the world. Owing to rapid economic development and population growth, the past few decades have seen significant urbanization in China, which is expected to continue in future decades. This paper simulated the urban expansion of China by 2050 at 30 m resolution and explored its potential environmental impacts under the SSP scenario framework. One raster layer of China at 30 m resolution with float data type consumes > 80GB of computer memory, and implementing the model involves multiple raster layers (e.g. spatial driving factors). Therefore, simulating the urban expansion of China in its entirety is impractical. Thus, China (excluding Hong Kong, Macao, and Taiwan) was divided into several regions, mainly based on provincial administrative divisions. Provinces with large territorial areas (i.e. Tibet, Xinjiang, and Inner Mongolia)were further divided based on municipal administrative divisions. Ultimately, China was divided into 36 regions () for ease of calculations. For simplicity, we refer to all the regions as provinces later in the following text.
Figure 1. The study area (China excluding Hong Kong, Macao, and Taiwan) was divided into 36 regions based on provincial and municipal administrative boundaries for ease of computation.
2.2 Data
This study used the following datasets: urban extent maps, land cover data, spatial driving factors, and crop yield data. Urban extent maps for 2000 and 2015 at 30 m resolution were obtained from a global annual urban dynamics (GAUD) dataset. Produced using a temporal segmentation approach, the GAUD dataset achieves high temporal consistency and obtains an accuracy of 78% for the 2000–2015 period (Liu et al. Citation2020). Owing to its high temporal consistency, the GAUD dataset can avoid the counterintuitive loss of urban land in other datasets (Shafizadeh-Moghadam et al. Citation2019), which is essential for urban expansion modeling. The land cover data in 2000 and 2015 with a 30 m resolution were collected from China Land Use/Cover Dataset (CLUD), produced using a highly accurate human-computer interactive interpretation method with a detailed classification system (Kuang et al. Citation2016). The CLUD comprises six land classes and 25 land subclasses (Liu et al. Citation2014). Combining a detailed classification system with high-resolution urban growth simulation enabled us to investigate the encroachment of definite land cover types (i.e. paddy fields and dry fields) by urban expansion.
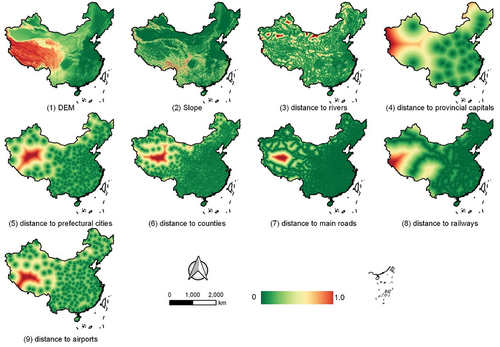
To estimate the urban development suitability, we constructed a dataset of spatial driving factors (). The choice of these factors is mainly based on practices of existing studies and data resolution. These driving factors include natural environmental (DEM, slope, distance to rivers) and socioeconomic (distance to provincial capitals, distance to prefectural cities, distance to counties, distance to main roads, distance to railways, distance to airports) factors. The representativeness and effectiveness of these driving factors have been proven in previous urban expansion modeling studies (Chen et al. Citation2019; He et al. Citation2018). For further justification, a variable importance analysis was conducted (Zhang et al. Citation2019). Table S1 shows the contribution weights of 9 driving factors in 36 regions, which proves that all 9 factors contribute to urban development in this study. Distance variables were generated based on collected feature collections (e.g. sites, road networks, and rivers). The distance between each cell and the nearest feature in Euclidean space was calculated at 30 m resolution. The 30 m DEM data covering China were obtained from ALOS (Tadono et al. Citation2015), and surface analysis was used to produce the slope from DEM. To eliminate the scale effect, we normalized all driving factors by a min-max scaler. The native spatial resolution of all variables in the constructed spatial dataset is 30 m, and low-resolution variables were not used to avoid spatial distortion caused by resampling.
Figure 2. The natural environmental (DEM, slope, distance to rivers) and socioeconomic (distance to provincial capitals, distance to prefectural cities, distance to counties, distance to main roads, distance to railways, distance to airports) driving factors for evaluating urban development suitability.
To evaluate the consequences of urban growth on food production, a potential crop productivity map with a 1 km resolution in 2010 was obtained from Liu (Liu, Xu, and Chen Citation2015). This productivity map was produced by the Global Agro-Ecological Zones (GAEZ) model with a set of factors as input (Liu, Xu, and Chen Citation2015).
3. Methodology
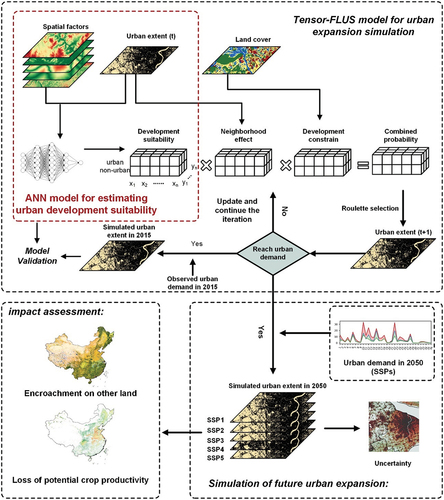
The framework of this study, presented in , includes four parts: (1) the construction and validation of the Tensor-FLUS model, (2) estimation of future urban land demands under the SSP scenarios, (3) simulation of future urban expansion, and (4) environmental impact assessment of future urban expansion.
Figure 3. Framework employed for high-resolution (30 m) urban expansion simulation and environmental impact assessment in China under the SSP scenarios.
3.1 Tensor-FLUS model
The Tensor-FLUS model was employed for urban expansion simulation in this study. The model is built on a widely accepted demand-driven CA model, FLUS, and the Tensor-CA computing pattern (Zhuang et al. Citation2022). Compared with the Parallel-CA computing pattern and the GPU-CA computing pattern, the Tensor-CA computing pattern based on vectorization and GPU is able to significantly improve the CA computation efficiency (Li et al. Citation2010; Guan et al. Citation2016; Zhuang et al. Citation2022a). Based on the Tensor-CA computing pattern, the CA transition rules of FLUS are vectorized into tensor operations and then efficiently solved using the GPU, resulting in a significant performance improvement. Compared with the FLUS model, which processes cells individually, the cell space is processed using vector operations efficiently in the Tenosr-FLUS model (Zhuang et al. Citation2022a). The superior efficiency of the Tensor-FLUS model confirms the feasibility of conducting high-resolution (30 m) urban expansion simulations at the national scale (China).
There are three transition rules in Tensor-FLUS, the same as the FLUS model, including development suitability (P), neighborhood effect (N), and development restriction (R). The combined probability (C) of converting a non-urban cell into an urban cell is the product of these three factors. Because we only simulated urban land, the self-adaptive inertia rule, which expresses the competition of multiple land types in the FLUS model, was ignored. The future urban spatial pattern was simulated by iteratively allocating the urban area demand to spatially explicit cells based on the combined probability.
3.1.1 Urban development suitability estimation using the ANN model
Development suitability represents the probability of urban expansion in a region determined by natural environmental and socioeconomic conditions (Wu et al. Citation2021). In Tensor-FLUS, a three-layer ANN was trained to model nonlinear relationships between urban development suitability and spatial driving factors using urban and non-urban samples and the corresponding spatial driving factors (Li and Yeh Citation2002). A three-layer network is widely acknowledged to model any nonlinear function sufficiently (Zhou and Civco Citation1996) and delivers promising performance in fitting urban development suitability (Liu et al. Citation2017). The three-layer ANN model can be represented using EquationEquations (1)(1)
(1) and (Equation2
(2)
(2) ).
Here is the classification probability of urban (vs. non-urban), which is regarded as the urban development suitability (P);
expresses the value of the spatial driving variable i;
represents the weight connecting the input node i and hidden layer node j;
is the weight connecting the hidden node j and output node k. Sigmoid is an activation function to ensure that the output value of ANN is between 0 and 1 (Li and Yeh Citation2002). Based on the trained ANN model, urban development suitability was estimated for all cells.
In Tensor-FLUS, the urban development suitability remains unchanged during the simulation procedure. Because neural network architectures have been optimized in general tensor computation frameworks, development suitability can be pre-calculated efficiently using GPU and vectorization technology (Okuta et al. Citation2017). We stored the computed suitabilities as tensor , where
is the size of the study area, where
expresses urban development suitability
at location
.
3.1.2 Vectorized CA model
3.1.2.1 Neighborhood effect
The neighborhood effect denotes the influence of the surrounding cells on the central cell. Urban areas are more likely to appear in the cells around preexisting urbanized areas, which is the positive feedback effect of urban development (Li, Zhou, and Chen Citation2020). Here, the neighborhood effect is expressed as the proportion of urban area in the Moore neighborhood (EquationEq. (3)(3)
(3) ).
Here represents the neighborhood effect, d represents the diameter of the Moore neighborhood, and con denotes a function that returns one if the state Sij of the cell (i, j) is urban.
For one item in the cell space, there are d×d–1 neighbors in its neighborhood, denoted as . Therefore, for the entire cell space, there are d×d–1 neighborhood matrices (Zhang and Wang Citation2021), comprising neighbors at the same relative locations, represented as
.
represents the neighborhood effect matrix for the relative position
, which is defined as:
Here U is the matrix of the current urban extent padded with 0 of width . There are two values, 0 and 1, in the matrix U, denoting non-urban and urban cells, respectively. H and W represent the number of columns and rows in the urban map. Finally, the neighborhood effect tensor of the cell space is represented as
.
denotes the current map, which is not considered in the neighborhood effect computation and must be subtracted. The item
denotes the neighborhood effect (N) of the cell at location
.
3.1.2.2 Development restriction
Based on a common assumption in urban expansion simulations, water is regarded as a development restriction area in Tensor-FLUS and cannot be transformed into urban (He et al. Citation2005; Dietzel and Clarke Citation2007). A development restriction tensor was derived based on the land cover map.
means that urban development is allowed at location
and 0 means otherwise.
3.1.2.3 Roulette selection
The combined probability tensor () is represented as EquationEq. (6
(6)
(6) )
Here is the Hadamard product of the three transition rule tensors (Xia et al. Citation2018).
represents the combined probability (C) of a cell at location
developing into an urban cell. To mimic the roulette selection process in the FLUS model,
was normalized and then compared with a tensor of an identical shape comprising random numbers generated from [0, 1]. If the combined probability at location
of
exceeds the corresponding random value, the non-urban cell becomes urban; otherwise, it remains non-urban. The GPU can solve the above tensor operation steps efficiently, and the steps are repeated until the simulated urban expansion satisfies the urban demands.
3.2 Validation of the model
3.2.1 Validation of ANN
We evaluated the accuracy of the model for high-resolution urban expansion simulations in China from two perspectives. First, we evaluated the urban development suitability maps generated by the ANN model using test accuracy and the total operating curve (TOC) approach (Pontius and Si Citation2014). The test accuracy indicates the proportion of samples correctly classified by the ANN model in the testing dataset. Because samples with prediction probabilities > 0.5 are classified as urban and lesser as non-urban, the test accuracy can be utilized to evaluate how well the model fits the urban development suitability (Li, Liu, and Le Citation2014). The test accuracy was calculated as follows:
Here N represents the number of samples in the testing dataset and T the number of samples classified correctly by ANN in the testing dataset.
Using a prediction threshold other than 0.5 may result in different test accuracies. Therefore, the TOC method with various discrimination thresholds was used to further quantify the performance of the ANN model. The curve depicts hits (urban being classified as urban), false alarms (non-urban being classified as urban), misses(urban being classified as non-urban), and correct rejections (non-urban being classified as non-urban) for different prediction thresholds of the ANN model (Liu and Pontius Citation2021). Compared to the traditional receiver operating characteristic method, the TOC approach is more informative and can fully characterize the diagnostic performance of the model. The area under the curve (AUC), which represents the ratio between the area below the TOC curve within the TOC’s parallelogram and the area of the parallelogram of the TOC, is a widely used quantitative evaluation indicator with a range of [0.5, 1]. A high AUC value indicates the excellent performance of the obtained development suitability map, with 1 representing the optimal and 0.5 as the random baseline (Fawcett Citation2006). The formula for calculating the AUC can be found in (Pontius and Si Citation2014).
3.2.2 Validation of the CA simulation
Second, the model’s accuracy was evaluated by simulating the historical urban expansion between 2000 and 2015 using two indicators: figure of merit (FoM) and overall accuracy (OA). OA characterizes the overall consistency between the simulated and observed maps. The OA is calculated as follows:
Here expresses the number of cells with observed type
simulated as type
in the end year. This study considered two types of land: urban and non-urban. FoM depicts the agreement between two maps in the changed cells. Because of the numerous unchanged cells in the simulation process, FoM provides a relatively comprehensive evaluation of the result, avoids the overestimation of OA, and is widely used to assess urban expansion modeling (Tong and Feng Citation2020). The FoM is calculated as follows:
Here A expresses the area that was simulated as unchanged but observed as urbanized (omission error), B represents the area that was simulated and observed to be urbanized (correct hit), and C denotes the area that was simulated as urbanized but observed to be unchanged (commission error).
3.2.3 Evaluation uncertainty analysis
Further, bootstrap strategy was used to obtain 95% confidence intervals for the four metrics mentioned above to investigate the uncertainty of the model evaluation (Michelucci and Venturini Citation2021). Specifically, random sampling from the original sample dataset was used with replacement to create a bootstrap sample dataset of the same size as the original. In total, 100 bootstrap sample datasets were generated to assess the 95% confidence intervals of the metrics.
3.3 Estimation of future urban land demands under SSP scenarios
Future urban land demands must be estimated before spatially explicit urban expansion simulation (Liu et al. Citation2017). Several national- or continental-scale urban demand projections are available under the SSP scenarios (Li et al. Citation2019; Popp et al. Citation2017). However, owing to a lack of relevant societal factor projections, urban demands consistent with the SSP narratives at the metropolitan or provincial scale are still unavailable (Chen Citation2022). In this study, the 1 km SSP urban expansion maps developed by Chen et al. (Citation2020a) were aggregated to obtain the urban demand of each province in China. Specifically, we calculated the urban growth rate of each province from 2015 to 2050 under the 5 SSP scenarios based on 1 km-resolution urban expansion projections. We then applied this rate to urban areas in 2015 based on an urban map with a 30 m resolution to estimate the future urban land demand. Urban demand is commonly estimated by calculating the urban growth rate from other scenario projections with coarse resolutions (Li et al. Citation2017a; Liao et al. Citation2020; Chen Citation2022). Two other SSP urban expansion data sets generated by Li (Citation2021b) and Gao (Citation2020) were also analyzed to determine the uncertainty of the estimated urban demands.
4. Implementation and results
4.1 Implementation and validation of the Tensor-FLUS model
4.1.1 Implementation and validation of the ANN model
Fitting accuracy of the urban development suitability maps generated using the ANN model was assessed to determine the performance of the model for high-resolution urban expansion simulations. In each region, we randomly sampled 10% urban pixels from the urban extent map in year 2000 as urban samples. The maximum number of urban samples was limited to 500,000 to avoid computation efficiency problems. The same number of non-urban samples were randomly collected to assemble a balanced sample dataset. The sample dataset of each region was randomly divided in a ratio of 70:30 to train and test the ANN model, respectively. Each sample was expressed as a vector with a length of 10, including one target variable (urban or non-urban) and 9 predictive variables (driving factors). The constructed three-layer ANN model contained 9 neurons on the input layer, representing the 9 spatial variables, and 2 neurons on the output layer, representing the status of urban and non-urban. The hidden layer had 6 nodes, two-thirds of those in the input layer. It is indicated that 2/3 can guarantee an almost perfect fit for the function (Zhou and Civco Citation1996). The ANN model was implemented using TensorFlow 2.0. The Adam optimizer was used to train the model with a learning rate of 0.001 (Kingma and Ba Citation2015). The batch size was set at 512, and the maximum epochs at 200.
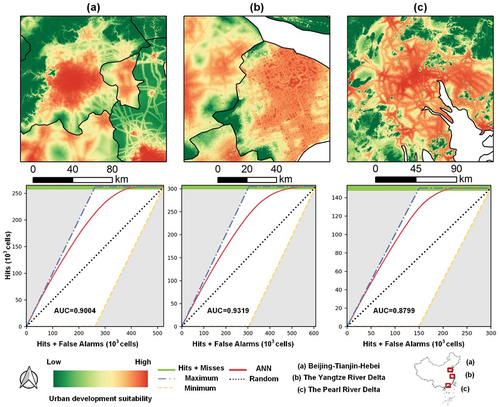
The original metrics and their 95% confidence intervals for the 36 regions are listed in Table S2. As shown in the table, the ANN model had an average test accuracy of 0.8814, with a minimum and maximum accuracy of 0.7667 and 0.9845, respectively, suggesting a satisfactory performance. presents the generated urban development suitability maps and the corresponding TOC curves of three large urban agglomerations in China, including Beijing-Tianjin-Hebei (BTH), the Yangtze River Delta (YRD), and the Pearl River Delta (PRD). The TOC curves for all 36 regions are presented in Figure S1. The curves are far from the baseline, resulting in a high average AUC of 0.9446. The AUC of each province ranges from 0.8534 to 0.9979, considerably higher than the baseline value of 0.5, revealing that the ANN model can satisfactorily model the nonlinear relationship between urban development suitability and spatial driving factors. The 95% confidence interval for test accuracy and AUC was relatively narrow, accounting for only 1.00% and 0.41% on average for the original metrics, respectively, which indicates a low level of uncertainty in the model evaluation. The details of the urban development suitability maps of the three large urban agglomerations presented in adequately characterize the differences between urban and non-urban areas.
Figure 4. Urban development suitability maps and TOC curves of three large urban agglomerations in China: (a) BTH, (b) YRZ, and (c) PRD.
4.1.2 Implementation and validation of the CA simulation
The effectiveness of the model for high-resolution urban expansion simulations was further evaluated by simulating urban growth between 2000 and 2015. The urban area observed in 2015 was used as the urban demand to drive the simulation. The window size of the Moore neighborhood was set to three. The simulated result was compared with the observed urban pattern for 2015, with the OA and FoM indicators used for evaluating the overall and process consistency between the simulated and observed urban patterns.
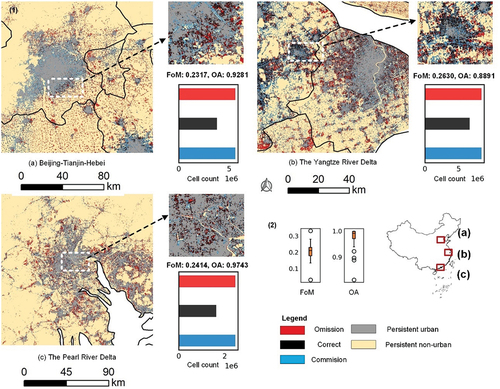
illustrates the OA and FoM boxplots for all provinces. The OA values of the simulation results range from 0.8132 to 0.9999, with an average of 0.9750, revealing high overall agreement (Table S2). The FoM value varies between 0.0312 and 0.3317, with an average of 0.2067 (Table S2). The only region with a low FoM value (< 0.1) is the northern part of Xinjiang, which is located in China’s remote area and has a low urbanization rate and slow urban expansion. Studies have indicated that the FoM value for the existing urban expansion model ranges from 0.01 to 0.30 (Wang et al. Citation2021a). Accurate predictions of urban expansion are challenging because of the path-dependence effect; even if possible, it is easy to overfit historical trend (Brown et al. Citation2005). Our simulation results yielded FoM values similar to or higher than those reported in previous literature, revealing that the accuracy of the model is adequate and reliable for scenario simulations (Johnson et al. Citation2021; Pontius et al. Citation2007). To comprehend the simulation errors, the spatial distribution of correct hits, omission errors, and commission errors in three large urban agglomerations of China is presented in . The figure illustrates that correct hit cells and commission errors cluster around the densely built areas, whereas the omission errors are mainly scattered outside the city. This could be because although the CA model can better simulate sprawling urban expansion, it cannot sufficiently capture leapfrog urban expansion (Liu et al. Citation2010). In terms of uncertainty, the 95% confidence interval for OA and FoM is small, accounting for only 0.01% and 0.83% on average for the original metrics, indicating low uncertainty in the model evaluation.
Figure 5. Evaluation of the Tensor-FLUS model using OA and FoM indicators. (1) Spatial distributions and histograms of correct hits, omission errors, and commission errors in three large urban agglomerations in China. (2) Boxplots of OA and FoM in all provinces.
4.2 Simulation of urban expansion by 2050 under SSP scenario framework
4.2.1 Urban area demand estimation under SSP scenarios
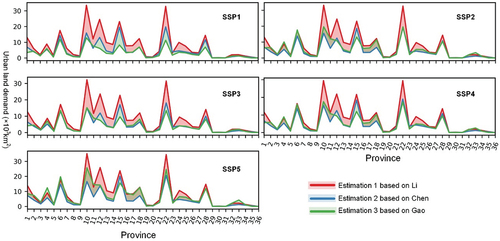
The urban land demand under 5 SSP scenarios of each province by 2050 was estimated by aggregating and adjusting Chen et al.’s (Citation2020a) 1 km urban expansion projection. Table S3 presents China’s future urban land demand under the SSP scenarios. As presented in the table, scenarios SSP5 and SSP1 obtain the largest urban land demand, SSP3 predicts the smallest urban land demand, and scenarios SSP2 and SSP4 have medium urban land demand. Furthermore, the urban demand of each province was also estimated using the 0.125°-resolution urban expansion projection data produced by Gao and O’Neill (Citation2020) and 1 km-resolution urban growth projection generated by Li et al. (Citation2021b) under SSP scenarios to evaluate the uncertainty of future urban demand estimation. . depicts the urban land demand for each province under the 5 SSP scenarios in 2050 calculated based on three different datasets. In SSP1 and SSP3 scenarios, the urban demand used in this study is an intermediate estimate, which is underestimated by 40.07–43.59% compared with the high estimate and overestimated by 9.10–40.62% compared with the low estimate on average, weighted by the estimated urban demand. In SSP2, SSP4, and SSP5 scenarios, the selected urban demand is a low estimate, which is 36.97–41.90% lower than the high estimate and 6.73–26.17% lower than the medium estimate on average, weighted by the estimated urban demand. Considering the multiple alternative paths under the same scenario narrative, the uncertainty in the urban demand estimation used in this study is acceptable (Popp et al. Citation2017).
Figure 6. Urban land demand under 5 SSP scenarios of each province in 2050 calculated based on three different datasets. The shaded areas represent the difference between the three estimations. The numerical labels on the horizontal axis represent individual provinces and are consistent with the order listed in Table S2.
4.2.2 Spatial simulation and analysis
4.2.2.1 Spatial pattern of future urban expansion
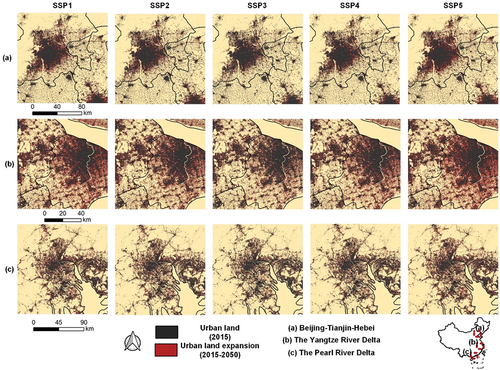
We simulated spatially explicit urban expansion of China from 2015 to 2050 at 30 m resolution using the validated Tensor-FLUS model and estimated urban demand under SSP scenarios. To illustrate the simulation results, the simulated urban patterns of three large urban agglomerations were selected for representation and illustrated in . The simulation results for the entire study area under the SSP scenarios are presented in Figures S2-S6. In a fossil-fueled scenario, SSP5, urban land experienced the greatest expansion owing to rapid economic growth (Kriegler et al. Citation2017). Although SSP1 is a sustainable development scenario, it will maintain a high growth rate similar to that of SSP5 by 2050 (van Vuuren et al. Citation2017). SSP1 and SSP5 were considered high-growth scenarios for China. Scenario SSP2 is a middle path that continues the historical development and exhibits moderate urban expansion (Fricko et al. Citation2017). SSP4 is an inequality development scenario with an urban growth rate similar to that of SSP2 (Calvin et al. Citation2017). SSP2 and SSP4 are China’s medium-growth scenarios. Scenario SSP3 is a regional rivalry path, with the smallest urban expansion, acting as a low-growth scenario for China (Fujimori et al. Citation2017). Spatially, urban expansion mainly occurs in these areas at the edge of highly urbanized areas, exhibiting an agglomeration phenomenon.
Figure 7. Simulated patterns of three large urban agglomerations in 2050 under 5 SSP scenarios. Urban expansion mainly occurs at the edges of highly urbanized areas, exhibiting an agglomeration phenomenon.
4.2.2.2 Spatial uncertainty of future urban expansion
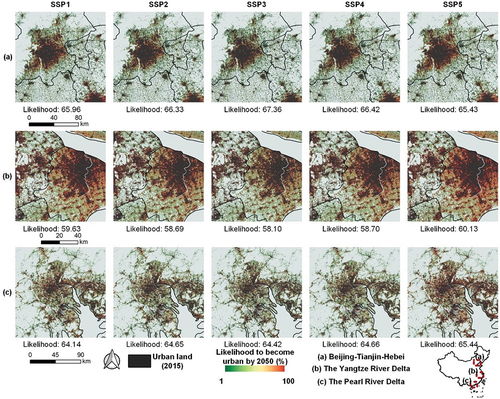
For each scenario, 100 simulations were performed for the three large urban agglomerations in China up to 2050 to assess the spatial uncertainty associated with the simulation results. The simulated maps were then overlapped to estimate the likelihood of urban expansion at each location. presents the spatial distributions of the urban expansion probability in large urban agglomerations in China up to 2050 under the 5 SSP scenarios. The average likelihood of becoming urban by 2050 in BTH, YRZ, and PRD is 66.30%, 59.05%, and 64.86%, respectively, revealing a moderate uncertainty of future urban expansion. Urban expansion in the form of edge expansion and infill near densely urbanized areas has a high degree of certainty because these areas have excellent development conditions. On the other hand, frog-leaping expansion is significantly uncertain in the peripheral marginal areas with poor development conditions, which is almost unpredictable. The uncertainty analysis results of this study can be regarded as probabilistic forecasts of urban expansion (Seto, Güneralp, and Hutyra Citation2012; Zhou, Varquez, and Kanda Citation2019).
Figure 8. Spatial probability distribution of urban expansion in three large urban agglomerations in China by 2050 under 5 SSP scenarios. Cells with a high likelihood of converting to urban by 2050 exhibit a high degree of certainty.
4.2.2.3 Comparing low- and high-resolution simulations
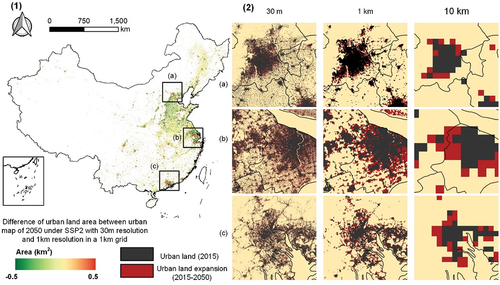
In a coarse-resolution urban extent map, numerous spatial details are ignored, making it difficult to adequately represent the urban features and dynamics. By resampling the simulated 30 m urban map in 2050 for scenario SSP2 to 1 km resolution, we compared the difference in urban areas between the high- and moderate-resolution simulations in each 1 km grid. demonstrates that, except for the highly dense urbanized regions, the urban area in most grids is underestimated, leading to the neglect of several small settlements. The corresponding expansion simulation fails to consider the growth of small settlements and emergence of new cities. Overall, the urban area was underestimated by 34.07–37.60% under different scenarios (Table S4) when the resolution was reduced to 1 km. presents the result of simulating urban expansion up to 2050 under scenario SSP2 using resolutions of 30 m, 1 km, and 10 km in three large urban agglomerations in China. As illustrated in the figure, urban expansion simulations using 1 km or 10 km resolution produce significant distortions in the urban spatial pattern, introducing a high level of uncertainty in environmental impact assessment and limiting the utility of simulations in urban planning.
Figure 9. Distortion of urban spatial details caused by low resolution. (1) Differences in urban land area in a 1 km grid between 30 m- and 1 km-resolution urban maps of 2050 under the SSP2 scenario. (2) Distortion in urban spatial patterns caused by simulation at 1 km and 10 km resolution in three large urban agglomerations of China. (a) Beijing-Tianjin-Hebei, (b) the Yangtze River Delta, and (c) the Pearl River Delta.
4.3 Impact assessment
4.3.1 Detailed structure of land encroached by urban expansion
Considerable cropland and ecological land may be encroached upon by urban expansion in the future. We identified the land composition encroachment by urban expansion by overlaying the future urban extent on a 30 m land cover map for 2015. Incorporating high-resolution future urban extent forecasts with a land cover map and a detailed classification scheme allowed us to analyze specific land structures eroded by urban expansion. The percentages of various land-cover types encroached by future urban expansion are presented in . According to the results, 88.00–88.29% of the new urban land growth will be transformed from cropland by 2050. Farmland is the primary source of urban expansion, with paddy fields accounting for 54.49% and dry farms for 45.51%. In China, as the paddy fields are mainly distributed in the south, there will be greater pressure on farmland protection in south China. Figure S7 depicts the occupied cropland of each county in China by 2050 under the different SSP scenarios. Cropland occupied by future urban expansion is mainly evident in China’s eastern and central parts, which are expected to experience the greatest urban expansion. Woodland contributes 8.64–8.87% of the newly expanded urban land, and forest loss caused by urban expansion is mainly expected to occur in southeast China (Figure S8). Among the occupied woodlands, 40.49%, 10.84%, 25.15%, and 23.52% are closed forest land, open forest land, shrubs, and orchards, respectively, indicating that high-quality woodlands (canopy density) have greater possibility of being occupied owing to urban expansion. Grasslands contribute toward 2.67–2.73% of new urban land, with several such losses projected in northeast China (Figure S9). Among the occupied grasslands, 49.66% have high coverage, 35.18% have medium coverage, and 15.16% have low coverage, indicating that grasslands with higher ecological value have a greater possibility of being occupied. The decrease of unused land owing to urbanization mainly occurs in northern China (Figure S10), contributing 0.39–0.41% of new urban land. Our analysis of the encroachment of urban expansion on woodland and grassland revealed that future urban expansion tends to occupy high-quality ecological land, resulting in severe degradation of ecosystem services. Effective policies must be formulated to balance urban expansion with ecological protection.
Table 1. The proportions (%) of various land covers encroached by future urban expansion under the SSP framework.
4.3.2 Impact of urban expansion on food production
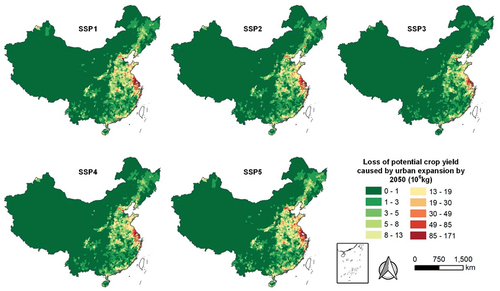
As urban growth mainly occurs in croplands, it may exert significant pressure on food production, threatening food security. Crop productivity losses caused by urban expansion were further estimated by overlapping the maps of future urban extent and potential crop yield (Liu, Xu, and Chen Citation2015). As the spatial resolution of the potential crop yield map was 1 km, we calculated the urban expansion area within the corresponding 1 km grid to evaluate the loss in crop productivity. depicts the crop productivity loss in each county under the different SSP scenarios by 2050. The results indicate that the SSP3 scenario exhibits the minimum estimated loss in crop productivity, mainly because of low urban growth and socioeconomic development. SSP5 scenario estimates the maximum loss in crop productivity because of rapid urban expansion. In general, China’s urban expansion will reduce the potential crop productivity by 0.84–1.65% by 2050, while the direct loss of cropland area is estimated to be 0.71–1.36%. This result reveals that urban expansion tends to encroach on land with high crop productivity. Therefore, it is essential to protect high-quality cultivated land to reduce the impact of urbanization on food security.
Figure 10. Loss in crop productivity of each county under different SSP scenarios by 2050.
5. Discussion and conclusion
Scenario simulation of future urban land expansion is an effective method for supporting sustainable development (Wang et al. Citation2021b). Owing to limitations of medium- and low-resolution urban maps (Li et al. Citation2017a; Chen et al. Citation2020a), national-scale urban expansion simulations at high resolutions provide greater effectiveness in supporting fine-scale urban planning and formulation of mitigation and adaptation policies by the central government. However, few studies are available on large-scale high-resolution urban expansion simulations owing to computational performance constraints.
In this study, the Tensor-FLUS model was employed for urban expansion simulation in China by 2050 at 30 m spatial resolution under 5 SSP scenarios. As a 30 m-resolution map of urban China is extremely large, the study area was divided into 36 regions for separate simulations, which also partly solved the spatial heterogeneity. The future urban demand of each province under the 5 SSP scenarios was estimated by aggregating and adjusting one SSP urban expansion projection. Furthermore, the uncertainty of urban demand estimation was determined by aggregating and adjusting two other SSP urban simulations. The uncertainty analysis revealed that the urban land demand estimations were acceptable.
In order to assess the performance of the model simulating China’s urban expansion at 30 m resolution, we first evaluated the development suitability surface generated by the ANN. An average test accuracy and AUC of 0.8814 and 0.9446 were obtained for the development suitability surface, revealing that the model can satisfactorily characterize the differences between non-urban and urban. The historical urban expansion was then simulated from 2000 to 2015, and the simulation accuracy was evaluated by comparing the observed and simulated patterns in 2015. The model yielded an average OA and FoM of 0.9750 and 0.2067, respectively, which is reliable and adequate for scenario simulations compared with those in other urban expansion studies. Moreover, the 95% confidence interval range of the four metrics was small, indicating low uncertainty in the model evaluation.
Using the validated model and estimated urban demand, we simulated China’s urban expansion up to 2050 at 30 m resolution under SSP scenarios. In scenarios SSP1 and SSP5, China will experience the most significant urban expansion because of rapid technological and economic development, considered a high development path. In SSP2 and SSP4, China maintains the current development trend with moderate urban expansion, considered a medium development path. In SSP3, owing to regional rivalry, China experiences the smallest urban expansion, a low development path. Spatially, urban growth will continue to be concentrated in the existing large urban areas in China, including BTH in the north, the YRD in the middle, and the PRD in the south by 2050. Meanwhile, small settlements in the plains of eastern China will also expand rapidly. The spatial uncertainty analysis of the simulation results reveals urban expansion in the form of edge expansion and infill near densely urbanized areas with suitable development conditions with a high degree of certainty. In contrast, frog-leaping expansion is significantly uncertain in peripheral marginal areas with poor development conditions.
In terms of the environmental impact of urban expansion, urban growth is projected to encroach mainly on cropland (88.00–88.29%), with a slightly higher occupation of paddy fields than that of dry land. Furthermore, the results revealed that urban expansion will lead to a potential crop productivity loss of 0.84–1.65%, which is higher than the direct loss of cultivated land caused by urban expansion (0.71–1.36%), indicating that urban expansion tends to encroach on fertile and productive croplands. Although urban expansion is projected to occupy a relatively small area of other land types (i.e. woodland, grassland, and unused land), it tends to consume natural land with high ecological value, such as closed forest and high-density grassland, which account for the highest proportion of occupied woodland and grassland respectively, resulting in a severe degradation of ecosystem services (Chen, Jiang, and Li Citation2021). Appropriate policies must be formulated to control the encroachment of urban expansion on high-productivity cropland and natural land with high ecological value to achieve a balance between urban development and ecological protection (Phalan et al. Citation2011).
To our knowledge, this is China’s first urban expansion simulation at 30 m resolution under SSP scenarios. Currently, the highest spatial resolution of publicly available multi-temporal urban extent maps with large-scale coverage is 30 m, sufficient to capture urban dynamics fully. At such a high resolution, the gradual expansion process of the city can be modeled, many small residential areas are reserved, more spatial details are obtained, and the environmental impact of urban expansion can be accurately evaluated. The SSP scenario framework is critical for IPCC global change assessment (Chen Citation2022). Therefore, the value of high-resolution urban simulation of China lies not only in accurately assessing the impacts of urban expansion on a national scale and providing decision support to the entire country but also in supplying consistent projection data for research at provincial or metropolitan scales, such as ongoing local climate change research (Chen, Jiang, and Manchun Citation2021) and land space planning (Zhang et al. Citation2020) under SSP scenarios.
This study has a few limitations. First, the driving factors of urban growth remained unchanged during the simulation because of the difficulty and uncertainty in predicting future urban infrastructure changes. Second, In order to avoid spatial distortions caused by resampling, driving factors with low spatial resolution were not used, resulting in some driving factors (e.g. climate) being neglected. Third, the urban demand of each province was not explicitly modeled since the lack of scenario data. However, different provinces generally undergo different stages of urban growth and apply different urban development policies, resulting in different urban demands. How to integrate urban development policies into the model for estimating urban demands and spatially explicit urban expansion simulation needs to be further explored. Fourth, high-resolution simulations of crop productivity can be applied to reduce impact assessment uncertainty.
Supplemental Material
Download MS Word (4.5 MB)Disclosure statement
No potential conflict of interest was reported by the author(s).
Data availability statement
The data that support the findings of this study are available in figShare at https://figshare.com/s/f9c9e3e8ef19b090b957.
Supplemental data
Supplemental data for this article can be accessed online at https://doi.org/10.1080/15481603.2022.2110197.
Additional information
Funding
References
- Brown, D. G., S. Page, R. Riolo, M. Zellner, and W. Rand. 2005. “Path Dependence and the Validation of Agent-Based Spatial Models of Land Use.” International Journal of Geographical Information Science 19 (2): 153–174. doi:10.1080/13658810410001713399.
- Calvin, K., B. Bond-Lamberty, L. Clarke, J. Edmonds, J. Eom, C. Hartin, S. Kim, et al. 2017. “The SSP4: A World of Deepening Inequality.” Global Environmental Change 42 Elsevier Ltd: 284–296. 10.1016/j.gloenvcha.2016.06.010.
- Chen, Y. 2022. “An Extended Patch-Based Cellular Automaton to Simulate Horizontal and Vertical Urban Growth under the Shared Socioeconomic Pathways.” Computers, Environment and Urban Systems 91 Elsevier Ltd: 101727. 10.1016/j.compenvurbsys.2021.101727.
- Chen, S., Y. Feng, Y. Zhen, X. Tong, R. Wang, S. Zhai, C. Gao, Z. Lei, and Y. Jin. 2020b. “A Cellular Automata Approach of Urban Sprawl Simulation with Bayesian Spatially-Varying Transformation Rules.” GIScience and Remote Sensing 57 (7): 924–942. Taylor & Francis 10.1080/15481603.2020.1829376
- Chen, D., P. Jiang, and L. Manchun. 2021. “Assessing Potential Ecosystem Service Dynamics Driven by Urbanization in the Yangtze River Economic Belt, China.” Journal of Environmental Management 292 (December 2020): 112734. Elsevier Ltd 10.1016/j.jenvman.2021.112734
- Chen, G., L. Xia, X. Liu, Y. Chen, X. Liang, J. Leng, X. Xiaocong, et al. 2020a. “Global Projections of Future Urban Land Expansion under Shared Socioeconomic Pathways.” Nature Communications 11 (1) Springer US: 537. doi: 10.1038/s41467-020-14386-x.
- Chen, Y., L. Xia, X. Liu, Y. Zhang, and M. Huang. 2019. “Tele-Connecting China’s Future Urban Growth to Impacts on Ecosystem Services under the Shared Socioeconomic Pathways.” Science of the Total Environment 652 Elsevier B.V: 765–779. 10.1016/j.scitotenv.2018.10.283.
- Chen, Y., L. Xia, S. Wang, X. Liu, and A. Bin. 2013. “Simulating Urban Form and Energy Consumption in the Pearl River Delta under Different Development Strategies.” Annals of the Association of American Geographers 103 (6): 1567–1585. doi:10.1080/00045608.2012.740360.
- Defries, R. S., T. Rudel, M. Uriarte, and M. Hansen. 2010. “Deforestation Driven by Urban Population Growth and Agricultural Trade in the Twenty-First Century.” Nature Geoscience 3 (3): 178–181. Nature Publishing Group 10.1038/ngeo756
- Dietzel, C., and K. C. Clarke. 2007. “Toward Optimal Calibration of the SLEUTH Land Use Change Model.” Transactions in GIS 11 (1): 29–45. doi:10.1111/j.1467-9671.2007.01031.x.
- Dong, N., L. You, W. Cai, L. Gang, and H. Lin. 2018. “Land Use Projections in China under Global Socioeconomic and Emission Scenarios: Utilizing a Scenario-Based Land-Use Change Assessment Framework.” Global Environmental Change 50 Elsevier Ltd: 164–177. 10.1016/j.gloenvcha.2018.04.001.
- Fawcett, T. 2006. “An Introduction to ROC Analysis.” Pattern Recognition Letters 27 (8): 861–874. doi:10.1016/j.patrec.2005.10.010.
- Fricko, O., P. Havlik, J. Rogelj, Z. Klimont, M. Gusti, N. Johnson, P. Kolp, et al. 2017. “The Marker Quantification of the Shared Socioeconomic Pathway 2: A Middle-of-the-Road Scenario for the 21st Century.” Global Environmental Change 42 Elsevier Ltd: 251–267. 10.1016/j.gloenvcha.2016.06.004.
- Frumkin, H. 2002. “Urban Sprawl and Public Health.” Public Health Reports 3–50155. doi:10.1016/S0033-3549(04.
- Fujimori, S., T. Hasegawa, T. Masui, K. Takahashi, D. S. Herran, H. Dai, Y. Hijioka, and M. Kainuma. 2017. “SSP3: AIM Implementation of Shared Socioeconomic Pathways.” Global Environmental Change 42 Elsevier Ltd: 268–283. 10.1016/j.gloenvcha.2016.06.009.
- Gao, J., and B. C. O’Neill. 2020. “Mapping Global Urban Land for the 21st Century with Data-Driven Simulations and Shared Socioeconomic Pathways.” Nature Communications 11 (1): 2302. Springer US 10.1038/s41467-020-15788-7
- Gil, P. R., J. D. Cornell, and C. A. S. Hall. 2001. “Modeling the Spatial Pattern of Land-Use Change with GEOMOD2: Application and Validation for Costa Rica.” Agriculture, Ecosystems & Environment 85 (1–3): 191–203. doi:10.1016/S0167-8809(01)00183-9.
- Guan, Q., and K. C. Clarke. 2010. “A General-Purpose Parallel Raster Processing Programming Library Test Application Using A Geographic Cellular Automata Model.” International Journal of Geographical Information Science 24 (5): 695–722. doi:10.1080/13658810902984228.
- Guan, Q., X. Shi, M. Huang, and C. Lai. 2016. “A Hybrid Parallel Cellular Automata Model for Urban Growth Simulation over GPU/CPU Heterogeneous Architectures.” International Journal of Geographical Information Science 30 (3): 494–514. Taylor & Francis 10.1080/13658816.2015.1039538
- Güneralp, B., Y. Zhou, D. Ürge-Vorsatz, M. Gupta, Y. Sha, P. L. Patel, M. Fragkias, L. Xiaoma, and K. C. Seto. 2017. “Global Scenarios of Urban Density and Its Impacts on Building Energy Use through 2050.” Proceedings of the National Academy of Sciences of the United States of America 114 (34): 8945–8950. doi:10.1073/pnas.1606035114.
- He, C., P. Shi, J. Chen, L. Xiaobing, Y. Pan, L. Jinggang, L. Yuechen, and L. Jinggang. 2005. “Developing Land Use Scenario Dynamics Model by the Integration of System Dynamics Model and Cellular Automata Model.” Science in China, Series D: Earth Sciences 48 (11): 1979–1989. doi:10.1360/04yd0248.
- He, J., L. Xia, Y. Yao, Y. Hong, and Z. Jinbao. 2018. “Mining Transition Rules of Cellular Automata for Simulating Urban Expansion by Using the Deep Learning Techniques.” International Journal of Geographical Information Science 32 (10): 2076–2097. Taylor & Francis 10.1080/13658816.2018.1480783
- Hopkins, F. M., J. R. Ehleringer, S. E. Bush, R. M. Duren, C. E. Miller, C. T. Lai, Y. K. Hsu, V. Carranza, and J. T. Randerson. 2016. “Mitigation of Methane Emissions in Cities: How New Measurements and Partnerships Can Contribute to Emissions Reduction Strategies.” Earth’s Future 4 (9): 408–425. doi:10.1002/2016EF000381.
- Hurtt, G. C., L. Chini, R. Sahajpal, B. L. Steve Frolking, K. C. Bodirsky, J. C. Doelman, J. C. Doelman, et al. 2020. “Harmonization of Global Land Use Change and Management for the Period 850-2100 (LUH2) for CMIP6.” Geoscientific Model Development 13 (11): 5425–5464. doi:10.5194/gmd-13-5425-2020.
- Jiao, L. 2015. “Urban Land Density Function: A New Method to Characterize Urban Expansion.” Landscape and Urban Planning 139 Elsevier B.V: 26–39. 10.1016/j.landurbplan.2015.02.017.
- Johnson, B. A., R. C. Estoque, L. Xuecao, P. Kumar, R. Dasgupta, R. Avtar, and D. B. Magcale-Macandog. 2021. “High-Resolution Urban Change Modeling and Flood Exposure Estimation at A National Scale Using Open Geospatial Data: A Case Study of the Philippines.” Computers, Environment and Urban Systems 90 Elsevier Ltd: 101704. 10.1016/j.compenvurbsys.2021.101704.
- Kingma, D. P., and J. L. Ba. 2015. “Adam: A Method for Stochastic Optimization.” In 3rd International Conference on Learning Representations, ICLR 2015, San Diego, CA, USA. https://arxiv.org/abs/1412.6980.
- Kriegler, E., N. Bauer, A. Popp, F. Humpenöder, M. Leimbach, J. Strefler, L. Baumstark, et al. 2017. “Fossil-Fueled Development (SSP5): An Energy and Resource Intensive Scenario for the 21st Century.” Global Environmental Change 42:297–315. doi:10.1016/j.gloenvcha.2016.05.015.
- Kuang, W., J. Liu, J. Dong, W. Chi, and C. Zhang. 2016. “The Rapid and Massive Urban and Industrial Land Expansions in China between 1990 and 2010: A CLUD-Based Analysis of Their Trajectories, Patterns, and Drivers.” Landscape and Urban Planning 145 Elsevier B.V: 21–33. 10.1016/j.landurbplan.2015.10.001.
- Li, X., G. Chen, X. Liu, X. Liang, S. Wang, Y. Chen, F. Pei, and X. Xiaocong. 2017a. “A New Global Land-Use and Land-Cover Change Product at A 1-Km Resolution for 2010 to 2100 Based on Human–Environment Interactions.” Annals of the American Association of Geographers 107 (5): 1040–1059. doi:10.1080/24694452.2017.1303357.
- Li, X., Y. Chen, X. Liu, X. Xiaocong, and G. Chen. 2017b. “Experiences and Issues of Using Cellular Automata for Assisting Urban and Regional Planning in China.” International Journal of Geographical Information Science 31 (8): 1606–1629. Taylor & Francis 10.1080/13658816.2017.1301457
- Li, G., C. Fang, L. Yingjie, Z. Wang, S. Sun, H. Sanwei, Q. Wei, et al. 2022a. “Global Impacts of Future Urban Expansion on Terrestrial Vertebrate Diversity.” Nature Communications 13 (1) Springer US: 1–12. doi: 10.1038/s41467-022-29324-2.
- Li, X., X. Liu, and Y. Le. 2014. “A Systematic Sensitivity Analysis of Constrained Cellular Automata Model for Urban Growth Simulation Based on Different Transition Rules.” International Journal of Geographical Information Science 28 (7): 1317–1335. doi:10.1080/13658816.2014.883079.
- Li, Y., Z. Liu, L. Shujie, and L. Xiang. 2022b. “Multi-Scenario Simulation Analysis of Land Use and Carbon Storage Changes in Changchun City Based on FLUS and InVEST Model.” Land 11: 5. doi:10.3390/land11050647.
- Li, D., L. Xia, X. P. Liu, Y. M. Chen, S. Y. Li, K. Liu, J. G. Qiao, Y. Z. Zheng, Y. H. Zhang, and C. H. Lao. 2012. “GPU-CA Model for Large-Scale Land-Use Change Simulation.” Chinese Science Bulletin 57 (19): 2442–2452. doi:10.1007/s11434-012-5085-3.
- Li, X., and A. G. O. Yeh. 2002. “Neural-Network-Based Cellular Automata for Simulating Multiple Land Use Changes Using GIS.” International Journal of Geographical Information Science 16 (4): 323–343. doi:10.1080/13658810210137004.
- Li, X., X. Zhang, A. Yeh, and X. Liu. 2010. “Parallel Cellular Automata for Large-Scale Urban Simulation Using Load-Balancing Techniques.” International Journal of Geographical Information Science 24 (6): 803–820. doi:10.1080/13658810903107464.
- Li, X., J. Zhang, L. Zhouyuan, H. Tengyun, W. Qiusheng, J. Yang, J. Huang, et al. 2021a. “Critical Role of Temporal Contexts in Evaluating Urban Cellular Automata Models.” GIScience and Remote Sensing 58 (6) Taylor & Francis: 799–811. doi: 10.1080/15481603.2021.1946261.
- Li, X., Y. Zhou, and W. Chen. 2020. “An Improved Urban Cellular Automata Model by Using the Trend-Adjusted Neighborhood.” Ecological Processes 9 (1): 1–13. Ecological Processes 10.1186/s13717-020-00234-9
- Li, X., Y. Zhou, J. Eom, Y. Sha, and G. R. Asrar. 2019. “Projecting Global Urban Area Growth through 2100 Based on Historical Time Series Data and Future Shared Socioeconomic Pathways.” Earth’s Future 7 (4): 351–362. doi:10.1029/2019EF001152.
- Li, X., Y. Zhou, M. Hejazi, M. Wise, C. Vernon, G. Iyer, and W. Chen. 2021b. “Global Urban Growth between 1870 and 2100 from Integrated High Resolution Mapped Data and Urban Dynamic Modeling.” Communications Earth and Environment 2 (1): 201. Springer US 10.1038/s43247-021-00273-w
- Liang, X., X. Liu, L. Xia, Y. Chen, H. Tian, and Y. Yao. 2018. “Delineating Multi-Scenario Urban Growth Boundaries with a CA-Based FLUS Model and Morphological Method.” Landscape and Urban Planning 177 Elsevier: 47–63. 10.1016/j.landurbplan.2018.04.016.
- Liang, X., K. C. Qingfeng Guan, S. L. Clarke, B. Wang, Y. Yao, and Y. Yao. 2021. “Understanding the Drivers of Sustainable Land Expansion Using A Patch-Generating Land Use Simulation (PLUS) Model: A Case Study in Wuhan, China.” Computers, Environment and Urban Systems 85 Elsevier Ltd: 101569. 10.1016/j.compenvurbsys.2020.101569.
- Liao, W., X. Liu, X. Xiyun, G. Chen, X. Liang, H. Zhang, and L. Xia. 2020. “Projections of Land Use Changes under the Plant Functional Type Classification in Different SSP-RCP Scenarios in China.” Science Bulletin 65 (22): 1935–1947. Science China Press 10.1016/j.scib.2020.07.014
- Liu, X., H. Guohua, A. Bin, L. Xia, G. Tian, Y. Chen, and L. Shaoying. 2018. “Simulating Urban Dynamics in China Using a Gradient Cellular Automata Model Based on S-Shaped Curve Evolution Characteristics.” International Journal of Geographical Information Science 32 (1): 73–101. Taylor & Francis 10.1080/13658816.2017.1376065
- Liu, X., Y. Huang, X. Xiaocong, L. Xuecao, L. Xia, P. Ciais, P. Lin, et al. 2020. “High-Spatiotemporal-Resolution Mapping of Global Urban Change from 1985 to 2015.” Nature Sustainability 3 (7) Springer US: 564–570. doi: 10.1038/s41893-020-0521-x.
- Liu, J., W. Kuang, Z. Zhang, X. Xinliang, Y. Qin, J. Ning, W. Zhou, et al. 2014. “Spatiotemporal Characteristics, Patterns, and Causes of Land-Use Changes in China since the Late 1980s.” Journal of Geographical Sciences 24 (2): 195–210. doi:10.1007/s11442-014-1082-6.
- Liu, X., X. Liang, L. Xia, X. Xiaocong, O. Jinpei, Y. Chen, L. Shaoying, S. Wang, and F. Pei. 2017. “A Future Land Use Simulation Model (FLUS) for Simulating Multiple Land Use Scenarios by Coupling Human and Natural Effects.” Landscape and Urban Planning 168 Elsevier: 94–116. 10.1016/j.landurbplan.2017.09.019.
- Liu, Z., and R. G. Pontius. 2021. “The Total Operating Characteristic from Stratified Random Sampling with an Application to Flood Mapping.” Remote Sensing 13: 19. doi:10.3390/rs13193922.
- Liu, X., L. Xia, Y. Chen, Z. Tan, L. Shaoying, and A. Bin. 2010. “A New Landscape Index for Quantifying Urban Expansion Using Multi-Temporal Remotely Sensed Data.” Landscape Ecology 25 (5): 671–682. doi:10.1007/s10980-010-9454-5.
- Liu, L., X. Xu, and X. Chen. 2015. “Assessing the Impact of Urban Expansion on Potential Crop Yield in China during 1990–2010.” Food Security 7 (1): 33–43. doi:10.1007/s12571-014-0411-z.
- Luo, X., K. Sun, L. Li, W. Sanmang, D. Yan, F. Xiangshan, and H. Luo. 2021. “Impacts of Urbanization Process on PM2.5 Pollution in ‘2+26’ Cities.” Journal of Cleaner Production 284: 124761. doi:10.1016/j.jclepro.2020.124761.
- Mcdonald, R. I., P. Kareiva, and R. T. T. Forman. 2008. “The Implications of Current and Future Urbanization for Global Protected Areas and Biodiversity Conservation.” Biological Conservation 141 (6): 1695–1703. doi:10.1016/j.biocon.2008.04.025.
- Michelucci, U., and F. Venturini. 2021. “Estimating Neural Network’s Performance with Bootstrap: A Tutorial.” Machine Learning and Knowledge Extraction 3 (2): 357–373. doi:10.3390/make3020018.
- Okuta, R., Y. Unno, D. Nishino, S. Hido, and C. Loomis. 2017. “CuPy: A NumPy-Compatible Library for NVIDIA GPU Calculations.” Workshop on ML Systems at NIPS 2017 2017 (Nips): 1–7. http://learningsys.org/nips17/assets/papers/paper_16.pdf.
- Ouyang, Z., H. Zheng, Y. Xiao, S. Polasky, J. Liu, W. Xu, Q. Wang, et al. 2016. “Improvements in Ecosystem Services from Investments in Natural Capital.” Science 352 (6292): 1455–1459. doi:10.1126/science.aaf2295.
- Phalan, B., M. Onial, A. Balmford, and R. E. Green. 2011. “Reconciling Food Production and Biodiversity Conservation: Land Sharing and Land Sparing Compared.” Science 333 (6047): 1289–1291. doi:10.1126/science.1208742.
- Pijanowski, B. C., A. Tayyebi, B. K. Jarrod Doucette, D. B. Pekin, J. Plourde, and J. Plourde. 2014. “A Big Data Urban Growth Simulation at A National Scale: Configuring the GIS and Neural Network Based Land Transformation Model to Run in A High Performance Computing (HPC) Environment.” Environmental Modelling and Software 51 Elsevier Ltd: 250–268. 10.1016/j.envsoft.2013.09.015.
- Pontius, R. G., and S. Kangping. 2014. “The Total Operating Characteristic to Measure Diagnostic Ability for Multiple Thresholds.” International Journal of Geographical Information Science 28 (3): 570–583. Taylor & Francis 10.1080/13658816.2013.862623
- Pontius, R. G., R. Walker, R. Yao-kumah, E. Arima, S. Aldrich, M. Caldas, and D. Vergara. 2007. “Accuracy Assessment for a Simulation Model of Amazonian Deforestation.” Annals of the Association of American Geographers 97 (4): 677–695. doi:10.1111/j.1467-8306.2007.00577.x.
- Popp, A., K. Calvin, S. Fujimori, P. Havlik, F. Humpenöder, E. Stehfest, B. L. Bodirsky, et al. 2017. “Land-Use Futures in the Shared Socio-Economic Pathways.” Global Environmental Change 42 Elsevier Ltd: 331–345. 10.1016/j.gloenvcha.2016.10.002.
- Riahi, K., D. P. van Vuuren, E. Kriegler, J. Edmonds, B. C. O’Neill, S. Fujimori, N. Bauer, et al. 2017. “The Shared Socioeconomic Pathways and Their Energy, Land Use, and Greenhouse Gas Emissions Implications: An Overview.” Global Environmental Change 42:153–168. doi:10.1016/j.gloenvcha.2016.05.009.
- Santé, I., A. M. García, D. Miranda, and R. Crecente. 2010. “Cellular Automata Models for the Simulation of Real-World Urban Processes: A Review and Analysis.” Landscape and Urban Planning 96 (2): 108–122. doi:10.1016/j.landurbplan.2010.03.001.
- Seto, K. C., B. Güneralp, and L. R. Hutyra. 2012. “Global Forecasts of Urban Expansion to 2030 and Direct Impacts on Biodiversity and Carbon Pools.” Proceedings of the National Academy of Sciences of the United States of America 109 (40): 16083–16088. doi:10.1073/pnas.1211658109.
- Seto, K. C., and N. Ramankutty. 2016. “Hidden Linkages between Urbanization and Food Systems.” Science 352 (6288): 943–945. doi:10.1126/science.aaf7439.
- Shafizadeh-Moghadam, H., M. Minaei, Y. Feng, and R. G. Pontius. 2019. “GlobeLand30 Maps Show Four Times Larger Gross than Net Land Change from 2000 to 2010 in Asia.” International Journal of Applied Earth Observation and Geoinformation 78 (February): 240–248. Elsevier 10.1016/j.jag.2019.01.003
- Tadono, T., J. Takaku, K. Tsutsui, F. Oda, and H. Nagai. 2015. “Status of ‘ALOS World 3D (AW3D)’ Global DSM Generation.” In 2015 IEEE International Geoscience and Remote Sensing Symposium (IGARSS), Milan, Italy. IEEE. doi:10.1109/IGARSS.2015.7326657.
- Tellman, B., J. A. Sullivan, C. Kuhn, A. J. Kettner, C. S. Doyle, G. R. Brakenridge, T. A. Erickson, and D. A. Slayback. 2021. “Satellite Imaging Reveals Increased Proportion of Population Exposed to Floods.” Nature 596 (7870): 80–86. Springer US 10.1038/s41586-021-03695-w
- Tong, X., and Y. Feng. 2020. “A Review of Assessment Methods for Cellular Automata Models of Land-Use Change and Urban Growth.” International Journal of Geographical Information Science 34 (5): 866–898. Taylor & Francis 10.1080/13658816.2019.1684499
- van Vuuren, D. P., E. Stehfest, D. E. H. J. Gernaat, J. C. Doelman, M. van den Berg, M. Harmsen, H. S. de Boer, et al. 2017. “Energy, Land-Use and Greenhouse Gas Emissions Trajectories under a Green Growth Paradigm.” Global Environmental Change 42 Elsevier Ltd: 237–250. 10.1016/j.gloenvcha.2016.05.008.
- Verburg, P. H., A. Welmoed Soepboer, R. L. Veldkamp, V. Espaldon, S. S. A. Mastura, and S. H. A. R. I. F. A. H. S. A. MASTURA. 2002. “Modeling the Spatial Dynamics of Regional Land Use: The CLUE-S Model.” Environmental Management 30 (3): 391–405. doi:10.1007/s00267-002-2630-x.
- Wang, Q., Q. Guan, J. Lin, H. Luo, Z. Tan, and M. Yunrui. 2021a. “Simulating Land Use/Land Cover Change in an Arid Region with the Coupling Models.” Ecological Indicators 122 Elsevier Ltd: 107231. 10.1016/j.ecolind.2020.107231.
- Wang, Y., V. V. Jasper, N. Debonne, P. Lijie, and P. H. Verburg. 2021b. “Settlement Changes after Peak Population: Land System Projections for China until 2050.” Landscape and Urban Planning 209 : 104045. Elsevier B.V. 10.1016/j.landurbplan.2021.104045
- Wu, F. 2002. “Calibration of Stochastic Cellular Automata: The Application to Rural-Urban Land Conversions.” International Journal of Geographical Information Science 16 (8): 795–818. doi:10.1080/13658810210157769.
- Wu, H., A. Lin, X. Xing, D. Song, and L. Yan. 2021. “Identifying Core Driving Factors of Urban Land Use Change from Global Land Cover Products and POI Data Using the Random Forest Method.” International Journal of Applied Earth Observation and Geoinformation 103 Elsevier B.V: 102475. 10.1016/j.jag.2021.102475.
- Xia, C., H. Wang, A. Zhang, and W. Zhang. 2018. “A High-Performance Cellular Automata Model for Urban Simulation Based on Vectorization and Parallel Computing Technology.” International Journal of Geographical Information Science 32 (2): 399–424. Taylor & Francis 10.1080/13658816.2017.1390118
- Xia, C., B. Zhang, H. Wang, S. Qiao, and A. Zhang. 2020. “A Minimum-Volume Oriented Bounding Box Strategy for Improving the Performance of Urban Cellular Automata Based on Vectorization and Parallel Computing Technology.” GIScience & Remote Sensing 57 (1): 91–106. Taylor & Francis 10.1080/15481603.2019.1670974
- Zhang, D., X. Liu, Z. Lin, X. Zhang, and H. Zhang. 2020. “The Delineation of Urban Growth Boundaries in Complex Ecological Environment Areas by Using Cellular Automata and a Dual-Environmental Evaluation.” Journal of Cleaner Production 256: 120361. doi:10.1016/j.jclepro.2020.120361.
- Zhang, D., X. Liu, W. Xiaoyu, Y. Yao, W. Xinxin, and Y. Chen. 2019. “Multiple Intra-Urban Land Use Simulations and Driving Factors Analysis: A Case Study in Huicheng, China.” GIScience and Remote Sensing 56 (2): 282–308. Taylor& Francis 10.1080/15481603.2018.1507074
- Zhang, B., and H. Wang. 2021. “A New Type of Dual-Scale Neighborhood Based on Vectorization for Cellular Automata Models.” GIScience & Remote Sensing 58 (3): 386–404. Taylor & Francis 10.1080/15481603.2021.1883946
- Zhang, B., and H. Wang. 2022. “Exploring the Advantages of the Maximum Entropy Model in Calibrating Cellular Automata for Urban Growth Simulation: A Comparative Study of Four Methods.” GIScience and Remote Sensing 59 (1): 71–95. Taylor & Francis 10.1080/15481603.2021.2016240
- Zhang, J., L. Xuecao, C. Zhang, L. Yu, J. Wang, X. Wu, Z. Hu, et al. 2022. “Assessing Spatiotemporal Variations and Predicting Changes in Ecosystem Service Values in the Guangdong–Hong Kong–Macao Greater Bay Area.” GIScience & Remote Sensing 1–16. doi:10.1080/15481603.2021.2022427.
- Zhou, J., and D. L. Civco. 1996. “Using Genetic Learning Neural Networks for Spatial Decision Making in GIS.” Photogrammetric Engineering and Remote Sensing 62 (11): 1287–1295.
- Zhou, Y., A. C. G. Varquez, and M. Kanda. 2019. “High-Resolution Global Urban Growth Projection Based on Multiple Applications of the SLEUTH Urban Growth Model.” Scientific Data 6 (1): 34. Springer US 10.1038/s41597-019-0048-z
- Zhuang, H., X. Liu, X. Liang, Y. Yan, H. Jinqiang, Y. Cai, W. Changjiang, X. Zhang, and H. Zhang. 2022a. “Tensor-CA: A High-Performance Cellular Automata Model for Land Use Simulation Based on Vectorization and GPU.” Transactions in GIS 26 (2): 755–778. doi:10.1111/tgis.12881.
- Zhuang, H., X. Liu, Y. Yan, D. Zhang, H. Jialyu, H. Jinqiang, X. Zhang, H. Zhang, and L. Manchun. 2022b. “Integrating a Deep Forest Algorithm with Vector-Based Cellular Automata for Urban Land Change Simulation.” Transactions in GIS 1–25. doi:10.1111/tgis.12935.