
 ?Mathematical formulae have been encoded as MathML and are displayed in this HTML version using MathJax in order to improve their display. Uncheck the box to turn MathJax off. This feature requires Javascript. Click on a formula to zoom.
ABSTRACT
The differences in the definition of urban areas lead to our contrasting or inconsistent understanding of global urban development and their corresponding socioeconomic and environmental impacts. The existing urban areas were widely identified by the boundaries of built-environment or social-connections, rather than urban entities that are essentially the spatial extents of human activity agglomerations. Thus, this study has attempted to map and evaluate global urban entities (2000–2020) from a perspective of an updated urban concept of urban entities based on the consistent remotely sensed nighttime light data. First, a K-means algorithm was developed to cluster urban and non-urban pixels automatically in consideration of global region division. Then, a post-processing was conducted to enhance the temporal and logical consistency of urban entities during the study period. Rationality assessment indicates that urban entities derived from remotely sensed nighttime light data more effectively reflect the spatial agglomeration extents of human activities than those of physical urban areas. Global urban entities increased from 157,733 km2 in 2000 to 470,632 km2 in 2020 accompanied by a differentiated urban expansion at global, continental, and national levels. Our study provides long-time series and fine-resolution datasets (500 m) and new research avenues for spatiotemporal analysis of global urban entity expansion with the improvement of the understanding of urbanization and the emergence of effective urban mapping theories and approaches.
1. Introduction
A potential premise for understanding and predicting urban growth paths and solving future sustainable development problems is to identify urban areas on the basis of specific urban characteristics. Areas with physical surfaces occupied by roads, buildings, and other infrastructure are often regarded as urban areas (Zhou et al. Citation2014; Zhang et al. Citation2020). Although the definition characterizes urban physical characteristics from the perspective of landscape components or structures (Gong et al. Citation2020), it cannot effectively evaluate inherent human activity aggregation characteristics (Ellison, Glaeser, and Kerr Citation2010). In addition, invisible human perception and socioeconomic urban functions should be interpreted as different expressions of urban structures (Keuschnigg Citation2019), but these cannot be accurately implemented to specific spatial regions at long time series and large scale. From an economic perspective, urban areas are essentially aggregated entities of population (or human activity) for promoting socially, economically, and environmentally sustainable development. The socioeconomic reason for the urban existence is mainly attributed to the benefits brought by agglomeration effects (e.g. economy scale, positive externality, and labor force accumulation).
An economics-based definition of urban areas would facilitate practical socioeconomic application analysis. For example, it is more appropriate to analyze the vacancy rate of urban housing from the perspective of urban human activities rather than the physical surface of a city (Chen et al. Citation2015). Thus, urban areas should be defined as urban entities with both socioeconomic and natural characteristics. Generally, urban entities ought to have three characteristics as follows. (1) Urban entities should be the spatial expressions of highly concentrated human social and economic activities. (2) The spatial form of urban entities should be characterized by concentration and continuity. (3) Urban entities have the same physical properties from a large-scale perspective.
Traditionally, population density or size are usually selected as the main criterion for defining urban entities by governments (Habitat Citation2006). For instance, taking a certain population density as the threshold, the LandScan data and WorldPop datasets were usually employed to define urbanized entities (Henderson, Nigmatulina, and Kriticos Citation2019). Although “population urban entities” meet the identification of urban “population” in economics, the differences in population size or density with various national conditions worldwide make them impossible to use for forming unified urban entities across diverse countries (Cohen Citation2006). Satellite remotely sensed data provide great potential in urban entity mapping on a large scale. Currently, global urban entity mappings are usually derived from Moderate Resolution Imaging Spectrometer (MODIS) data (Schneider, Friedl, and Potere Citation2010), Landsat observations (Kuang et al. Citation2021), and Sentinel data (Taubenböck et al. Citation2012), which are mostly designed on revealing the temporal and spatial distributions of artificial impervious extents or urban built-up areas. However, existing urban theories indicate that urban development is a complex mosaic or process, and urban areas should not be determined solely by the visual physical structure (Grove, Cadenasso, and Pickett Citation2015).
Satellite-based nighttime light (NTL) observations can effectively monitor human-caused light sources from cities, towns, and other places, as well as traffic flow, with persistent human-caused lights, which present a great potential to measure the spatiotemporal changes of socioeconomic activities and urbanization process (Noam et al. Citation2020; Small, Pozzi, and Elvidge Citation2005). Unlike traditional remotely sensed data focused on reflecting the morphological and texture information of landscapes, NTL data can provide coupling information of lights and spatiotemporal locations (Zhao et al. Citation2019). Specifically, the Defense Meteorological Satellite Program’s Operational Line-scan System (DMSP-OLS) data and the Suomi National Polar Partnership-Visible Infrared Imaging Radiometer Suite instrument onboard (SNPP-VIIRS) data, as the two most popular NTL data, are widely employed in the extraction of urban entities (Zheng, Weng, and Wang Citation2021), evaluate urbanization (Ma et al. Citation2014), estimate socioeconomic parameters (e.g. population, gross domestic product (GDP), carbon emissions, and building stock) (Shi et al. Citation2014, Citation2015, Citation2021, Citation2019), and analyzed other events related to human activities (Shi et al. Citation2020, Citation2021). Theoretically, the use of NTL data to delineate and map urban entities has two advantages: (1) They can effectively identify urban entities from a human activity agglomeration perspective (Henderson, Nigmatulina, and Kriticos Citation2019). (2) They can expediently map urban entity expansion at a nearly global coverage and long temporal frequencies within their minimal spatial resolution (Elvidge et al. Citation2009). Many studies have attempted to extract urban entities by using NTL data from different angles, but the following issues still need further in-depth analysis. First, most studies rarely discussed what are the contents they are mapping or reflecting (Hu et al. Citation2020). Some studies still regarded the extracted urban entities as urban built-up areas or impervious surfaces (Chen et al. Citation2019). Although a few studies realized the necessity of defining urban entities and recognized NTLs to reflect human activity attributes, most of them assumed that urban areas are equivalent to urban physical extents (Zhao et al. Citation2019; Zhou et al. Citation2014). On the basis of these assumptions, impervious surfaces or urban built-up areas were often employed as validated references (Hu et al. Citation2020). As mentioned above, urban entities are complex mosaics that mainly reflect the spatial agglomerations of population or human activities (United Nations, Department of Economic, and Population Division Social Affairs Citation2018; Hu et al. Citation2020). Therefore, the credibility and universality of NTL data-derived urban entities, which reflect the spatial agglomeration extents of human activities, should be further explored and verified. Second, although DMSP-OLS (1992–2013) and SNPP-VIIRS (2012-present) have valuable time series, longer urban expansion on a global scale are still lacking due to NTL data source inconsistencies. In particular, global urban mappings after the 21st century are lacking as the world has experienced a violent process of urbanization. Currently, urbanization monitoring of NTL is limited to medium- and short-term studies, either based on DMSP-OLS data (1992–2013) or SNPP-VIIRS data (2012-present). Only a few studies used consistent NTL data to analyze global or regional urban expansion (Zhao et al. Citation2020, Citation2022; He et al. Citation2019). With the advent of a new generation of long-time series, consistent NTL data (hereinafter referred to as SNPP-VIIRS-like), global urban expansion aimed at identifying urban entities have a unique advantage in revealing the process of global urbanization.
In consideration of the limitations of current urban mappings in NTL data, improvements of urban entity mapping within consistent NTL data demand updates with the renewal of the understanding of urbanization and the emergence of effective urban mapping theories and methods. Thus, this study will map and evaluate global urban entities during the period 2000–2020 from a perspective of an updated urban concept of urban entities based on the consistent “SNPP-VIIRS-like” data generated previously. Rather than adopting widely used threshold-based methods, we proposed a K-means algorithm and a post-processing, which can directly identify urban entities on a pixel scale without a need for additional data in accordance with the light intensity characteristics of SNPP-VIIRS-like data. The value is to update understandings of urban entities derived from NTL data, and an equally important goal is to eliminate the need for auxiliary datasets to map urban expansion flexibly in different regions and time periods to support urban sustainable development efficiently.
2. Materials
The primary dataset used to delineate global urban entities was the newly generated SNPP-VIIRS-like data from 2000 to 2020 (Chen et al. Citation2021). The dataset generated using the framework of SNPP-VIIRS and DMSP-OLS data can provide temporally consistent and extended SNPP-VIIRS-like data compared with the previous versions of DMSP-OLS or DMSP-OLS-like data. The NPP-VIIRS-like data (2000–2012) simulated from DMSP-OLS data by using a new cross-sensor calibration and the corrected annual SNPP-VIIRS data (2013–2020) are considered for consistent NTL data. The use of SNPP-VIIRS-like data can effectively eliminate saturation and overflow effects with a higher spatial resolution (500 m) and relatively wide radiation values. The dataset has been publicly released in the Harvard Dataverse (https://dataverse.harvard.edu/dataset.xhtml?persistentId=doi:10.7910/DVN/YGIVCD#).
The population data of LandScan were employed to assess the rationality of urban entities derived from NTL data. The data were obtained from Oak Ridge National Laboratory. LandScan data were developed from an ambient population measure with a 1 km spatial resolution by using nocturnal and diurnal population estimates from multiple data sources, such as census and remotely sensed data. The use of LandScan data allows not only to assess the ambient population with potential day and night populations but also to identify the potential distribution of population in different built covers from high-resolution satellite data effectively (Rose and Bright Citation2014). LandScan data have been widely employed to define and validate urban areas in different regions or countries (Henderson, Nigmatulina, and Kriticos Citation2019).
Two types of physical urban areas, namely, artificial impervious extents (hereinafter referred to as MODIS) collected from the data product of MODIS Land Cover Type Version 6 and urban built-up areas (hereinafter referred to as HE) proposed by He et al. (Citation2019), were used to evaluate spatial extents in comparison with urban entities derived from SNPP-VIIRS-like data. As one of the most widely used and analyzed urban products, the MODIS data (500 m) were developed from supervised classifications with a post-processing that incorporated ancillary information and prior knowledge (Sulla-Menashe and Friedl Citation2018). The HE data (1 km) were produced through a fully convolutional network by using multisource remotely sensed data with average values of 90.9% and 0.47% for OA and kappa, respectively (He et al. Citation2019), which fairly effectively and accurately represent actual urban built-up extents globally with long time series.
Other ancillary data, such as Terra land surface temperature (LST, 1 km), Terra vegetation index (VI, 500 m), Terra land water (250 m), and Landsat 8 OLI (30 m), were obtained from the Google Earth Engine platform. The 2010 developed land (30 m) reflecting urban areas was acquired from GlobeLand30. Road networks were extracted from OpenStreetMap. Statistical data, including urban population and GDP, were obtained from the United Nations and World Bank, respectively. Administrative boundaries were collected from Natural Earth.
3. Methods
Due to heterogeneous light brightness in different urban development types, existing threshold methods cannot effectively extract optimal urban boundaries. In addition, the traditional mutation detection method not only has certain requirements for urban forms but also extracts urban boundaries manually and subjectively (Yang et al. Citation2017). As a classical unsupervised clustering algorithm, the K-means algorithm provides a fast and efficient way for image classifications without requirements for urban forms on a pixel scale (Delmelle Citation2015). Compared with other methods, the K-means algorithm has less uncertainty in extraction results and effectively solves the non-objectivity problem in previous studies (Feng, Peng, and Wu Citation2020). Thus, the K-means algorithm was used to map global urban entities (2000–2020) on the basis of the time series of the SNPP-VIIRS-like data. First, the K-means algorithm was developed to identify urban and non-urban pixels automatically with an appropriate zoning. Then, a post-processing was conducted to improve the temporal and logical consistency of urban entities during the study period. The details will be stated in the following sections.
3.1. Urban entity extraction based on the K-means algorithm
From urban centers to rural hinterlands, the difference in NTL intensity presents a significant trend, although the intensity in the urban – rural transition zone shows a gradual weakening trend. Thus, urban entities can be effectively extracted by distinguishing the difference between urban and rural NTL intensities (Xie, Weng, and Fu Citation2019; Zhou et al. Citation2018; Noam et al. Citation2020). We developed a K-means algorithm to identify urban entities automatically by distinguishing the difference in NTL intensity. This algorithm divides the dataset with n objects into k clusters in accordance with distance, which was mainly regarded as the similarity measurement and evaluation standard. Although comprehensively comparing the attributes of n objects, the output meets the highest similarity of objects in the same clusters. Given its simple clustering process and structure in spherically distributed datasets, the K-means algorithm has been widely used in many fields of Earth science (Delmelle Citation2015; Feng, Peng, and Wu Citation2020).
In this study, the NTL images could be segmented into a series of pixel matrices, and the feature types represented by each pixel in an image were obtained through cluster analysis. When evident differences in the observed values of various ground types in a pixel matrix exist, the clustering method can reasonably detect diverse objects. The unsupervised classification algorithm can directly identify feature types on a pixel scale without special requirements for urban forms. Hence, the K-means algorithm was used to segment the SNPP-VIIRS-like data into two categories (k = 2): urban areas and non-urban areas. After the K-means clustering iteration, the difference between urban and non-urban areas was judged on the basis of gray value.
However, extracting urban entities via the K-means algorithm may be limited by “distance.” When global NTL data are employed as the input dataset, the light radiation value captured by satellites may be affected by the degree of socieconomic development in different regions, resulting in an unstable clustering effect without the optimal value. To avoid the “distance” effect, we should divide the global NTL data into several subregions for extracting urban entities carefully and accurately. We tried to divide the world into several regions in accordance with different degrees and chose a certain division as the optimal standard. Taking 1°, 5°, 10°, and 20° as examples, we selected some cities in China for experiments, judged urban entity changes after clustering in each block, and evaluated the effect of image zoning on data clustering accuracy. As shown in Figure. S1, we found that when the zoning standards are 5°–10°, total urban pixel changes present the most stable trend. This means that bright attributes-based clustering at these scales does provide stable results. To maximize convenience, we divided the world into several regions in accordance with longitude and latitude 10° and input the partitioned NTL dataset into the classifier.
The specific process was as follows. First, we randomly selected two pixels with different attribute values as the centers of the initial categories. Second, these sample pixels were assigned to the most appropriate clusters by judging the similarity between the attribute value of each pixel xt (t = 1, …, n) and the centers of the two categories. Third, in the j-th iteration, we successively calculated Euclidean distances (ED) for all points in the dataset xt to centers. In accordance with the minimum ED, xt was included in the cluster of
with the smallest distance. The average distance of each newly obtained cluster was recalculated, and the cluster was regarded as the subsequent cluster center. Then, the process was repeated until the cluster center was no longer updating; that is, the criterion function E is convergent.
where E is the minimum square error of cluster C={Cl, C2, C3,… Ck} for sample x clustering from the SNPP-VIIRS-like data. The smaller the E value is, the higher the similarity of the samples in the cluster is. is the center of cluster Ci when iterating j + 1 times.
In this study, the sum of error square criterion function was used in the clustering criterion function.
where P represents all pixels in cluster Ci, and Mi is the arithmetic mean of all pixels in cluster Ci. JC is a mapping between data objects and cluster centers. Considering that JC can reflect the error of clustering results, we need to find the clustering results that can minimize JC as much as possible.
3.2. Post-processing
To maintain the logical consistency of spatial and temporal changes in urban entities, we post-processed the initial annual urban entities automatically extracted using the K-means algorithm from long-time series SNPP-VIIRS-like data. The post-treatment scheme consisted of three main steps. (1) An iterative temporal filtered procedure was performed for the initial binary urban entities. It follows logically that the urban entities that emerged in the previous year will basically be retained in the following year (He et al. Citation2014). The temporal inconsistency of annual initial urban entities was corrected through a temporal moving window (Li et al. Citation2019). By changing labels with low temporal consistency probability, isolated pixels in urban entities of contiguous years could be effectively reduced. (2) Although misclassification noises could be corrected with temporal filtering, the resulting sequence may be illogical, including alternating urban and non-urban segments. A logical reasoning improvement was employed to check for irreversible conversion between non-urban and urban areas (Li, Gong, and Liang Citation2015), because in theory, human activity agglomeration extent cannot disappear suddenly unless irreversible events (Henderson, Nigmatulina, and Kriticos Citation2019; He et al. Citation2014). (3) We deleted independent objects less than 2 km2, which are considered extremely small to function for urban entities (Hu et al. Citation2020; Henderson, Nigmatulina, and Kriticos Citation2019). This particular size can be a local refinement process that may be improved in other areas with the addition of spatiotemporal big data (Hu et al. Citation2020). Through this post-processing, we obtained more reliable global urban dynamics from 2000 to 2020 with less spatial and temporal inconsistency.
4. Results
4.1. Rationality assessment of urban entity extracted from SNPP-VIIRS-like data
Urban areas varied greatly in previous studies due to different definitions or objectives (Zhou et al. Citation2018; Hu et al. Citation2020). Considering that urban entities extracted from SNPP-VIIRS-like data mainly reflect the spatial agglomeration extents of human activities (hereinafter referred to as urban entities), visual and quantitative evaluations were employed to validate urban entities as follows. First, urban entities were visually compared with LandScan population products and road networks. The purpose is to emphasize that urban entities are closely related to human activities with both socioeconomic and natural characteristics. The approach also fills in the gap of not being able to directly extract urban entities based on population or other social perception data. Second, comparisons were conducted between urban entities and physical urban areas (e.g. artificial impervious extents or urban built-up areas) to identify their similarities and differences. The purpose is to enable readers to deeply understand how different urban definitions depict global urbanization. Third, considering that urbanization is closely related to socioeconomic development, comparisons were performed between urban entities and socioeconomic parameters (e.g. urban population and GDP). It is intended to highlight the human activity aggregation characteristics that are reflected in urban entities. These different comparisons would guarantee the urban entity reliability.
4.1.1. Comparisons with the LandScan population product and road networks
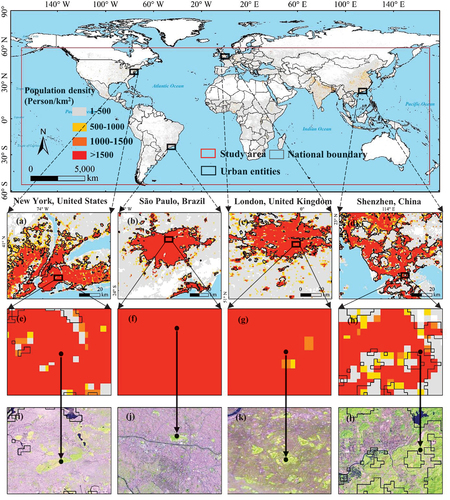
Before comparisons, we classified the population density within the LandScan population product into four categories: 1–500, 500–1000, 1000–1500, and >1500 person/km2. The reason was that 500, 1000, and 1500 person/km2 are often referred to as the optimal thresholds when using population density to define urban entities within different levels of urban development (Henderson, Nigmatulina, and Kriticos Citation2019). This classification avoided the confusion of urban area identification due to the lack of unified population density threshold globally. That is, extents with a population density greater than 500 person/km2 can even be considered urban areas in some sparsely populated regions or countries (Henderson, Nigmatulina, and Kriticos Citation2019). As shown in , urban entities can spatially capture the changes in a population density of at least more than 500 person/km2. Specifically, through overlaying the extracted urban areas on the LandScan population product, we found that urban entities can basically reveal the spatial distribution of a population density of at least more than 500 person/km2 within different types of cities (e.g. New York, São Paulo, London, and Shenzhen) in distinct continents. These cities are selected because they are evenly distributed on each continent and are among the largest in these regions. Owing to the selection of developed metropolises, the population density in urban areas was basically greater than 1500 person/km2, while the population density was greater than 500 person/km2 only in some urban fringe areas. This finding confirmed that urban entities effectively reflect the spatial agglomeration extents of human activities, which is considerably in line with the definition of urban population density. However, we also found that some sporadic areas with a population density of more than 500 person/km2 or even 1500 person/km2 around urban agglomeration patches were not defined as urban entities (). The reason is that the urban entity definition depends not only on population density but also partly on population size. For example, the European Commission defined urban areas in accordance with the threshold of 1500 person/km2 and the total population threshold of 50,000 people (Taubenböck et al. Citation2012). Moreover, some areas with a population density greater than 1500 person/km2 were identified as urban entities, but they were not human construction land from the Landsat images (). This was due to the fact that urban entities are defined from the perspective of human activity agglomerations. Even if there are not many human-occupied buildings in a certain region, it can be identified as urban entities as long as it meets certain population density and size.
Figure 1. Comparisons of urban entities with the LandScan population product and Landsat images in 2015.
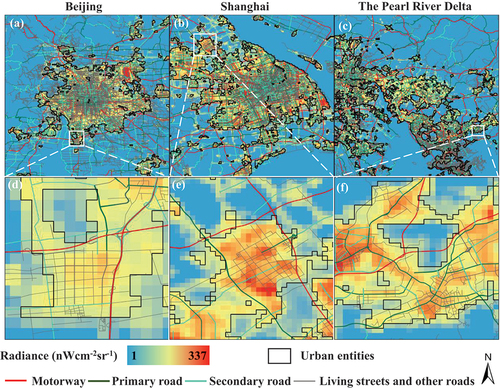
Urban commuting zones, which reflect the human activity scope and employment extent, are also widely defined as urban entities from the perspective of population agglomeration in economics. Thus, road networks were selected as comparison references because roads are transmission mediums of human commuting activities. For visual comparisons, urban entities were overlaid on road networks as an example of different cities in China (). We found that urban entities highly overlapped with high-density road networks. The denser the roads were, the brighter the lights were (). In addition, different levels of roads could indirectly represent various urban attributes. For example, motorway and primary road were regarded as “the main artery” connecting different cities and regions; living street and other roads were “the capillary,” which were the main mediums of human activities within urban areas. We found that the boundaries between urban entities and living street and other roads had a good spatial consistency within different cities (). The reason was that the NPP-VIIRS-like data can indirectly reflect human commuting zones, which is considerably in line with the perspective of human activity “flow,” because the data can monitor the lights of cars on the roads concentrated in urban commuter areas (Henderson, Nigmatulina, and Kriticos Citation2019). These results further proved that the NPP-VIIRS-like data can effectively identify entities, which are highly in line with urban definitions from the spatial agglomeration extent of population.
Figure 2. Comparisons of urban entities with road networks in different cities of China in 2015.
4.1.2. Comparisons with global urban products
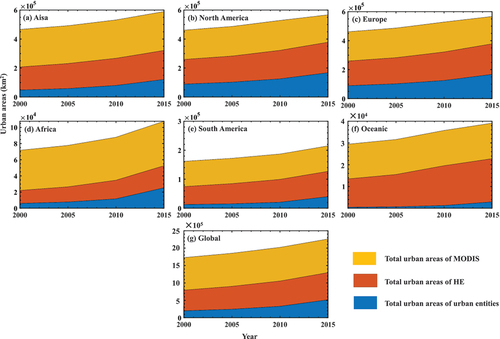
Given that artificial impervious extents or urban built-up areas derived from satellite remotely sensed data are widely used as urban extent references, two global urban products, MODIS and He, were selected for assessment and intercomparison with urban entities. As shown in , the total areas of urban entities were basically consistent with the total areas of HE and MODIS worldwide, with R2 values no less than 0.73 and relatively low root-mean-square errors no more than 4389 at the national level. However, we found that most national points were located at the bottom right of the 1:1 line, indicating that the total areas of urban entities were generally lower than those of HE and MODIS globally. To verify this analysis further, we recalculated the total areas of urban entities, HE, and MODIS at the global and continental levels (). The total areas of MODIS were the highest, followed by those of HE and urban entities. The area differences also maintained a relatively stable trend within different levels and regions. This inconsistency can be explained as follows. First, artificial impervious extents (or urban built-up areas) with large size and dim lights (e.g. water, grass, and forest) within large patches were usually excluded in urban entities. Second, artificial impervious areas (or urban built-up areas) with dim lights around urban fringes (e.g. towns or large villages) were possibly excluded in urban entities. Third, some scattered artificial impervious extents (or built-up areas) around urban fringes with brightness lights were also excluded in urban entities. Essentially, urban entities was identified from the perspective of the spatial agglomeration extent of human activities, while artificial impervious extents (or urban built-up areas) were delimited from the perspective of urban landscape or physical structure. For example, some water conservancy facilities or motorway intersections around urban fringes could be identified as artificial impervious extents or urban built-up areas, but they would not be recognized as a part of urban entities due to the low human activity agglomerations. The cognition is basically consistent with the study of Zhao et al. (Citation2020), which indicated that NTL-derived urban entities correspond to 20%-45% range of artificial impervious extents.
Figure 3. Regression comparisons of total areas from urban entities with those from HE and MODIS at the national level from 2000 to 2020. Note: HE represents urban built-up areas proposed by He et al. (Citation2019); MODIS represents artificial impervious extents collected from the data product of MODIS Land Cover Type Version 6. Below are all the same abbreviations.
Figure 4. Comparisons of total areas from urban entities with those from MODIS and HE at the global and continental levels.
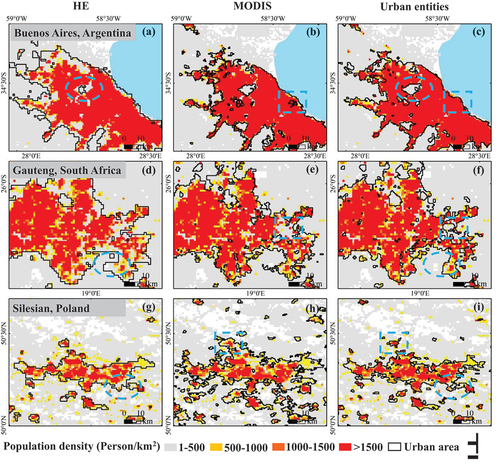
Through overlaying urban entities, HE, and MODIS on the LandScan population product, we found that urban entities showed relative agreement with the LandScan population product with a population density of at least more than 500 person/km2 in the experimental objects of Buenos Aires, Gauteng, and Silesia (). However, there were still spatial differences. For HE, some low-density and even non-populated extents within or around patches were identified as urban areas (, (d), (g)). For MODIS, some high-population-density areas were not only omitted within patches (), but also many low-population-density areas were defined as urban areas or patches (, (h)). By contrast, urban entities in this study identified urban entities with a high population density of more than 500 person/km2. Spatial comparisons proved that physical urban areas were greater than urban entities, which was attributed to the differences in the attributes of urban objects they recognized. The results are consistent with .
Figure 5. Spatial comparisons of urban entities, MODIS, and HE with the LandScan population product in 2015.
Following the approaches suggested by Sutton, Cova, and Elvidge (Citation2006) and He et al. (Citation2014), we further identified the spatial consistency of urban areas with different definitions and data sources. City samples were selected from important cities with various urbanization levels on different continents, and reference urban entities were extracted from the LandScan population product with a referenced population density threshold (≥1500 person/km2) (Harrison Citation2008; Henderson, Nigmatulina, and Kriticos Citation2019), because many authorities (e.g. Union Commission and the Organization for Economic Co-operation and Development) usually define urban entities as a group of continuous grid squares, in which the population density is greater than or equal to 1500 person/km2 in some developed cities. Comparisons displayed that the spatial consistency of urban entities were higher than that of HE and MODIS (Table S1). Specifically, the average OA and kappa of urban entities were 74.29%–99.34% and 0.22–0.75, respectively. The average OA and kappa of HE were 76.05%-97.88% and 0.22–0.59, respectively. The average OA and kappa of MODIS were 78.69%-97.85% and 0.21–0.65, respectively. Except for London, the average OA and kappa of urban entities were higher than those of HE and MODIS. Thus, compared with the urban references of the LandScan population product, urban entities can be adopted for delineating urban extents when considering the spatial agglomeration extents of socioeconomic attributes.
4.1.3. Comparisons with socioeconomic statistics
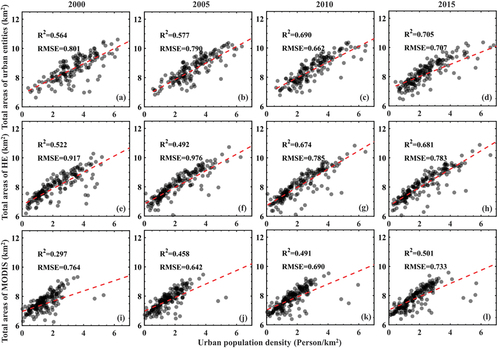
To prove that urban entities are partly consistent with urban definitions from the perspective of socioeconomic agglomerations, we further evaluated the relationships between urban entities and statistical data (e.g. urban population and GDP) provided by the United Nations at the national level during the period of 2000–2015. As shown in and S2-S4, although all regressions passed the significance test (>0.01), the correlation coefficient (R2) values of urban entities with statistical data were the highest in the regression results. Specifically, the R2 values of total areas of urban entities (TA) and urban population density were 0.56–0.71 (), whereas those of total areas of HE (TH) and urban population density and total areas of MODIS (TM) and urban population density were 0.49–0.68 and 0.30–0.50, respectively (). The R2 values of TA growth with urban population growth were 0.29–0.39 (Figures. S2(a)-(d)), which were higher than the values of TH growth with urban population growth (0.23–0.33) and the values of TM growth with urban population growth (0.28–0.38) (Figures. S2(e)-(l)). Furthermore, we found that the R2 values of TA-GDP were 0.80–0.82 (Figures. S3(a)-(d)), whereas those of TH-GDP and TM-GDP were 0.77–82 and 0.59–68, respectively (Figs. S3(e)-(l)). The R2 values of TH growth-GDP growth were 0.54–0.69 (Figures. S4(a)-(d)), which were higher than the values of TH growth-GDP growth (0.38–0.52) and TM growth-GDP growth (0.18–0.45) (Figures. S4(e)-(l)). The results presented that urban entities could better reflect socioeconomic development than He and MODIS.
Figure 6. Correlations of total areas of urban entities, MODIS, and HE with urban population density at the national level.
4.2. Evaluations of global urban entity expansion
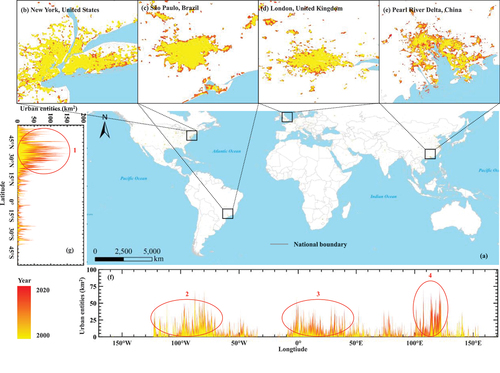
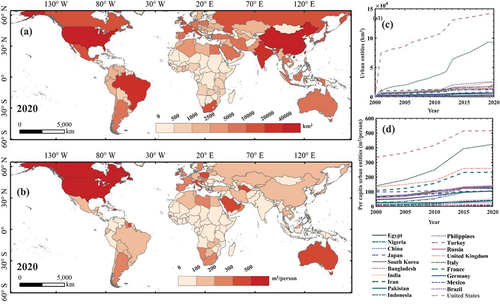
As shown in , we found that the world presented a rapid and differentiated urban entity expansion since 2000. Globally, urban entities increased from 157,733 km2 in 2000 to 470,632 km2 in 2020. Urban distributions showed notable differences with various longitudinal and latitudinal zones. From the longitudinal perspective, regions 2, 3, and 4 presented peaks with large-scale urban entity distributions in North America, Western Europe, and East Asia (). From the latitudinal perspective, region 1 showed a peak with large-scale urban entity distributions in the mid-latitude of the Northern Hemisphere (). These peaks also showed the temporal differences of urban entity expansion. For example, compared with regions 2 and 3, region 4 had experienced a larger urban entity expansion in the later period, which corresponded to the results shown in . This phenomenon may be attributed to the unprecedented urbanization process in East Asia, especially in China.
Figure 7. Global urban entity expansion from 2000 to 2020. Note: (b)-(e) urban entity expansion patterns of sample cities located in different continents; (g)-(f) urban entity expansion by longitude and latitude.
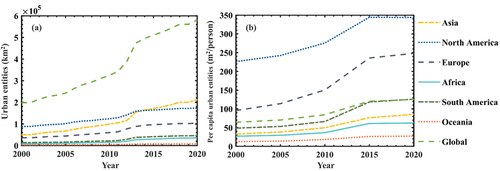
Global urban entity expansion also showed significant intercontinental differences. As depicted in , Asia, North America, and Europe experienced faster urban entity expansion than other continents over the past two decades. Specifically, urban entities in Asia increased from 42,198 km2 in 2000 to 181,990 km2 in 2020. In North America, urban entities increased from 70,105 km2 in 2000 to 138,669 km2 in 2020. In Europe, urban entities increased from 23,766 km2 in 2000 to 68,561 km2 in 2020. In addition, urban entities increased by 25,678, 30049, and 4022 km2 in Africa, South America, and Oceania, respectively. Compared with urban entities, per capita urban entities presented a completely different dynamic pattern (). Among the continents, Europe experienced the largest per capita urban entities expansion, followed by North America, South America, Asia, Africa, and Oceania.
Figure 8. Urban entity expansion at the continental level. Note: (a) urban entities; (b) per capita urban entities.
Moreover, urban entity expansion varied among different countries over the past decades. From the spatial pattern perspective, we found that urban entities were mainly distributed in the United States, China, Brazil, India, and Russia, all of which have a vast territory and a large population (). Meanwhile, developed countries (e.g. the United States, Italy, Canada, and the United Kingdom) were the top countries with the highest per capita urban entities in 2020 (). From the temporal perspective, a notable example was found in China, where urban entities increased from 9438 km2 in 2000 to 78,545 km2 in 2020 (). Developing countries, such as India, Indonesia, Iran, Turkey, Nigeria, and Mexico, also experienced rapid urban expansion. Furthermore, we found that developed countries, like Italy, the United States, Russia, the United Kingdom, and France, showed high per capita urban entities with a stable growth rate (). On the contrary, developing countries, such as Nigeria, Bangladesh, the Philippines, India, Pakistan, Indonesia, and China, presented relatively low per capita urban entities, despite with a relatively rapid growth rate (). Hence, although these developed countries maintained a relatively stable urban expansion, no corresponding urban population growth occurred, which likely led to some urban issues, such as urban sprawl (Gounaridis, Newell, and Goodspeed Citation2020). By contrast, the rapid urban entity expansion in such developing countries was often accompanied by large-scale population migration from rural areas to urban areas without corresponding rapid growth in per capita urban area, but this would produce a series of urban issues, such as traffic congestion and environmental pollution.
Figure 9. Urban entity expansion at the national level. Note: (a) urban entities in 2020; (b) per capita urban entities in 2020; (c) urban entities in 20 typical countries; (d) per capita urban entities in 20 typical countries.
5. Discussion
5.1. Advantages of SNPP-VIIRS-like data in urban entity mapping
Most people’s direct mental images for distinguishing urban and non-urban areas are the differences among high buildings, busy streets, farmland, and flowing rivers. This inherited impression may lead researchers and policymakers to adopt visual physical differences as standards to differentiate urban and non-urban areas (Hu et al. Citation2020). However, urban is a complex system, which is composed of many types of spatial mosaics (Brenner and Schmid Citation2014). The reality is that no clear urban boundary exists. When physical structures were used to identify urban boundaries, we would not be able to perceive the agglomeration and positive external effects of urban socioeconomic development to some extent.
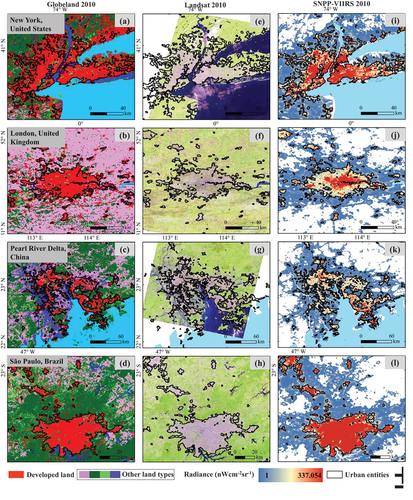
In fact, NTL and urban physical surfaces tell us different stories. To understand these differences, NTL, developed land, and Landsat images were compared to look at their gray surface discrepancies on Earth with the examples of New York, London, the Pearl River Delta, and São Paulo (). Concrete structures and impermeable surfaces showed the same color (e.g. red or purple) in urban and non-rural areas from developed land and Landsat images (), but differences in NTL images were present (). That is, even the same type of land cover surface presented evidently different NTL intensities. These differences were attributed to our diverse ways of viewing urban areas.
Figure 10. Spatial visual differences of NTL, developed land, and Landsat images in 2010.
Many studies have recognized that other human perceptions or functions can also be considered to understand urban entities (Chao et al. Citation2021), in addition to the visual physical structures of human-occupied buildings and roads (Ma et al. Citation2015; Zhou et al. Citation2018). Physical structure data and socially sensed data (e.g. social media data or location-tagged data) should be integrated to develop a more effective approach to identifying urban entities. Nevertheless, the data availability limits the identification of urban entities from the perspectives of large scale and long time series (Shi et al. Citation2020). Coincidentally, NTL cannot only identify the spatial scope of human activities (Shi et al. Citation2014; Xie, Weng, and Fu Citation2019) but can also reflect the intensity differences of socioeconomic development (Shi et al. Citation2014; Chen and Nordhaus Citation2011), which directly reveal the characteristics of urban sizes, shapes, and functions. However, we should recognize that the traditional DMSP-OLS data cannot effectively and truly show spatial human activities due to their spillover effect. Some studies have attempted to extract urban entities based on the DMSP-OLS data and other auxiliary data (Chen et al. Citation2019; Ma et al. Citation2014), but their purposes are to identify urban built-up areas without considering socioeconomic information. In addition, although a few studies have recognized that NTL reflect human activities (Zhao et al. Citation2019; Zhou et al. Citation2018), the results of surface coverage are still used as evaluation criteria. The main difference between our study and the previous studies via NTL data is the perspective of urban area definition. In previous studies for urban mapping, regardless of what auxiliary data they used, NTL data were actually converted into other types of data with reference to physical urban areas (e.g. artificial impervious extents or urban built-up areas) (He et al. Citation2019; Xu et al. Citation2021). Urban entities extracted using NTL data were directly regarded as a kind of physical surface. Nonetheless, the advantage of SNPP-VIIRS-like data is that they can directly reflect the real distribution of human-caused lights for effectively identifying the extents of human activities with elimination of the spillover effect. The verification results further revealed that urban entities are not only more in line with the spatial extent of population agglomeration but also more effectively reflects socioeconomic development. Urban entities are helpful to analyze many issues in urban sustainable development, such as urban sprawl, urban shrinking, and urban living environment suitability.
5.2. Performance of the K-means algorithm in extracting urban entities
Many classification methods have recently been employed to facilitate the extraction of urban entities by using NTL data. As the most popular method, the threshold-based method was widely adopted to extract urban entities on different scales (Zhou et al. Citation2014; Liu et al. Citation2016). However, due to the influence of socioeconomic and natural factors, optimal thresholds present different trends within various regions (Chen et al. Citation2021). Nevertheless, the abrupt change point of urban boundary is often identified by vision, which inevitably needs manual adjustment (Feng, Peng, and Wu Citation2020). In this study, the K-means algorithm did not preset thresholds or parameters, and the clustering process was based on the datasets themselves automatically. Comparisons between urban entities extracted using the reference-based threshold method and our urban entities are shown in . Although the results of the two datasets exhibited a large area of overlap, which preliminarily confirmed that both approaches have certain reliability, we found that the threshold method omitted many high-population-density areas within large patches (, (f)) with an example of Pearl River Delta, China. Mutation detection has also become a common way of urban entity identification without any additional data.
Figure 11. Comparisons among urban entities identified using different approaches. Note: Urban entities identified by (a) the reference-based threshold method, (b) integrating NTL and VI, (c) integrating NTL and LST, and (d) integrating NTL, VI, and LST; (e) and (f) Landsat and LandScan images, respectively. Note: NTL, VI, and LST represent nighttime light data, terra vegetation index, and terra land surface temperature, respectively.
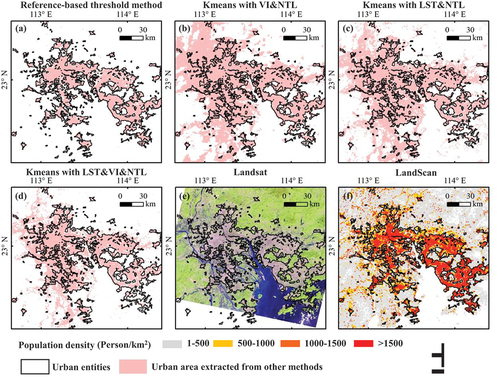
The K-means algorithm with a clustering process we conducted in this study provides a new way to identify urban entities of human activity agglomeration. Many studies have proven that urban area change can be detected through the dimensional characteristics of multiple data sources, such as VI and LST. Thus, we also attempted to map urban entities by integrating NTL, VI, and LST with the K-means algorithm, but we found a significant misidentification by integrating multiple data sources. These identified areas were significantly larger than urban entities and included many low-density or even non-populated areas (). The reason may be that these factors led to the increase in uncertainty in the clustering process. In our study, the advantage of the K-means algorithm was the extraction of urban entities rapidly and effectively by directly using the characteristics of light intensity without any additional data. Given that the basic definitions of urban entity detection and grouping algorithm are concise and explicit, this method can effectively identify and draw urban areas with different definitions. On the basis of the criterion of considering pixel characteristics, the method can be used for comparative analysis in any spatial range or long time series.
5.3. Application: Characteristic analyses of brightness threshold in urban entities
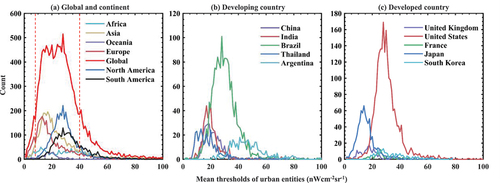
Our results have proven that the K-means algorithm can effectively delineate global urban entity expansion from 2000 to 2020 with different levels of urban development (). Then, we also found that the brightness thresholds of urban entities varied over years globally, which implied that using traditional threshold methods for extracting urban entities is unrealistic. As shown in , the global brightness thresholds of urban entities presented significant fluctuations with a peak range between 10 and 40 nWcm−2sr−1. The brightness threshold ranges of urban entities also showed different patterns in various continents. Specifically, the peak ranges of brightness thresholds in North America (approximately 20–35 nWcm−2sr−1) and South America (approximately 20–40 nWcm−2sr−1) were higher than those in Asia, Europe, and Oceania. Owing to the low level of socioeconomic development, no significant peak ranges were observed in Africa. Ten typical countries were considered as examples, and the brightness threshold ranges were further compared and identified between developing and developed countries (). Developing countries, such as Argentina and Brazil, showed relatively high peak ranges, followed by China, India, and Thailand. The reason may be that the urban population in Argentina and Brazil was relatively concentrated in some mega cities, whereas the population in Thailand, India, and China was relatively distributed in multiple cities. For developed countries, a remarkable phenomenon was that the peak ranges of brightness thresholds in the United States were distributed in 20–38 nWcm−2sr−1, which may be attributed to the development of continuous metropolitan areas with high population density. The peak ranges of brightness thresholds in France and South Korea were approximately 20–30 nWcm−2sr−1, followed by those in the United Kingdom and Japan.
Figure 12. Brightness thresholds of urban entities. Note: (a) Global and continent; (b) developing country; (c) developed country.
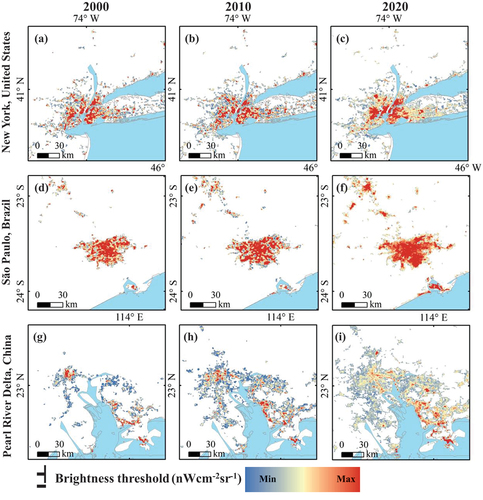
The different brightness thresholds of urban entities can also indicate that various functions or structures existed in urban interiors and fringes (). The results of brightness thresholds in the examples of New York, São Paulo, and the Pearl River Delta showed different urban spatial structures. For example, São Paulo tended to present mono structures, whereas the Pearl River Delta indicated a polycentric structure. The brightness thresholds of urban fringes can also show the interconnections among different urban patches. As illustrated in , we can speculate that stronger interconnections existed within New York than those within the Pearl River Delta.
Figure 13. Brightness thresholds within typical cities in different continents.
6. Conclusions
This study has proposed a K-means algorithm and a post-processing to extract urban entities and evaluate global urban entity expansion (2000–2020) by using SNPP-VIIRS-like data. The advantage would meet the needs of the latest urban mapping and differently updated urban theoretical understanding. The concepts and methods could effectively and efficiently outline the determined urban entities worldwide in accordance with light intensity without any additional data. On this basis, we first developed the K-means algorithm to identify urban and non-urban pixels automatically in consideration of global region division. Then, we performed a post-processing to improve the temporal and logical consistency of urban entities during the study period. The accuracy assessment showed that urban entities spatially agreed well with the urban entities derived from the LandScan population product and road networks. This finding confirmed that urban entities effectively reflect the spatial agglomeration extents of human activities, which are considerably in line with the definition of urban population. We also performed comparisons between urban entities and traditional physical urban areas to identify their similarities and differences. The comparisons confirmed that although urban entities are generally consistent with traditional physical urban areas, it is more credible for delineating urban entities when considering the spatial agglomeration extents of human activities. Correlation comparisons further presented that urban entities could better reflect socioeconomic development than traditional physical urban areas.
The evaluation results show that, in the past 20 years, global urban entities increased from 157,733 km2 in 2000 to 470, 632 km2 in 2020. Asia, North America, and Europe experienced faster urban expansion than other continents. Urban entities were mainly distributed in the United States, China, Brazil, India, and Russia, all of which have a vast territory and a large population. A notable example was found in China, where urban entities increased from 9438 km2 in 2000 to 78,545 km2 in 2020.
Given that urban entities are complex spatial mosaics, the urban boundary should be drawn in accordance with the specific characteristics of research problems or management applications. The brightness threshold results indicated that the global brightness thresholds of urban entities presented a significant fluctuation trend with a peak range between 10 and 40 nWcm−2sr−1. The brightness threshold analysis not only implied that using traditional threshold methods for extracting urban areas is unrealistic but also effectively represented various structures or functions existing in urban interiors and fringes. Our urban mapping lays the basis for human activity reflected from NTL, which is highly in line with the spatial extent of population agglomeration.
Our study provides a more fine-resolution dataset (500 m) for spatiotemporal analysis of urban entity expansion than those of traditional urban areas extracted from DMSP-OLS data on various scales due to the spatial and temporal consistency (Zhou et al. Citation2018). However, there are also some limitations to our study that need to be addressed in the future. For example, the definition of urban entity is still contested and needs clarification and evaluation. Further explanation is needed of how NTL data can be used to extract physical and socioeconomic mechanisms behind urban entities. We should also consider the effects of satellite transit time, the observation geometry impact, and characteristic production lights, such as the pitaya planting in Vietnam, on the extraction of urban entities (Li et al. Citation2019; Dobler et al. Citation2015), although our results have eliminated these effects as much as possible.
Supplemental Material
Download MS Word (4.2 MB)Acknowledgements
We would like to thank Profs. Bailang Yu and Jianping Wu from East China Normal University, China for their helpful training and suggestions on the explorations of remotely sensed nighttime light data. We also want to express our respects and gratitude to the anonymous reviewers and editors for their valuable comments on improving the quality of the paper.
Disclosure statement
No potential conflict of interest was reported by the authors.
Data Availability Statement
Global urban entities (2000–2020) can be downloaded https://dataverse.harvard.edu/dataset.xhtml?persistentId=doi:10.7910/DVN/79CRQJ. The newly generated SNPP-VIIRS-like data are openly available in Harvard Dataverse at https://dataverse.harvard.edu/dataset.xhtml?persistentId=doi:10.7910/DVN/YGIVCD#. Population was extracted from the LandScan datasets. Artificial impervious extents collected from the data product of MODIS Land Cover Type Version 6 and urban built-up areas proposed by He et al. (Citation2019). Terra land surface temperature, Terra vegetation index, Terra land water, and Landsat 8 OLI, were obtained from the Google Earth Engine platform. The 2010 developed land was acquired from GlobeLand30. Road networks were extracted from OpenStreetMap. Statistical data, including urban population and GDP, were obtained from the United Nations and World Bank, respectively. Administrative boundaries were collected from Natural Earth.
Supplemental data
Supplemental data for this article can be accessed online at https://doi.org/10.1080/15481603.2022.2161199
Additional information
Funding
References
- Brenner, N., and C. Schmid. 2014. “The “Urban Age” in Question.” International Journal of Urban Regional Research 38 (3): 731–755. doi:10.1111/1468-2427.12115.
- Chen, Z., B. Yu, C. Yang, Y. Zhou, S. Yao, X. Qian, C. Wang, B. Wu, and J. Wu. 2021. “An Extended Time Series (2000–2018) of Global NPP-VIIRS-Like Nighttime Light Data from a Cross-Sensor Calibration.” Earth System Science Data 13 (3): 889–20. doi:10.5194/essd-13-889-2021.
- Chen, Z., B. Yu, Y. Hu, C. Huang, K. Shi, and J. Wu. 2015. “Estimating House Vacancy Rate in Metropolitan Areas Using NPP-VIIRS Nighttime Light Composite Data.” IEEE Journal of Selected Topics in Applied Earth Observations and Remote Sensing 8 (5): 2188–2197. doi:10.1109/JSTARS.2015.2418201.
- Chen, Z., B. Yu, Y. Zhou, H. Liu, C. Yang, K. Shi, and J. Wu. 2019. “Mapping Global Urban Areas from 2000 to 2012 Using Time-Series Nighttime Light Data and MODIS Products.” IEEE Journal of Selected Topics in Applied Earth Observations and Remote Sensing 12 (4): 1143–1153. doi:10.1109/JSTARS.2019.2900457.
- Chen, X., and W. D. Nordhaus. 2011. “Using Luminosity Data as a Proxy for Economic Statistics.” Proceedings of the National Academy of Sciences 108 (21): 8589–8594. doi:10.1073/pnas.1017031108.
- Cohen, B. 2006. “Urbanization in Developing Countries: Current Trends, Future Projections, and Key Challenges for Sustainability.” Technology in Society 28 (1–2): 63–80. doi:10.1016/j.techsoc.2005.10.005.
- Delmelle, E. C. 2015. “Five Decades of Neighborhood Classifications and Their Transitions: A Comparison of Four US Cities, 1970–2010.” Applied Geography 57: 1–11. doi:10.1016/j.apgeog.2014.12.002.
- Dobler, G., M. Ghandehari, S. E. Koonin, R. Nazari, A. Patrinos, M. S. Sharma, A. Tafvizi, H. T. Vo, and J. S. Wurtele. 2015. “Dynamics of the Urban Lightscape.” Information Systems 54: 115–126. doi:10.1016/j.is.2015.06.002.
- Ellison, G., E. L. Glaeser, and W. R. Kerr. 2010. “What Causes Industry Agglomeration? Evidence from Coagglomeration Patterns.” The American Economic Review 100 (3): 1195–1213.
- Elvidge, C. D., P. C. Sutton, T. Ghosh, B. T. Tuttle, K. E. Baugh, B. Bhaduri, and E. Bright. 2009. “A Global Poverty Map Derived from Satellite Data.” Computers & Geosciences 35 (8): 1652–1660. doi:10.1016/j.cageo.2009.01.009.
- Feng, Z., J. Peng, and J. Wu. 2020. “Using DMSP/OLS Nighttime Light Data and K–Means Method to Identify Urban–Rural Fringe of Megacities.” Habitat International 103: 102227. doi:10.1016/j.habitatint.2020.102227.
- Gong, P., X. Li, J. Wang, Y. Bai, B. Chen, T. Hu, X. Liu, et al. 2020. “Annual Maps of Global Artificial Impervious Area (GAIA) Between 1985 and 2018.” Remote Sensing of Environment 236: 111510. doi:10.1016/j.rse.2019.111510.
- Gounaridis, D., J. P. Newell, and R. Goodspeed. 2020. “The Impact of Urban Sprawl on Forest Landscapes in Southeast Michigan, 1985–2015.” Landscape Ecology 35 (9): 1975–1993. doi:10.1007/s10980-020-01075-9.
- Grove, J. M., M. L. Cadenasso, and S. T. Pickett. 2015. The Baltimore School of Urban Ecology. In: Yale University Press.
- Habitat, U. N. 2006. “ANNOTATION of the Concept of the United Nations Human Settlements Programme (UN-HABITAT) Project:sustainable Development of Cities in Arctic Region Through the Improvement of Their Engineering and Transportation Infrastructure and Personnel Training for Good Urban Governance.“ http://hdl.handle.net/11374/681
- Harrison, J. 2008. OECDTerritorial Reviews: Competitive Cities in the Global Economy–Edited by Lamia Kamal‐chaoui. In: Wiley Online Library.
- He, C., Z. Liu, S. Gou, Q. Zhang, J. Zhang, and L. Xu. 2019. “Detecting Global Urban Expansion Over the Last Three Decades Using a Fully Convolutional Network.” Environmental Research Letters 14 (3): 034008. doi:10.1088/1748-9326/aaf936.
- He, C., Z. Liu, J. Tian, and Q. Ma. 2014. “Urban Expansion Dynamics and Natural Habitat Loss in China: A Multiscale Landscape Perspective.” Global Change Biology 20 (9): 2886–2902. doi:10.1111/gcb.12553.
- Henderson, J. V., D. Nigmatulina, and S. Kriticos. 2019. “Measuring Urban Economic Density.” Journal of Urban Economics 125:103188.
- Hu, X., Y. Qian, S. T. Pickett, and W. Zhou. 2020. “Urban Mapping Needs Up-To-Date Approaches to Provide Diverse Perspectives of Current Urbanization: A Novel Attempt to Map Urban Areas with Nighttime Light Data.” Landscape and Urban Planning 195: 103709. doi:10.1016/j.landurbplan.2019.103709.
- Keuschnigg, M. 2019. “Scaling Trajectories of Cities.” Proceedings of the National Academy of Sciences 116 (28): 13759–13761. doi:10.1073/pnas.1906258116.
- Kuang, W., S. Zhang, X. Li, and D. Lu. 2021. “A 30 M Resolution Dataset of China’s Urban Impervious Surface Area and Green Space, 2000–2018.” Earth System Science Data 13 (1): 63–82. doi:10.5194/essd-13-63-2021.
- Li, X., R. Ma, Q. Zhang, D. Li, S. Liu, T. He, and L. Zhao. 2019. “Anisotropic Characteristic of Artificial Light at Night–Systematic Investigation with VIIRS DNB Multi-Temporal Observations.” Remote Sensing of Environment 233: 111357. doi:10.1016/j.rse.2019.111357.
- Li, X., P. Gong, and L. Liang. 2015. “A 30-Year (1984–2013) Record of Annual Urban Dynamics of Beijing City Derived from Landsat Data.” Remote Sensing of Environment 166: 78–90. doi:10.1016/j.rse.2015.06.007.
- Liu, Y., T. Delahunty, N. Zhao, and G. Cao. 2016. “These Lit Areas are Undeveloped: Delimiting China’s Urban Extents from Thresholded Nighttime Light Imagery.” International Journal of Applied Earth Observation and Geoinformation 50: 39–50. doi:10.1016/j.jag.2016.02.011.
- Ma, T., Y. Zhou, C. Zhou, S. Haynie, T. Pei, and T. Xu. 2015. “Night-Time Light Derived Estimation of Spatio-Temporal Characteristics of Urbanization Dynamics Using DMSP/OLS Satellite Data.” Remote Sensing of Environment 158: 453–464. doi:10.1016/j.rse.2014.11.022.
- Ma, Q., C. He, J. Wu, Z. Liu, Q. Zhang, and Z. Sun. 2014. “Quantifying Spatiotemporal Patterns of Urban Impervious Surfaces in China: An Improved Assessment Using Nighttime Light Data.” Landscape and Urban Planning 130: 36–49. doi:10.1016/j.landurbplan.2014.06.009.
- Noam, L., C. C. Kyba, Q. Zhang, A. S. de Miguel, M. O. Román, X. Li, B. A. Portnov, et al. 2020. “Remote Sensing of Night Lights: A Review and an Outlook for the Future.” Remote Sensing of Environment 237: 111443. doi:10.1016/j.rse.2019.111443.
- Rose, A. N., and E. Bright. 2014. “The LandScan Global Population Distribution Project: Current State of the Art and Prospective Innovation.” In. Technical Report. Oak Ridge National Lab.(ORNL), Oak Ridge, TN (United States)
- Schneider, A., M. A. Friedl, and D. Potere. 2010. “Mapping Global Urban Areas Using MODIS 500-M Data: New Methods and Datasets Based on ‘Urban Ecoregions’.” Remote sensing of environment 114 (8): 1733–1746. doi:10.1016/j.rse.2010.03.003.
- Shi, K., B. Yu, Y. Hu, C. Huang, Y. Chen, Y. Huang, Z. Chen, and J. Wu. 2015. “Modeling and Mapping Total Freight Traffic in China Using NPP-VIIRS Nighttime Light Composite Data.” Giscience & Remote Sensing 52 (3): 274–289. doi:10.1080/15481603.2015.1022420.
- Shi, K., B. Yu, Y. Zhou, Y. Chen, C. Yang, Z. Chen, and J. Wu. 2019. “Spatiotemporal Variations of CO2 Emissions and Their Impact Factors in China: A Comparative Analysis Between the Provincial and Prefectural Levels.” Applied Energy 233-234: 170–181. doi:10.1016/j.apenergy.2018.10.050.
- Shi, K., Z. Chang, Z. Chen, J. Wu, and B. Yu. 2020. “Identifying and Evaluating Poverty Using Multisource Remote Sensing and Point of Interest (POI) Data: A Case Study of Chongqing, China.” Journal of Cleaner Production 255: 120245. doi:10.1016/j.jclepro.2020.120245.
- Shi, K., C. Huang, B. Yu, B. Yin, Y. Huang, and J. Wu. 2014. “Evaluation of NPP-VIIRS Night-Time Light Composite Data for Extracting Built-Up Urban Areas.” Remote Sensing Letters 5 (4): 358–366. doi:10.1080/2150704X.2014.905728.
- Shi, K., J. Shen, Y. Wu, S. Liu, and L. Li. 2021. “Carbon Dioxide (CO2) Emissions from the Service Industry, Traffic, and Secondary Industry as Revealed by the Remotely Sensed Nighttime Light Data.” International Journal of Digital Earth 14 (11): 1514–1527. doi:10.1080/17538947.2021.1946605.
- Small, C., F. Pozzi, and C. D. Elvidge. 2005. “Spatial Analysis of Global Urban Extent from DMSP-OLS Night Lights.” Remote Sensing of Environment 96 (3): 277–291. doi:10.1016/j.rse.2005.02.002.
- Sulla-Menashe, D., and M. A. Friedl. 2018. User Guide to Collection 6 MODIS Land Cover (MCD12Q1 and MCD12C1) Product, 1–18. Reston, VA, USA: USGS.
- Sutton, P., T. Cova, and C. Elvidge. 2006. “Mapping “Exurbia” in the Conterminous United States Using Nighttime Satellite Imagery.” Geocarto international 21 (2): 39–45.
- Taubenböck, H., T. Esch, A. Felbier, M. Wiesner, A. Roth, and S. Dech. 2012. “Monitoring Urbanization in Mega Cities from Space.” Remote Sensing of Environment 117: 162–176. doi:10.1016/j.rse.2011.09.015.
- United Nations, Department of Economic, and Population Division Social Affairs. 2018. “World Urbanization Prospects: The 2018 Revision, Online Edition.” In: Department of Economic and Social Affairs PD, New York, NY.
- Xie, Y., Q. Weng, and P. Fu. 2019. “Temporal Variations of Artificial Nighttime Lights and Their Implications for Urbanization in the Conterminous United States, 2013–2017.” Remote Sensing of Environment 225: 160–174. doi:10.1016/j.rse.2019.03.008.
- Xu, Z., L. Jiao, T. Lan, Z. Zhou, H. Cui, C. Li, G. Xu, and Y. Liu. 2021. “Mapping Hierarchical Urban Boundaries for Global Urban Settlements.” International Journal of Applied Earth Observation and Geoinformation 103: 102480. doi:10.1016/j.jag.2021.102480.
- Yang, Y., M. Ma, C. Tan, and W. Li. 2017. “Spatial Recognition of the Urban-Rural Fringe of Beijing Using DMSP/OLS Nighttime Light Data.” Remote Sensing 9 (11): 1141. doi:10.3390/rs9111141.
- Ye, Y., F. Zhang, L. Ma, Y. Gao, and Y. Liu. 2021. “Urban Function Recognition by Integrating Social Media and Street-Level Imagery.” Environment and Planning B: Urban Analytics and City Science 48 (6): 1430–1444. doi:10.1177/2399808320935467.
- Zhang, X., L. Liu, C. Wu, X. Chen, Y. Gao, S. Xie, and B. Zhang. 2020. “Development of a Global 30 m Impervious Surface Map Using Multisource and Multitemporal Remote Sensing Datasets with the Google Earth Engine Platform.” Earth System Science Data 12 (3): 1625–1648. doi:10.5194/essd-12-1625-2020.
- Zhao, M., C. Cheng, Y. Zhou, X. Li, S. Shen, and C. Song. 2022. “A Global Dataset of Annual Urban Extents (1992–2020) from Harmonized Nighttime Lights.” Earth System Science Data 14 (2): 517–534. doi:10.5194/essd-14-517-2022.
- Zhao, M., Y. Zhou, X. Li, W. Cao, C. He, B. Yu, X. Li, C. D. Elvidge, W. Cheng, and C. Zhou. 2019. “Applications of Satellite Remote Sensing of Nighttime Light Observations: Advances, Challenges, and Perspectives.” Remote Sensing 11 (17): 1971. doi:10.3390/rs11171971.
- Zhao, M., Y. Zhou, X. Li, W. Cheng, C. Zhou, T. Ma, M. Li, and K. Huang. 2020. “Mapping Urban Dynamics (1992–2018) in Southeast Asia Using Consistent Nighttime Light Data from DMSP and VIIRS.” Remote Sensing of Environment 248: 111980. doi:10.1016/j.rse.2020.111980.
- Zheng, Q., Q. Weng, and K. Wang. 2021. “Characterizing Urban Land Changes of 30 Global Megacities Using Nighttime Light Time Series Stacks.” ISPRS Journal of Photogrammetry and Remote Sensing 173: 10–23. doi:10.1016/j.isprsjprs.2021.01.002.
- Zhou, Y., S. J. Smith, C. D. Elvidge, K. Zhao, A. Thomson, and M. Imhoff. 2014. “A Cluster-Based Method to Map Urban Area from DMSP/OLS Nightlights.” Remote Sensing of Environment 147 (18): 173–185. doi:10.1016/j.rse.2014.03.004.
- Zhou, Y., X. Li, G. R. Asrar, S. J. Smith, and M. Imhoff. 2018. “A Global Record of Annual Urban Dynamics (1992-2013) from Nighttime Lights.” Remote Sensing of Environment 219: 206–220. doi:10.1016/j.rse.2018.10.015.