
 ?Mathematical formulae have been encoded as MathML and are displayed in this HTML version using MathJax in order to improve their display. Uncheck the box to turn MathJax off. This feature requires Javascript. Click on a formula to zoom.
ABSTRACT
Leaf functional traits are key indicators of plant functions useful for inferring complex plant processes, including their responses to environmental changes. Vegetation indices (VIs) composed of a few reflectance wavelengths hold the advantages of being relatively simple and effective and have been widely used within remote sensing to estimate leaf traits. However, the difference between the reflectance from the upper and lower part of the leaf suggests that leaf reflectance mainly provides one-sided information, constraining its ability to estimate leaf functional traits. Leaf transmittance, on the other hand, gives information about the whole leaf and has more potential to be sensitive to changes in leaf biochemistry. As transmittance-based VI is rare, this study aims to propose new transmittance-based VIs for accurate estimations of leaf traits. Three forms, i.e. the normalized difference VI, the simple ratio VI, and the difference VI were employed, and wavelength selection for transmittance-based and reflectance-based VIs were conducted, respectively. The applicability of these VIs for estimating four leaf functional traits (leaf chlorophyll (Cab), leaf carotenoids (Car), equivalent water thickness (EWT), and leaf mass per area (LMA)) were evaluated. Cross-validation using three datasets of field observations and sensitivity analysis showed that the VIs constructed using transmittance were relatively less affected by interferences from other leaf parameters, improving the estimation accuracy of Car, EWT, and LMA compared to their optimal reflectance counterparts (RMSE reduced by 2% to 15%, and MAE reduced by 7% to 20% for the pooled dataset). Our study revealed that the normalized difference VI based on transmittance showed considerable sensitivity to Car, EWT, and LMA, whereas the difference VI based on reflectance was effective in indicating Cab. The proposed transmittance-based VIs will aid remote monitoring of leaf traits and thereby plant adaptations and acclimation to changes in environmental conditions.
1. Introduction
Leaf functional traits are measurable and effective indicators that can characterize plant demographic rates, fitness, and photosynthetic capacity (Homolova et al. Citation2013; Reich, Wright, and Lusk Citation2007; Violle et al. Citation2007; Westoby Citation1998). Plant adaptations and acclimation to different environmental conditions are reflected in these traits (Reich, Wright, and Lusk Citation2007). Consequently, accurate predictions of functional traits are important for understanding the survival mechanism of plants and diagnosing plant stress (Asner and Martin Citation2016; Diaz et al. Citation2016).
Leaf Chlorophyll content (Cab) and leaf carotenoids content (Car) are important photosynthetic pigments that ensure the conversion of solar radiation into chemical energy during photosynthesis (Blackburn Citation2007; Croft et al. Citation2017). For a list of used acronyms, see Table S1 in supplementary. Leaf equivalent water thickness (EWT) and leaf mass per area (LMA) are two leaf traits highly related to leaf tissue density (Spafford et al. Citation2021). The trait EWT is also a commonly used indicator to describe plant transpiration and respiration (Yamasaki and Dillenburg Citation1999; Zhang et al. Citation2018), and it is also the abiotic factor with the highest impact on vegetation growth (Asner et al. Citation2014; Nilsen and Orcutt Citation1996). Leaf mass per area (LMA) is the ratio between leaf dry mass and leaf area and it is a key biophysical variable describing plant strategies under the background of rapid climate change (Asner et al. Citation2011; Féret et al. Citation2019). Considering the importance of these traits on plant functions, they were the main target variables in this study.
In recent decades, remote sensing technology with the advantages of being fast, large scale, and nondestructive has been widely used to estimate leaf traits (Fig. S1) (Qu, Li, and Zhang Citation2021; Weiss, Jacob, and Duveiller Citation2020; Zhang et al. Citation2021). Vegetation indices (VI), as a simple empirical method, have been very popular in vegetation remote sensing because of its simplicity, ease of application, and high accuracy (Ali et al. Citation2017). Based on some designed transformation formulas of single or multiple specific spectral wavelengths, VIs can maximize their sensitivity to leaf traits while minimizing sensitivity to disturbing factors such as structural parameters and other traits with similar light absorption (Camps-Valls et al. Citation2021; le Maire, François, and Dufrêne Citation2004; Li et al. Citation2021; Zhou et al. Citation2017). Examples of published VIs applicable for leaf trait monitoring include the red-edge VIs for pigments (Magney, Eitel, and Vierling Citation2017), the normalized difference water index (Zhang et al. Citation2018) and the normalized dry matter index (Wang et al. Citation2011) for EWT and LMA, respectively. Additionally, VIs can be easily integrated with sensors mounted on different platforms owing to their small demand for wavelengths of observation (Wan et al. Citation2021), which explains part of their popularity.
Conventional VIs used to indicate vegetation traits are usually based on leaf or canopy reflectance, as the reflectance is relatively easy to obtain through traditional remote sensing technology (Féret et al. Citation2011; le Maire, François, and Dufrêne Citation2004; Sharifi Citation2020). Although some traits (e.g. Cab, EWT) have been reported with good estimation results through reflectance-based VIs (Ali et al. Citation2017; Féret et al. Citation2011; Kira, Linker, and Gitelson Citation2015; Main et al. Citation2011), the information provided by leaf reflectance is limited. For example, capturing LMA using reflectance-based VIs is remarkably difficult (Le Maire et al. Citation2008).
Both leaf transmittance and reflectance are related to leaf structure and component distribution (Sun et al. Citation2018), yet the extent to which they reflect the attenuation of light in leaves is different. Baránková, Lazár, and Nauš (Citation2016) revealed that the visible and short-wave infrared light reflected from the upper surface of the leaf passes through a longer distance and is easier to be absorbed than light reflected from the lower surface, whereas leaf transmittance is almost the same from both surfaces for most species (Spafford et al. Citation2021). This indicates that leaf transmittance has a larger potential of containing information about the whole leaf than leaf reflectance. In addition, differences between leaf transmittance and reflectance vary among plant species depending on leaf structures. Plant species in different taxonomic groups show large differences in leaf structure. For example, dicotyledons have net-veined leaves, while monocots have parallel veined leaves (Helliker and Ehleringer Citation2000; Liu, An, and Lin Citation2021), oilseed rape and citrus leaves consist mainly of epidermis, palisades, and spongy mesophyll, while rice has almost no palisades and spongy mesophyll (Wan et al. Citation2021). All these factors affect the potential of leaf transmittance and reflectance to estimate leaf traits to some extent.
Although leaf transmittance takes more effort to measure than leaf reflectance, in recent years, the potential of transmittance-based approaches for indicating leaf traits has been revealed. One study found that employing leaf transmittance spectra to estimate Car and LMA through PROSPECT model inversion exhibited better performance than using reflectance spectra (Sun et al. Citation2018). In addition, Asner et al. (Citation2011) suggested that accurate estimates of Cab and Car can be achieved using leaf transmittance spectra measured with a field spectrometer. Bergstrasser et al. (Citation2015) showed an improved estimate of Cab using both leaf transmittance and reflectance from hyperspectral images. However, there is still need for research on establishing the optimal transmittance-based VIs for estimating leaf functional traits compared with traditional reflectance-based VIs.
The main objective of this study was to establish the optimal transmittance VIs for estimating Cab, Car, EWT, and LMA, and investigate their performance against their reflectance counterparts. These traits were selected because of their importance for functioning of the plants, and their applicability for monitoring plant adaptations and acclimation to changes in environmental conditions. In addition to the above, these traits are explicitly considered in the vegetation radiative transfer model of PROSPECT, and the verification data sources of these four traits are relatively richer. First, a sensitivity analysis of reflectance and transmittance to leaf trait variability was performed. Second, a database of field measurements was used to determine the optimal wavelength combinations of three types of VIs based on transmittance or reflectance for each leaf functional trait. Three-fold cross-validation was subsequently used to evaluate the performance of linear regression models using these VIs for estimating the leaf functional traits. A sensitivity analysis of the optimal VIs was performed to evaluate the VI’s ability of resisting interference from other factors, such as structural parameters and other traits with similar light absorption. Finally, the general applicability of these optimal VIs was investigated using simulated datasets.
2. Material and methods
2.1. PROSPECT-D model and sensitivity analysis of reflectance and transmittance to leaf traits
PROSPECT (Jacquemoud and Baret Citation1990) is a broadleaf radiation transfer model based on the generalized plate model (Allen, Gausman, and Richardson Citation1970; Allen et al. Citation1969) and has been widely used in leaf optical modeling for its simplicity and robustness. In the PROSPECT model, the radiative transfer process at leaf-level is simulated with mathematical functions using leaf structure parameter N, refractive index, leaf traits (Cab, EWT, and LMA), and their specific absorption spectra. Among these, the variable N is an imaginary parameter for the PROSPECT model to consider the leaf internal structure. Running the PROSPECT model forward generates leaf directional-hemispherical reflectance and transmittance in the spectral region of 400–2500 nm, with a resolution of 1 nm. The inversion procedure is performed by iteratively identifying the minimum cost function value between the measured and simulated spectra. The PROSPECT-D version was used in this study (Féret et al. Citation2017), with additional consideration for the effects of Car, anthocyanins (Cant) and brown pigment compared to the original PROSPECT version. The PROSPECT-D model has been programmed in an open-source package (http://teledetection.ipgp.jussieu.fr/prosail/), including both python and MATLAB versions. There are other radiative transfer models such as LIBERTY (Dawson, Curran, and Plummer Citation1998) and the Dorsiventral Leaf Model (Stuckens et al. Citation2009), but we used PROSPECT-D given the focus of fresh broad leaves in this study.
When performing a global sensitivity analysis, it is necessary to take into consideration the interactions between model input variables (Cannavó Citation2012). Thus, we conducted a Sobol’s global sensitivity analysis (Cannavó Citation2012; Sobol′ Citation2001) with the PROSEPCT-D model simulations to study the differences in the response of transmittance and reflectance to leaf traits. The Sobol’s sensitivity analysis contains two sets of indices: the first-order indices describe the independent influence of each parameter, whereas the second-order indices consider the interactive influence between the different parameters. The sum of the first- and second-order indices for each wavelength is 1, and the value of each index thereby indicates the contribution of that specific parameter/parameter interaction to the total sensitivity. For the simulated leaf spectral characteristics to represent as large a degree of plant species and leaf growing stages as possible, wide ranges of the input parameters of the PROSPECT-D model were used following (Féret et al. Citation2011; Sun et al. Citation2019). Gaussian distributions of the input parameters were assumed. The input variables used for the PROSPECT-D simulations are shown in .
Table 1. Input parameters of PROSPECT-D model for leaf optical properties modeling.
2.2. Experimental datasets
Three datasets of field measurements from various ecoregions covering 1005 fresh leaves of more than 100 species were used in this study. These data represent foliage information of heterogeneous sites and climate conditions (see further in Supplementary). The ANGERS leaf database was established in 2003 in Angers, France (Feret et al. Citation2008), containing 276 leaves from 43 herbaceous and woody species, including measured leaf optical and biochemical properties. The Leaf Optical Properties Experiment (LOPEX) dataset was collected by the Joint Research Center of the European Commission at Ispra in Italy in 1993 (Hosgood et al. Citation1995). This dataset includes optical and biochemical measurements of 330 leaves of 46 different species. The five samples of dried corn leaves in the LOPEX dataset were discarded given that we focused on fresh leaves.
The NJU dataset was collected by Nanjing University from four field campaigns in Nanjing (Jiangsu, China) between 2014 and 2015 (Qiu et al. Citation2018). This dataset is composed of four smaller parts collected under different sampling conditions, covering trees and herbs. Two parts included measurements from the entire growing season of top canopy leaves of sweetgum (Liquidambar), oak (Quercus), and maize (Zea mays) collected in 2014, involving samples from leaf out to leaf fall. One part was collected in the summer of 2015, and the final part was collected in a broadleaved evergreen forest in May and July of 2015. The NJU dataset includes 404 leaves from 12 species over annual and perennial plants. A more detailed description can be found in the supplementary and in Qiu et al. (Citation2018).
In these datasets, leaf directional-hemispheric transmittance and reflectance were measured with a spectroradiometer equipped with an integrating sphere. For each sample, measurements were made in five different areas to quantify small but non-negligible interleaf variation. The scan time for each sample was about 4 min. The spectral measurement range was from 400 to 2500 nm, and the spectral sampling interval was 1 to 2 nm from 400 to 1000 nm, and 2 to 5 nm from 1000 to 2500 nm. The final spectral interval was resampled to 1 nm.
The measurement protocol for pigments is roughly the same for all three datasets. Leaf disks were ground in a chilled mortar with organic solvents such as 100% acetone and methanol, and the calculation of pigments was done according to Litchtenthaler (Citation1987). The EWT and LMA were estimated by measuring the fresh weight and the area of the leaf disks, and then the dry weight of the disks after drying in an oven at 65°C for at least 48 hours until the weight was constant. The spectral range used in this study was restricted between 400 and 2200 nm, given that the signal-to-noise ratio above 2200 nm is low (Qiu et al. Citation2018). Moreover, as a biased relationship between photosynthetic pigments (Cab, Car) and optical properties has been reported for LOPEX (Feret et al. Citation2008; Qiu et al. Citation2018), this dataset was not used in the assessment of Cab and Car. shows information about the measurements of the experimental datasets.
Table 2. Summary of main characteristics of three datasets.
2.3. Vegetation indices (VIs) for estimating leaf traits
2.3.1. Investigated VI types
To explore the potential of transmittance to establish VIs for estimating leaf traits, three types of VIs with two wavelengths, the normalized difference (ND) VI, the simple ratio (SR) VI, and the difference (D) VI were selected for subsequent analysis (). These VI types were adopted due to their widespread use and good performance (Ali et al. Citation2017; Mutanga and Skidmore Citation2010). VI of ND type was reported to achieve good results in the quantification of many leaf traits (Le Maire et al. Citation2008). While SR and D are simple in structure, their ability to accurately estimate leaf traits has still been reported (Féret et al. Citation2011; Wang and Li Citation2012). Except from being sensitive to the target parameter, most VIs are also designed to be insensitive to specific disturbing factors. For example, D is suitable for eliminating the influence of additive changes in leaf spectral characteristics, while SR and ND can deal with proportional variations (Le Maire et al. Citation2008). presents the process flow diagram showing the method adopted in this study.
Figure 1. Process flow diagram explaining the study scheme.
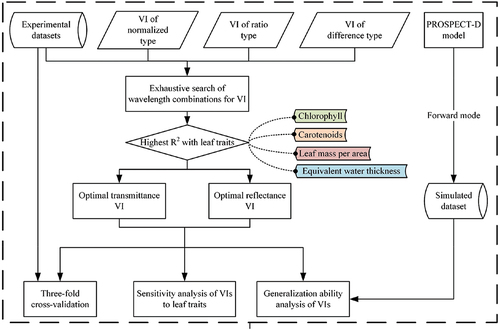
Table 3. The vegetation index formats used in this study. B1 and B2 represent the leaf transmittance or reflectance of two wavelengths.
2.3.2. Wavelength selection of transmittance and reflectance-based VIs
To determine the optimal wavelength combination of each VI type based on transmittance or reflectance, the method of exhaustive search according to Togeiro de Alckmin et al. (Citation2021), Mutanga and Skidmore (Citation2010) and Tagesson et al. (Citation2015) was adopted with correlation analysis toward the target plant trait and VI combination based on all the experimental datasets. In this process, as leaf pigments (Cab and Car) mainly absorb the visible light and that EWT and LMA negligibly affect leaf optical properties below 900 nm (Sun et al. Citation2019), we conducted wavelength selection for Cab and Car in the spectral range of 400–900 nm, while EWT and LMA were in the range of 900–2200 nm. The performance of all possible wavelength combinations in the relevant spectral domain was investigated and the establishment of the VIs based on transmittance or reflectance follows the same procedure. The coefficient of determination (R2) was used to describe the linear correlation between VIs and leaf traits, and the VI combination that achieved the highest R2 was the optimal VI selected.
After determining the optimal wavelength combination for the given types of VI based on transmittance or reflectance, the performance of ordinary least square linear regression models to estimate leaf traits was analyzed. The performance was investigated using three-fold cross validation, with two-thirds of the data used for training and one-third for validation where the training and validation data were randomly separated from each experimental dataset. The statistical indicators included to evaluate the performance were R2, root mean square error (RMSE), normalized root mean square error (NRMSE), and mean absolute error (MAE):
where and
are the estimated and measured leaf trait values, respectively;
and
are the maximum and minimum values of
, respectively;
is the number of measurements, and
is the serial number of the measured leaf trait content.
To study the effectiveness of the proposed optimal VIs for estimations of leaf traits, a global sensitivity analysis of the optimal VIs was conducted following the same method as described in section 2.1. Instead of analyzing the contribution of the input parameters of the PROSPECT-D model to the variability of the reflectance and transmittance spectrum, we analyzed the sensitivity to the variability of the optimal VIs. With this analysis, the sensitivity of VIs to target parameters and its ability to resist other confounding parameters can be directly observed, facilitating the evaluation of the comprehensive ability of VIs for estimating leaf traits.
2.4. Generalization analysis of the optimal VIs
To evaluate the robustness and generalization ability of the selected optimal VIs, a generalization analysis was conducted by examining the correlation between VIs and leaf traits using both in-situ and simulated datasets. Although three independent experimental datasets were used, these data do not cover all plant species and growth conditions. By incorporating a wide range of leaf traits and leaf structure parameter in the PROSPECT-D model, we can simulate reflectance and transmittance for different plant species and growing stages that help to assess the generalization capability of the VIs. First, 100,000 combinations of PROSPECT-D model input parameters were randomly generated based on and assuming Gaussian distributions. Then, the PROSEPCT-D model was used to simulate the spectral properties of leaves with these parameter combinations, and a large synthetic database of 100,000 simulations of leaf optical properties was subsequently generated. Finally, the relationships between the optimal VIs and the four leaf traits were analyzed with Pearson correlations for both the experimental and synthetic datasets. The consistency of correlation between VIs and leaf traits in both experimental and synthetic datasets represents their generalization ability.
3. Results
This section is divided into four subsections. The first subsection mainly describes differences in the sensitivity of reflectance and transmittance to leaf functional traits in the wavelength range of 400 to 2500 nm. The second subsection focuses on determining the optimal wavelength combination of transmittance-based and reflectance-based VIs and comparing the performance of the VIs for leaf functional traits estimation against actual measurements. The third subsection simulates the sensitivity of the optimal VIs to the leaf traits using the PROSPECT-D model. Finally, the fourth subsection presents the evaluation of the generalization ability of the optimal VIs.
3.1. Sensitivity analysis of leaf transmittance and reflectance to leaf traits
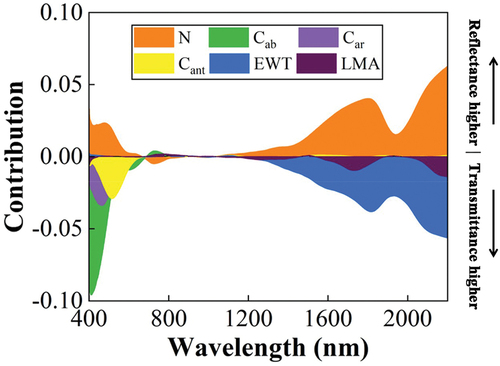
The sensitivity analysis of the PROSPECT-D model simulations shows that the different responses of leaf transmittance and reflectance to leaf parameters (N, Cab, Car, Cant, EWT, and LMA) mainly exist at wavelengths below 800 nm and above 1200 nm (). In the blue (400–500 nm) and red (600–700 nm) domains, leaf transmittance was more sensitive to Cab than reflectance, while the reflectance was more sensitive to Cab than transmittance in the domain of the red edge (700–800 nm). For Car, transmittance has a higher sensitivity compared to reflectance in the blue domain. Furthermore, transmittance was more sensitive to EWT and LMA variations than reflectance at the shortwave infrared region (1000–2500 nm). To conclude, almost all leaf functional traits were more sensitive to transmittance than reflectance in most spectral domains, and the VIs constructed with transmittance should thereby be superior for estimating the leaf traits Cab, Car, EWT, and LMA.
Figure 2. Difference in contribution to the sensitivity to the specific leaf traits between reflectance and transmittance for the input parameters (N: Structural parameter, Cab: chlorophyll, Car: carotenoids, Cant: anthocyanin, EWT: equivalent water thickness, and LMA: leaf mass per area) based on PROSPECT-D model simulations. A positive contribution means that the contribution of the components in reflectance is higher than that in transmittance, while a negative value is the opposite.
3.2. Optimal transmittance and reflectance-based VIs for retrieval of leaf traits
3.2.1. Vis for estimating leaf chlorophyll content
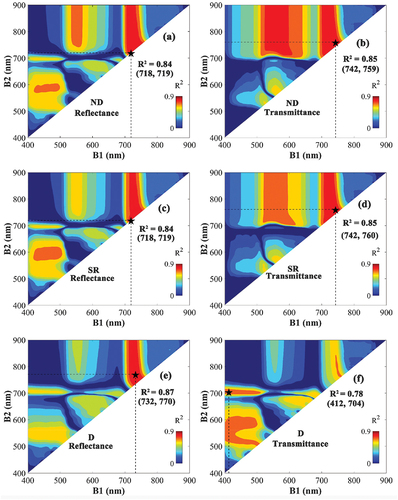
The correlation map between Cab and VIs was constructed by testing all the possible wavelength combinations between 400 and 900 nm using transmittance and reflectance from the combination of the ANGERS and NJU datasets (). The correlation matrices showed some areas of high R2 values between Cab and VIs. For example, VIs composed of a combination of red-edge (700–750 nm) and near-infrared (700–900 nm) wavelengths showed high correlation with Cab, irrespective of the VI type used. Given that the spectral areas with high correlation were relatively large, the corresponding VIs are expected to be easily and effectively applied to sensors also with broad bands. Most VIs constructed with transmittance were more sensitive to Cab than those constructed with reflectance, except for the reflectance-based D-type VI using a combination of red edge (732 nm) and near-infrared (770 nm) wavelengths, which obtained the highest R2 value (0.87).
Figure 3. The coefficient of determination (R2) based on the correlation between leaf chlorophyll content (Cab) and normalized difference (ND) VIs (a, b), simple ratio (SR) VIs (c, d), and difference (D)-type VIs (e, f) VIs constructed by all possible wavelength combinations of B1 (400–900 nm) and B2 (400–900 nm) based on reflectance (left) or transmittance (right). The combination representing the highest R2 is marked with a black star, and their respective R2 value and wavelengths are noted in the figure.
The results of the analysis of the performance of the linear regression model using the optimal VIs based on transmittance or reflectance as input for estimating Cab are shown in . The results are consistent with the findings of the correlation analysis in , and the linear regression model using the D-type VI constructed with reflectance captured the highest accuracy (RMSE = 7.36 μg/cm2, MAE = 5.52 μg/cm2). For ND and SR, the transmittance-based VIs achieved higher accuracy compared with their reflectance-based counterparts ().
Table 4. Accuracy of the linear regression models using the three optimal normalized differences (ND), simple ratio (SR), and difference (D) VIs constructed by transmittance or reflectance as input for estimating Cab. POOLED is a combined ANGERS and NJU dataset. The best results (highest R2, lowest RMSE, NRMSE, and MAE) from the listed VIs using pooled dataset are in bold.
3.2.2. Vis for estimating leaf carotenoids content
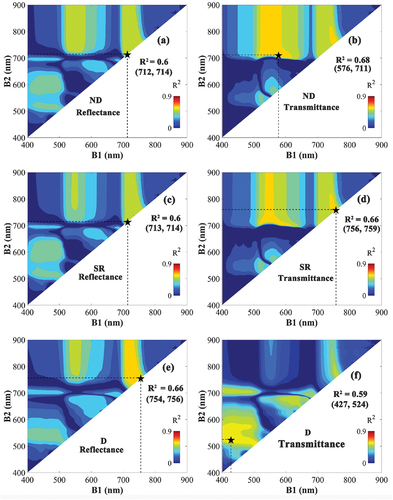
The R2 map between Car and VIs was constructed by correlating all the possible wavelength combinations in 400–900 nm using transmittance and reflectance from the pooled ANGERS and NJU datasets against Car (). For the three types of VIs, the transmittance-based VIs showed larger regions with high R2 compared to the maps against reflectance. The transmittance-based ND and SR VIs achieved higher R2-values than their reflectance counterparts, whereas the reflectance-based D-type VIs were better than the transmittance counterparts. The transmittance-based ND constructed with the wavelengths of 576 nm and 711 nm achieved the highest R2 (0.68). In addition, the R2 maps from the correlation analysis between Car and the different VIs types were similar to the maps of Cab (), but the R2 values were lower.
Figure 4. The coefficient of determination (R2) based on the correlation between leaf carotenoids (Car) and the normalized difference (ND) (a, b), the simple ratio (SR) (c, d), and the difference (D)-type VIs (e, f). VIs were constructed using all possible wavelength combinations of B1 (400–900 nm) and B2 (400–900 nm) based on reflectance (left) and transmittance (right). The combination representing the highest R2 is marked with a black star, and their respective R2 value and wavelengths are noted in the figure.
Subsequently, the performance of the linear regression models against optimal VIs for predicting Car was evaluated (6). In the evaluation against the pooled ANGERS and NJU datasets, ND and SR based on transmittance obtained higher accuracy than their reflectance counterparts, while the performance of the D-type VI based on reflectance was superior to the transmittance-based VI. For all regression models, the one using transmittance-based ND as input obtained the highest accuracy for estimating Car (RMSE = 2.64 μg/cm2, MAE = 1.94 μg/cm2).
3.2.3. Vis for estimating leaf equivalent water thickness
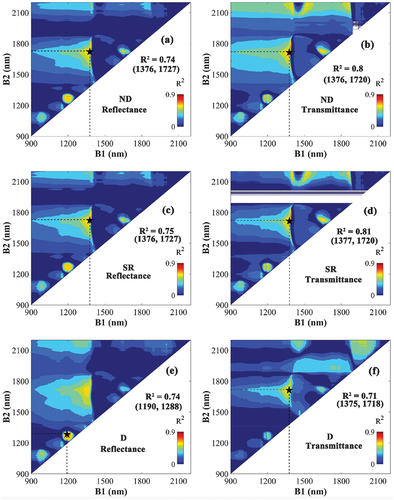
The R2 map based on the correlation between EWT and VIs () indicated very high R2 for a broad range of wavelength combinations (red areas in ), both in the cases of transmittance and reflectance-based VIs. For ND and SR, the spectral regions of high R2 were substantially larger than those for D-type VIs. The optimal VIs for estimating EWT showed larger R2 for the transmittance-based VIs compared with their reflectance-based counterparts. The transmittance-based ND using the shortwave infrared wavelengths at 1474 and 1506 nm had the highest R2 (0.90) .
Figure 5. The coefficient of determination (R2) based on the correlation between equivalent water thickness (EWT) and the normalized difference (ND) (a, b), the simple ratio (SR) (c, d), and the difference (D)-type VIs (e, f). VIs constructed by all possible wavelength combinations of B1 (900–2200 nm) and B2 (900–2200 nm) based on reflectance (left) or transmittance (right). The combination representing the highest R2 is marked with a black star, and their respective R2 value and wavelengths are noted in the figure.
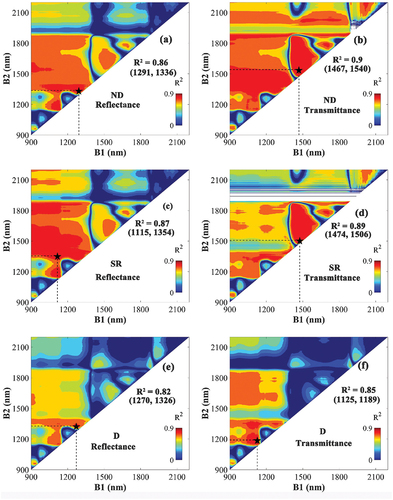
Table 5. Accuracy of the linear regression models using the three optimal normalized differences (ND), simple ratio (SR), and difference (D) VIs constructed by transmittance or reflectance as input for estimating Car. POOLED is a pooled dataset of ANGERS and NJU. The best results (highest R2, lowest RMSE, NRMSE, and MAE) from the listed VIs using pooled dataset are shown in bold.
For most cases, the linear regression models using the optimal VIs based on transmittance as input showed higher accuracy for estimating EWT (lower RMSE and MAE) compared with their reflectance counterparts, except for the regression model using the D-type VI parameterized and evaluated against the LOPEX dataset (). When all datasets were combined (POOLED in ), the regression model using transmittance-based ND achieved the highest accuracy of all (R2 = 0.90, RMSE = 0.0018 g/cm2, MAE = 0.0013 g/cm2). To conclude, compared with using reflectance, linear models constructed with transmittance-based VIs consistently allowed more accurate estimates of EWT, and the ND VI performed particularly well.
Table 6. Accuracy of the linear regression models using the three optimal normalized differences (ND), simple ratio (SR), and difference (D) VIs constructed with transmittance (T) or reflectance (R) as input for estimating equivalent water thickness (EWT). POOLED is a combination of the ANGERS, LOPEX, and NJU datasets. The best results (highest R2, lowest RMSE, NRMSE, and MAE) from the listed VIs using pooled dataset are shown in bold.
3.2.4. Vis for estimating leaf mass per area
Most wavelength combinations used for creating the three VI types were ineffective for estimating LMA (blue regions), with only a few small spectral regions with high R2-values (). An effective spectral domain can be found near 1200 nm in the reflectance-based VIs, but not for the transmittance-based VIs. For ND and SR, the spectral regions with the highest R2-values were similar for both the transmittance- and reflectance-based VIs (B1 of 1300–1400 nm, B2 of 1700–1800 nm). The transmittance-based SR using wavelengths between 1377 and 1720 nm obtained the highest R2 of 0.81. Overall, the transmittance-based VI showed closer correlation with LMA than the reflectance-based VIs. There were missing values around 1900 nm in the R2 map for transmittance (). This is due to the strong absorption of the leaf at these wavelengths (Li et al. Citation2021), leading to a transmittance close to zero at these wavelengths (, d).
Figure 6. The coefficient of determination (R2) based on the correlation between leaf mass per area (LMA) and the normalized difference (ND) (a, b), the simple ratio (SR) (c, d), and the difference (D)-type VIs (e, f). VIs constructed by all possible wavelength combinations of B1 (900–2200 nm) and B2 (900–2200 nm) based on reflectance (left) or transmittance (right). The combination representing the highest R2 is marked with a black star, and their respective R2 value and wavelengths are noted in the figure.
The estimates of LMA with the linear regression models using the different VI types based on transmittance and reflectance were evaluated (). For ND and SR, the linear regressions using transmittance VIs as input showed better performance (higher R2, lower RMSE and MAE) compared to their reflectance counterparts. Linear regressions using the transmittance-based D-type VI were more accurate in estimating LMA for the LOPEX and NJU datasets. However, the poor estimates for ANGERS caused the model using transmittance-based D-type VI to perform worse overall compared to the one using the reflectance-based D-type VI. For each regression model, the ones using ND and SR as input made better LMA estimates than the ones using D-type VIs. In the evaluation against all data (the POOLED dataset of ), the linear regression models using transmittance-based ND and SR were equally good and acquired the most accurate LMA estimations (R2 = 0.81, RMSE = 0.0018 g/cm2, MAE = 0.0013 g/cm2).
Table 7. Accuracy of the linear regression models using the three optimal normalized differences (ND), simple ratio (SR), and difference (D) VIs constructed with transmittance (T) or reflectance (R) as input for estimating leaf mass area (LMA). POOLED is a combination of the ANGERS, LOPEX, and NJU datasets. The best results (highest R2, lowest RMSE, NRMSE, and MAE) from the listed VIs using pooled dataset are shown in bold.
3.3. Sensitivity of the optimal transmittance and reflectance VIs to interference
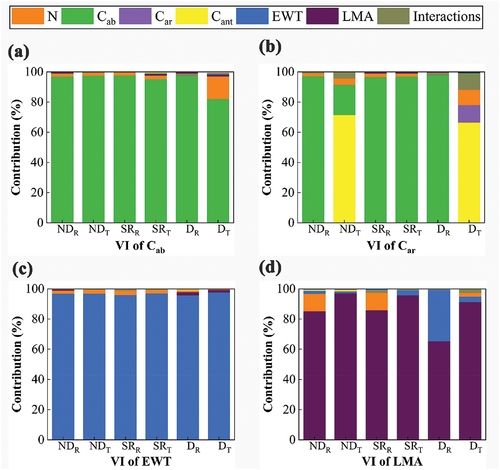
We compared the sensitivity of the optimal VI for each VI type in section 3.2 toward the target traits and interference factors using PROSPECT-D simulations (). All VIs for estimating Cab showed high sensitivity to Cab except for D constructed using transmittance, which is also sensitive to N. Most VIs for estimating Car in reflects Car to a limited extent, while Cab accounted for the major contribution. Only D based on transmittance showed certain sensitivity to Car. The VIs for estimating EWT based on transmittance and reflectance showed consistently good correlation to EWT, and the transmittance-based VIs showed slightly higher sensitivity to EWT than their reflectance counterparts (), which agrees with the results in section 3.2.3. The most striking improvements of transmittance-based VIs compared to reflectance-based ones were seen in LMA, and the contribution of LMA to the transmittance-based VIs was substantially larger than the reflectance-based VIs. In summary, almost all VIs for estimating Cab performed well, while the VIs for Car barely showed sensitivity to Car. The transmittance-based VIs for estimating EWT and LMA showed higher sensitivity to the parameters of interest and little interference from other parameters compared with the optimal reflectance-based VIs.
Figure 7. The sensitivity of the optimal VIs (normalized difference (ND), simple ratio (SR), difference (D)) for leaf structure parameter (N) and leaf functional traits (Cab: chlorophyll, Car: carotenoids, Cant: anthocyanin, EWT: equivalent water thickness, and LMA: leaf mass per area) based on PROSPECT-D simulations. (a-d) correspond to the VIs towards estimating Cab, Car, EWT and LMA respectively. The subscript indicates whether the optimal VI is based on reflectance (R) or transmittance (T).
3.4. Evaluation of the generalization ability of VIs based on reflectance and transmittance
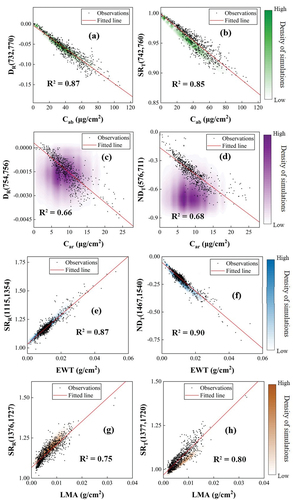
In order to comprehensively investigate the generalization capability of the optimal VIs based on transmittance or reflectance proposed in this study, the relationships between these VIs and leaf traits were analyzed using the pooled experimental dataset and a simulated dataset (). Almost all VIs showed good correlation with their target parameter using both experimental and simulated datasets, demonstrating good generalization capability, except for the VIs for estimating Car (DR(754,756) and DT(576,711)). Transmittance-based VIs are more closely correlated with Car, EWT, and LMA than reflectance-based VIs. In addition, the VI values of simulations were separated from the VI values of observations for the transmittance-based VIs toward Car ().
Figure 8. The relationships between the optimal reflectance (left) or transmittance-based (right) VIs of Cab (a, b), Car (c, d), EWT (e, f), and LMA (g, h) and observations or simulations. The fitted lines and coefficients of determination (R2) correspond to the relationship between observations and VIs. Each density plot is composed of 100,000 PROSPECT-D simulations, and the dark to light colors represent high to low density of simulations, respectively. The subscripts represent the optimal VI constructed based on reflectance (R) or transmittance (T), and the numbers in parentheses indicate the two wavelengths constructing the optimal VIs.
4. Discussion
4.1. Differences between transmittance and reflectance
Both leaf reflectance and transmittance contain information about leaf structure and biochemical constituents. In comparison, leaf reflectance is light reflected from one side of a leaf, while transmittance is light that went through a whole leaf, both with certain times of internal reflection and transmission within. Therefore, the differences between leaf transmittance and reflectance mainly derive from two aspects: i) leaf internal structure and structure of leaf upper and lower surfaces and ii) distribution of functional traits within a leaf.
First, from top to bottom, a leaf is usually composed of upper epidermis, mesophyll (including palisade parenchyma, bundle sheath parenchyma, vascular tissues, and spongy mesophyll), and lower epidermis (Jiang et al. Citation2021). Among the mesophyll tissues, the palisade tissue is close to the upper epidermis and has tightly arranged cells, while the spongy tissue is close to the lower epidermis with many stomata and cells arranged loosely (Jiang et al. Citation2021). The tightness of the cell arrangement is related to the degree of light scattering, with the looser structure having a higher light scattering (Stuckens et al. Citation2009; Woolley Citation1971). As leaf reflectance measured from the upper or lower faces mainly provides single-sided information of a leaf, the two can vary greatly because of different leaf surface structures (Wan et al. Citation2021). On the other hand, leaf transmittance measured from the two sides was reported to be very similar (Jiang et al. Citation2021), indicating that leaf transmittance may contain more thorough information about a leaf than reflectance.
Second, the distribution of light-absorbing materials in a leaf is heterogeneous, changing both vertically across a leaf and temporally with growth stages, thus affecting the potential of leaf transmittance and reflectance as indicators of functional traits. For example, with strong absorption of the visible light, Cab is abundant in the palisade tissue which is near the upper side of leaves to promote photosynthesis (Govaerts et al. Citation1996), therefore leaf reflectance from the upper surface has larger potential in estimating Cab. This explains the good estimation results of reflectance-based VI (DR(732, 770)) toward Cab (). Since EWT and LMA are relatively dispersed within a leaf instead of concentrated on one side (Govaerts et al. Citation1996), leaf transmittance has a stronger ability to indicate the two leaf traits than reflectance, which explains the accurate estimation of EWT and LMA from transmittance-based VI (NDT(1467, 1540)).
4.2. Wavelength selection of transmittance-based and reflectance-based VIs
Previous studies mainly focused on the establishment and application of reflectance-based VIs; therefore, the wavelengths of transmittance and reflectance-based VIs selected in this paper were compared with published reflectance-based VIs. For VIs toward Cab, the reflectance-based VIs in this study used red-edge wavelengths between 700 and 800 nm, consistent with Main et al. (Citation2011) and Le Maire et al. (Citation2008). This spectral domain was reported to contain the most sensitive wavelengths for Cab (Gitelson and Solovchenko Citation2017; Li et al. Citation2020). Most of the transmittance-based VIs proposed in this paper have also adopted wavelengths in this spectral range. The exception is transmittance-based D that uses the wavelength of 412 nm, where transmittance is low due to the joint absorption of Cab and Car (Sims and Gamon Citation2002). Sims and Gamon (Citation2002) suggested a similar wavelength of 445 nm in modified ND and modified SR, with the aim of eliminating the surface effect by subtracting this wavelength from the red-edge wavelength.
For VIs of Car, the reflectance-based VIs proposed in this paper only used the wavelengths between 700 and 800 nm; this red-edge region has been employed in published VIs as well (Blackburn Citation1998; Hernández-Clemente, Navarro-Cerrillo, and Zarco-Tejada Citation2012). However, Car was reported to absorb little light in this region; given the strong correlation between Car and Cab, the selection of these wavelengths is probably due to the strong absorption of Cab (Féret et al. Citation2011). Compared to the reflectance-based VIs of Car, the transmittance-based ones involved wavelengths between 500 and 600 nm (green light) and 400 and 500 nm (blue-violet light) in ND and D. The range between 500 and 600 nm was revealed to be the maximum absorption peak of Car, especially around 520 nm (Hernández-Clemente, Navarro-Cerrillo, and Zarco-Tejada Citation2012; Zhou et al. Citation2017), with transmittance-based D in this paper using a wavelength of 524 nm. The spectral domain between 400 and 500 nm was also reported to be important for Car estimation as one of its absorption peaks (Blackburn Citation1998; Zhou et al. Citation2017).
For the VIs of EWT, the wavelengths in the reflectance-based and transmittance-based VIs in this paper were relatively close (around 1100–1600 nm). Ceccato et al. (Citation2001) reported that EWT affects most of the spectral range of 900–2500 nm of leaf reflectance and transmittance. The results of this paper agree with many previous studies (Colombo et al. Citation2008; Klemas and Smart Citation1983; Zarco-Tejada, Rueda, and Ustin Citation2003), which found that the characteristic wavelengths for EWT were between 1200 and 1500 nm due to its extensive absorption domain.
For the VIs of LMA, we have identified highly consistent wavelength combinations near 1370 nm and 1720 nm, which were used by many transmittance and reflectance-based VIs. These wavelengths are very close to the combination of 1368 and 1722 nm used by Cheng et al. (Citation2014). In addition, a combination of 1190 and 1288 nm was used in reflectance-based D. This may be due to the influence of EWT, as the relatively strong correlation between EWT and LMA may interfere with the wavelength selection of LMA (Féret et al. Citation2011). also shows that the transmittance-based D with the optimal performance has strong sensitivity to EWT.
As can be seen in , the density of the simulated data for most biochemical traits coincides with the separated observations, except for leaf carotenoids (Car) in . This is mainly due to the fact that the specific absorption coefficient spectra of Car in the PROSPECT-D model do not cover the wavelengths selected for VIs closely related to Car in this study (). The best reflectance and transmittance-based VIs for Car in this study used wavelengths of 576 nm, 711 nm, 754 nm, and 756 nm, while the PROSPECT-D model sets specific absorption spectra of Car in the range of 400–560 nm. The leaf reflectance and transmittance of these wavelengths are thereby independent of the Car content in the simulated data.
4.3. Evaluation of the optimal VIs based on transmittance or reflectance
In this study, the performance of a VI was evaluated from two aspects: the estimation accuracy toward the target functional trait and the ability to resist interference from other parameters. First, our results showed that transmittance-based VIs outperformed those using reflectance for retrieving leaf Car, EWT, and LMA (). The case with leaf Cab was an exception, with reflectance-based D performing better than all transmittance-based VIs.
In terms of the ability to resist interferences, all transmittance and reflectance-based VIs for Cab and EWT were hardly disturbed by other leaf parameters (), which can be attributed to their dominant absorption characteristics in the visible light and near-infrared region, respectively (Féret et al. Citation2021; Sun et al. Citation2018). On the other hand, the VIs for estimating Car and LMA often show considerable sensitivity to another parameter simultaneously, due to their covariance with confounding parameters (Le Maire et al. Citation2008). The transmittance-based VIs for EWT resisted the influence of interference parameters more than their reflectance counterparts, due to the considerably higher sensitivity of transmittance to EWT than reflectance (). Reflectance-based VIs of Cab are less sensitive to confounding parameters than VIs based on transmittance, although the transmittance spectra are more sensitive to Cab than reflectance in a larger spectral region. This is due to the fact that most of the selected wavelengths in VIs for Cab exceeded 680 nm (Table S2), where reflectance was more sensitive to Cab (). For the VIs for estimating Car, shows that they are highly sensitive to Cab, both in transmittance and reflectance-based ones. Leaf trait EWT and N are the main confounding factors for LMA estimation. Compared with the reflectance-based VIs, the transmittance-based VIs for LMA improved resistance to interference from EWT and N (). Although Spafford et al. (Citation2021) reported that N affects short-wave infrared signals especially due to strong light scattering inside the foliage, this study shows that the effect of N on transmittance is relatively low ().
4.4. Limitations and prospect of transmittance-based VIs
This study demonstrated the good performance of transmittance-based VIs in leaf traits estimation, especially in estimating EWT and LMA, yet several limitations remain. First, the robustness of the proposed VIs based on transmittance in estimating leaf functional traits needs further validation. Although extensive experimental datasets have been used when constructing the transmittance-based VIs, their species coverage is limited. The use of radiative transfer modeling may alleviate this problem, yet Le Maire et al. (Citation2008)’s study showed that the performance of the optimal VIs established using simulations alone can be poor, especially for LMA estimation. Our results also provide evidence that simulated Car VIs based on leaf transmittance do not correspond well to actual measurements (). Le Maire et al. (Citation2008) also suggested that the best way to find effective VIs is to use a large experimental database. Therefore, more in situ measurements or refinement of physical models may contribute to solving this problem.
Second, our results are valuable for improving the efficacy of some proximal measurement devices. For example, these VIs proposed in this study can be integrated on handheld instruments to achieve real-time, nondestructive, and high-precision measurements of leaf biochemical traits. Such handheld leaf meters include Minolta SPAD-502 (Konica-Minolta, Tokyo, Japan), Dualex 4 Scientific (FORCE-A, Orsay, France), CCM-200 (Opti-Sciences, Hudson, NH), CL-01 (Hansatech, King’s Lynn, UK), and TYS-3N (Zhejiang Top Instrument Co., China), etc., which are widely used in agroforestry to track the physiological state of leaves (Casa et al. Citation2014; Chang and Robison Citation2003; Donnelly et al. Citation2020). However, the significance of transmittance-based VI at the canopy scale is ambiguous. Fortunately, some studies have focused on the application of canopy transmittance, making it possible to further upscale our research. The canopy transmittance has long been measured by multiple commercial optical instruments, including LAI-2000 Plant Canopy Analyzer, AccuPAR, and Tracing Radiation and Architecture of Canopies (TRAC) (Jonckheere et al. Citation2004), and has been used in estimating the leaf area index and average leaf inclination angle (Garrigues et al. Citation2008; Lathrop and Pierce Citation1991). Specifically, the development of airborne scanning LiDAR yielded successful estimates of canopy transmittance (Essery et al. Citation2008; Parker, Lefsky, and Harding Citation2001; Todd, Csillag, and Atkinson Citation2003; Varhola et al. Citation2012). However, canopy transmittance is greatly affected by canopy structures such as leaf area index and gap fraction. Therefore, these confounding factors must be removed before applying canopy transmittance to estimate leaf biochemical parameters. Nevertheless, the upscaling of VIs is a task that needs to be explored in the future.
5. Conclusion
Considering the potential of leaf transmittance in reflecting changes in leaf biochemical traits over leaf reflectance, the present paper aims to propose transmittance-based VIs to improve the estimation of leaf traits including Cab, Car, EWT, and LMA. We observed significant differences in the sensitivity of leaf transmittance and reflectance to leaf traits in the visible and short-wave infrared regions. The optimal reflectance and transmittance-based VIs (ND, SR, and D) were proposed through wavelength selection using three experimental datasets. Cross-validation results showed that the VIs established based on transmittance can effectively improve the estimation of Car, EWT, and LMA compared to their reflectance counterparts, although reflectance-based D provided the highest estimation accuracy of Cab. The results of sensitivity analysis of VIs showed that VIs constructed by transmittance were more sensitive to EWT or LMA and less disturbed by other parameters compared with reflectance-based VIs. The optimal VI for Cab is DR (732,770) (RMSE = 7.36 μg/cm2), for Car is NDT (576,711) (RMSE = 2.64 μg/cm2), for EWT is NDT (1467,1540) (RMSE = 0.0018 g/cm2), and for LMA is SRT (1377,1720) (RMSE = 0.0018 g/cm2), with the subscript representing the leaf transmittance (T) or reflectance (R) version. The findings of this study provide novel insights for determining the optimal VIs of leaf traits, and our proposed transmittance-based VIs showed good applicability and accuracy for traits estimation of fresh broad leaves.
Supplemental Material
Download MS Word (469.3 KB)Acknowledgements
This study was supported by the National Natural Science Foundation of China (42001314) and the Open Research Fund of the State Laboratory of Information Engineering in Surveying, Mapping, and Remote Sensing, Wuhan University (Grant No. 20R02). Torbern Tagesson was additionally funded by the Swedish National Space Agency (SNSA 2021-00144) and FORMAS (Dnr. 2021-00644).
Disclosure statement
No potential conflict of interest was reported by the author(s).
Data availability statement
The ANGERS and LOPEX datasets that support the findings of this study are openly available in OPTICLEAF database at http://opticleaf.ipgp.fr/index.php?page=database. The NJU dataset that supports the findings of this study is available from Feng Qiu with the permission of Nanjing University, Nanjing, China.
Supplementary material
Supplemental data for this article can be accessed online at https://doi.org/10.1080/15481603.2023.2168410
Additional information
Funding
References
- Ali, A. M., R. Darvishzadeh, A. K. Skidmore, and I. van Duren. 2017. “Specific Leaf Area Estimation from Leaf and Canopy Reflectance Through Optimization and Validation of Vegetation Indices.” Agricultural and Forest Meteorology 236: 162–21. doi:10.1016/j.agrformet.2017.01.015.
- Allen, W. A., H. W. Gausman, and A. J. Richardson. 1970. “Mean Effective Optical Constants of Cotton Leaves.” Journal of the Optical Society of America 60 (4): 542–547. doi:10.1364/JOSA.60.000542.
- Allen, W. A., H. W. Gausman, A. J. Richardson, and J. R. Thomas. 1969. “Interaction of Isotropic Light with a Compact Plant Leaf.” Journal of the Optical Society of America 59 (10): 1376–1379. 1917-1983. doi:10.1364/JOSA.59.001376.
- Asner, G. P., and R. E. Martin. 2016. “Spectranomics: Emerging Science and Conservation Opportunities at the Interface of Biodiversity and Remote Sensing.” Global Ecology and Conservation 8: 212–219. doi:10.1016/j.gecco.2016.09.010.
- Asner, G. P., R. E. Martin, L. Carranza‐jiménez, F. Sinca, R. Tupayachi, C. B. Anderson, and P. Martinez. 2014. “Functional and Biological Diversity of Foliar Spectra in Tree Canopies Throughout the Andes to Amazon Region.” The New Phytologist 204 (1): 127–139. doi:10.1111/nph.12895.
- Asner, G. P., R. E. Martin, D. E. Knapp, R. Tupayachi, C. Anderson, L. Carranza, P. Martinez, M. Houcheime, F. Sinca, and P. Weiss. 2011. “Spectroscopy of Canopy Chemicals in Humid Tropical Forests.” Remote Sensing of Environment 115 (12): 3587–3598. doi:10.1016/j.rse.2011.08.020.
- Asner, G. P., R. E. Martin, R. Tupayachi, R. Emerson, P. Martinez, F. Sinca, G. V. Powell, S. J. Wright, and A. E. Lugo. 2011. “Taxonomy and Remote Sensing of Leaf Mass per Area (LMA) in Humid Tropical Forests.” Ecological Applications 21 (1): 85–98. doi:10.1890/09-1999.1.
- Baránková, B., D. Lazár, and J. Nauš. 2016. “Analysis of the Effect of Chloroplast Arrangement on Optical Properties of Green Tobacco Leaves.” Remote sensing of environment 174: 181–196. doi:10.1016/j.rse.2015.12.011.
- Bergstrasser, S., D. Fanourakis, S. Schmittgen, M. P. Cendrero-Mateo, M. Jansen, H. Scharr, and U. Rascher. 2015. “HyperArt: Non-Invasive Quantification of Leaf Traits Using Hyperspectral Absorption-Reflectance-Transmittance Imaging.” Plant Methods 11 (1): 1. doi:10.1186/s13007-015-0043-0.
- Blackburn, G. A. 1998. “Spectral Indices for Estimating Photosynthetic Pigment Concentrations: A Test Using Senescent Tree Leaves.” International Journal of Remote Sensing 19 (4): 657–675. doi:10.1080/014311698215919.
- Blackburn, G. A. 2007. “Hyperspectral Remote Sensing of Plant Pigments.” Journal of Experimental Botany 58 (4): 855–867. doi:10.1093/jxb/erl123.
- Camps-Valls, G., M. Campos-Taberner, Á. Moreno-Martínez, S. Walther, G. Duveiller, A. Cescatti, M. D. Mahecha, J. Muñoz-Marí, F. J. García-Haro, and L. Guanter. 2021. “A Unified Vegetation Index for Quantifying the Terrestrial Biosphere.” Science Advances 7 (9). doi:10.1126/sciadv.abc7447.
- Cannavó, F. 2012. “Sensitivity Analysis for Volcanic Source Modeling Quality Assessment and Model Selection.” Computers & Geosciences 44: 52–59. doi:10.1016/j.cageo.2012.03.008.
- Casa, R., F. Castaldi, S. Pascucci, and S. Pignatti. 2014. “Chlorophyll Estimation in Field Crops: An Assessment of Handheld Leaf Meters and Spectral Reflectance Measurements.” The Journal of Agricultural Science 153 (5): 876–890. doi:10.1017/S0021859614000483.
- Ceccato, P., S. Flasse, S. Tarantola, S. Jacquemoud, and J. -M. Grégoire. 2001. “Detecting Vegetation Leaf Water Content Using Reflectance in the Optical Domain.” Remote sensing of environment 77 (1): 22–33. doi:10.1016/S0034-4257(01)00191-2.
- Chang, S. X., and D. J. Robison. 2003. “Nondestructive and Rapid Estimation of Hardwood Foliar Nitrogen Status Using the SPAD-502 Chlorophyll Meter.” Forest Ecology and Management 181 (3): 331–338. doi:10.1016/S0378-1127(03)00004-5.
- Cheng, T., B. Rivard, A. G. Sánchez-Azofeifa, J. -B. Féret, S. Jacquemoud, and S. L. Ustin. 2014. “Deriving Leaf Mass per Area (LMA) from Foliar Reflectance Across a Variety of Plant Species Using Continuous Wavelet Analysis.” Isprs Journal of Photogrammetry and Remote Sensing 87: 28–38. doi:10.1016/j.isprsjprs.2013.10.009.
- Colombo, R., M. Meroni, A. Marchesi, L. Busetto, M. Rossini, C. Giardino, and C. Panigada. 2008. “Estimation of Leaf and Canopy Water Content in Poplar Plantations by Means of Hyperspectral Indices and Inverse Modeling.” Remote Sensing of Environment 112 (4): 1820–1834. doi:10.1016/j.rse.2007.09.005.
- Croft, H., J. M. Chen, X. Luo, P. Bartlett, B. Chen, and R. M. Staebler. 2017. “Leaf Chlorophyll Content as a Proxy for Leaf Photosynthetic Capacity.” Global Change Biology 23 (9): 3513–3524. doi:10.1111/gcb.13599.
- Dawson, T. P., P. J. Curran, and S. E. Plummer. 1998. “Liberty—modeling the Effects of Leaf Biochemical Concentration on Reflectance Spectra.” Remote Sensing of Environment 65 (1): 50–60. doi:10.1016/S0034-4257(98)00007-8.
- Diaz, S., J. Kattge, J. H. Cornelissen, I. J. Wright, S. Lavorel, S. Dray, B. Reu, et al. 2016. “The Global Spectrum of Plant Form and Function.” Nature 529 (7585): 167–171. doi:10.1038/nature16489.
- Donnelly, A., R. Yu, C. Rehberg, G. Meyer, and E. B. Young. 2020. “Leaf Chlorophyll Estimates of Temperate Deciduous Shrubs During Autumn Senescence Using a SPAD-502 Meter and Calibration with Extracted Chlorophyll.” Annals of Forest Science 77 (2): 1–12. doi:10.1007/s13595-020-00940-6.
- Essery, R., P. Bunting, A. Rowlands, N. Rutter, J. Hardy, R. Melloh, T. Link, D. Marks, and J. Pomeroy. 2008. “Radiative Transfer Modeling of a Coniferous Canopy Characterized by Airborne Remote Sensing.” Journal of Hydrometeorology 9 (2): 228–241. doi:10.1175/2007JHM870.1.
- Féret, J. -B., K. Berger, F. de Boissieu, and Z. Malenovský. 2021. “PROSPECT-PRO for Estimating Content of Nitrogen-Containing Leaf Proteins and Other Carbon-Based Constituents.” Remote Sensing of Environment 252: 112173. doi:10.1016/j.rse.2020.112173.
- Feret, J. -B., C. François, G. P. Asner, A. A. Gitelson, R. E. Martin, L. P. Bidel, S. L. Ustin, G. Le Maire, and S. Jacquemoud. 2008. “PROSPECT-4 and 5: Advances in the Leaf Optical Properties Model Separating Photosynthetic Pigments.” Remote sensing of environment 112: 3030–3043.
- Féret, J. -B., C. François, A. Gitelson, G. P. Asner, K. M. Barry, C. Panigada, A. D. Richardson, and S. Jacquemoud. 2011. “Optimizing Spectral Indices and Chemometric Analysis of Leaf Chemical Properties Using Radiative Transfer Modeling.” Remote sensing of environment 115 (10): 2742–2750. doi:10.1016/j.rse.2011.06.016.
- Féret, J. B., A. A. Gitelson, S. D. Noble, and S. Jacquemoud. 2017. “PROSPECT-D: Towards Modeling Leaf Optical Properties Through a Complete Lifecycle.” Remote Sensing of Environment 193: 204–215. doi:10.1016/j.rse.2017.03.004.
- Féret, J. B., G. le Maire, S. Jay, D. Berveiller, R. Bendoula, G. Hmimina, A. Cheraiet, et al. 2019. “Estimating Leaf Mass per Area and Equivalent Water Thickness Based on Leaf Optical Properties: Potential and Limitations of Physical Modeling and Machine Learning.” Remote Sensing of Environment 231: 110959. doi:10.1016/j.rse.2018.11.002.
- Garrigues, S., N. V. Shabanov, K. Swanson, J. T. Morisette, F. Baret, and R. B. Myneni. 2008. “Intercomparison and Sensitivity Analysis of Leaf Area Index Retrievals from LAI-2000, AccuPar, and Digital Hemispherical Photography Over Croplands.” Agricultural & Forest Meteorology 148 (8–9): 1193–1209. doi:10.1016/j.agrformet.2008.02.014.
- Gitelson, A., and A. Solovchenko. 2017. “Generic Algorithms for Estimating Foliar Pigment Content.” Geophysical Research Letters 44 (18): 9293–9298. doi:10.1002/2017GL074799.
- Govaerts, Y. M., S. Jacquemoud, M. M. Verstraete, and S. L. Ustin. 1996. “Three-Dimensional Radiation Transfer Modeling in a Dicotyledon Leaf.” Applied Optics 35 (33): 6585–6598. doi:10.1364/AO.35.006585.
- Helliker, B. R., and J. R. Ehleringer (2000). Establishing a Grassland Signature in Veins: 18O in the Leaf Water of C3 and C4 Grasses. Proceedings of the National Academy of Sciences, 97, 7894–7898
- Hernández-Clemente, R., R. M. Navarro-Cerrillo, and P. J. Zarco-Tejada. 2012. “Carotenoid Content Estimation in a Heterogeneous Conifer Forest Using Narrow-Band Indices and PROSPECT+DART Simulations.” Remote sensing of environment 127: 298–315. doi:10.1016/j.rse.2012.09.014.
- Homolova, L., Z. Malenovský, J. G. Clevers, G. García-Santos, and M. E. Schaepman. 2013. “Review of Optical-Based Remote Sensing for Plant Trait Mapping.” Ecological Complexity 15: 1–16. doi:10.1016/j.ecocom.2013.06.003.
- Hosgood, B., S. Jacquemoud, G. Andreoli, J. Verdebout, G. Pedrini, and G. Schmuck. 1995. “Leaf Optical Properties Experiment 93 (LOPEX93) (European Commission no.EUR 16095 EN).” Joint Research Centre, Institute for Remote Sensing Applications.
- Jacquemoud, S., and F. Baret. 1990. “PROSPECT: A Model of Leaf Optical Properties Spectra.” Remote Sensing Environ 34 (2): 75–91. doi:10.1016/0034-4257(90)90100-Z.
- Jiang, J., A. Comar, M. Weiss, and F. Baret. 2021. “FASPECT: A Model of Leaf Optical Properties Accounting for the Differences Between Upper and Lower Faces.” Remote sensing of environment 253: 112205. doi:10.1016/j.rse.2020.112205.
- Jonckheere, I., S. Fleck, K. Nackaerts, B. Muys, P. Coppin, M. Weiss, and F. Baret. 2004. “Review of Methods for in situ Leaf Area Index Determination: Part I. Theories, Sensors and Hemispherical Photography.” Agricultural & Forest Meteorology 121 (1–2): 19–35. doi:10.1016/j.agrformet.2003.08.027.
- Kira, O., R. Linker, and A. Gitelson. 2015. “Non-Destructive Estimation of Foliar Chlorophyll and Carotenoid Contents: Focus on Informative Spectral Bands.” International Journal of Applied Earth Observations & Geoinformation 38: 251–260. doi:10.1016/j.jag.2015.01.003.
- Klemas, V., and R. Smart. 1983. “The Influence of Soil Salinity, Growth Form, and Leaf Moisture On-The Spectral Radiance of.” Photogramm Eng Remote Sens 49: 77–83.
- Lathrop, R. G., and L. L. Pierce. 1991. “Ground-Based Canopy Transmittance and Satellite Remotely Sensed Measurements for Estimation of Coniferous Forest Canopy Structure.” Remote Sensing of Environment 36 (3): 179–188. doi:10.1016/0034-4257(91)90055-B.
- le Maire, G., C. François, and E. Dufrêne. 2004. “Towards Universal Broad Leaf Chlorophyll Indices Using PROSPECT Simulated Database and Hyperspectral Reflectance Measurements.” Remote Sensing of Environment 89 (1): 1–28. doi:10.1016/j.rse.2003.09.004.
- Le Maire, G., C. Francois, K. Soudani, D. Berveiller, J. Pontailler, N. Breda, H. Genet, H. Davi, and E. Dufrene. 2008. “Calibration and Validation of Hyperspectral Indices for the Estimation of Broadleaved Forest Leaf Chlorophyll Content, Leaf Mass per Area, Leaf Area Index and Leaf Canopy Biomass.” Remote sensing of environment 112 (10): 3846–3864. doi:10.1016/j.rse.2008.06.005.
- Li, D., J. M. Chen, X. Zhang, Y. Yan, J. Zhu, H. Zheng, K. Zhou, et al. 2020. “Improved Estimation of Leaf Chlorophyll Content of Row Crops from Canopy Reflectance Spectra Through Minimizing Canopy Structural Effects and Optimizing Off-Noon Observation Time.” Remote sensing of environment 248: 111985. doi:10.1016/j.rse.2020.111985.
- Li, X., Z. Sun, S. Lu, and K. Omasa. 2021. “A Multi-Angular Invariant Spectral Index for the Estimation of Leaf Water Content Across a Wide Range of Plant Species in Different Growth Stages.” Remote Sensing of Environment 253: 112230. doi:10.1016/j.rse.2020.112230.
- Litchtenthaler, H. 1987. “Chlorophylls and Carotenoids: Pigments of Photosynthetic Biomembranes.” Methods in Enzymology–San Diego: Acad Pres 148: 350–381.
- Liu, J., Z. An, and G. Lin. 2021. “Intra-Leaf Heterogeneities of Hydrogen Isotope Compositions in Leaf Water and Leaf Wax of Monocots and Dicots.” The Science of the Total Environment 770: 145258. doi:10.1016/j.scitotenv.2021.145258.
- Magney, T. S., J. U. H. Eitel, and L. A. Vierling. 2017. “Mapping Wheat Nitrogen Uptake from RapidEye Vegetation Indices.” Precision Agriculture 18 (4): 429–451. doi:10.1007/s11119-016-9463-8.
- Main, R., M. A. Cho, R. Mathieu, M. M. O’Kennedy, A. Ramoelo, and S. Koch. 2011. “An Investigation into Robust Spectral Indices for Leaf Chlorophyll Estimation.” Isprs Journal of Photogrammetry and Remote Sensing 66 (6): 751–761. doi:10.1016/j.isprsjprs.2011.08.001.
- Mutanga, O., and A. K. Skidmore. 2010. “Narrow Band Vegetation Indices Overcome the Saturation Problem in Biomass Estimation.” International Journal of Remote Sensing 25 (19): 3999–4014. doi:10.1080/01431160310001654923.
- Nilsen, E. T., and D. M. Orcutt. 1996. “Physiology of Plants Under Stress.” Abiotic factors. New York: John Wiley and Sons.
- Parker, G. G., M. A. Lefsky, and D. J. Harding. 2001. “Light Transmittance in Forest Canopies Determined Using Airborne Laser Altimetry and In-Canopy Quantum Measurements.” Remote Sensing of Environment 76 (3): 298–309. doi:10.1016/S0034-4257(00)00211-X.
- Qiu, F., J. M. Chen, W. Ju, J. Wang, Q. Zhang, and M. Fang. 2018. “Improving the PROSPECT Model to Consider Anisotropic Scattering of Leaf Internal Materials and Its Use for Retrieving Leaf Biomass in Fresh Leaves.” IEEE Transactions on Geoscience and Remote Sensing 56 (6): 3119–3136. doi:10.1109/TGRS.2018.2791930.
- Qu, C., P. Li, and C. Zhang. 2021. “A Spectral Index for Winter Wheat Mapping Using Multi-Temporal Landsat NDVI Data of Key Growth Stages.” Isprs Journal of Photogrammetry and Remote Sensing 175: 431–447. doi:10.1016/j.isprsjprs.2021.03.015.
- Reich, P. B., I. J. Wright, and C. H. Lusk. 2007. “Predicting Leaf Physiology from Simple Plant and Climate Attributes: A Global GLOPNET Analysis.” Ecological Applications 17 (7): 1982–1988. doi:10.1890/06-1803.1.
- Sharifi, A. 2020. “Remotely Sensed Vegetation Indices for Crop Nutrition Mapping.” Journal of the Science of Food and Agriculture 100 (14): 5191–5196. doi:10.1002/jsfa.10568.
- Sims, D. A., and J. A. Gamon. 2002. “Relationships Between Leaf Pigment Content and Spectral Reflectance Across a Wide Range of Species, Leaf Structures and Developmental Stages.” Remote Sensing of Environment 81 (2–3): 337–354. doi:10.1016/S0034-4257(02)00010-X.
- Sobol′, I. M. 2001. “Global Sensitivity Indices for Nonlinear Mathematical Models and Their Monte Carlo Estimates.” Mathematics and Computers in Simulation 55 (1–3): 271–280. doi:10.1016/S0378-4754(00)00270-6.
- Spafford, L., G. le Maire, A. MacDougall, F. de Boissieu, and J. -B. Féret. 2021. “Spectral Subdomains and Prior Estimation of Leaf Structure Improves PROSPECT Inversion on Reflectance or Transmittance Alone.” Remote Sensing of Environment 252: 112176. doi:10.1016/j.rse.2020.112176.
- Stuckens, J., W. W. Verstraeten, S. Delalieux, R. Swennen, and P. Coppin. 2009. “A Dorsiventral Leaf Radiative Transfer Model: Development, Validation and Improved Model Inversion Techniques.” Remote Sensing of Environment 113 (12): 2560–2573. doi:10.1016/j.rse.2009.07.014.
- Sun, J., S. Shi, J. Yang, B. Chen, W. Gong, L. Du, F. Mao, and S. Song. 2018. “Estimating Leaf Chlorophyll Status Using Hyperspectral Lidar Measurements by PROSPECT Model Inversion.” Remote Sensing of Environment 212: 1–7. doi:10.1016/j.rse.2018.04.024.
- Sun, J., S. Shi, J. Yang, L. Du, W. Gong, B. Chen, and S. Song. 2018. “Analyzing the Performance of PROSPECT Model Inversion Based on Different Spectral Information for Leaf Biochemical Properties Retrieval.” Isprs Journal of Photogrammetry and Remote Sensing 135: 74–83. doi:10.1016/j.isprsjprs.2017.11.010.
- Sun, J., S. Shi, J. Yang, W. Gong, F. Qiu, L. Wang, L. Du, and B. Chen. 2019. “Wavelength Selection of the Multispectral Lidar System for Estimating Leaf Chlorophyll and Water Contents Through the PROSPECT Model.” Agricultural and Forest Meteorology 266-267: 43–52. doi:10.1016/j.agrformet.2018.11.035.
- Tagesson, T., R. Fensholt, S. Huber, S. Horion, and J. Ard. 2015. “Deriving Seasonal Dynamics in Ecosystem Properties of Semi-Arid Savannas Using in situ Based Hyperspectral Reflectance.” Biogeosciences Discussions 12: 3315–3347.
- Todd, K. W., F. Csillag, and P. M. Atkinson. 2003. “Three-Dimensional Mapping of Light Transmittance and Foliage Distribution Using Lidar.” Canadian Journal of Remote Sensing 29 (5): 544–555. doi:10.5589/m03-021.
- Togeiro de Alckmin, G., L. Kooistra, R. Rawnsley, and A. Lucieer. 2021. “Comparing Methods to Estimate Perennial Ryegrass Biomass: Canopy Height and Spectral Vegetation Indices.” Precision Agriculture 22 (1): 205–225. doi:10.1007/s11119-020-09737-z.
- Varhola, A., G. W. Frazer, P. Teti, and N. C. Coops. 2012. “Estimation of Forest Structure Metrics Relevant to Hydrologic Modelling Using Coordinate Transformation of Airborne Laser Scanning Data.” Hydrology and Earth System Sciences 16 (10): 3749–3766. doi:10.5194/hess-16-3749-2012.
- Violle, C., M. -L. Navas, D. Vile, E. Kazakou, C. Fortunel, I. Hummel, and E. Garnier. 2007. “Let the Concept of Trait Be Functional!” Oikos 116 (5): 882–892. doi:10.1111/j.0030-1299.2007.15559.x.
- Wang, Q., and P. Li. 2012. “Hyperspectral Indices for Estimating Leaf Biochemical Properties in Temperate Deciduous Forests: Comparison of Simulated and Measured Reflectance Data Sets.” Ecological indicators 14 (1): 56–65. doi:10.1016/j.ecolind.2011.08.021.
- Wang, L., J. J. Qu, X. Hao, and E. R. Hunt. 2011. “Estimating Dry Matter Content from Spectral Reflectance for Green Leaves of Different Species.” International Journal of Remote Sensing 32 (22): 7097–7109. doi:10.1080/01431161.2010.494641.
- Wan, L., Z. Tang, J. Zhang, S. Chen, W. Zhou, and H. Cen. 2021. “Upscaling from Leaf to Canopy: Improved Spectral Indices for Leaf Biochemical Traits Estimation by Minimizing the Difference Between Leaf Adaxial and Abaxial Surfaces.” Field Crops Research 274: 108330. doi:10.1016/j.fcr.2021.108330.
- Weiss, M., F. Jacob, and G. Duveiller. 2020. “Remote Sensing for Agricultural Applications: A Meta-Review.” Remote sensing of environment 236: 111402. doi:10.1016/j.rse.2019.111402.
- Westoby, M. 1998. “A Leaf-Height-Seed (LHS) Plant Ecology Strategy Scheme.” Plant and Soil 199 (2): 213–227. doi:10.1023/A:1004327224729.
- Woolley, J. T. 1971. “Reflectance and Transmittance of Light by Leaves.” Plant Physiology 47 (5): 656–662. doi:10.1104/pp.47.5.656.
- Yamasaki, S., and L. R. Dillenburg. 1999. “Measurements of Leaf Relative Water Content in Araucaria Angustifolia.” Revista Brasileira de fisiologia vegetal 11: 69–75.
- Zarco-Tejada, P. J., C. A. Rueda, and S. L. Ustin. 2003. “Water Content Estimation in Vegetation with MODIS Reflectance Data and Model Inversion Methods.” Remote Sensing of Environment 85 (1): 109–124. doi:10.1016/S0034-4257(02)00197-9.
- Zhang, Y., M. Migliavacca, J. Penuelas, and W. Ju. 2021. “Advances in Hyperspectral Remote Sensing of Vegetation Traits and Functions.” Remote sensing of environment 252: 112121. doi:10.1016/j.rse.2020.112121.
- Zhang, C., E. Pattey, J. Liu, H. Cai, J. Shang, and T. Dong. 2018. “Retrieving Leaf and Canopy Water Content of Winter Wheat Using Vegetation Water Indices.” IEEE Journal of Selected Topics in Applied Earth Observations and Remote Sensing 11 (1): 112–126. doi:10.1109/JSTARS.2017.2773625.
- Zhou, X., W. Huang, W. Kong, H. Ye, Y. Dong, and R. Casa. 2017. “Assessment of Leaf Carotenoids Content with a New Carotenoid Index: Development and Validation on Experimental and Model Data.” International Journal of Applied Earth Observation and Geoinformation 57: 24–35. doi:10.1016/j.jag.2016.12.005.