
 ?Mathematical formulae have been encoded as MathML and are displayed in this HTML version using MathJax in order to improve their display. Uncheck the box to turn MathJax off. This feature requires Javascript. Click on a formula to zoom.
ABSTRACT
Net ecosystem productivity (NEP) quantifies magnitude of the terrestrial vegetation carbon sinks. Drought is one of the most important stressors affecting vegetation NEP. At present, the spatiotemporal dynamics of vegetation NEP in drought-prone of Northwest China (NWC) lack discussion under different climatic zones and land cover types, and the response of vegetation NEP to drought remains unclear. Hence, we estimated the vegetation NEP in NWC using ground and remote sensing data and quantified the spatiotemporal differentiation of NEP under different climatic zones and land cover types. The drought fluorescence monitoring index (DFMI) was developed to examine the relationship between vegetation NEP and drought response based on the solar-induced chlorophyll fluorescence (SIF) data. Our results suggested that vegetation carbon sinks increased significantly at 7.09 g C m−2 yr−1 in NWC during 2000–2019, mainly in northern Shaanxi, eastern and southern Gansu, and southern Ningxia. NEP showed increasing trends under different climatic zones and land cover types, but there were differences in carbon sink capacity. The strongest carbon sink capacity was in humid regions and forests, while the weakest was in arid regions and grasslands. The vegetation carbon sinks showed a non-linear relationship with the drought degree reflecting multiple trend differences, especially in forests and grasslands. The response to drought was faster and more significant in semi-arid and semi-humid transition zones and extreme humid regions when vegetation carbon sinks decreased. DFMI was a good indicator to monitor drought conditions in NWC. NEP and DFMI were an 8–20-month periodic positive correlation and showed a high correlation with high–high and low–low clustering spatially. Drought significantly weakened vegetation carbon sinks in NWC. This study emphasizes the demand to rapidly identify climatic conditions that lead to decrease significantly in vegetation carbon sinks and to formulate adaptation strategies aimed at reducing drought risk under global warming.
1. Introduction
As an important component of terrestrial ecosystems, vegetation plays a significant role in regulating carbon balance. Vegetation absorbs and fixes carbon through photosynthesis, which constitutes the most important natural carbon sinks (Zhang et al. Citation2022). Enhancing vegetation carbon sinks is an effective way to mitigate the increase of atmospheric CO2 concentration and global warming and is also a key factor to achieve the carbon neutrality goal (Wang et al. Citation2020). Currently, there are four main methods for assessing vegetation carbon sinks: inventory method, vorticity correlation method, atmospheric inversion method, and remote sensing method (Xia et al. Citation2020). The remote sensing method is to assess the vegetation carbon sinks by simulating the process of the carbon cycle in terrestrial ecosystems establishing the corresponding carbon conversion model. The remote sensing method is more effective and efficient compared with field survey, with more accuracy estimation to reflect the regional true value of carbon conditions (Wei et al. Citation2022).
Many scholars have defined many indicators reflecting the carbon sink capacity of vegetation using remote sensing methods, including gross primary productivity (GPP), net primary productivity (NPP), net ecosystem productivity (NEP), and net biome productivity (NBP) (Liu et al. Citation2021). NEP refers to the difference between vegetation NPP and heterotrophic respiration, which represents the net carbon exchange between the terrestrial ecosystems and atmosphere (Yang and Chen Citation2022), and is an important indicator for estimating regional carbon source/sink (Fernández-Martínez et al. Citation2014). If NEP is greater than 0, the ecosystem is called a sink of atmospheric CO2 (referred to as carbon sinks), and if not, it is called a carbon source. As a key covariate in characterizing the vegetation carbon cycle process, NEP not only reflects the growth of vegetation in the natural environment but also quantitatively analyzes the carbon sequestration potential of regional vegetation (Pan and Li Citation2015). Therefore, it is significant to estimate NEP to further understand the mechanism of action for the carbon cycling process in the terrestrial ecosystems.
Drought is one of the important stressors affecting the current carbon sink function of terrestrial ecosystems (Piao et al. Citation2019). In recent decades, with global warming, the frequency of drought events has been significantly increasing everywhere and has serious impacts on the carbon cycle of terrestrial ecosystems and human social life (Gou et al. Citation2013). Drought usually significantly reduces the rate and capacity of vegetation to fix atmospheric CO2, i.e. vegetation productivity (Zhang et al. Citation2019). When the intensity and frequency of drought exceed the tolerance limits of vegetation, vegetation metabolism may accelerate, which triggers extensive vegetation mortality (Allen, Breshears, and McDowell Citation2015). It can lead to a significant reduction in vegetation productivity and vegetation carbon sinks. Furthermore, drought indirectly affects the carbon sink function of forests by increasing the frequency, intensity, and duration of pest and disease outbreaks (Seidl et al. Citation2018). Overall, drought usually deviates vegetation from its long-adapted environment. It inhibits vegetation growth or even leads to vegetation mortality, and further affects the size and direction of carbon sinks in regional and even global terrestrial ecosystems (Piao et al. Citation2019).
With the continuous maturation of remote sensing technology, many vegetation indices based on remote sensing satellites have been gradually developed to facilitate better monitoring and assessment of drought conditions, such as the extent, intensity, duration, and impact of drought occurrence (Xu, Wang, and Zhao Citation2021; Xu et al. Citation2021; Wan et al. Citation2022). The more mature indexes include the normalized difference vegetation index (NDVI), enhanced vegetation index (EVI), and the derived vegetation condition index (VCI). They have been widely used for monitoring regional vegetation drought due to their easy calculation, wide applicability, and outstanding monitoring effects (Xu et al. Citation2018; Cao et al. Citation2022). However, they are not directly related to photosynthesis, do not quantify the reduction of vegetation GPP under drought stress conditions, and cannot reflect the rapid changes in vegetation photosynthesis due to drought stress, etc. (Dobrowski et al. Citation2005), which has a lag effect obviously (Chen et al. Citation2019). For example, NDVI remains high when vegetation is subjected to short-term severe drought stress (Liu et al. Citation2018; Song et al. Citation2018), but there is a lag period of 10 days or even 2 months (Zhang et al. Citation2020). Therefore, it is urgently needed for drought monitoring and assessment to find a new vegetation index.
In recent years, solar-induced chlorophyll fluorescence (SIF) has emerged as a new source of remote sensing data for monitoring vegetation growth conditions and environmental resilience in large regions (Guanter et al. Citation2007; Guanter et al. Citation2014; Li and Xiao Citation2020; Xu, Wang, and Zhao Citation2021). SIF is viewed as an ideal probe of vegetation transient photosynthetic activity, which contains information on the physiological, biochemical, and metabolic properties of vegetation (Zhang et al. Citation2016). It is more sensitive to drought-induced changes in canopy photosynthesis as a fraction of the solar energy absorbed by photosynthetic pigments is released with heat dissipation and fluorescence during photosynthesis (Li and Xiao Citation2020). Moreover, SIF has a more significant mitigation effect on water and heat stress with a shorter lag time than vegetation indices such as NDVI, EVI, and VCI (Cao et al. Citation2021; Yoshida et al. Citation2015). It reflects drought more sensitively and responds more accurately to changes in vegetation (Zhang et al. Citation2020. Numerous studies have shown that SIF has been successfully applied to explore the effects of drought on various ecosystems such as grasslands, forests, and agricultural lands, including drought at regional and global scales (Gonsamo et al. Citation2019; Lu et al. Citation2022; Yoshida et al. Citation2015). Therefore, it is a relatively new idea for monitoring regional drought to develop a drought index based on SIF (Li, Xiao, and He Citation2018; Li et al.Citation2018).
Northwest China (NWC), which accounts for a large portion of the drylands in East Asia, is dominated by arid and semi-arid regions with the most frequent and severely affected areas of drought in China (Wang et al. Citation2015). As one of the important components of the ecological security barrier in NWC, vegetation plays a key role in the global ecosystem carbon balance through its carbon sink function (Pan and Li Citation2015). However, it may increase drought stress and lead to natural and artificial vegetation degradation due to the complex regional topography, uneven precipitation distribution, frequent wind and sand, warm and dry climate, sparse vegetation cover, and seasonal or intermittent water deficit of vegetation (Cao et al. Citation2022). It makes the vegetation carbon sinks role in the region potentially weaker (Gou et al. Citation2013). Therefore, many scholars have begun to explore the spatiotemporal characteristics of vegetation carbon sinks and their influencing factors in NWC. For example, Pan and Li (Citation2015), Pan and Wen (Citation2015), Wang et al. (Citation2021), and Liu et al. (Citation2021) combined the soil microbial respiration model and modified Carnegie-Ames-Stanford Approach (CASA) model to estimate vegetation carbon sinks in the northwest arid zone, Tarim River Basin, and Qinghai Plateau of China, respectively. All these studies found that the regional vegetation carbon sinks increased in fluctuating changes and showed a consistent trend in space. However, the above studies mainly focused on small regional scales and lacked an analysis of the spatiotemporal characteristics of the overall regional carbon sinks in NWC. Considering the diversity of climate and vegetation in NWC, we should further expand the existing studies to focus on the spatiotemporal evolution of carbon sinks under different climatic zones and land cover types. Furthermore, it is increasingly urgent to monitor the potential impacts of drought on regional vegetation carbon sinks changes with the possibility of more severe and frequent droughts of NWC in the coming decades (Cao et al. Citation2021), and the increasing importance of natural and artificial vegetation to prevent habitat and land degradation (Xu et al. Citation2021).
Here, we used remote sensing models and the SIF drought index to assess the variability of vegetation NEP over large spatial scales and the extent of its response to drought. Moreover, the drought fluorescence monitoring index (DFMI) was developed based on SIF data and validated by comparison with other drought indices to characterize the drought conditions in NWC. The objectives of this study are to 1) evaluate the spatiotemporal evolution patterns of NEP under different climatic zones and land cover types in NWC; 2) investigate the characteristics of vegetation NEP along the drought gradient in NWC; and 3) reveal the response relationship between vegetation NEP and DFMI in NWC. The findings of this study will help identify the hotspots of declining vegetation carbon sink function in arid and semi-arid regions and provide a basis for understanding the potential changes of drought on carbon sinks in terrestrial ecosystems.
2. Data and methods
2.1. Study area
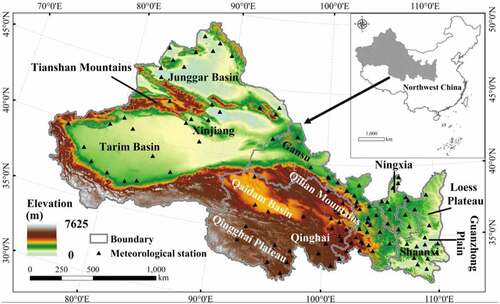
NWC is deeply inland in China, including the Shaanxi province, Qinghai province, Gansu province, Ningxia Hui Autonomous Region, and Xinjiang Uygur Autonomous Region. It is characterized by vast areas, aridity and water shortage, widespread deserts, more sand, fragile ecology, and sparse population. In terms of elevation in NWC, from the east to the west, the Loess Plateau and the Guanzhong Plain are in the east. The Qinghai Plateau, Qilian Mountains, and Qaidam Basin are in the central part, and the Tianshan Mountains, Junggar Basin, and Tarim Basin are in the west (). NWC is dominated by arid and semi-arid regions with uneven spatiotemporal distribution of rainfall (Wang et al. Citation2015). Vegetation acts as an ecological security barrier in NWC, playing an important role in windbreak and sand fixation, carbon sequestration, and emission reduction. Due to complex and variable climate types, the vegetation types are diverse in NWC (Cao et al. Citation2022). In recent years, extreme weather events in the region seriously affect the growth of regional vegetation with global warming, which caused more severe, lasting, and irrecoverable damage to terrestrial ecosystems.
Figure 1. Location and elevation of NWC.
2.2. Data sources and processing
2.2.1. MODIS data
The MODIS NDVI product (MOD13A2) was provided by the Land Processes Distribution Activity Archive Centre of the US Geological Survey (https://lpdaac.usgs.gov/). The data are available at a spatial resolution of 1000 m, with a 16-day time interval and a time range during 2000–2019 (). To further reduce the influence of clouds and haze, the NDVI series were synthesized into monthly time series data using the maximum value composite (MVC) method. In this study, NPP accuracy validation data were derived from the MOD17A3H product (http://lpdaac.usgs.gov/), with a resolution of 500 m and a time range during 2000–2019 (Xu et al. Citation2021). Land cover type data were generated from MODIS products (MCD12Q1) based on the Global Vegetation Classification Scheme of the International Geosphere-Biosphere Programme (IGBP) at 500 m, with a time range during 2001–2019 (http://lpdaac.usgs.gov/). In this study, the land cover types were divided into four new generic types: forests, grasslands, croplands, and no vegetation. To reduce the impact of land cover type changes on vegetation NEP trend, we selected the areas of three land cover types (forests, grasslands, and croplands) with areas unchanged for analysis. Based on the land cover type maps for 2001 and 2019, we extracted the areas with unchanged land cover types.
Table 1. Data sources of this study.
2.2.2. GOSIF data
Based on the SIF data, we developed a drought index to characterize drought conditions in NWC. It was derived from the monthly-scale Global Chlorophyll Fluorescence Product (GOSIF) (https://globalecology.unh.edu/) during 2000–2019 (Li and Xiao Citation2019), with a spatial resolution of 0.05° × 0.05°. The product was based on discrete SIF observations from the NASA Orbiting Carbon Observatory 2 (OCO-2), land cover datasets from albedo and MODIS, and meteorological reanalysis data from modern research and applied for retrospective analysis (Xu, Wang, and Zhao Citation2021). In this study, the SIF was reprojected and resampled using ArcGIS 10.6 to match the Albers projection of the WGS-1984 coordinate system and a spatial resolution of 1 km.
2.2.3. Meteorological data
The meteorological data came from the National Climate Centre of China Meteorological Administration (http://data.cma.cn/), including the monthly precipitation, monthly maximum temperature, monthly minimum temperature, monthly mean temperature, and sunshine hours data from 110 meteorological stations in NWC during 2000–2019. In this study, these data were spatially interpolated with a spatial resolution of 1 km using a thin-slab smoothing strip nested in the ANUSPLIN package. The thin-slab smoothing strip captured the variability of temperature and precipitation with elevation gradient, allowing for higher interpolation accuracy and smoother.
2.2.4. Other data
The digital elevation model (DEM) data were from NASA’s SRTM data (http://srtm.csi.cgiar.org/), which was a spatial resolution of 90 m. Meanwhile, we used the land cover type data of China in 2015 from the Resource and Environment Science Data Center of the Chinese Academy of Sciences as auxiliary data (https://www.resdc.cn/), which helped to better distinguish the changes under different land cover types. To unify the spatial resolution size, DEM, NPP, and land cover type data were resampled using ArcGIS 10.6 to match the 1 km spatial resolution.
3. Methods
3.1. NEP estimation model
In this study, the CASA model and the soil microbial respiration equation were used to estimate the vegetation NEP in NWC during 2000–2019 (Wei et al. Citation2022). Without considering other natural and anthropogenic influences, NEP is defined as the difference between the NPP of vegetation within an ecosystem and the soil microbial respiration, which is often used as a measure of carbon sink. RH represents soil microbial respiration. The NEP is calculated as follows:
For the simulation of NPP, we combined the monthly mean temperature, monthly precipitation, solar radiation, NDVI, and vegetation types to achieve the estimation of monthly NPP values in NWC using the modified CASA model (Zhu, Pan, and Zhang Citation2007). The NPP is mainly determined by the absorbed photosynthetically active radiation (APAR) inhaled by vegetation and the actual light energy utilization rate (ε). The calculation formula is as follows:
where NPP (x, t) is the net primary productivity of image element x in month t; APAR (x, t) is the absorbed photosynthetically active radiation by image element x in month t; and ε(x, t) is the actual light energy utilization of image element x in month t. ε is obtained from the estimation of stress factors such as temperature, moisture, and maximum light energy utilization, and APAR depends on the ratio of total solar radiation and absorbed photosynthetically active radiation by vegetation (Pan and Li Citation2015).
In this study, we used the established research results to estimate the distribution of soil microbial respiration. Pei et al. (Citation2010) established the regression equation of temperature, precipitation, and carbon emissions by exploring the relationship between carbon emissions and environmental factors at the Wudaoliang experimental site in Qinghai province. The RH is calculated as follows:
where RH denotes the soil microbial respiration, Tem is the monthly mean temperature (°C), and Prec is the monthly total precipitation (mm).
3.2. Drought indexes
VCI is widely used for detecting the occurrence of agricultural drought based on NDVI in NWC (Cao et al. Citation2022). For drought monitoring, VCI assumes that vegetation health is affected by climate change (Kogan Citation1995; Guo et al. Citation2019), and VCI is lower in climates and seasons where drought reduces vegetation growth (<0.5) (Zhang et al. Citation2017). On the contrary, VCI is high (>0.5), which represents high vegetation () (Lawal et al. Citation2021). SIF can monitor agricultural drought conditions more sensitively than NDVI (Zhang et al. Citation2020). In this study, we used SIF instead of NDVI to develop the Drought Fluorescence Monitoring Index (DFMI) for characterizing the drought conditions in NWC. Furthermore, we verified the credibility of the DFMI by comparing and analyzing its ability to monitor and assess drought with that of the VCI. The formula is calculated as follows:
Table 2. Drought classification scheme.
where SIFmax and SIFmin are the maximum and minimum values of SIF for a month i of the region from 2000 to 2019, and SIFi denotes the SIF for a month i of the target year (Liu et al. Citation2021). The smaller DFMI value indicates a more severe drought ().
To further reveal the characteristics of vegetation NEP trends in NWC, we combined the Aridity Index (AI) to classify different climatic zones and to explore change trends along the aridity gradient. AI was calculated from the ratio of annual precipitation to annual potential evapotranspiration (PET), where PET was calculated using the Hargreaves-Samani (HS) equation (Hargreaves and Samani Citation1985).
3.3. Trend analysis
Theil-Sen median (TS) is a trend calculation method with robust nonparametric statistics. It gives a reliable estimate of the monotonic trend (Zhang et al. Citation2022). Mann–Kendall test (Zs) is a nonparametric test for testing the trend of time series change (He et al. Citation2015). This method is a nonparametric significance test that detects monotonic trends in time-varying variables (Ghosh Citation2018). When the value of Zs is less than 1.96, the trend change is considered significant (p < 0.05). In this study, the TS and Zs were used to explore the interannual trend of NEP, DMFI, and VCI in NWC during 2000–2019.
3.4. Cross-wavelet transform and wavelet coherence
Wavelet analysis can reveal the hierarchical and periodic characteristics of time series at different time scales, divided into cross-wavelet transform (XWT) and wavelet coherence (WTC). They are similar in principle, which both reveal the relationship between two time series in time-frequency space (Zhou et al. Citation2022). XWT is mainly used to investigate the relationship between two time series and reveal the resonance period and its phase relationship in the time-frequency space of two time series with the high-co-power region (Lian et al. Citation2022). WTC can identify the resonance period and phase relationship between two time series in the low co-power region, reflecting the consistency of the periodic trend between time series (Torrence and Compo Citation1998). It can well compensate for the shortcomings of the XWT variation. In this study, WTC was used to investigate the correlation between NEP and DFMI in NWC. For two-time series X and Y, WTC is defined as:
where S is the smoothing operator; s is the wavelet scale; 、
are wavelet transforms of X and Y, respectively;
is the WTC spectrum (Liu et al. Citation2018). Here, “→” means the two parts are in phase change (positive correlation), “←” means the two parts are in anti-phase change (negative correlation), and “↑” (“↓”) indicates that the phase change of the first time series is ahead (behind) the phase of the second time series by 90°.
3.5. Spatial autocorrelation
Moran’s index is one of the most widely used methods to estimate the spatial autocorrelation of each indicator (Yuan et al. Citation2020). It is generally divided into two forms: the global Moran’s I and the Local Indicators of Spatial Autocorrelation (LISA). Moran’s I can well characterize the clustering of the whole region. The negative value indicates a negative spatial correlation on the degree of the whole region; if not, it indicates a positive spatial correlation. LISA further reflects the low/high-value clustering characteristics corresponding to positive/negative local spatial autocorrelation. There are four spatial correlation patterns: high–high (H–H) clustering, low–low (L–L) clustering, high–low (H–L) clustering, and low–high (L–H) clustering spatial characteristics (Liu et al. Citation2022). In this study, we used Geoda to calculate the Moran’s I for NEP and DFMI to evaluate their spatial variation patterns.
3.6. Statistical analysis
The statistical significance of segmented points was measured using the Akaike Information Criterion (AIC), and the statistical significance of multiple mutation trends was determined by comparing the difference (ΔAIC) between the two-part regression models (Xu, Wang, and Yang Citation2017). When ΔAIC is less than −2, it indicates a trend difference in the segmented model (Xu, Wang, and Zhao Citation2021). Furthermore, we used R squared (R2) and p-value less than 0.05 to evaluate the effect of the linear regression model (Zhang et al. Citation2021) and evaluated the simulation effects of the model using root mean square error (RMSE) and mean absolute error (MAE).
4. Results
4.1. Spatiotemporal variation patterns of NEP
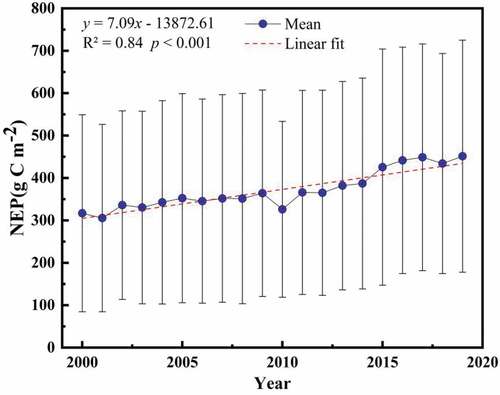
In this study, we used the linear fitting to show the characteristics of interannual trend in vegetation NEP in . From , the annual growth rate of vegetation NEP in NWC during 2000–2019 was 7.09 g C m−2 yr−1, showing a significant increasing trend (R2 = 0.84, p < 0.001). Meanwhile, the annual mean value of vegetation NEP in NWC fluctuated from 305.67 to 451.45 g C m−2. Among them, the vegetation carbon sinks were the smallest in 2001 and the largest in 2019. Overall, the vegetation carbon sinks in NWC showed a significant increasing trend in the last 20 years.
Figure 2. Interannual trend of vegetation NEP in NWC during 2000–2019. Whiskers = ±1 standard deviation (SD).
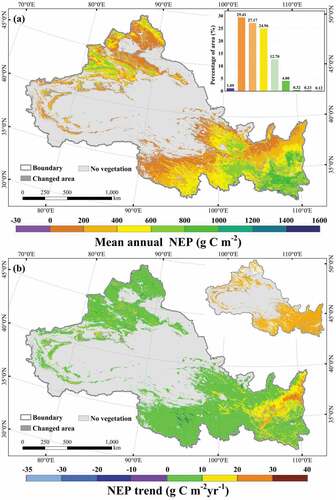
The vegetation NEP in most regions of NWC was between 0 and 600 g C m−2 (about 81.54%) in , which was widely distributed in the vegetation regions of the study area, indicating that the vegetation in NWC had high carbon sink capacity. Among them, the high vegetation NEP was concentrated between 1000 and 1200 g C m−2 (about 4%), mainly distributed in the regions of southern Shaanxi, northern Shaanxi, and southern Gansu. From , the overall vegetation NEP in NWC showed an increasing trend, with most of them between 0 and 10 g C m−2 yr−1 (about 76.43%). Among them, the regions with more obvious trends were mainly concentrated in northern Shaanxi, southeastern Gansu, and southern Ningxia, accounting for about 20.86% of NWC. Most of the regions in the study area (except the Guanzhong Plain and Junggar Basin) passed the significance test (p < 0.05), indicating that the vegetation NEP in these regions showed a significant growth trend. To summarize, the vegetation carbon sinks in NWC showed a spatial distribution characteristic of high in the east and low in the west, and an overall trend of significant growth.
Figure 3. Spatial distribution (a) and spatial trend (b) of NEP in NWC during 2000–2019. The insets represent areas that passed the significance test (p < 0.05).
4.2. Variation characteristics of NEP under different climatic zones and land cover types
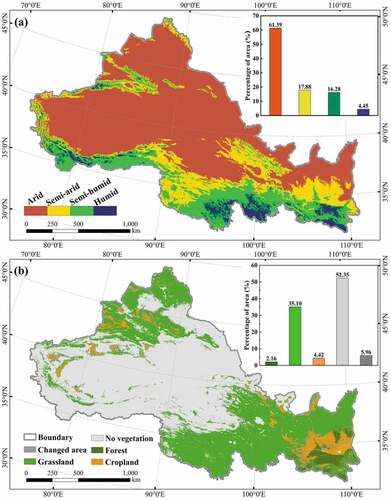
NWC was dominated in the arid and semi-arid regions with 61.39% and 17.88% of the distribution in . The climatic zones showed a trend of gradually becoming wetter from northwest to southeast. From , the no vegetation in NWC was relatively large (about 52.35%), the forest was mainly located in southern Shaanxi, cropland was mainly distributed in Guanzhong Plain and eastern Gansu (4.42%), and most of the remaining areas belonged to grassland (35.10%). To summarize, NWC was typical arid and semi-arid regions, and grassland was its main land cover type.
Figure 4. Map of different climatic zones (a) and land cover types (b) in NWC.
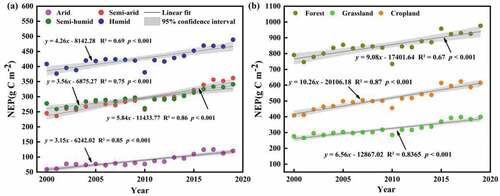
The vegetation NEP in NWC was highest in the humid region in , followed by the semi-humid, semi-arid, and arid regions, indicating that the vegetation carbon sink capacity was the strongest in the humid region and the weakest in the arid region. It was found that the overall vegetation NEP under different climatic zones showed significant increasing trends, which showed that semi-arid region (5.84 g C m−2 yr−1) > humid region (4.26 g C m−2 yr−1) > semi-humid region (3.56 g C m−2 yr−1) > arid region (3.15 g C m−2 yr−1). The semi-arid and humid regions were prone to influence the interannual trend of vegetation carbon sinks in NWC. From , forest NEP was the highest and grassland NEP was the lowest in NWC, indicating that forest had the strongest carbon sinks and grassland had the weakest. Overall, the NEP all increased significantly under different land cover types, which showed that cropland (10.26 g C m−2 yr−1) > forest (9.08 g C m−2 yr−1) > grassland (6.56 g C m−2 yr−1). Cropland and forest were prone to influence the interannual trend of vegetation carbon sinks in NWC. To summarize, the vegetation NEP under different climatic zones and land cover types in NWC showed a significant increasing trend.
Figure 5. Interannual trends of NEP under different climatic zones (a) and land cover types (b) in NWC during 2000–2019.
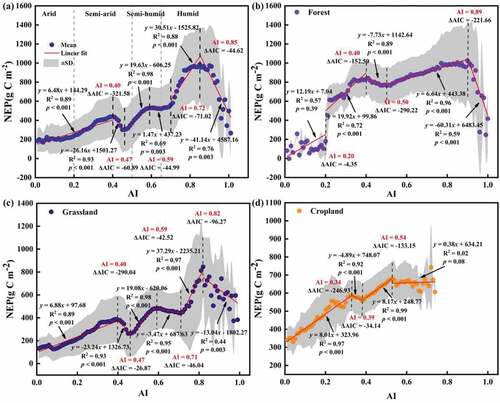
The NEP trend increased significantly (p < 0.001) at a rate of 6.48 g C m−2yr−1 in arid and semi-arid regions in (AI ≤ 0.40). When 0.40 < AI < 0.47, the NEP trend decreased significantly at a rate of 26.12 g C m−2yr−1 (p < 0.001). With increasing AI, the NEP trend significantly increased at rates of 19.63 g C m−2yr−1, 1.47 g C m−2yr−1, and 30.51 g C m−2yr−1·when 0.47 < AI < 0.59, 0.59 < AI < 0.72, and 0.72 < AI ≤ 0.85, respectively (p < 0.001; p = 0.003; p < 0.001). The NEP trend reached a maximum value (974.05 g C m−2yr−1) when AI approached 0.85, while the NEP trend reversed and began to decrease significantly at a rate of 41.14 g C m−2yr−1 (p = 0.003). For the forest (), the NEP trend did not increase significantly (p = 0.39) at a rate of 12.19 g C m−2yr−1 when AI ≤ 0.20. The NEP trend reversed at AI values of 0.40, 0.50, and 0.89, with significant trends at different slopes (19.92 g C m−2yr−1 and −7.73 g C m−2yr−1, p < 0.001; −7.73 g C m−2yr−1 and 6.64 g C m−2yr−1, p < 0.001; 6.64 g C m−2yr−1 and −60.31 g C m−2yr−1, p < 0.001). For grassland (), the NEP trend reversed at AI values of 0.40 with significantly changing at different slopes (6.88 g C m−2yr−1 and −23.24 g C m−2yr−1, p < 0.01). When 0.47 < AI ≤ 0.59, the NEP trend increased significantly at a rate of 19.08 g C m−2yr−1 (p < 0.001), while different slopes (−3.47 g C m−2yr−1 and 37.29 g C m−2yr−1, p < 0.001) occurred at an AI value of 0.71. NEP trend began to decrease significantly at a rate of 13.04 (p = 0.003) at AI > 0.82. For cropland (), the NEP trend increased significantly (8.01 g C m−2yr−1, p < 0.001), but the slope began to decrease significantly at an AI value of 0.34 (−4.84 g C m−2yr−1, p < 0.001) and again at an AI of 0.39 with a different slope (−4.89 g C m−2yr−1 and 8.17 g C m−2yr−1, p < 0.01). When AI ≥ 0.54, NEP increased at a non-significant rate of 0.38 g C m−2yr−1 (p = 0.08). To summarize, the interannual variation of vegetation NEP showed a significant increasing trend from arid to humid regions (except for 0.40 < AI < 0.47 and AI > 0.85) in NWC, while forest, cropland, and grassland NEP showed different trends along the aridity gradient.
Figure 6. Spatial difference of vegetation NEP along the drought gradient (a) and the characteristics of forest (b), grassland (c), and cropland (d) NEP along the drought gradient in NWC.
4.3. Spatiotemporal variation characteristics of DFMI and VCI
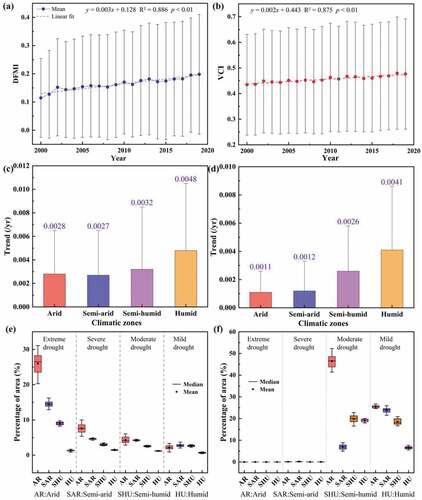
DFMI and VCI increased significantly at a rate of 0.003 yr−1 and 0.002 yr−1 in NWC in (R2 = 0.886, p < 0.01; R2 = 0.875, p < 0.01), respectively, which indicated both wettings of the climate and weakening of the aridity trend in NWC. From , DFMI and VCI showed increasing trends in arid, semi-arid, semi-humid, and humid regions, but the ability of DFMI and VCI to monitor drought conditions under different climatic zones was different in NWC. The increasing trend of DFMI in the semi-arid region was the smallest, and that of VCI in the humid region was the smallest. In terms of drought level (, the area changes of drought monitored by DFMI and VCI were different with the increase in drought level in NWC. VCI monitored little drought area change in extreme drought and severe drought classes, while VCI identified more drought area changes significantly in moderate drought and mild drought classes. DFMI had more area changes significantly at different drought classes under different climatic zones in NWC, indicating that DFMI was more capable of monitoring drought area changes. This was due to the higher sensitivity of SIF to drought stress compared to the traditional greenness-based drought index and reflected the exposure of vegetation to drought stress more effectively and quickly during the growing season (Wu Citation2021). Previous studies found that the frequency of extreme drought in NWC slowly increased (Cao et al. Citation2021). NWC was dominated by arid and semi-arid regions, and DFMI made monitoring drought area changes at different drought classes easier. Therefore, we used DFMI to monitor drought conditions in NWC.
Figure 7. Interannual trends of DFMI (a) and VCI (b) in NWC during 2000–2019. DFMI (c) and VCI (d) trends under different climatic zones. Area changes of DFMI (e) and VCI (f) on different drought classes.
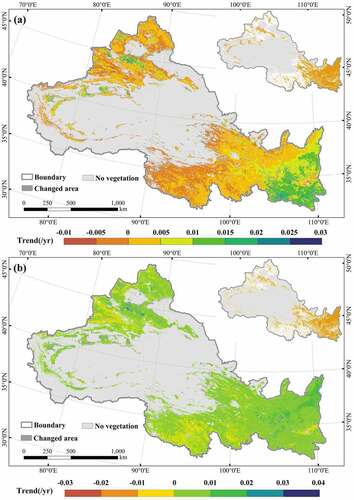
The spatial trends of DFMI and VCI in NWC during 2000–2019 were showed in . The DFMI showed an overall increasing trend, mainly located in the Loess Plateau, southern Shaanxi, and southeastern Gansu in the eastern part of the study area, which all passed the significance test (p < 0.05). It indicated that the DFMI in these regions increased significantly. The increasing trend of VCI was found to have typical regional characteristics. Among them, 83.75% of the regions showed an increasing trend, mainly located in the eastern part of the study area, and these regions passed the significance test (p < 0.05). And 16.25% of the regions showed an insignificant decreasing trend, mainly located in the Guanzhong Plain, western Xinjiang, and Qinghai Plateau. Overall, both DFMI and VCI showed significantly increasing trends, but the degree of trend change varied in NWC. Compared with VCI, DFMI was easier to identify areas with drought increasing, such as the Junggar Basin, Tianshan Mountains, and western Qilian Mountains. It further proved that DFMI can better monitor the drought conditions in NWC.
Figure 8. Spatial trends of DFMI (a) and VCI (b) in NWC during 2000–2019. The inset represents the area that passed the significance test (p < 0.05).
4.4. Response relationship of vegetation NEP to drought
Based on the comparative verification of the effectiveness of DFMI and VCI for drought monitoring in NWC, we concluded that DFMI was a new indicator for monitoring drought conditions. To determine the extent of drought influence on the vegetation NEP in NWC, the WTC was used to analyze the correlation between vegetation NEP and DFMI from monthly time series, and the Moran index explored the response relationship of DFMI on vegetation NEP spatially.
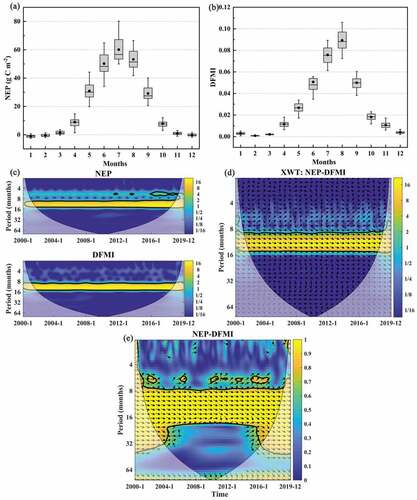
The relationship between monthly vegetation NEP and DFMI in NWC from 2000 to 2019 was analyzed in . From , the variations of monthly NEP and DFMI were close to the normal distribution with peaks occurring in July and August. The vegetation NEP and DFMI in NWC from 2000 to 2019 showed significant cycle characteristics with periods of 8–16 months (). The XWT results indicated that the NEP and DFMI show a significant positive-phase relationship over the period of 8–16 months during 2000–2019 (). The different arrows illustrated the complexity of the NEP response to drought at different time scales. NEP and DFMI were not perfectly horizontal right arrows, suggesting a lag effect between them. Moreover, the WTC results indicated that the main resonance period of NEP and DFMI during 2000–2019 was about 8–20 months, showing a strong coherence (>0.9) (). It was noteworthy that there were some high coherence peaks on the 5–6 months at small scales. To summarize, the vegetation NEP and DFMI had a significant positive correlation at 8–20-month scales and obvious periodic characteristics in NWC during 2000–2019.
Figure 9. The variation of NEP (a) and DFMI (b) in each month. (Boxplot elements: Box = Values of 25th and 75th percentiles; Dot = Mean; Horizontal line = Median; Whiskers = ±1 SD). Wavelet power spectrums of monthly NEP and DFMI during 2000–2019 (c). XWT between monthly NEP and DFMI during 2000–2019 (d). WTC between monthly NEP and DFMI during 2000–2019 (e). The color bars show the energy density, with the 95% confidence level for red noise shown as a coarse outline. The phase relationship is indicated by the direction of the arrows (opposite phases point to the left, same phases point to the right). An upward-pointing arrow denotes a 90° delay of the first factor, while a downward-pointing arrow denotes a 90° overrun of the first factor. The thin black line is the cone boundary of the wavelet influence. Wavelet coherence ranges from 0 to 1 (0 denotes a completely uncorrelated sequence, while 1 denotes a perfectly correlated sequence).
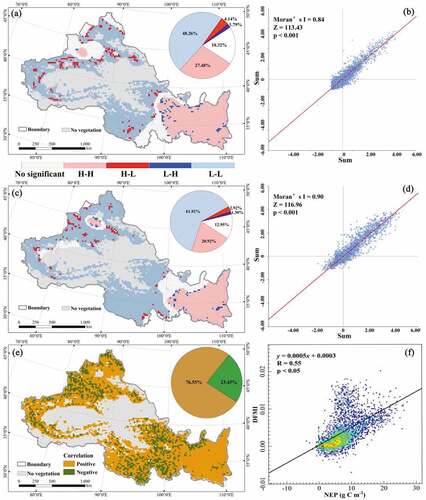
The spatial clustering of vegetation NEP and DFMI in NWC during 2000–2019 showed a similar distribution pattern in . They exhibited a large area of H–H and L–L clustering types (75.74% and 82.83%) with a patchy distribution, while H–L and L–H clustering had a smaller area (5.93% and 4.22%) with a fragment. The spatial clustering of NEP and DFMI in NWC was obvious, and there was a positive interaction between them. Among them, the H–H clustering spatial characteristics of both NEP and DFMI were mainly in Shaanxi, eastern and southern Gansu, eastern Qinghai, and southern Ningxia, while the L–L clustering spatial characteristics were mainly in Xinjiang, southern Qinghai, and western Gansu. From , the Moran’s I of NEP and DFMI in NWC during 2000–2019 were 0.84 and 0.90, respectively, with p-values less than 0.001, indicating that the vegetation NEP and DFMI in NWC showed significant positive spatial clustering characteristics. Meanwhile, the correlation analysis showed () that vegetation NEP and DFMI showed negative correlations in the Qinghai Plateau, Tianshan Mountains, Qilian Mountains, and Guanzhong Plain. However, 76.55% of the regional vegetation NEP and DFMI in NWC showed a positive correlation, and the correlation between NEP and DFMI was 0.55, further proving that the regional NEP and DFMI showed a significant positive correlation (p < 0.05). To summarize, the vegetation carbon sinks and DFMI showed a certain positive correlation in NWC. The drier the vegetation, the weaker the carbon sink capacity, and drought significantly weakened the function of vegetation carbon sinks.
Figure 10. Spatial autocorrelation and response relationship of vegetation NEP (a, b) and DFMI (c, d) in NWC (e, f).
5. Discussion
5.1. Validation of NEP
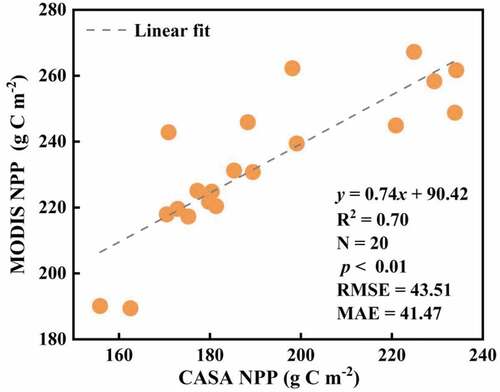
In this study, the vegetation NEP in NWC was estimated by combining the CASA model and the RH. To demonstrate the credibility of the NEP indicator, we need to evaluate the simulation results of both components. The validation of the CASA model can be generally divided into two methods, either by comparing the actual measurements with the estimated values or by comparing other model results or remote sensing data products with the estimated values (Pan and Li Citation2015). Although the actual measurement method is more reliable, it is more difficult to conduct surveys and samples on large time scales throughout NWC. Therefore, the estimated results were compared with the NPP remote sensing products of MODIS MOD17A3H in this study. From , the CASA model was significantly correlated with MODIS NPP values (R2 = 0.70, p < 0.01) with 43.51 g C m−2 for RSME and 41.47 g C m−2 for MAE, indicating that the model results were more reliable. The CASA NPP results are mainly affected by the accuracy of meteorological data, the quality of NDVI raw images and the mixed image signal together, and a fraction of absorbed photosynthetically active radiation (fAPAR) (Potter, Klooster, and Genovese Citation2012). The validation of MODIS NPP products is derived from monitoring values of global boreal coniferous forests, temperate forests, and grasslands (Pan and Li Citation2015). Compared to it, the CASA model considers the coexistence of sparse vegetation types prevalent in arid regions, which resulted in lower NPP results (Pan and Wen Citation2015). The fAPAR is calculated from a linear function of NDVI, and the quality of NDVI images is often affected by the presence of clouds and fog in mountainous areas (Xu et al. Citation2021). Furthermore, the CASA model sets a constant maximum light energy use efficiency value across different biome types without considering its influence by meteorological variables and vegetation cover (Twine and Kucharik Citation2009). In this study, MODIS NPP products are resampled from 500 m to 1 km, and errors may arise during resampling, resulting in inconsistent biomass of the two data. Therefore, the results we obtained have not overperformed the MODIS NPP product.
Figure 11. Comparison of NPP simulation value and product value.
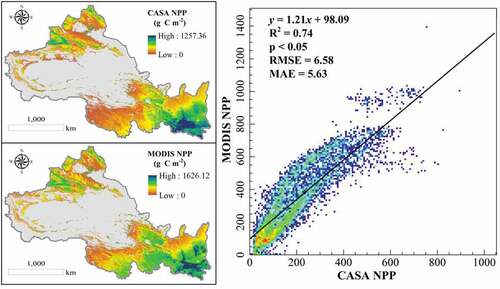
To further verify the accuracy of the CASA NPP, we compared it with MODIS NPP and further counted the correlation between the multi-year averages of the two data during 2000–2019 at the spatial image element scale. From , the spatial distribution of the multi-year averages of CASA NPP and MODIS NPP was similar, showing the characteristics of high in the east and low in the west. Meanwhile, the fitting between CASA NPP and MODIS NPP data were high (R2 = 0.74, p < 0.05) and the error was small (RMSE = 6.56 g C m−2, MAE = 5.63 g C m−2). Therefore, the NPP results we obtained from using the CASA model were reliable.
Figure 12. Spatial pixel results in validation of CASA NPP and MODIS NPP.
Moreover, the NPP results simulated by other studies were compiled and counted, and the simulated values of NPP under different land cover types (forest, grassland, and cropland) were compared with the results of other simulations in this study (). It could be found that the simulated results of this study were all in between the results of other simulations, which further proved the credibility of the simulated results of NPP. The RH was established by Pei et al. (Citation2010) using the relationship between carbon emissions and temperature and precipitation at the Wudaoliang experimental site in Qinghai Province and had been applied and validated in ecosystems under different regions of NWC (Pan and Li Citation2015; Pan and Wen Citation2015; Wang et al. Citation2021; Liu et al. Citation2021; Wei et al. Citation2022). To summarize, the NEP results we obtained from the simulation are more accurate and reliable.
Table 3. Comparison of simulated NPP values of different land cover types with other simulated results (g C m−2).
5.2. Variation characteristics of vegetation NEP
Under different climatic zones and land cover types in NWC, vegetation carbon sink capacity was the strongest in the humid region and forest and the weakest in arid regions and grassland (), which was consistent with the findings of previous studies (Pan and Li Citation2015; Wei et al. Citation2022). Since the humid region was dominated by forests, the carbon sink capacity of the forest was stronger (Li and Xiao Citation2020), resulting in the strongest vegetation carbon sink capacity in the humid region. In contrast, the arid region was dominated by grassland, sparse vegetation, or even no vegetation. Under high-temperature stress, vegetation photosynthesis was weakened or even stagnated, respiration was increased, and the increase in respiration was greater than the decrease in vegetation productivity, which led to a decrease in vegetation carbon sinks (Salvucci and Crafts-Brandner Citation2004). Overall, the interannual variation of NEP under different land cover types in NWC showed a significant increasing trend on the aridity gradient, showing that the wetter the vegetation, the higher the carbon sinks (). A new finding of this study was that vegetation NEP showed a significant decreasing trend when in the transition zone between semi-arid and semi-humid regions (0.40 < AI < 0.47) and extreme humid region (AI > 0.85), especially forest and grassland. The study showed that semi-arid ecosystems dominated the interannual trend variation of carbon sinks in terrestrial ecosystems and were highly sensitive to drought trends (Ahlström et al. Citation2015). In the transition zone between semi-arid and semi-humid, drought may positively or negatively affect the trends in vegetation NEP due to changes in hydroclimate and vegetation type (Xu et al. Citation2018). Meanwhile, plenty of water was detrimental to the carbon sequestration of ecosystems in humid regions. Under prolonged flooding, vegetation roots were severely deprived of oxygen and their respiration was reduced, which might eventually cause vegetation mortality to affect the trends of NEP (Zeppel, Wilks, and Lewis Citation2014). Therefore, either too dry or too wet could deviate from the environment to which vegetation has long been adapted. There was inhibited vegetation growth and even leading to vegetation death, further affecting the size and direction of regional and global terrestrial vegetation carbon sinks (Piao et al. Citation2019).
5.3. Effects of drought on vegetation NEP
Drought was one of the main stressors affecting the carbon sink function of ecosystems in NWC (Gou et al. Citation2013). NWC was an arid and semi-arid fragile environment that was vulnerable to drought (Wang et al. Citation2015). Through comparison and validation between drought indexes, we found that the DFMI developed in this study was consistent with the drought pattern reflected by the meteorological drought index in NWC (), which proved the scientific validity of the index. The DFMI had a clear concept and a simple calculation, which could more accurately identify areas with drought increasing in NWC. The DFMI showed great potential for early warning and impact assessment of ecological drought over large spatial scales. In the response relationship between vegetation carbon sinks and drought, there was an 8–20 months periodic significant positive correlation between vegetation NEP and DFMI in NWC during 2000–2019 (). Zhou et al. (Citation2022) found a significant positive correlation between meteorological drought and vegetation in the Pearl River Basin, with a cyclical feature at 8–20 months. In southwest China, Wu (Citation2021) explored the relationship between vegetation NEP and drought in conjunction with the Standardized Precipitation Evapotranspiration Index (SPEI) and obtained similar results (vegetation NEP was positively correlated with the drought index to vary degree). Furthermore, the spatial clustering characteristics of vegetation NEP and DFMI in NWC during 2000–2019 were positive interaction, with high–high and low–low clustering types (). Since high–high clustering areas were distributed with plenty of forests and croplands, which had stronger carbon sink capacity and drought resistance (Cao et al. Citation2022) and were distributed with high agglomeration. Thus, the high–high clustering spatial characteristic was presented with regional NEP and DFMI. Most of the low–low clustering areas were distributed by grasslands, which were vulnerable to hydroclimatic differences (Xu et al. Citation2018) and had weaker carbon sink capacity and drought resistance forming low–low agglomeration spatial characteristics, Thus, the low–low clustering spatial characteristic was presented with regional NEP and DFMI. The drier the vegetation in NWC, the weaker the carbon sink capacity, and drought significantly weakens the function of vegetation carbon sinks (). Since under drought conditions, water stress led to planting growth limitation, while soil water content decreased significantly, which reduced vegetation autotrophic respiration rate and lower ecosystem productivity and carbon sink function (Doughty et al. Citation2015). It was worth noting that vegetation NEP and DFMI showed a negative correlation in the Qinghai Plateau, Tianshan Mountains, Qilian Mountains and Guanzhong Plain, i.e. the drier the vegetation, the stronger the carbon sink capacity. The main land cover type in the Guanzhong Plain was cropland, which was vulnerable to human activities (Zhang et al. Citation2021). The influence of climatic factors on the carbon sink capacity of vegetation became weaker due to the strong drought tolerance of anthropogenically grown crops. In contrast, vegetation growth was driven by multiple factors due to the large altitudinal variation in the Qinghai Plateau, Tianshan Mountains, and Qilian Mountains, and the influence of a single factor on vegetation growth was weakened to different degrees. For example, vegetation growth in the Qilian Mountains was mainly driven by sunshine hours and wind speed, and other factors (temperature, precipitation, evapotranspiration, etc.) had less influence on vegetation (Zhang et al. Citation2021). Moreover, the vegetation distributed in these regions was highly resistant to cold and drought, and drought might not significantly impact the vegetation’s carbon sink capacity. Therefore, it was a more appropriate way with local climatic conditions, and coordinating the restoration of vegetation in conjunction, which was appropriate for the location to reach the “peak carbon by 2030 and carbon neutrality by 2060” target in NWC and China as a whole.
5.4. Limitations
Drought is one of the important factors affecting vegetation NEP changes, but not all of them. For example, recent reports suggested that anthropogenic disturbances (grazing, mining, land cover change, and tourism) adversely affected vegetation NEP in the arid zone of Northwest China (Wang, Zhao, and Zhang Citation2022). Furthermore, the current terrestrial vegetation carbon sink estimation models were mostly based on experience and statistics, and the empirical formulae relied on monitoring data from small-scale experimental areas or a few experimental stations. Whether the empirical models could be fully applied to the large-scale vegetation carbon sink studies in the process of point-to-surface calculation was further verified based on additional observation data. To our knowledge, this study is the first attempt to develop the drought index based on SIF data to explore the relationship between vegetation NEP and drought response. In the future study, we will combine multiple methods to compare the degree of influence of different droughts (e.g. meteorological drought, agricultural drought, hydrological drought, etc.) on the terrestrial vegetation carbon sinks.
6. Conclusions
This study simulated the changing pattern of vegetation NEP in NWC with the help of ground and remote sensing data and explored the response mechanism of vegetation NEP to drought, providing important scientific theories and techniques for achieving regional ecological management and restoration. We found that the interannual rate of vegetation NEP change in NWC was 7.09 g C m−2yr−1 during 2000–2019, showing a significant increasing trend (p < 0.05). In terms of spatial distribution, large trend changes were mainly concentrated in northern Shaanxi, eastern and southern Gansu, and southern Ningxia (about 20.86%). The change of vegetation NEP was determined by both climatic conditions and vegetation types, and there were differences in the carbon sink capacity under different climatic zones and land cover types. Among them, the strongest carbon sink capacity was found in humid regions and forests, and the weakest was in arid regions and grassland. Overall, vegetation NEP increased with increasing AI, but it decreased significantly when in the semi-arid and semi-humid transition zone and extreme humid region, especially in forest and grassland. Compared with VCI, DFMI quickly identified drought area changes at different drought classes in NWC. Meanwhile, DFMI showed a significant positive correlation with vegetation NEP. There was an 8–20-month periodic significant positive correlation in NWC, and a similar distribution pattern in space, both dominated by high–high and low–low clustering. Therefore, drought had a serious negative impact on vegetation carbon sink capacity, and the drier the vegetation, the worse the vegetation carbon sink capacity. Our study reveals the key climatic conditions (semi-arid and semi-humid transition zone and extreme humid region) where drought affects the vegetation growth in NWC, and suggests that management measures such as windbreak and sand fixation should be taken in these areas to maintain the carbon cycle function of the terrestrial ecosystem.
Disclosure statement
No potential conflict of interest was reported by the authors.
Data availability statement
The data supporting this study’s findings are available on the USGS Land Processes Distributed Active Archive Center (LPDAAC) for MODIS data at http://lpdaac.usgs.gov/. The DEM is freely from NASA’s SRTM data at http://srtm.csi.cgiar.org/, the Landsat images are freely downloaded in the Resource and Environment Science Data Center of the Chinese Academy of Sciences at http://www.resdc.cn/, and the GOSIF data are derived from the NASA Orbiting Carbon Observatory 2 (OCO-2) at https://globalecology.unh.edu/. The meteorological data come from the National Climate Centre of China Meteorological Administration at http://data.cma.cn/.
Correction Statement
This article has been republished with minor changes. These changes do not impact the academic content of the article.
Additional information
Funding
References
- Ahlström, A., M. R. Raupach, G. Schurgers, B. Smith, A. Arneth, M. Jung, N. Zeng, et al. 2015. “The Dominant Role of Semi-Arid Ecosystems in the Trend and Variability of the Land CO2 Sink.” Science 348 (6237): 895–22. doi:10.1126/science.aaa1668.
- Allen, C. D., D. D. Breshears, and N. G. McDowell. 2015. “On Underestimation of Global Vulnerability to Tree Mortality and Forest Die-Off from Hotter Drought in the Anthropocene.” Ecosphere 6: 1–55. doi:10.1890/ES15-00203.1.
- Cao, J., Q. An, X. Zhang, S. Xu, T. Si, and D. Niyogi. 2021. “Is Satellite Sun-Induced Chlorophyll Fluorescence More Indicative Than Vegetation Indices Under Drought Condition?” The Science of the Total Environment 792: 148396. doi:10.1016/j.scitotenv.2021.148396.
- Cao, S. P., Y. He, L. F. Zhang, Y. Chen, W. Yang, S. Yao, and Q. Sun. 2021. “Spatiotemporal Characteristics of Drought and Its Impact on Vegetation in the Vegetation Region of Northwest China.” Ecological Indicators 133: 108420. doi:10.1016/j.ecolind.2021.108420.
- Cao, S. P., L. F. Zhang, Y. He, Y. L. Zhang, Y. Chen, S. Yao, Q. Sun, and Q. Sun. 2022. “Effects and Contributions of Meteorological Drought on Agricultural Drought Under Different Climatic Zones and Vegetation Types in Northwest China.” The Science of the Total Environment 821: 153270. doi:10.1016/j.scitotenv.2022.153270.
- Chen, X., X. Mo, Y. Zhang, Z. Sun, Y. Liu, S. Hu, and S. Liu. 2019. “Drought Detection and Assessment with Solar-Induced Chlorophyll Fluorescence in Summer Maize Growth Period Over North China Plain.” Ecological Indicators 104: 347–356. doi:10.1016/j.ecolind.2019.05.017.
- Dobrowski, S. Z., J. C. Pushnik, P. J. Zarco-Tejada, and S. Ustin. 2005. “Simple Reflectance Indices Track Heat and Water Stress -Induced Changes in Steady-State Chlorophyll Fluorescence at the Canopy Scale.” Remote Sensing of Environment 97: 403–414. doi:10.1016/j.rse.2005.05.006.
- Doughty, C. E., D. B. Metcalfe, C. A. J. Girardin, F. F. Amézquita, D. G. Cabrera, W. H. Huasco, J. E. Silva-Espejo, et al. 2015. “Drought Impact on Forest Carbon Dynamics and Fluxes in Amazonia.” Nature 519: 78–82. doi:10.1038/nature14213.
- Fernández-Martínez, M., S. Vicca, I. A. Janssens, Sardans, J., Luyssaert, S., Campioli, M., Peñuelas, J., et al. 2014. “Nutrient Availability as the Key Regulator of Global Forest Carbon Balance.” Nature Climate Change 4 (6): 471–476. doi:10.1038/nclimate2177.
- Ghosh, K. G. 2018. “Analysis of Rainfall Trends and Its Spatial Patterns During the Last Century Over the Gangetic West Bengal, Eastern India.” Journal of Geovisualization and Spatial Analysis 2 (2). doi:10.1007/s41651-018-0022-x.
- Gonsamo, A., J. M. Chen, L. He, Y. Sun, C. Rogers, and J. Liu. 2019. “Exploring SMAP and OCO-2 Observations to Monitor Soil Moisture Control on Photosynthetic Activity of Global Drylands and Croplands.” Remote Sensing of Environment 232: 111314. doi:10.1016/j.rse.2019.111314.
- Gou, Q. Q., J. J. Qu, Z. W. Han, and J. H. Xiao. 2013. “Progress of Carbon Cycle Research in Arid and Semi-Arid Areas Ecosystem of China.” Chinese Agricultural Science Bulletin 35: 205–210.
- Guanter, L., L. Alonso, L. Gomez-Chova, J. Amorós-López, J. Vila, and J. Moreno. 2007. “Estimation of Solar-Induced Vegetation Fluorescence from Space Measurements.” Geophysical Research Letters 34: L08401. doi:10.1029/2007GL029289.
- Guanter, L., Y. G. Zhang, M. Jung, J. Joiner, M. Voigt, J. A. Berry, C. Frankenberg, et al. 2014. “Global and Time-Resolved Monitoring of Crop Photosynthesis with Chlorophyll Fluorescence.” Proceedings of the National Academy of Sciences of the United States of America 111: E1327–1333. doi:10.1073/pnas.1320008111.
- Guo, H., A. Bao, T. Liu, Ndayisaba, F., Jiang, L., Zheng, G., De Maeyer, P., et al. 2019. “Determining Variable Weights for an Optimal Scaled Drought Condition Index (OSDCI): Evaluation in Central Asia.” Remote Sensing of Environment 231: 111220. doi:10.1016/j.rse.2019.111220.
- Hargreaves, G. H., and Z. A. Samani. 1985. “Reference Crop Evapotranspiration from Temperature.” Applied Engineering in Agriculture 1: 96–99. doi:10.13031/2013.26773.
- He, Y., T. B. Yang, J. Qin, J. Chen, W. W. Shao, and W. -W. Shao. 2015. “Glacier Variation in Response to Climate Change in Chinese Tianshan Mountains from 1989 to 2012.” Journal of Mountain Science 12: 14. doi:10.1007/s11629-015-3445-6.
- Jiao, W., Y. N. Chen, and Z. Li. 2017. “Remote Sensing Estimation and the Reasons for Temporal-Spatial Differences of Vegetation Net Primary Productivity in the Arid Region of Northwest China.” Chinese Journal of Ecology 36 (1): 181–189.
- Kogan, F. N. 1995. “Drought of the Late 1980s in the United States as Derived from NOAA Polar-Orbiting Satellite Date.” Bulletin of the American Meteorological Society 78 (4): 655–668. doi:10.1175/1520-0477(1995)076<0655:DOTLIT>2.0.CO;2.
- Lawal, S., B. Hewitson, T. S. Egbebiyi, and A. Adesuyi. 2021. “On the Suitability of Using Vegetation Indices to Monitor the Response of Africa’s Terrestrial Ecoregions to Drought.” The Science of the Total Environment 792: 148282. doi:10.1016/j.scitotenv.2021.148282.
- Lian, X., L. Jiao, Z. Liu, Q. Jia, J. Zhong, M. Fang, and W. Wang. 2022. “Multi-Spatiotemporal Heterogeneous Legacy Effects of Climate on Terrestrial Vegetation Dynamics in China.” GIScience & Remote Sensing 59 (1): 164–183. doi:10.1080/15481603.2021.2022426.
- Li, C. H., H. J. Cao, Y. P. Fan, H. Y. Han, H. Sun, and Y. T. Wang. 2019. “Remote Sensing Estimation and Analysis of Net Primary Productivity (NPP) Based on Corrected CASA Model: A Case Study of Hexi Corridor.” Acta Ecologica Sinica 39 (5): 1616–1626.
- Liu, Y., C. Dang, H. Yue, C. Lyu, and X. Dang. 2021. “Enhanced Drought Detection and Monitoring Using Sun-Induced Chlorophyll Fluorescence Over Hulun Buir Grassland, China.” The Science of the Total Environment 770: 145271. doi:10.1016/j.scitotenv.2021.145271.
- Liu, L., X. Yang, H. Zhou, Liu, S., Zhou, L., Li, X., Wu, J., et al. 2018. “Evaluating the Utility of Solar-Induced Chlorophyll Fluorescence for Drought Monitoring by Comparison with NDVI Derived from Wheat Canopy.” The Science of the Total Environment 625: 1208–1217. doi:10.1016/j.scitotenv.2017.12.268.
- Liu, F., and Y. N. Zeng. 2021. “Analysis of the Spatio-Temporal Variation of Vegetation Carbon Source/Sink in Qinghai Plateau from 2000-2015.” Acta Ecologica Sinica 14: 5792–5803.
- Liu, Z., X. Zhang, and R. Fang. 2018. “Multi-Scale Linkages of Winter Drought Variability to ENSO and the Arctic Oscillation: A Case Study in Shaanxi, North China.” Atmospheric Research 200: 117–125. doi:10.1016/j.atmosres.2017.10.012.
- Liu, C., X. Zhang, T. Wang, G. Chen, K. Zhu, Q. Wang, and J. Wang. 2022. “Detection of Vegetation Coverage Changes in the Yellow River Basin from 2003 to 2020.” Ecological Indicators 138: 108818. doi:10.1016/j.ecolind.2022.108818.
- Li, X., and J. Xiao. 2019. “A Global, 0.05-Degree Product of Solar-Induced Chlorophyll Fluorescence Derived from OCO-2, MODIS, and Reanalysis Data.” Remote Sensing 11 (5): 517. doi:10.3390/rs11050517.
- Li, X., and J. Xiao. 2020. “Global Climatic Controls on Interannual Variability of Ecosystem Productivity: Similarities and Differences Inferred from Solar-Induced Chlorophyll Fluorescence and Enhanced Vegetation Index.” Agricultural and Forest Meteorology 288: 108018. doi:10.1016/j.agrformet.2020.108018.
- Li, X., J. Xiao, and B. He. 2018. “Higher Absorbed Solar Radiation Partly Offset the Negative Effects of Water Stress on the Photosynthesis of Amazon Forests During the 2015 Drought.” Environmental Research Letters 13 (4): 044005. doi:10.1088/1748-9326/aab0b1.
- Li, X., J. Xiao, B. He, M. Altaf Arain, J. Beringer, A. R. Desai, C. Emmel, et al. 2018. “Solar-Induced Chlorophyll Fluorescence is Strongly Correlated with Terrestrial Photosynthesis for a Wide Variety of Biomes: First Global Analysis Based on OCO-2 and Flux Tower Observations.” Global Change Biology 24 (9): 3990–4008. doi:10.1111/gcb.14297.
- Lu, H., Z. Qin, S. Lin, X. Chen, B. Chen, B. He, J. Wei, and W. Yuan. 2022. “Large Influence of Atmospheric Vapor Pressure Deficit on Ecosystem Production Efficiency.” Nature Communications 13: 1653. doi:10.1038/s41467-022-29009-w.
- Pan, J. H., and Z. Li. 2015. “Temporal-Spatial Change of Vegetation Net Primary Productivity in the Arid Region of Northwest China During 2001 and 2012.” Chinese Journal of Ecology 12: 3333–3340.
- Pan, S., H. Tian, C. Lu, S. R. Dangal, and M. Liu. 2015. “Net Primary Production of Major Plant Functional Types in China: Vegetation Classification and Ecosystem Simulation.” Acta Ecologica Sinica 35 (2): 28–36. doi:10.1016/j.chnaes.2015.03.001.
- Pan, J. H., and Y. Wen. 2015. “Estimation and Spatial-Temporal Characteristics of Carbon Sinks in the Arid Region of Northwest China.” Acta Ecologica Sinica 35 (23): 7718–7728. doi:10.5846/stxb201405211045.
- Pei, Z. Y., C. P. Zhou, H. Ouyang, and W. B. Yang. 2010. “A Carbon Budget of Alpine Steppe Area in the Tibetan Plateau.” Geographical Research 29: 102–110.
- Piao, S. L., X. P. Zhang, A. P. Chen, Q. Liu, X. Lian, X. H. Wang, and X. C. Wu. 2019. “Effects of Extreme Climate Events on Carbon Cycling in Terrestrial Ecosystems.” Scientia Sinica (Terrae) 9: 1321–1334.
- Potter, C., S. Klooster, and V. Genovese. 2012. “Net Primary Production of Terrestrial Ecosystems from 2000 to 2009.” Climatic Change 115: 365–378. doi:10.1007/s10584-012-0460-2.
- Salvucci, M. E., and S. J. Crafts-Brandner. 2004. “Inhibition of Photosynthesis by Heat Stress: The Activation State of Rubisco as a Limiting Factor in Photosynthesis.” Physiologia plantarum 120: 179–186. doi:10.1111/j.0031-9317.2004.0173.x.
- Seidl, R., G. Klonner, W. Rammer, F. Essl, A. Moreno, M. Neumann, and S. Dullinger. 2018. “Invasive Alien Pests Threaten the Carbon Stored in Europe’s Forests.” Nature Communication 9: 1626. doi:10.1038/s41467-018-04096-w.
- Shi, Z. H. 2015. Spatio-Temporal Simulation of Vegetation Carbon Sinks and Its Influencing Factors Based on CASA and GSMSR Models in Shaanxi Province. Northwest A&F University.
- Song, L., L. Guanter, K. Guan, L. You, A. Huete, W. Ju, and Y. Zhang. 2018. “Satellite Sun-Induced Chlorophyll Fluorescence Detects Early Response of Winter Wheat to Heat Stress in the Indian Indo-Gangetic Plains.” Global Change Biology 24: 4023–4037. doi:10.1111/gcb.14302.
- Torrence, C., and G. P. Compo. 1998. “A Practical Guide to Wavelet Analysis.” Bulletin of the American Meteorological Society 79 (1): 61–78. doi:10.1175/1520-0477(1998)079<0061:APGTWA>2.0.CO;2.
- Twine, T. E., and C. J. Kucharik. 2009. “Climate Impacts on Net Primary Productivity Trends in Natural and Managed Ecosystems of the Central and Eastern United States.” Agricultural and Forest Meteorology 149: 2143–2161. doi:10.1016/j.agrformet.2009.05.012.
- Wang, C., Y. C. Liu, and Z. Li. 2021. “Effects of Ecological Water Conveyance on the Spatial Pattern of Vegetation Carbon Sources/Sinks in the Lower Reaches of Tarim River.” Arid Land Geography 3: 729–738.
- Wang, T., X. Xue, L. Zhou, and J. Guo. 2015. “Combating Aeolian Desertification in Northern China.” Land Degradation & Development 26 (2): 118–132. doi:10.1002/ldr.2190.
- Wang, S., Y. Zhang, W. Ju, J. M. Chen, P. Ciais, A. Cescatti, Janssens, I. A., et al. 2020. “Recent Global Decline of CO2 Fertilization Effects on Vegetation Photosynthesis.” Science 370 (6522): 1295–1300. doi:10.1126/science.abb7772.
- Wang, C., W. Zhao, and Y. Zhang. 2022. “The Change in Net Ecosystem Productivity and Its Driving Mechanism in a Mountain Ecosystem of Arid Regions, Northwest China.” Remote Sensing 14 (16): 4046. doi:10.3390/rs14164046.
- Wan, W., Z. Liu, J. Li, J. Xu, H. Wu, and Z. Xu. 2022. “Spatiotemporal Patterns of Maize Drought Stress and Their Effects on Biomass in the Northeast and North China Plain During 2000-2019.” Agricultural and Forest Meteorology 315: 108821. doi:10.1016/j.agrformet.2022.108821.
- Wei, X., J. Yang, P. Luo, L. Lin, K. Lin, and J. Guan. 2022. “Assessment of the Variation and Influencing Factors of Vegetation NPP and Carbon Sinks Capacity Under Different Natural Conditions.” Ecological Indicators 138: 108834. doi:10.1016/j.ecolind.2022.108834.
- Wu, M. Y. 2021. Responses of Ecosystem Carbon Cycle to Drought in Southwest China. Xi’an University of Science and Technology. doi:10.27397/d.cnki.gxaku.2021.000951.
- Xia, A. Q., Y. F. Wang, Y. B. Hao, R. H. Hu, F. Wang, W. C. Wu, and X. Y. Cui. 2020. “Research Progress on Estimation of Vegetation Carbon Storage of Grasslands on Complex Terrain by Remote Sensing Technology.” Acta Ecologica Sinica 40 (18): 6338–6350.
- Xu, H. J., X. P. Wang, and T. B. Yang. 2017. “Trend Shifts in Satellite-Derived Vegetation Growth in Central Eurasia, 1982–2013.” The Science of the Total Environment 579: 1658–1674. doi:10.1016/j.scitotenv.2016.11.182.
- Xu, H. J., X. P. Wang, and C. Y. Zhao. 2021. “Drought Sensitivity of Vegetation Photosynthesis Along the Aridity Gradient in Northern China.” International Journal of Applied Earth Observation and Geoinformation 102: 102418. doi:10.1016/j.jag.2021.102418.
- Xu, H. J., X. P. Wang, C. Y. Zhao, and X. M. Yang. 2018. “Diverse Responses of Vegetation Growth to Meteorological Drought Across Climatic Zones and Land Biomes in Northern China from 1981 to 2014.” Agricultural and Forest Meteorology 262: 1–13. doi:10.1016/j.agrformet.2018.06.027.
- Xu, H. J., X. P. Wang, C. Y. Zhao, and X. M. Yang. 2021. “Assessing the Response of Vegetation Photosynthesis to Meteorological Drought Across Northern China.” Land Degradation & Development 32 (1): 20–34. doi:10.1002/ldr.3701.
- Yang, H., and W. Chen. 2022. “Spatio-Temporal Pattern of Urban Vegetation Carbon Sinks and Driving Mechanisms of Human Activities in Huaibei, China.” Environmental Science and Pollution Research 29 (21): 31957–31971. doi:10.1007/s11356-022-18512-8.
- Yoshida, Y., J. Joiner, C. Tucker, Berry, J., Lee, J. E., Walker, G., Wang, Y., et al. 2015. “The 2010 Russian Drought Impact on Satellite Measurements of Solar -Induced Chlorophyll Fluorescence: Insights from Modeling and Comparisons with Parameters Derived from Satellite Reflectances.” Remote Sensing of Environment 166: 163–177. doi:10.1016/j.rse.2015.06.008.
- Yuan, J., Z. Bian, Q. Yan, Z. Gu, and H. Yu. 2020. “An Approach to the Temporal and Spatial Characteristics of Vegetation in the Growing Season in Western China.” Remote Sensing 12 (6): 945. doi:10.3390/rs12060945.
- Zeppel, M. J. B., J. V. Wilks, and J. D. Lewis. 2014. “Impacts of Extreme Precipitation and Seasonal Changes in Precipitation on Plants.” Biogeosciences 11: 3083–3093. doi:10.5194/bg-11-3083-2014.
- Zhang, Y., L. Guanter, J. A. Berry, C. van der Tol, X. Yang, J. Tang, and F. Zhang. 2016. “Model-Based Analysis of the Relationship Between Sun-Induced Chlorophyll Fluorescence and Gross Primary Production for Remote Sensing Applications.” Remote Sensing of Environment 187: 145–155. doi:10.1016/j.rse.2016.10.016.
- Zhang, L., W. Jiao, H. Zhang, Huang, C., and Tong, Q. 2017. “Studying Drought Phenomena in the Continental United States in 2011 and 2012 Using Various Drought Indices.” Remote Sensing of Environment 190: 96–106. doi:10.1016/j.rse.2016.12.010.
- Zhang, L. Y., X. Li, J. H. Feng, G. L. Rao, T. Y. He, and Y. Chen. 2021. “Spatial-Temporal Changes of NDVI in Yellow River Basin and Its Dual Response to Climate Change and Human Activities During 2000-2018.” Bulletin of Soil and Water Conservation 41 (05): 276–286.
- Zhang, Z. Y., S. H. Wang, B. Qiu, L. Song, and Y. G. Zhang. 2019. “Retrieval of Sun-Induced Chlorophyll Fluorescence and Advancements in Carbon Cycle Application.” Journal of Remote Sensing 23 (1): 37–52.
- Zhang, Z., W. Xu, Q. Qin, and Y. Chen. 2020. “Monitoring and Assessment of Agricultural Drought Based on Solar-Induced Chlorophyll Fluorescence During the Growing Season in North China Plain.” IEEE Journal of Selected Topics in Applied Earth Observations and Remote Sensing 14: 775–790. doi:10.1109/JSTARS.2020.3032414.
- Zhang, Z., W. Xu, Q. Qin, and Z. Long. 2020. “Downscaling Solar-Induced Chlorophyll Fluorescence Based on Convolutional Neural Network Method to Monitor Agricultural Drought.” IEEE Transactions on Geoscience and Remote Sensing 59 (2): 1012–1028. doi:10.1109/TGRS.2020.2999371.
- Zhang, L., H. Yan, Y. He, S. Yao, S. Cao, and Q. Sun. 2022. “Spatiotemporal Prediction of Alpine Vegetation Dynamic Change Based on a ConvGru Neural Network Model: A Case Study of the Upper Heihe River Basin in Northwest China.” IEEE Journal of Selected Topics in Applied Earth Observations and Remote Sensing 15: 6957–6971. doi:10.1109/JSTARS.2022.3200521.
- Zhang, L., H. Yan, L. Qiu, S. Cao, Y. He, and G. Pang. 2021. “Spatial and Temporal Analyses of Vegetation Changes at Multiple Time Scales in the Qilian Mountains.” Remote Sensing 13 (24): 5046. doi:10.3390/rs13245046.
- Zhang, M., N. Yuan, H. Lin, Y. Liu, and H. Zhang. 2022. “Quantitative Estimation of the Factors Impacting Spatiotemporal Variation in NPP in the Dongting Lake Wetlands Using Landsat Time Series Data for the Last Two Decades.” Ecological Indicators 135: 108544. doi:10.1016/j.ecolind.2022.108544.
- Zhou, Z., S. Liu, Y. Ding, Q. Fu, Y. Wang, H. Cai, and H. Shi. 2022. “Assessing the Responses of Vegetation to Meteorological Drought and Its Influencing Factors with Partial Wavelet Coherence Analysis.” Journal of Environmental Management 311: 114879. doi:10.1016/j.jenvman.2022.114879.
- Zhu, W. Q., Y. Z. Pan, Z. H. Long, Y. H. Chen, J. Li, and H. B. Hu. 2005. “NPP Estimation of Regional Terrestrial Vegetation Based on GIS and RS: A Case Study of Inner Mongolia, China.” Journal of Remote Sensing 9 (3): 300–307.
- Zhu, W. Q., Y. Z. Pan, and J. S. Zhang. 2007. “Estimation of Net Primary Productivity of Chinese Terrestrial Vegetation Based on Remote Sensing.” Chinese Journal of Plant Ecology 31 (3): 413–424. doi:10.17521/cjpe.2007.0050.