
 ?Mathematical formulae have been encoded as MathML and are displayed in this HTML version using MathJax in order to improve their display. Uncheck the box to turn MathJax off. This feature requires Javascript. Click on a formula to zoom.
ABSTRACT
Urban vibrancy is an important indicator of urban prosperity. Evaluating the correlation between urban vibrancy and housing prices is increasingly necessary. However, most studies have ignored the temporal characteristics of urban vibrancy and only considered its spatial nature. This study optimizes the identification model of urban vibrancy centers and proposes a novel model for evaluating the time-dynamic accessibility of urban vibrancy centers. The model takes into account real-time changes in travel costs and analyses its spatial correlation with housing prices. The case study of Chengdu shows significant variations in the spatiotemporal distribution of urban vibrancy centers. High-vibrancy areas are concentrated near commercial complexes. The time distribution of urban vibrancy accessibility is more concentrated at night (18:00–24:00), and the high-accessibility areas are located around the old city and the newly planned Central Business District in the south. Housing prices and urban vibrancy centers accessibility are mainly negatively correlated spatially. The study emphasizes the temporal nature of urban vibrancy and accessibility and enriches the evaluation model of urban vibrancy centers. It also contributes to the improvement of the framework of urban vibrancy research and deepens the understanding of the important variable of “time” in urban planning.
1. Introduction
Global urban expansion has been a persistent trend for over a decade, and it is expected to continue in the future (Li et al. Citation2019). However, urban expansion has negative consequences such as traffic congestion, environmental pollution, low urban vibrancy, insufficient public space, “ghost cities,” and high housing prices. These effects reduce the efficiency of urban resource use, jeopardizing the sustainability of the region (Güneralp et al. Citation2017). Among these, urban vibrancy and housing prices are closely related to people’s well-being, making them a hot topic in urban research (Bagheri and Shaykh-Baygloo Citation2021). While there is extensive research on urban vibrancy, only a limited number of studies have considered its time dynamic, and few have shown the spatial correlation between urban vibrancy centers and housing prices.
The concept of urban vibrancy was first developed by Jacobs (Citation1961), who argued that urban vibrancy is the ability to generate vibrant commercial and human activity, derived from the diversity of human activities interacting with urban space. A vibrant city meets all the basic requirements for human life in a safe environment (Lynch Citation1984), and has the potential to attract capital and talent, enhancing its competitive edge in the global arena (Xiao et al. Citation2021). Vibrant cities can optimize urban form in the context of rapid urbanization, and enhance the city’s ability to compete globally (Wang et al. Citation2021). Therefore, rational evaluation of urban vibrancy helps formulate policies to promote the development of urban spaces and has been a long-standing objective of urban research (Tu et al. Citation2020). The centralization of urban vibrancy and the evaluation of urban vibrancy centers are also necessary because the concept of it is a dual concept used to determine urban land use and the density of residential activity (Hillier Citation1999). Urban vibrancy centers have the characteristics of urban centers in general, whereby there is a multiplicity of functions, a spatial combination of the urban functions required by the inhabitants of the city, and a spatial correlation, whereby the different functional spaces permeate each other to form an organic whole.
Urban vibrancy is a key topic in urban research and evaluating human activity in cities (Sung and Lee Citation2015). Early evaluations relied on qualitative methods like questionnaires, interviews, and field surveys (Raman Citation2010; Ravenscroft Citation2000), but this approach was limited by its subjectivity and high manpower requirement. Scholars have since turned to quantifying urban vibrancy with land use and point of interest data. With advancements in technology, geotagged data, like mobile phone signals (Lee et al. Citation2018), smart card data (Tu et al. Citation2022), and social media check-ins (Lang et al. Citation2022), provide new means of sensing residents’ activities and interactions with the environment (Shaw, Tsou, and Ye Citation2016). Compared with the urban vibrancy evaluated by questionnaire and other traditional data, the urban vibrancy evaluated through the city big data has a larger amount of data and a stronger time integrity (Delclòs-Alió, Gutiérrez, and Miralles-Guasch Citation2019). Recently, social media data has been increasingly used to describe urban vibrancy. Researchers tend to use kernel density estimation models and present results based on the timing of social media posts. This approach takes into account the temporal and spatial characteristics of urban vibrancy and is considered reasonable (Wang et al. Citation2022). However, most previous research on urban vibrancy has been based on static baseline data, ignoring the temporal regularity and rhythm of human activity in cities (Ouyang et al. Citation2022). Urban rhythm refers to the temporal and spatial regularity of urban life and activities. This concept considers that people’s daily activities in cities have a certain cyclical temporality (Mulíček, Osman, and Seidenglanz Citation2015), and we believe that this regularity of human activities makes it even more important to study the time dynamics of urban vibrancy. Therefore, new, time dynamic-based data and models for evaluating urban vibrancy need to be expanded. Moreover, there is growing awareness of the spatial distribution and spatial heterogeneity of urban vibrancy, with some areas of the city being significantly more vibrant than others (Gómez-Varo, Delclòs-Alió, and Miralles-Guasch Citation2022). The balance between the “supply” capacity of vibrant areas or centers of city and the “demand” capacity of the city’s population distribution is therefore a key issue in the study of urban vibrancy, this coincides with the concept of accessibility, which focuses on supply and demand capacity at both the start and end points (Li et al. Citation2023). It is therefore feasible to use accessibility to link urban vibrancy to residential communities and further deepen the impact of urban vibrancy on residents at the community scale (Braun and Malizia Citation2015).
Accessibility was originally a spatial concept used to express the difficulty of overcoming spatial obstacles to move from one location to another (Morris, Dumble, and Wigan Citation1979). Today, accessibility is an important indicator in the urban planning process (Kelobonye et al. Citation2019). The three important elements of accessibility assessment are the starting point, the end point and the way in which the starting point and the end point are linked (Moseley Citation1979). Traditional methods for evaluating accessibility, such as the potential model (Salze et al. Citation2011), huff model (Sevtsuk and Kalvo Citation2018) and kernel density model (Spencer and Angeles Citation2007) have limitations in taking into account the supply and demand capacity of the starting and end points, as well as the decay of attraction capacity when travel costs rise. The two-step floating catchment area (2SFCA) method, introduced by Luo and Wang (Citation2003), addresses these issues by taking into account the supply and demand points themselves and the cost of travel. Many scholars have proposed improved methods based on 2SFCA, most of these improvements focus on attenuation effects when travel costs increase and tiering of supply capacity (Bozorgi et al. Citation2021; Kim et al. Citation2021). Dai (Citation2010) introduced the Gaussian decay function to 2SFCA method to form Gaussian 2SFCA method (G2SFCA), thus better reflecting the reality that the decline in attractiveness is not linear as the cost of travel increases, making travel costs to play a more rational role in the assessment of accessibility. The 2SFCA method and its improved methods are used not only for the accessibility evaluation of specific public services facilities such as hospitals, gardens and schools (Yang et al. Citation2022), but also for the accessibility evaluation of nonphysical supply points such as urban heat sources (Li et al. Citation2023). Among the many improved 2SFCA methods, the G2SFCA method has been shown to obtain more realistic spatial accessibility as it takes into account the effect of non-linear decay in attractiveness as the cost of travel increases (Li et al. Citation2021).
Scholars have used the Neighbourhood Services Index (NeSI) to measure urban vibrancy and explore its spatial clustering with housing prices (Barreca, Curto, and Rolando Citation2020). However, research on this relationship is still in its infancy due to a lack of a unified paradigm, neglect of the time factor, and inaccurate data. Recent studies have shown that housing prices are linked to the distribution of urban services facilities and human activities (Li, Chen, and Zhao Citation2019; Xiao, Hui, and Wen Citation2020), and there are also studies that have analyzed the relationship between shopping mall and underground accessibility and housing prices based on the accessibility perspective (Wen et al. Citation2018; Zhang, Zhou, and Hui Citation2020), such services facilities and human activities directly dominate the spatial distribution of urban vibrancy. However, research on the accessibility of urban vibrancy centers and their spatial correlation with housing prices is still at a nascent stage, and specific evaluation models and methods need further refinement.
The main purposes of this study were to: (1) identify the urban vibrancy centers conducting by constructing an improved density-field based hotspot detector model (DF-HD) based on geotagged social media data; (2) evaluate the time dynamic accessibility to the urban vibrancy centers by proposing a novel temporal dynamic accessibility evaluation model; (3) further reveal the spatial clustering of housing prices and the time dynamic accessibility of urban vibrancy centers.
2. Materials and methodology
2.1. Study area
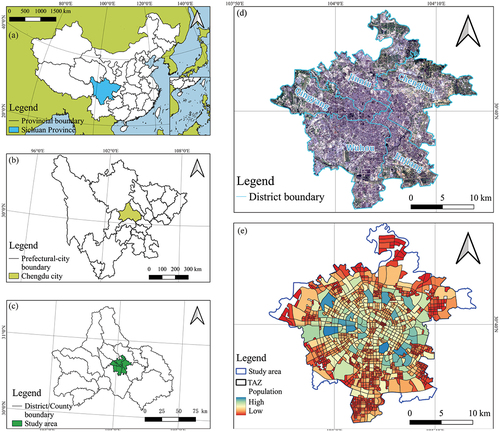
Chengdu city (E102°54′~104°53′,N30°05′~31°26′), the capital of Sichuan province in southwest China, has been recognized for its adept use of social media for self-promotion (Zhang et al. Citation2021). The study focuses on the metropolitan area of Chengdu, which includes the five most prosperous old districts of Qingyang, Wuhou, Jinniu, Jinjiang, and Chenghua. The area spans 420 km2 and the 7th National Census of China in 2020 states that the total population of the region is 5.71 million with an urbanization rate of 100%, meaning that the area is entirely populated by urban residents. The study area is home to most of the administrative, medical and cultural resources of Chengdu and even Sichuan province. The traffic analysis zones (TAZs) based on road network data were generated as the accessibility evaluation unit, and a total of 1323 valid TAZs are obtained in the study area after data processing, excluding TAZs with very low population values (these are considered meaningless). The spatial location of the study area and the distribution of TAZs are shown in .
Figure 1. Study area. (a) to (c) on the left show the location of the study area at the national, provincial and municipal scales in a progressive manner, (d) shows the satellite image and administrative division of the study area, and (e) shows the results of the TAZ segmentation.
2.2. Methodology
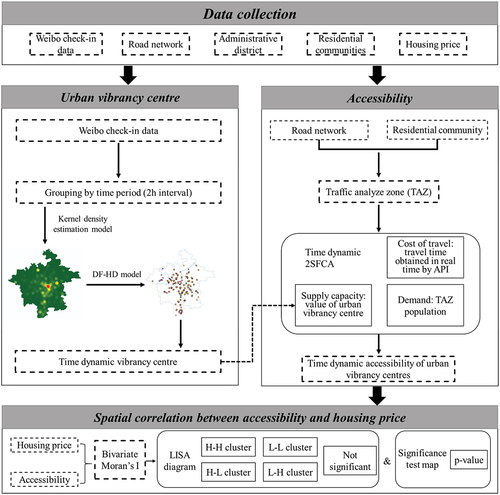
In this research, a social media data-driven approach is built to identify time dynamic urban vibrancy spaces, and a density field hotspot detector (DF-HD) model was constructed to extract urban vibrancy centers and vibrancy levels. Secondly, an improved 2SFCA method is used to calculate the time dynamic accessibility of each TAZ to urban vibrancy centers at each time interval. Finally, the spatial correlations between the accessibility around the TAZ and the housing prices of the TAZ are evaluated using LISA diagram based on the bivariate local Moran index. The workflow chart of this study is shown in .
Figure 2. Flow chart for analyzing urban vibrancy centers, evaluating their time dynamic accessibility and measuring the spatial correlation between accessibility and housing prices.
2.2.1. Identifying urban vibrancy centers
The kernel density model and the Getis-Ord Gi* index (Baddeley, Rubak, and Turner Citation2015; Songchitruksa and Zeng Citation2010) are the most commonly used models in studies related to the detection of aggregation centers or hotspots, but these models have their limitations; the kernel density model has difficulty in obtaining exact hotspot centers and hotspot peak values, while the Getis-Ord Gi* index method has a weak significance test leading to “false positives”, resulting in too many hotspots as well as a weak ability to handle outliers (Levine Citation2013). In order to accurately identify urban centers of vibrancy, we use the DF-HD model (Zhang et al. Citation2020), a hotspot identification model based on a density field formed by kernel density estimation, which not only quantifies hotspots and their peaks in the form of “points”, but also has the advantage of avoiding outliers. In this study, geotagged social media check-ins were linked to their corresponding points of interest (POIs) using the Baidu Maps API. The check-in data was divided into 12 two-hour time intervals within a 24-hour time scale, and kernel density estimation was used to generate a continuous density field surface for each time interval. This transformed the discrete check-in data into a continuous field model, allowing for more accurate analysis. The kernel density estimation model estimates the density value of a target point by setting a bandwidth r centered at any point, taking into account the number of event points within the bandwidth and the distance from the event point to the target point. This allows for a more nuanced analysis of spatial patterns in the study area. It is calculated as:
Where is the density of the estimated target raster cell centroid
; r is the bandwidth;
is the number of sample points within the bandwidth;
,
are the coordinates of sample point;
are the coordinates of the estimated target raster cell centroid. It can be concluded that the choice of bandwidth is crucial to the results of kernel density estimation. We set the bandwidth from 500 m to 1500 m in steps of 200 m based on the average side length of the TAZ (700 m). After using DF-HD to extract the hotspots of the urban vibrancy centers, it shows that the density field surface with a bandwidth of 1500 m generates too many hotspots (more than 100 at each time intervals), and the number is unstable; while the density field surface with a bandwidth of 1100 m generates too few hot spots (less than 10 in individual intervals); the number of hotspots generated on the surface of the density field with a bandwidth of 1300 m is moderate and the distribution is stable in each period (20 to 45 hotspots). Therefore, an interval of 1300 m was selected as the bandwidth of kernel density estimation for subsequent analysis.
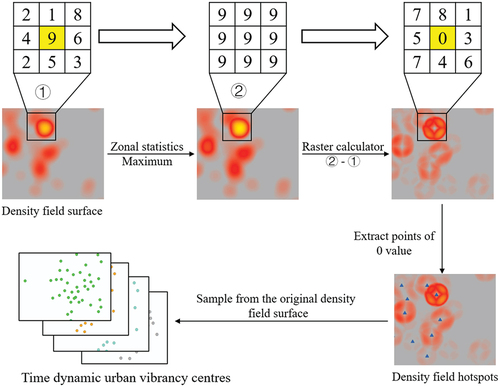
Based on the generation of the kernel density fields, the DF-HD model is used to identify urban vibrancy centers, and the process of DF-HD model is shown in . After generating the density surface, the first step is to construct a neighborhood statistic maximum surface to detect the location of the maximum value in the local area using focal statistics tool, we generate a density surface with a pixel resolution of 50 m and the focal statistics is set to 3 × 3 pixels, so the range of neighborhood statistics is 150 m × 150 m. Second, the raster calculator is used to perform an algebraic difference operation to obtain a non-negative surface. In the non-negative surface, the 0-value pixel represents a local extreme value point. Finally, the location of the 0-value pixel is extracted using reclassification and sampled on the original density surface, and the sampled value is the urban vibrancy value at that point. In addition, we have improved the DF-HD model by ignoring the 0 and very low values (the lowest 5% at each time interval) in the density field surface during the focal statistics phase, in this way avoiding the generation of meaningless density surface hotspots when the neighborhood pixels are all 0 or very low.
Figure 3. Flow chart of the DF-HD model for identifying urban vibrancy centers.
2.2.2. Accessibility assessment of urban vibrancy centers
A new accessibility evaluation methodology approach is proposed based on the G2SFCA method to assess the time dynamic accessibility of urban vibrancy centers. The time dynamics here are reflected in two main aspects, the time distribution of the urban vibrancy centers on the one hand and the time dynamics of travel costs on the other. The accessibility of urban vibrancy centers for a single time interval is calculated as follows.
In the first step, for each urban vibrancy center , given a travel time threshold
, the population of each TAZ
with travel time within
is assigned a weight using Gaussian equation and these weighted populations are summed to obtain the number of all potential users of urban vibrancy center; the supply capacity of the urban vibrancy center is then divided by the number of all potential users to obtain the supply-demand ratio
. According to a survey published by a Chinese big data company (2018 China Urban Commuting Study), the average commuting time in Chengdu is 46 minutes, so the time threshold for this study is floated up by 30% to 60 minutes.
Where: is the population of TAZ
with travel time cost less than
in urban vibrancy center
;
is the time dynamic travel cost from the center of TAZ k to the urban vibrancy center
;
is the supply capacity of urban vibrancy center
, represented in this research by the density surface generated from social media data;
is the Gaussian equation that takes into account the spatial friction problem, calculated as follows.
In the second step, for each TAZ , given a travel time threshold
, the supply ratios
for each urban vibrancy center
with travel times less than
are similarly weighted using a Gaussian equation, and these weighted supply ratios
are then summed to obtain the obtain the urban vibrancy center accessibility
for each TAZ
for time interval
. The second step is calculated as follows:
The overall accessibility of urban vibrancy centers is obtained by adding up the accessibility of each time period, calculated as follows:
Where denotes the overall time dynamic accessibility,
denotes a certain time interval (2 h).
2.3. Data source and processing
The data used in this study include social media check-in data, POI data, residential community data, and road network data.
Sina Weibo’s social media check-in data was used in this study to evaluate urban vibrancy centers. Sina Weibo (www.weibo.com) is the largest social media platform in China, with over 580 million monthly active users. It is a universal social platform similar to Facebook and Twitter. Users can post micro-blogs with geotags that point to a POI of one of the online map providers, which by default is the closest POI to the user at the time of posting the micro-blogs. We used Python programming language to obtain social media data containing geotags in the study area from August 4 to 10 August , during which the order of life in Chengdu was not affected by the COVID-19. A total of 22,006 geotagged social media data were obtained. The spatiotemporal distribution of social media data at 2-hour intervals and administrative district divisions is shown in . More Weibo check-ins are posted within the Wuhou and Jinjiang districts than in other districts, and more check-ins are posted between 20 h-24 h than in other time intervals.
Table 1. Spatial and temporal distribution of social media check-in data.
Baidu map (map.baidu.com) was used in this study to obtain POIs and match them with POIs in the geotags of the social media data. Baidu Maps is one of the largest online map service providers in China. We use its API (Application program interface) to obtain the geographical coordinates of the corresponding POI.
The residential community data includes information on the coordinates, price and number of households in the residential community. The data was obtained by Python programming language from Lianjia (www.lianjia.com) – one of the largest real estate trading platforms in China. We acquired a total of 3311 residential communities, prices range from of $9500/m2 to $928/m2, with an average of $2512/m2. The average number of households per community is 847. The population is obtained by multiplying the number of households in the community by the average household size of 2.62 persons from the results of the seventh national census. This gives a total population of approximately 7.3 million people in the study area. The official statistical yearbooks for each district show a total resident population of 6.35 million by the end of 2020. Given that this data is for the year 2020 and only the resident population is taken into account, it is considered that the error between the data we have obtained and the actual situation is within a reasonable range and can be used for the study.
Road network data is downloaded from Openstreetmap (www.openstreetmap.org), a global open-source map database. Road network vectors were used to segment TAZ as study units for assessing accessibility. The operation of generating TAZ is done on ArcMap software, and the method of generating TAZ is based on the algorithm proposed by Yuan, Zheng, and Xie (Citation2012) and manual adjustment, the study area was divided into 1469 TAZs based on the road network data. The population data for each TAZ is based on the distribution of residential communities. TAZs with zero or very small populations are not considered in the analysis in order to ensure the accuracy of the data. A total of 1323 TAZs were considered for the accessibility assessment.
3. Result
3.1. Spatial and temporal distribution of urban vibrancy centers
The social media check-in data was processed using the methods in Section 3 and a total of 472 urban vibrancy centers were identified across the 12 time periods in the study area. The highest vibrancy value was 132.61 and the lowest was 1.13, with a mean value of 15.37 and a standard deviation of 16.04. The spatial distribution of urban vibrancy centers is shown in .
Figure 4. Spatial and temporal distribution of urban vibrancy centers and the location of major shopping areas in the study area.
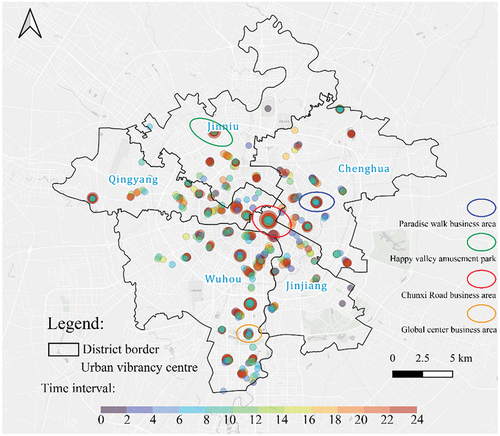
The study found that urban vibrancy centers in Chengdu are spread throughout all five districts, but are more concentrated in the central and southern areas of the metropolitan area. These clusters are highlighted in , including popular locations such as the Chengdu Happy Valley amusement park and the commercial districts of Chunxi Road, Global Center, and Paradise Walk. Other urban vibrancy centers are located in higher education institutions like Sichuan University and Chengdu University of Technology, as well as natural landscapes such as the Chengdu Giant Panda Breeding Research Base and the International Intangible Cultural Heritage Park. During the day (8:00 to 18:00), vibrant centers are mainly centered around office buildings and natural landscapes such as parks, while at night (18:00 to 24:00), they are focused on shopping complexes and commercial pedestrian streets. provides the number of urban vibrancy centers and vibrancy values for each administrative district during different time periods.
Table 2. Distribution of the number of urban vibrancy centers and average vibrancy values by time period in different administrative districts.
Among the five districts studied, Wuhou District stands out with significantly higher numbers of urban vibrancy centers and vibrancy values, with a 120% lead over the second-place Chenghua District. On the other hand, Jinniu District has the lowest number of urban vibrancy centers and vibrancy values, with a value only 53.6% of that of Jinjiang District, the second-lowest district. However, the other three districts show a more even distribution of urban vibrancy centers, and their differences in vibrancy values are not significant. The period from 18:00 to 24:00 has the highest vibrancy value and the greatest number of urban vibrancy centers, while the period from 4:00 to 6:00 has the lowest values, reflecting the pattern of people’s rest and travel time. There is a clear upward trend in activity values from 4:00 to 6:00, peaking between 22:00 and 24:00 and then gradually decreasing after midnight.
3.2. Time dynamic accessibility assessment
In order to better reflect the relative position of time dynamic accessibility values within their time periods, we use the natural breakpoint method (Jenks Citation1967) to classify the time dynamic accessibility assessment results into five levels, where level 1 is the highest and level 5 is the lowest. The assessment results are shown in .
Figure 5. Spatial distribution of accessibility to urban vibrancy centers. (a) to (l) represent the spatial distribution of accessibility of urban vibrancy centers at two-hour intervals, and (m) is the overall accessibility, which is the sum of the accessibility of these 12 time periods.
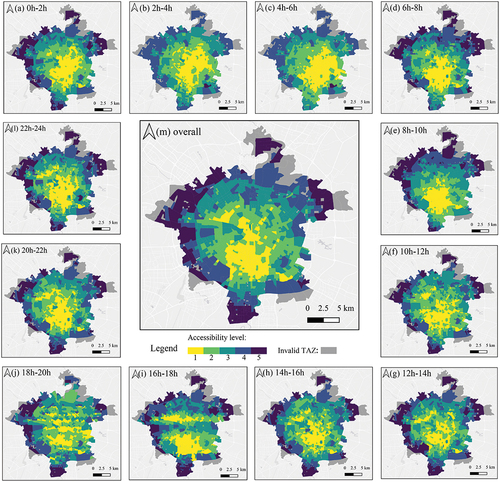
During the early hours of the morning from 0 h to 2 h, high urban vibrancy accessibility zones are mainly concentrated in the central and southern areas of the study area, particularly in the cultural and commercial area of the old town of Chengdu. Between 2 h and 6 h, there is no fifth level of accessibility TAZ, indicating a relatively small accessibility gap between TAZs in this time period. From 6 h to 10 h, high accessibility areas gradually shift southwards, with a decrease in accessibility in the northern part of the study area. Between 10 h and 16 h, the concentration of high-accessibility areas in the central and southern part of the study area weakens, and high-accessibility areas appear in the north-western part, while low-accessibility areas remain distributed in the periphery of the study area. From 16 h onwards, high-accessibility areas become further dispersed, with the clustering of high-accessibility areas in the center of the study area disappearing and the clustering of high-accessibility areas in the south of the study area remaining evident. Between 18 h and 20 h, there is no clear pattern of clustering of high-accessibility areas, and the low-accessibility areas in the north of the study area are further reduced. From 20 h to 24 h, high-accessibility areas are clustered in the center of the study area, with high-accessibility areas also appearing in the north-western part of the study area, while accessibility decreases in the north. The overall time dynamic accessibility is obtained by summing the accessibility of the urban vibrancy centers for each time period according to EquationEquation 5(5)
(5) , with the spatial distribution shown in the , and there is a clear clustering of high-accessibility areas in the south-central part of the study area and in the Chunxi Road shopping area, with a radial pattern decreasing in all directions. High-accessibility areas are also scattered in the north-west, north-east and south-east of the study area, and the concentration of high-accessibility areas in the center of the study area is less pronounced compared to the 20 h-24 h high accessibility period.
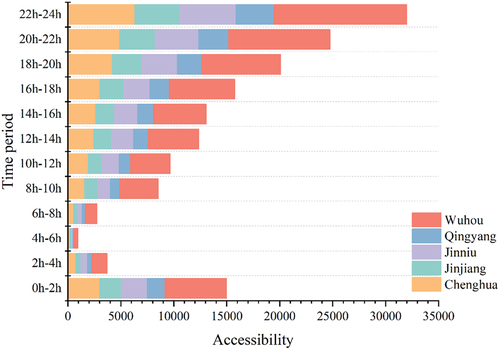
The results of the time dynamic accessibility of urban vibrancy centers by administrative district are shown in . Wuhou district has the highest accessibility to urban vibrancy centers for all time periods, which is due to the fact that Wuhou has the highest number of urban vibrancy centers and the highest vibrancy values. This is followed by Chenghua district and Jinniu district, while Qingyang district has the lowest accessibility to urban vibrancy centers. There are also significant differences in accessibility between time periods due to the large differences in the vibrancy values of the urban vibrancy centers, which are reflected in the accessibility assessment in terms of the supply capacity of the destinations. Accessibility to urban vibrancy centers is highest at night from 20 h-24 h and lowest in the early morning from 4 h-8 h. This coincides with the temporal distribution of urban vibrancy centers in .
Figure 6. Cumulative accessibility by time period for different administrative regions.
3.3. Spatial disparity of accessibility to urban vibrancy centers with housing price
The local bivariate Moran’s index and p-values of time dynamic accessibility to urban vibrancy centers and housing price is calculated to form five clustering types using GeoDa software. The five types of spatial clusters to form LISA diagram is identified as: (1)not significant; (2) high-high clustering (H-H), which means that there is high accessibility around the TAZ and high housing prices in the TAZ; (3)low-low clustering (L-L), which means that there is low accessibility around the TAZ and low housing prices in the TAZ; the meaning of (4) high-low (H-L) and (5) low-high (L-H) clustering can be deduced by analogy. H-H and L-L clustering indicate a positive spatial correlation between surrounding accessibility and housing prices, while H-L and L-H clustering indicate a negative correlation. The p-value is a common concept in statistics and reflects the confidence level of the local bivariate Moran’s index of the evaluation unit, and the p-values indicate the probability of an outlier in an observation. For example, a p-value of 0.05 indicates that the observation is 95% significantly reliable. In statistics, observations are generally considered significant when the p-value is less than 0.05, and p-values are segmented by 0.05, 0.01 and 0.001. The spatial distribution of LISA diagram and p-value is shown in .
Figure 7. Spatial distribution of LISA diagram and p-value. (a) represents the spatial distribution of the five clustering types, (b) represents the p-value of each evaluation unit.
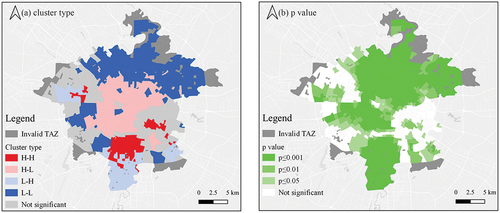
The LISA diagram revealed that the TAZs in the north of the study area formed a clear L-L cluster, indicating lower accessibility in the surrounding TAZs and lower housing prices. In the center of the study area, the TAZs were dominated by H-L clusters, indicating higher accessibility in the surrounding TAZs but lower housing prices. The southern part of the study area was dominated by H-H and L-H clusters, with high housing prices and high accessibility in some TAZs and low accessibility and high housing prices in others. “Not significant” clusters were mainly located in the western and eastern edges of the study area. The spatial distribution of p-values indicated the highest confidence in the clustering results in the north and south of the study area, with p-values of TAZs in these regions mostly less than 0.001, exceeding 99.9% confidence. In the central region, p-values were relatively low but still credible, with most above 0.05.
shows the quantitative relationship between the different types of clusters in each administrative region. The number of negatively correlated clusters (L-H and H-L) was greater than the number of positively correlated (L-L and H-H) and “not significant” clusters. Qingyang and Wuhou districts had the highest number of negatively correlated clusters, while Chenghua and Jinniu districts had the highest number of positively correlated clusters. Jinjiang district had the highest number of “not significant” clusters.
Table 3. Number and proportions of LISA clusters by districts.
4. Discussion
4.1. Discussion on the time dynamics of urban vibrancy centers and accessibility
Urban big data, particularly user-contributed data, plays a crucial role in urban research, requiring organization and modeling to develop ideas for urban planning, design, and sustainable development (Kandt and Batty Citation2021). Capturing the time dynamic nature of this data is important, given that it is influenced by the activity behavior of urban residents (Khodabandelou et al. Citation2018; Martí, Serrano-Estrada, and Nolasco-Cirugeda Citation2019). Therefore, this study identifies two time dynamic aspects: social media data and travel costs. The former is used to evaluate urban vibrancy centers and identify their spatial location at 2-hour intervals, while the latter is used to evaluate accessibility over the same time period through an online mapping API. By considering both aspects, this evaluation is justified from a time dynamic perspective and can be extended to other areas of accessibility evaluation. This dual time dynamic approach considers both the supply point situation and the connection between supply and demand points.
The evaluation of urban vibrancy centers in Chengdu through the perspective of time dynamics yielded results that are generally consistent with previous studies (Li et al. Citation2022). However, the concentration and vibrancy level of urban vibrancy spaces analyzed in this study are more pronounced in the southern part of the study area, which is the latest financial district planned by the Chengdu Municipal Government. This area has a large number of office buildings and shopping complexes and has been shown to have a significantly stronger urban heat island index and human activity intensity than surrounding areas (Liu et al. Citation2022; Zhong et al. Citation2020). Therefore, the results of this study’s evaluation of the time dynamics of the urban vibrancy center of the metropolitan area of Chengdu can be considered reliable.
The concept of “15-minute convenient living circle” has been proposed by several Chinese city governments, including Chengdu, since 2018, and many studies have been conducted on urban and transport planning related to this concept (Song et al. Citation2022; Zhang et al. Citation2022). This is another subject closely related to time dynamics, where the range of 15-minute journeys and the main destinations of 15-minute residents vary considerably at different times of the day. This is consistent with the “dual time dynamics” logic of this study, and thus, the model can be extended to the “15-minute convenient living circle,” providing a useful reference for cities to design resident-friendly facility layouts.
4.2. Interpretation of the spatial correlation between housing price and time dynamic accessibility
In section 3.2 of this study, it was concluded that there is a negative spatial correlation between accessibility to urban vibrancy centers and housing prices in the study area. This means that prices are generally lower in areas with high accessibility to urban vibrancy centers and higher in areas with low accessibility. and provide data to support this conclusion. represents a typical area where the accessibility of the urban vibrancy center forms a H-L clustering with the housing price. This area is located in the old city of Chengdu and its urban vibrancy mainly comes from the famous tourist attraction, Wuhou Temple. The housing prices in this area are lower than the average in the study area, around $1700/m2, due to early construction, small set areas, and lack of property services.
Figure 8. Typical areas forming negative spatial correlation clusters. (a) represents the typical area where H-L clusters are formed, (b) typical area where L-H clusters are formed.
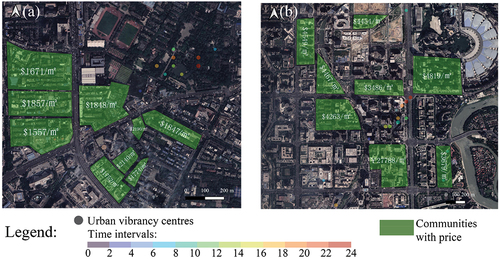
In contrast, shows an area where the accessibility of the urban vibrancy centers forms a L-H cluster with the housing price. This area is located in the new urban area in the south of Wuhou District, and its urban vibrancy mainly comes from the office area. The urban vibrancy is relatively low due to the daytime period accounting for more of the urban vibrancy. However, the communities in this area were built later, with larger areas, excellent greening rates, property services, and a beautiful environment. These factors make the housing prices around $4400/m2, which is higher than the average housing price in the study area. This result may seem counterintuitive, but it is supported by data and differs from some previous research findings (Barreca et al. Citation2020). It is worth noting that recent studies have shown that housing prices are generally lower in areas with significant urban heat island effects than in areas without (Sagris and Sepp Citation2017). The urban heat island effect is a reflection of the intensity of human activity in an area (Parker Citation2010), which is similar to the results of this study.
Taking into account the specific urban planning scenario for Chengdu and previous research findings, there are two main reasons for the negative spatial correlation between accessibility to urban vibrancy centers and housing prices. The first is the “edge effect” of housing prices in urban areas; the second is the “spillover effect” of urban vibrancy space. Regarding the edge effect, recent research has shown that high property price areas are moving to the periphery of the city (Teng, Chang, and Chen Citation2017). It can be argued that housing prices have moved out of the traditional “concentric circles” spatial distribution pattern to a “marginalized” spatial distribution with clusters of high housing prices at the edge of the old city (Niu and Liu Citation2017). High-priced communities on the outer edge of the main urban area, away from industrial areas, with beautiful surroundings, newer amenities and easy commuting to the CBD, while reasonably avoiding the hustle and bustle of the city center, are becoming increasingly popular with high-income earners. Regarding the spillover effect, cities are adopting the polycentric model of urban spatial planning (Derudder et al. Citation2022). This model involves artificially planning new areas of population, commerce, and resources at a distance from the old urban areas, with the hope that these new centers will drive the development of the surrounding areas. There is a clear shift in planning toward health and education resources and job opportunities in these new centers, resulting in high prices in these new urban areas on the edge of the old city (Huai, Lo, and Ng Citation2021). By analyzing the spatio-temporal concept of accessibility, this study builds a bridge between the analysis of urban vibrancy and the distribution of housing prices. It is the combination of the edge effect and spillover effect that leads to the result of a negative spatial correlation between accessibility to urban vibrancy centers and housing prices in certain regions of Chengdu.
4.3. Policy implications
The use of data-driven methods, especially based on social media check-in data to evaluate urban vibrancy is a common method (Chen et al. Citation2019; Wu, Zhao, and Ye Citation2023), and has a certain spatial transferability and high feasibility (Zhu et al. Citation2020). Our study is an extension of this, enriching the perspective of time dynamics, further identifying the central location of urban vibrancy, analyzing its time dynamic accessibility, and exploring the spatial correlation between this accessibility and housing prices. We believe that the framework and methodology of this study is equally applicable to other large cities or “net cities”, where residents have a high enough level of social media usage, and that the results of this study may provide some inspiration to policy makers. However, the applicability of the methodology to smaller or developing cities requires further validation and discussion. Combined with the results of this study’s analysis, policy implications can be provided for the Chengdu city government from the following perspectives:
The spatially negative correlation between urban vibrancy accessibility and housing prices in a given area may mean that development in certain areas has been overly biased toward commercial and economic vibrancy at the expense of housing quality. Policymakers could consider introducing policy measures to support the housing supply, including rehabilitating existing housing and optimizing the environment of residential neighborhoods.
High housing prices in areas with low accessibility to urban vibrancy may be related to the lack of development potential of the area. Policymakers could consider measures to enhance the vibrancy of these areas, such as improving infrastructure, promoting cultural and creative industries, and attracting investment, in order to increase the attractiveness of the area and the activity of the real estate market.
The complex relationship between urban vibrancy and housing prices requires integrated planning and governance. Policymakers can promote cross-sectoral cooperation and coordination to ensure policy coherence and coordination in urban development, housing policy, land planning, etc. At the same time, policymakers need to rely on reliable data and research to support decision-making. Collect and analyze data on urban vibrancy, housing prices, demographic changes, economic development, etc. to gain a more accurate understanding of the issues and to formulate policies and measures accordingly.
4.4. Limitations and future research
The use of the spatio-temporal concept of accessibility as a bridge between urban vibrancy and socio-economic indicators from the perspective of the dynamics of time has deepened the understanding of the spatial distribution of urban vibrancy. However, there are limitations to the study that should be addressed in future research. The first of these limitations is the reliance on social media data from Weibo, which may not provide a complete picture of urban vibrancy as it mainly represents young and middle-aged users (Li et al. Citation2020). The second limitation of the study is that it does not consider the diversity of travel modes used by urban residents. While self-driving is the main mode of travel in Chengdu, the share of other modes of travel, such as public transport and bicycles, is increasing (Geng, Long, and Chen Citation2016). Finally, there are various factors that influence the spatial distribution of housing prices, such as the time of completion and the quality of property services, etc. This study only analyses the spatial correlation between housing prices and the accessibility of the city vibrancy centers in the current context, and this spatial correlation cannot be seen as an influence of the latter on the former, which needs to be studied more comprehensively.
In subsequent studies, the data used to evaluate urban vibrancy should be expanded to explore other forms of data to enrich the data base for urban vibrancy evaluation and explore the influence of all age groups on urban vibrancy; the differences in travel modes of different people should also be considered to enrich the travel modes in accessibility studies so as to obtain more accurate travel costs. There are already studies on multi-modal accessibility evaluation models (Hu et al. Citation2020), but these models are not closely integrated with time dynamics, which is a focus of subsequent research. In addition, in order to more objectively and accurately reflect the influence of accessibility to urban vibrancy centers on housing prices, this accessibility should be used as one of the influencing factors in subsequent studies, combined with more various types of influencing factors, and more complex evaluation models should be used to analyze its influence on housing prices.
5. Conclusion
This study applies social media data and the DF-HD model to the identification of time dynamic urban vibrancy centers, and innovatively proposes a time dynamic accessibility evaluation model that takes into account real-time changes in travel costs, evaluates the accessibility of each TAZ to urban vibrancy centers, and explores its spatial correlation with housing prices. The case study of Chengdu city shows that: (1) urban vibrancy centers in the study area show significant spatial and temporal heterogeneity, with the highest urban vibrancy at night in the vicinity of large commercial complexes, and some scenic parks have significantly higher urban vibrancy than other surrounding areas during the afternoon hours. (2) The results of the accessibility evaluation combining the supply and demand points with the dynamic travel costs over time show that there is a clear tendency for the accessibility of urban vibrancy centers to cluster at night, with the high accessibility areas clustered in the central and southern parts of the study area, and the accessibility of Wuhou District is significantly better than that of other administrative districts. (3) 46.9% of TAZs show a negative spatial correlation between the accessibility of urban vibrancy centers and housing prices (H-L clustering or L-H clustering), with H-L clustering dominating, accounting for 32.6% of all TAZs. The “dual time dynamics” logic of this study, namely the time variation of urban vibrancy centers and the time variation of travel costs, ensures that time, an important variable in urban research, is fully considered. The models and results presented in this study can contribute to sound urban planning, informing public administrations and real estate developers to further optimize the layout of industries from a “time perspective”, and enriching policy makers’ understanding of urban time dynamics.
Acknowledgments
This research was supported by the National Social Science Foundation of China [18BJY086], National Natural Science Foundation of China [42201308] Natural Science Foundation of Shandong Province, China [ZR2021QD127, ZR2021ME203]. The authors would like to gratefully acknowledge the anonymous reviewers and the members of the editorial team who helped to improve this paper through their thorough review.
Disclosure statement
No potential conflict of interest was reported by the author(s).
Data availability statement
Social media data with geotags were obtained from Weibo (www.weibo.com), data related to residential communities were obtained from Lianjia (https://cd.lianjia.com/xiaoqu/), roads in the study area and TAZ data generated after processing in this study can be downloaded from this link: https://osf.io/uq6vg/files
Other data that support the findings of this study are available from the authors, upon reasonable request.
References
- Baddeley, A., E. Rubak, and R. Turner. 2015. Spatial Point Patterns: Methodology and Applications with R. CRC press. https://doi.org/10.1201/b19708.
- Bagheri, B., and R. Shaykh-Baygloo. 2021. “Spatial Analysis of Urban Smart Growth and Its Effects on Housing Price: The Case of Isfahan, Iran.” Sustainable Cities and Society 68:102769. https://doi.org/10.1016/j.scs.2021.102769.
- Barreca, A., R. Curto, and D. Rolando. 2020. “Urban Vibrancy: An Emerging Factor That Spatially Influences the Real Estate Market.” Sustainability 12 (1): 346. https://doi.org/10.3390/su12010346.
- Barreca, A., R. Curto, D. Rolando, and M. Swapan. 2020. “Is the Real Estate Market of New Housing Stock Influenced by Urban Vibrancy?” Complexity 2020:1–18. https://doi.org/10.1155/2020/1908698.
- Bozorgi, P., J. M. Eberth, J. P. Eidson, and D. E. Porter. 2021. “Facility Attractiveness and Social Vulnerability Impacts on Spatial Accessibility to Opioid Treatment Programs in South Carolina.” International Journal of Environmental Research and Public Health 18 (8): 4246. https://doi.org/10.3390/ijerph18084246.
- Braun, L. M., and E. Malizia. 2015. “Downtown Vibrancy Influences Public Health and Safety Outcomes in Urban Counties.” Journal of Transport & Health 2 (4): 540–548. https://doi.org/10.1016/j.jth.2015.08.005.
- Chen, T., E. C. Hui, J. Wu, W. Lang, and X. Li. 2019. “Identifying Urban Spatial Structure and Urban Vibrancy in Highly Dense Cities Using Georeferenced Social Media Data.” Habitat International 89:102005. https://doi.org/10.1016/j.habitatint.2019.102005.
- Dai, D. 2010. “Black Residential Segregation, Disparities in Spatial Access to Health Care Facilities, and Late-Stage Breast Cancer Diagnosis in Metropolitan Detroit.” Health & Place 16 (5): 1038–1052. https://doi.org/10.1016/j.healthplace.2010.06.012.
- Delclòs-Alió, X., A. Gutiérrez, and C. Miralles-Guasch. 2019. “The Urban Vitality Conditions of Jane Jacobs in Barcelona: Residential and Smartphone-Based Tracking Measurements of the Built Environment in a Mediterranean Metropolis.” Cities 86:220–228. https://doi.org/10.1016/j.cities.2018.09.021.
- Derudder, B., E. Meijers, J. Harrison, M. Hoyler, and X. Liu. 2022. “Polycentric Urban Regions: Conceptualization, Identification and Implications.” Regional Studies 56 (1): Pages 1–6. https://doi.org/10.1080/00343404.2021.1982134. Taylor & Francis.
- Geng, J., R. Long, and H. Chen. 2016. “Impact of Information Intervention on Travel Mode Choice of Urban Residents with Different Goal Frames: A Controlled Trial in Xuzhou, China.” Transportation Research Part A: Policy & Practice 91:134–147. https://doi.org/10.1016/j.tra.2016.06.031.
- Gómez-Varo, I., X. Delclòs-Alió, and C. Miralles-Guasch. 2022. “Jane Jacobs Reloaded: A Contemporary Operationalization of Urban Vitality in a District in Barcelona.” Cities 123:103565. https://doi.org/10.1016/j.cities.2022.103565.
- Güneralp, B., Y. Zhou, D. Ürge-Vorsatz, M. Gupta, S. Yu, P. L. Patel, M. Fragkias, X. Li, and K. C. Seto. 2017. “Global Scenarios of Urban Density and Its Impacts on Building Energy Use Through 2050.” Proceedings of the National Academy of Sciences 114 (34): 8945–8950. https://doi.org/10.1073/pnas.1606035114.
- Hillier, B. 1999. “Centrality as a Process: Accounting for Attraction Inequalities in Deformed Grids.” Urban Design International 4:107–127. https://doi.org/10.1057/udi.1999.19.
- Huai, Y., H. K. Lo, and K. F. Ng. 2021. “Monocentric versus Polycentric Urban Structure: Case Study in Hong Kong.” Transportation Research Part A: Policy & Practice 151:99–118. https://doi.org/10.1016/j.tra.2021.05.004.
- Hu, S., W. Song, C. Li, and J. Lu. 2020. “A Multi-Mode Gaussian-Based Two-Step Floating Catchment Area Method for Measuring Accessibility of Urban Parks.” Cities 105:102815. https://doi.org/10.1016/j.cities.2020.102815.
- Jacobs, J. 1961. The Death and Life of Great American Cities. New York: Vintage Books.
- Jenks, G. F. 1967. “The Data Model Concept in Statistical Mapping.” International Yearbook of Cartography 7 (1): 186–190.
- Kandt, J., and M. Batty. 2021. “Smart Cities, Big Data and Urban Policy: Towards Urban Analytics for the Long Run.” Cities 109:102992. https://doi.org/10.1016/j.cities.2020.102992.
- Kelobonye, K., F. Mao, J. Xia, M. S. H. Swapan, and G. McCarney. 2019. “The Impact of Employment Self-Sufficiency Measures on Commuting Time: Case Study of Perth, Australia.” Sustainability 11:1488. https://doi.org/10.3390/su11051488.
- Khodabandelou, G., V. Gauthier, M. Fiore, and M. A. El-Yacoubi. 2018. “Estimation of Static and Dynamic Urban Populations with Mobile Network Metadata.” IEEE Transactions on Mobile Computing 18 (9): 2034–2047. https://doi.org/10.1109/TMC.2018.2871156.
- Kim, K., M. Ghorbanzadeh, M. W. Horner, and E. E. Ozguven. 2021. “Identifying Areas of Potential Critical Healthcare Shortages: A Case Study of Spatial Accessibility to ICU Beds During the COVID-19 Pandemic in Florida.” Transport Policy 110:478–486. https://doi.org/10.1016/j.tranpol.2021.07.004.
- Lang, W., H. Lang, E. C. M. Hui, T. Chen, J. Wu, and M. Jahre. 2022. “Measuring Urban Vibrancy of Neighborhood Performance Using Social Media Data in Oslo, Norway.” Cities 131:103908. https://doi.org/10.1016/j.cities.2022.103908.
- Lee, K.-S., S. Y. You, J. K. Eom, J. Song, and J. H. Min. 2018. “Urban Spatiotemporal Analysis Using Mobile Phone Data: Case Study of Medium- and Large-Sized Korean Cities.” Habitat International 73:6–15. https://doi.org/10.1016/j.habitatint.2017.12.010.
- Levine, N. 2013. “Hot Spot Analysis of Zones.” CrimeStat: Spatial Statistics Program for the Analysis of Crime Incident Locations. 4th ed. Houston, TX: Ned Levine & Associates.
- Li, S., L. Chen, and P. Zhao. 2019. “The Impact of Metro Services on Housing Prices: A Case Study from Beijing.” Transportation 46 (4): 1291–1317. https://doi.org/10.1007/s11116-017-9834-7.
- Li, Q., C. Cui, F. Liu, Q. Wu, Y. Run, and Z. Han. 2022. “Multidimensional Urban Vitality on Streets: Spatial Patterns and Influence Factor Identification Using Multisource Urban Data.” ISPRS International Journal of Geo-Information 11 (1): 2. https://doi.org/10.3390/ijgi11010002.
- Li, Z., Z. Fan, Y. Song, and Y. Chai. 2021. “Assessing Equity in Park Accessibility Using a Travel Behavior-Based G2SFCA Method in Nanjing, China.” Journal of Transport Geography 96:103179. https://doi.org/10.1016/j.jtrangeo.2021.103179.
- Liu, X., Y. Ming, Y. Liu, W. Yue, and G. Han. 2022. “Influences of Landform and Urban Form Factors on Urban Heat Island: Comparative Case Study Between Chengdu and Chongqing.” The Science of the Total Environment 820:153395. https://doi.org/10.1016/j.scitotenv.2022.153395.
- Li, S., Y. Wang, J. Xue, N. Zhao, and T. Zhu. 2020. “The Impact of COVID-19 Epidemic Declaration on Psychological Consequences: A Study on Active Weibo Users.” International Journal of Environmental Research and Public Health 17 (6): 2032. https://doi.org/10.3390/ijerph17062032.
- Li, B., B. Zhang, L. Yin, and J. Chang. 2023. “Assessing Heat Risk for Residents of Complex Urban Areas from an Accessibility-Based Perspective.” Sustainable Cities and Society 88:104278. https://doi.org/10.1016/j.scs.2022.104278.
- Li, X., Y. Zhou, J. Eom, S. Yu, and G. R. Asrar. 2019. “Projecting Global Urban Area Growth Through 2100 Based on Historical Time Series Data and Future Shared Socioeconomic Pathways.” Earth’s Future 7:351–362. https://doi.org/10.1029/2019EF001152.
- Luo, W., and F. Wang. 2003. “Measures of Spatial Accessibility to Health Care in a GIS Environment: Synthesis and a Case Study in the Chicago Region.” Environment and Planning B: Planning and Design 30 (6): 865–884. https://doi.org/10.1068/b29120.
- Lynch, K. 1984. Good City Form. Cambridge, MA: MIT press.
- Martí, P., L. Serrano-Estrada, and A. Nolasco-Cirugeda. 2019. “Social Media Data: Challenges, Opportunities and Limitations in Urban Studies.” Computers, Environment and Urban Systems 74:161–174. https://doi.org/10.1016/j.compenvurbsys.2018.11.001.
- Morris, J. M., P. L. Dumble, and M. R. Wigan. 1979. “Accessibility Indicators for Transport Planning.” Transportation Research Part A: General 13 (2): 91–109. https://doi.org/10.1016/0191-2607(79)90012-8.
- Moseley, M. J. 1979. Accessibility: The Rural Challenge. London, UK: Metheuen.
- Mulíček, O., R. Osman, and D. Seidenglanz. 2015. “Urban Rhythms: A Chronotopic Approach to Urban Timespace.” Time & Society 24 (3): 304–325. https://doi.org/10.1177/0961463X14535905.
- Niu, F., and W. Liu. 2017. “Modeling Urban Housing Price: The Perspective of Household Activity Demand.” Journal of Geographical Sciences 27 (5): 619–630. https://doi.org/10.1007/s11442-017-1396-2.
- Ouyang, J., H. Fan, L. Wang, D. Zhu, and M. Yang. 2022. “Revealing Urban Vibrancy Stability Based on Human Activity Time-Series.” Sustainable Cities and Society 85:104053. https://doi.org/10.1016/j.scs.2022.104053.
- Parker, D. E. 2010. “Urban Heat Island Effects on Estimates of Observed Climate Change.” Wiley Interdisciplinary Reviews: Climate Change 1 (1): 123–133. https://doi.org/10.1002/wcc.21.
- Raman, S. 2010. “Designing a Liveable Compact City: Physical Forms of City and Social Life in Urban Neighbourhoods.” Built Environment 36 (1): 63–80. https://doi.org/10.2148/benv.36.1.63.
- Ravenscroft, N. 2000. “The Vitality and Viability of Town Centres.” Urban Studies 37 (13): 2533–2549. https://doi.org/10.1080/00420980020080681.
- Sagris, V., and M. Sepp. 2017. “Landsat-8 TIRS Data for Assessing Urban Heat Island Effect and Its Impact on Human Health.” IEEE Geoscience and Remote Sensing Letters 14 (12): 2385–2389. https://doi.org/10.1109/LGRS.2017.2765703.
- Salze, P., A. Banos, J.-M. Oppert, H. Charreire, R. Casey, C. Simon, B. Chaix, D. Badariotti, and C. Weber. 2011. “Estimating Spatial Accessibility to Facilities on the Regional Scale: An Extended Commuting-Based Interaction Potential Model.” International Journal of Health Geographics 10 (1): 1–16. https://doi.org/10.1186/1476-072X-10-2.
- Sevtsuk, A., and R. Kalvo. 2018. “Patronage of Urban Commercial Clusters: A Network-Based Extension of the Huff Model for Balancing Location and Size.” Environment and Planning B: Urban Analytics and City Science 45 (3): 508–528. https://doi.org/10.1177/2399808317721930.
- Shaw, S.-L., M.-H. Tsou, and X. Ye. 2016. “Editorial: Human Dynamics in the Mobile and Big Data Era.” International Journal of Geographical Information Science 30 (9): 1687–1693. https://doi.org/10.1080/13658816.2016.1164317.
- Songchitruksa, P., and X. Zeng. 2010. “Getis–Ord Spatial Statistics to Identify Hot Spots by Using Incident Management Data.” Transportation Research Record 2165 (1): 42–51. https://doi.org/10.3141/2165-05.
- Song, G., X. He, Y. Kong, K. Li, H. Song, S. Zhai, and J. Luo. 2022. “Improving the Spatial Accessibility of Community-Level Healthcare Service Toward the ‘15-Minute City’goal in China.” ISPRS International Journal of Geo-Information 11 (8): 436. https://doi.org/10.3390/ijgi11080436.
- Spencer, J., and G. Angeles. 2007. “Kernel Density Estimation as a Technique for Assessing Availability of Health Services in Nicaragua.” Health Services and Outcomes Research Methodology 7 (3–4): 145–157. https://doi.org/10.1007/s10742-007-0022-7.
- Sung, H., and S. Lee. 2015. “Residential Built Environment and Walking Activity: Empirical Evidence of Jane Jacobs’ Urban Vitality.” Transportation Research, Part D: Transport & Environment 41:318–329. https://doi.org/10.1016/j.trd.2015.09.009.
- Teng, H.-J., C.-O. Chang, and M.-C. Chen. 2017. “Housing Bubble Contagion from City Centre to Suburbs.” Urban Studies 54 (6): 1463–1481. https://doi.org/10.1177/0042098016631297.
- Tu, W., T. Zhu, J. Xia, Y. Zhou, Y. Lai, J. Jiang, and Q. Li. 2020. “Portraying the Spatial Dynamics of Urban Vibrancy Using Multisource Urban Big Data.” Computers, Environment and Urban Systems 80:101428. https://doi.org/10.1016/j.compenvurbsys.2019.101428.
- Tu, W., T. Zhu, C. Zhong, X. Zhang, Y. Xu, and Q. Li. 2022. “Exploring Metro Vibrancy and Its Relationship with Built Environment: A Cross-City Comparison Using Multi-Source Urban Data.” Geo-Spatial Information Science 25 (2): 182–196. https://doi.org/10.1080/10095020.2021.1996212.
- Wang, R., Q. He, L. Zhang, and H. Wang. 2021. “Coupling Cellular Automata and a Genetic Algorithm to Generate a Vibrant Urban Form—A Case Study of Wuhan, China.” International Journal of Environmental Research and Public Health 18 (21): 11013. https://doi.org/10.3390/ijerph182111013.
- Wang, X., Y. Zhang, D. Yu, J. Qi, and S. Li. 2022. “Investigating the Spatiotemporal Pattern of Urban Vibrancy and Its Determinants: Spatial Big Data Analyses in Beijing, China.” Land Use Policy 119:106162. https://doi.org/10.1016/j.landusepol.2022.106162.
- Wen, H., Z. Gui, C. Tian, Y. Xiao, and L. Fang. 2018. “Subway Opening, Traffic Accessibility, and Housing Prices: A Quantile Hedonic Analysis in Hangzhou, China.” Sustainability 10 (7): 2254. https://doi.org/10.3390/su10072254.
- Wu, C., M. Zhao, and Y. Ye. 2023. “Measuring Urban Nighttime Vitality and Its Relationship with Urban Spatial Structure: A Data-Driven Approach.” Environment and Planning B: Urban Analytics and City Science 50 (1): 130–145. https://doi.org/10.1177/23998083221108191.
- Xiao, Y., E. C. Hui, and H. Wen. 2020. “The Housing Market Impacts of Human Activities in Public Spaces: The Case of the Square Dancing.” Urban Forestry & Urban Greening 54:126769. https://doi.org/10.1016/j.ufug.2020.126769.
- Xiao, L., S. Lo, J. Liu, J. Zhou, and Q. Li. 2021. “Nonlinear and Synergistic Effects of TOD on Urban Vibrancy: Applying Local Explanations for Gradient Boosting Decision Tree.” Sustainable Cities and Society 72:103063. https://doi.org/10.1016/j.scs.2021.103063.
- Yang, L., S. Zhang, M. Guan, J. Cao, and B. Zhang. 2022. “An Assessment of the Accessibility of Multiple Public Service Facilities and Its Correlation with Housing Prices Using an Improved 2SFCA Method—A Case Study of Jinan City, China.” ISPRS International Journal of Geo-Information 11:414. https://doi.org/10.3390/ijgi11070414.
- Yuan, N. J., Y. Zheng, and X. Xie. 2012. Segmentation of Urban Areas Using Road Networks, MSR-TR-2012-65. Albuquerque, NM: Microsoft.
- Zhang, E., Y. Ye, J. Hou, and Y. Long 2021. “Revealing the Spatial Preferences Embedded in Online Activities: A Case Study of Chengdu, China.” In Urban Informatics and Future Cities, S. C. M. Geertman, C. Pettit, R. Goodspeed, and A. Staffans eds., 173–188. Cham, Switzerland: Springer International Publishing. https://doi.org/10.1007/978-3-030-76059-5_10.
- Zhang, S., F. Zhen, Y. Kong, T. Lobsang, and S. Zou. 2022. “Towards a 15-Minute City: A Network-Based Evaluation Framework.” Environment and Planning B: Urban Analytics and City Science 50 (2): 500–514. https://doi.org/10.1177/23998083221118570.
- Zhang, L., J. Zhou, and E. C.-M. Hui. 2020. “Which Types of Shopping Malls Affect Housing Prices? From the Perspective of Spatial Accessibility.” Habitat International 96:102118. https://doi.org/10.1016/j.habitatint.2020.102118.
- Zhang, H., X. Zhou, G. Tang, L. Zhou, and X. Ye. 2020. “Hotspot Discovery and Its Spatial Pattern Analysis for Catering Service in Cities Based on Field Model in GIS.” Geographical Research 39 (2): 354–369. https://doi.org/10.11821/dlyj020181104.
- Zhong, J., Z. Li, Z. Sun, Y. Tian, and F. Yang. 2020. “The Spatial Equilibrium Analysis of Urban Green Space and Human Activity in Chengdu, China.” Journal of Cleaner Production 259:120754. https://doi.org/10.1016/j.jclepro.2020.120754.
- Zhu, J., H. Lu, T. Zheng, Y. Rong, C. Wang, W. Zhang, Y. Yan, and L. Tang. 2020. “Vitality of Urban Parks and Its Influencing Factors from the Perspective of Recreational Service Supply, Demand, and Spatial Links.” International Journal of Environmental Research and Public Health 17 (5): 1615. https://doi.org/10.3390/ijerph17051615.