
 ?Mathematical formulae have been encoded as MathML and are displayed in this HTML version using MathJax in order to improve their display. Uncheck the box to turn MathJax off. This feature requires Javascript. Click on a formula to zoom.
ABSTRACT
Timely and accurate monitoring of the spatial distribution of wheat is crucial for wheat field management, growth monitoring, yield estimation and prediction. In this study, a multitemporal index, termed the winter wheat mapping index (WWMI), was constructed for automatic winter wheat mapping on the basis of Sentinel-2 enhanced vegetation index (EVI) time series and wheat phenological features. Henan, an important winter wheat production province in China, was selected as the study area. Zhumadian, the primary wheat-growing city in Henan, was the test area. Both empirical and automatic threshold (Otsu) methods were adopted to calculate the optimal threshold of the WWMI. The performance of WWMI in winter wheat mapping was compared at object-oriented and pixel-based levels. The proposed WWMI separated winter wheat and nonwinter wheat areas well, thus achieving highly accurate winter wheat mapping. In Zhumadian, the empirical threshold method performed better than the Otsu method, but the former relied on official statistics to iteratively adjust the WWMI threshold. In Henan, the mapping accuracy achieved by the Otsu method was higher than that achieved by the empirical threshold method, with mean relative errors (MREs) of 6.78% and 19.87% at the municipal and county levels, respectively. This was because, compared with the empirical threshold method, the Otsu method did not rely on official statistics and adaptively determined the optimal threshold of the WWMI for each city in Henan, thus fully considering wheat growth state differences in different cities. In addition, the object-oriented WWMI performed better than the pixel-based WWMI in wheat mapping. The results further demonstrated the feasibility of combining the WWMI with the Otsu method for automatic winter wheat mapping at large extents, which will provide a theoretical basis for identifying other food crops.
1. Introduction
Timely and accurate acquisition of the spatial distribution of winter wheat provides a basis for wheat growth status monitoring, agricultural production management, and yield estimation and prediction (Z. Li, Ding, and Xie Citation2022, Citation2022; H.; Zhang et al. Citation2021; S.; Ren et al. Citation2021). Satellite imagery has been widely used in crop type mapping at regional scales, with wide coverage and real-time dynamic monitoring advantages (Martinez et al. Citation2021; Gella, Bijker, and Belgiu Citation2021; L.; Han et al. Citation2022). Several machine learning methods, such as the random forest (RF), support vector machine (SVM), and convolutional neural network (CNN) algorithms, have been combined with satellite imagery for wheat mapping (Brown et al. Citation2013; Lambert et al. Citation2018; Ren et al. Citation2021; M.; Zhang et al. Citation2018). Tianle et al. (Citation2019) identified the winter wheat-growing areas in the Huanghuaihai Region of China by combining multitemporal MODIS images with RF and attention-based long short-term memory network (LSTM) methods. Their results showed that the identification accuracy achieved by the RF algorithm was slightly higher than that achieved by the attention-based LSTM algorithm, whereas the computation time of the RF method was much greater than that of the attention-based LSTM method. Zhong et al. (Citation2019) combined a deep learning approach with MODIS data to generate a winter wheat map by using official statistical data for the training of the classifier. The results showed that the proposed approach was automated and robust in processing the variability of winter wheat phenology without relying on intensive ground data, and a highly accurate wheat spatial distribution was obtained. G. Yang et al. (Citation2021) integrated the automatic generation of training samples and an SVM algorithm to identify winter wheat cultivation areas based on Sentinel-2 imagery in Jiangsu Province, China, and achieved an overall accuracy (OA) of 92.61%. Huang et al. (Citation2022) proposed a framework for winter wheat mapping using multitemporal Sentinel-2 images in Henan Province, China, and their results indicated that winter wheat-growing areas were extracted in the early overwintering stage with an OA of 91%. However, the accuracies of these supervised classifications are influenced by the availability of training samples, which can be time consuming and labor intensive to obtain (Davoud et al. Citation2019; Huang et al. Citation2022; Zhang and Roy Citation2017).
Compared with supervised classification, the index-based wheat mapping method reduces the dependence on training samples, is simple and efficient and is thus suitable for winter wheat identification at large extents where training samples are scarce (Ludwig et al. Citation2019). Tao et al. (Citation2017) applied the phenological feature of the peak before winter to extract the winter wheat-growing areas in the North China Plain based on the multitemporal MODIS enhanced vegetation index (EVI), which had the ability to map wheat at an earlier stage. Qiu et al. (Citation2017) developed two phenology-based indicators to extract the winter wheat-growing areas at a regional scale, which exploited the MODIS EVI2 changes between the estimated heading and seedling/maturity stages and the change amplitudes, and it achieved an OA of 92.19% when evaluated with field survey data. Chang et al. (Citation2021) proposed a winter wheat index (WWI) based on the Landsat-derived normalized difference vegetation index (NDVI) at the main phenological periods of winter wheat and identified the wheat-growing areas at three test areas in North China using the WWI. In this study, an empirical threshold method was used to obtain the optimal threshold of the WWI.
The phenological periods of winter wheat are generally delayed with increasing latitude, which will result in slight differences in wheat growth conditions to large extents (Chang, Peijun, and Zhang Citation2021). Moreover, the quality of satellite images varies in different areas due to the effect of weather factors. All of these factors will result in different optimal thresholds of the wheat mapping index over large extents. However, determination of the optimal threshold still relies on sample data or official statistics when using the empirical threshold method, which limits the application of the index-based mapping method in large-scale winter wheat identification. The automated ability to determine the optimal threshold of the wheat mapping index needs to be further improved (Bangira et al. Citation2019; Choi and Bindschadler Citation2004; Feyisa et al. Citation2014). Compared with the empirical threshold method, the automatic threshold method adaptively determines the optimal threshold according to the numerical distribution of the wheat mapping index (Martinis, Twele, and Voigt Citation2009). As an automatic threshold method, the maximum interclass variance method (also known as the Otsu method) is a nonparametric, unsupervised and adaptive threshold determination method for image segmentation that has already been applied to determine the thresholds of water (Han and Niu Citation2020; L.; Linrong et al. Citation2021) and building indices (Bouhennache et al. Citation2019). In addition, Yin et al. (Citation2013) adopted the maximum-entropy threshold method to automatically determine the threshold of the normalized snow index for snow cover mapping based on Landsat TM images. However, few studies have applied automatic threshold methods to determine the threshold of an index in large-scale winter wheat identification.
In recent years, multitemporal remotely sensed images with different spatial resolutions have been applied for winter wheat identification (Konduri et al. Citation2020; Sun et al. Citation2012; Tian et al. Citation2020; Y; Yang et al. Citation2019). For moderate- and low-spatial-resolution satellite data, such as MODIS and Landsat data, errors in winter wheat mapping are unavoidable due to the influence of mixed pixels. To solve this issue, Dong et al. (Citation2020) proposed a phenology-based method using MODIS imagery to estimate the subpixel growing fraction of winter wheat. The Sentinel-2A/B satellites of the European Copernicus project provide observations with a temporal resolution of less than 5 days and a spatial resolution of 10 ~ 60 m, which provide data support for the identification of winter wheat cultivation areas (You and Dong Citation2020). Some studies have shown that Sentinel-2 images are more suitable for identifying crop planting areas and estimating crop yields over a large scale than MODIS and Landsat data (Xun et al. Citation2021; N.; Wang, Zhai, and Zhang Citation2021; X.; Huang et al. Citation2022). In particular, Sentinel-2 imagery time series can reflect the spectral characteristics of winter wheat at various growth periods, which is an effective way to determine the spatial distribution of winter wheat. Despite the advantages of Sentinel-2 image time series, the acquisition of the wheat distribution still poses challenges, such as extensive downloading and preprocessing workloads, high computational complexity, and large storage requirements. The development of cloud computing platforms, such as the Google Earth Engine (GEE), has supported the processing of massive volumes of satellite images and aided in effectively solving some of the corresponding problems (Ghorbanian et al. Citation2020; Oliphant et al. Citation2019; Qiu et al. Citation2021).
The abovementioned studies involve pixel-based winter wheat mapping. With improvements in the spatial resolution of remote sensing imagery, the intraclass heterogeneity of land objects has gradually increased, and the influence of salt-and-pepper image noise has also increased. In the pixel-based crop classification method, each pixel is individually assigned to a designated class, and the classification result usually contains salt-and-pepper noise (Lei et al. Citation2020). An alternative approach, the object-oriented method, which merges pixels into objects and then classifies them, has been used for crop classification (Luo et al. Citation2020; Qiu et al. Citation2017; Y; Tengfei Citation2017; Wang et al. Citation2022). The object-oriented method reduces the internal spectral variation of objects by averaging values over numerous pixels, and it usually outperforms pixel-based approaches in crop mapping (Bahram, Daneshfar, and Davidson Citation2017; Jiao et al. Citation2014). Belgiu and Csillik (Citation2018) used multitemporal Sentinel-2 data and the time-weighted dynamic time warping (TWDTW) method to classify crop types, and the results showed that the object-based TWDTW method outperformed the pixel-based TWDTW method for different crop classifications. Jiao et al. (Citation2014) used polarimetric synthetic aperture radar (PolSAR) data for the classification of various crop types, and their results indicated that object-oriented classifications could be used to accurately identify crop types by reducing the noise contained in synthetic aperture radar (SAR) data. At present, few studies have combined the object-oriented method with a wheat mapping index to obtain the spatial distribution of winter wheat at large extents.
In this research, a multitemporal index called the winter wheat mapping index (WWMI) was developed to identify the winter wheat planting area in Henan Province, China, based on multitemporal Sentinel-2 images and the GEE platform. The main objectives were (1) to construct an index (WWMI) for automatic winter wheat mapping. (2) to assess and compare the performance of the pixel-based and object-oriented WWMIs in winter wheat identification, and (3) to evaluate the performance of the empirical threshold and automatic threshold methods in determining the optimal threshold of the WWMI.
2. Materials and methods
2.1. Study area
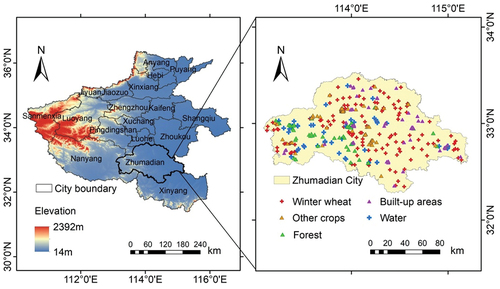
Henan Province, located in Central China and spanning a total area of 54,250 km2 (Xie and Huang Citation2021), was chosen as the study area (110.35° E-116.64° E, 31.38° N-36.37° N) (). In 2020, Henan Province ranked first in winter wheat sown area (5.67 × 10⁴ km2) and winter wheat yield (3.75 × 10⁷ tons) among all provinces in China (http://www.stats.gov.cn/sj/ndsj/2021/indexch.htm). In this province, winter wheat is usually sown in October and harvested at the end of May. Summer corn is usually sown in mid-June and harvested in October. Accordingly, winter wheat and summer corn rotation is the prevailing cropping pattern in the province. In this study, the city of Zhumadian (113.17° E-115.20° E, 32.30° N-33.58° N), which has the largest winter wheat-growing area in Henan Province, was chosen to develop the WWMI. Henan Province was used to evaluate the applicability of the developed WWMI in winter wheat mapping to large extents.
Figure 1. The study area and locations of the 334 samples in the city of Zhumadian.
2.2. Data description and preprocessing
2.2.1. Sentinel-2 imagery and preprocessing
In this study, Sentinel-2A/B Multi-Spectral Instrument (MSI) Level-2A (SR) images were applied to generate the EVI time series in Henan Province. All available Sentinel-2 images in the study area from 1 November 2019,to 30 June 2020, were collected with less than 20% cloud coverage on the GEE platform. The day of year (DOY) and the corresponding number of acquired Sentinel-2 images are shown in . The total number of Sentinel-2 images during the winter wheat-growing seasons of 2019 and 2020 was 941. First, the QA60 band, which is a bitmask band with cloud mask information, was used to remove pixels polluted by clouds. This band contains both opaque clouds and cirrus clouds with an indicator specifying the cloud type (cirrus or opaque cloud) in which Bit 10 and Bit 11 represent opaque clouds and cirrus clouds, respectively. Then, the blue, red and near-infrared reflectance with 10 m spatial resolutions from each Sentinel-2 image were used to calculate the EVI.
Table 1. The DOY and the corresponding number of acquired Sentinel-2 images from November 2019 to June 2020 in Henan Province.
where ,
and
represent the surface reflectances of the near-infrared, red and blue bands of the Sentinel-2 image, respectively.
To achieve full coverage for the study area, more than one satellite track of Sentinel-2 imagery was involved; thus, more Sentinel-2 EVI values were obtained in the overlapping regions of satellite orbits. In addition, the cloud mask of the Sentinel-2 imagery also caused an inconsistency in the interval of the EVI time series for each pixel. To ensure the consistency of the EVI interval for each pixel, the composited EVI for each month, from November 2019 to June 2020, was the median value of all Sentinel-2 EVI values in that month. Finally, composited EVI images with eight bands covering the study area were generated, which contained the composited EVI for November (T1), December (T2), January (T3), February (T4), March (T5), April (T6), May (T7) and June (T8).
2.2.2. Acquisition of sample data
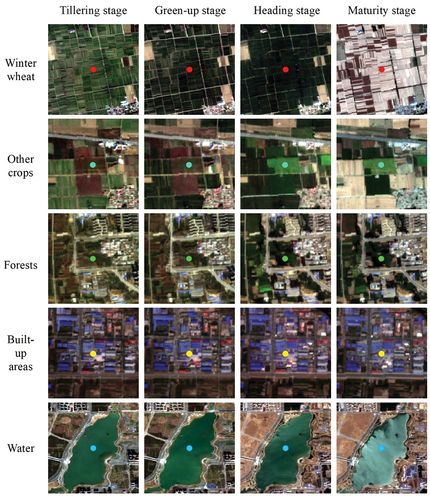
Previous studies have verified the reliability of very high spatial resolution (VHR) image interpretation for sample collection (Zhong et al. Citation2019). In this study, 35 winter wheat samples provided by the Henan Meteorological Service were evenly distributed throughout Henan Province. Additionally, other samples were randomly selected based on the Google Earth VHR image interpretation and the variation characteristics of Sentinel-2 EVI curves. First, the geographic coordinates of the samples of winter wheat, other crops, forests, built-up areas and water were collected from the VHR images. Then, the collected samples were located on the Sentinel-2 images based on the geographic coordinates (), and the phenological features derived from the time series of Sentinel-2 EVI for the samples were analyzed to further confirm the land class. Finally, a total of 334 samples in Zhumadian were obtained for the development of the WWMI, including 124 winter wheat samples, 72 other crop samples, 50 forest samples, 52 built-up area samples and 46 water samples.
Figure 2. Examples of the collected samples with true color composites of Sentinel-2 images for (a) winter wheat, (b) other crops, (c) forests, (d) built-up areas and (e) water at different growth stages of winter wheat.
2.2.3. Acquisition of official statistics
In this study, the official statistics of winter wheat cultivation areas at both the municipal and county levels in 2019 and 2020 were collected from the Henan Statistical Yearbook (https://tjj.henan.gov.cn/tjfw/tjcbw/tjnj/) using the sample survey method. Specifically, spatial sampling technology was adopted to select survey samples, which were combined with remote sensing images to obtain winter wheat cultivation areas. At the national level, nearly 10,000 villages were selected as samples across the country, and then three sample plots with an area of approximately 60 acres were extracted from each sample village. During the survey period, the statistician and support staff from various grassroots survey teams of the National Bureau of Statistics conducted a sampling survey on the planting area of all natural plots within the sample plot. Then, the provincial planting areas of winter wheat were calculated by the provincial survey team based on the basic survey data. According to the error control principle of large-scale national sampling surveys, the error of official statistical data was less than 5%, reaching approximately 3%. The Henan Statistical Yearbook was provided by the Henan Province Bureau of Statistics, and the official statistics of winter wheat areas were released after approval by the National Bureau of Statistics. The official sown area statistics were compared with the wheat identification results to evaluate the accuracy of the constructed WWMI.
2.3. Methods
2.3.1. Development of the WWMI
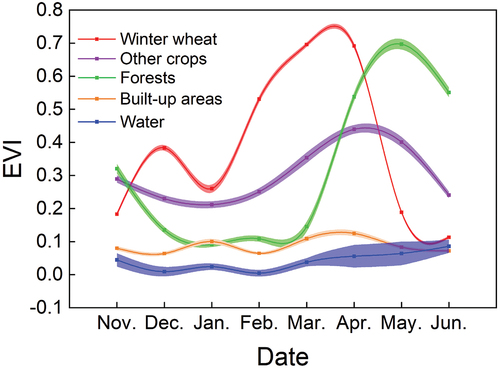
The average curves of the EVI time series for the samples of winter wheat, other crops, forests, built-up areas and water in Zhumadian are shown in . The results indicated that there were obvious phenological variabilities reflected in the EVI time series for winter wheat, other crops, and forests. Specifically, the EVI curve of winter wheat showed a bimodal pattern that greatly changed during the growth period and was obviously different from those of other areas. From late November to early December, winter wheat was in the tillering stage and began to grow gradually, so the EVI value rose steadily and reached the subpeak value. During this period, forests and other crops had lower EVI values than winter wheat. Then, winter wheat stopped growing at the overwintering stage. From late December to mid-February of the following year, the temperature gradually decreased. Previously grown leaves partially or completely withered. The withering and death of leaves during the overwintering period disrupted the normal growth of winter wheat, which led to a decrease in biomass and EVI values. In early March of the following year, as the temperature gradually rose, winter wheat entered the green-up stage. Then, wheat seedlings began to grow, and the EVI rapidly increased. At the heading stage of wheat in late April, the EVI reached the maximum value of the growth period, which was much higher than the EVI values of the forests and other crops. The winter wheat reached maturity from late May to early June, and the EVI rapidly decreased to the lowest value, while the EVI values for forests and other crops remained at high levels. The EVI values of the built-up areas and water were generally low, with values of less than 0.15, which was due to the low reflectance difference between the near-infrared and red bands. With the abovementioned phenological features, the month-composited EVI values for winter wheat were higher in December, March, and April and lower in November, January and May.
Figure 3. Time series EVI and standard error bars for winter wheat, other crops, forests, built-up areas, and water.
Two indicators corresponding to the early and late growth periods of winter wheat were calculated using the variations in the EVI curve (). The first indicator, representing the EVI variations during the early growth period of wheat, was calculated as the sum of the EVI difference between November and December () and that between December and January (
). The second indicator, representing the EVI variations during the late growth period of wheat, was calculated as the sum of the EVI difference between January and March
and that between April and May (
). To further amplify the EVI differences, the two indicators were summed to constitute the WWMI and separate winter wheat from other land cover types as follows:
where (i = 1, 2,…, 7) represents the composite period from November 2019 to June 2020.
The independent t test was employed to examine the statistical significance of the differences between the mean values of the phenological features for winter wheat and nonwinter wheat. As shown in , the significance (2-tailed) values were equal to zero, indicating that the differences between the mean values of winter wheat and nonwinter wheat were significant.
Table 2. Independent t test between winter wheat and nonwinter wheat in terms of the mean values of the phenological features using 50 samples for each class.
2.3.2. Determination of the WWMI threshold
A WWMI threshold needed to be set to separate the winter wheat and nonwinter wheat samples. Determination of the optimal threshold of the WWMI is crucial for winter wheat identification. In this research, the empirical threshold method was used to calculate the optimal threshold of the WWMI in Zhumadian. Specifically, the error between the official statistics of winter wheat cultivation areas and the WWMI-derived wheat areas was gradually reduced by iteratively adjusting the threshold of the WWMI. The optimal threshold was determined as the value at which the error was minimal. Moreover, two automatic threshold methods, including the Otsu and Kapur methods, were also adopted to determine the WWMI threshold (Bouhennache et al. Citation2019; Yin et al. Citation2013).
The Otsu method is a nonparametric, unsupervised and adaptive threshold determination method. Variances are used to determine the optimal threshold for the segmentation of two classes. The optimal threshold is obtained when the variance between each segmented region is the highest or the variance within each region is the lowest. The Otsu method was used to calculate the optimal threshold of the WWMI as follows:
The WWMI values within the study area were sorted in ascending order and divided into intervals (
). The probability of WWMI values in each interval was calculated as follows:
where represents the probability that the WWMI value is located in the
th interval,
represents the number of pixels whose WWMI value is located in the
th interval, and
represents the number of all pixels,
. Based on the WWMI, any threshold (t) was used to distinguish the study area into nonwinter wheat and winter wheat areas. The proportions of both were calculated as follows:
where and
represent the proportion of the nonwinter wheat and winter wheat areas, respectively.
.
where and
represent the mean WWMI of the nonwinter wheat and winter wheat areas, respectively.
represents the mean WWMI of the
th interval. The interclass variance (
) of the nonwinter wheat and winter wheat areas was calculated as follows:
where represents the mean WWMI of the study area,
. The larger interclass variance of WWMI values indicates a larger difference between the nonwinter wheat and winter wheat regions, thus implying a minimization of the probability of misclassification. According to the interclass maximization criterion, the optimal threshold is obtained when the maximum
value is obtained, denoted as
:
In addition to the Otsu method, the Kapur method was adopted to automatically determine the threshold of the WWMI, which was based on information entropy using the gray distribution density function of WWMI images (Xun et al. Citation2021). The greater the sum of the entropy of two categories segmented by a certain threshold is, the greater the uncertainty and the easier it is to distinguish the target region from the nontarget region. Specifically, the information entropy of nonwinter wheat () and winter wheat (
) areas was calculated as follows:
When the sum of entropy reaches the maximum value, the corresponding threshold is the optimal threshold.
2.3.3. Identification of winter wheat cultivation area
To assess the applicability of the WWMI at both the pixel and object scales, the pixel-based method was combined with the WWMI to identify the winter wheat cultivation area, the accuracy of which was compared with that of the object-oriented method. For the pixel-based method, a pixel was identified as winter wheat if the WWMI was higher than the optimal threshold; otherwise, it was identified as nonwinter wheat. The success of the object-oriented method relies on the quality of image segmentation. In this study, edge-based segmentation was applied to delineate objects in the Sentinel-2 RGB image, which was acquired on 12 April 2020, using ENVI software, and the scale level was set to 40. The merge algorithm was set to the full lambda schedule algorithm, and the merge level was set to 90. The texture kernel size was set to 5. The WWMI value of each object was denoted as the mean WWMI value of all the pixels it contained, which was then compared with the optimal threshold to identify the winter wheat objects.
The wheat areas derived from the WWMI were evaluated using the official statistics of wheat areas at both the municipal and county levels. The determination coefficient (R2), mean relative error (MRE) and root mean square error (RMSE) between the official statistics and the WWMI-derived wheat areas were calculated to evaluate the wheat mapping accuracies of the WWMI. In addition to the official statistics, the accuracy of the winter wheat mapping results was also evaluated by comparison with the verification samples using the OA, user accuracy (UA), producer accuracy (PA) and F1-score.
3. Results
3.1. Comparison of the thresholding method
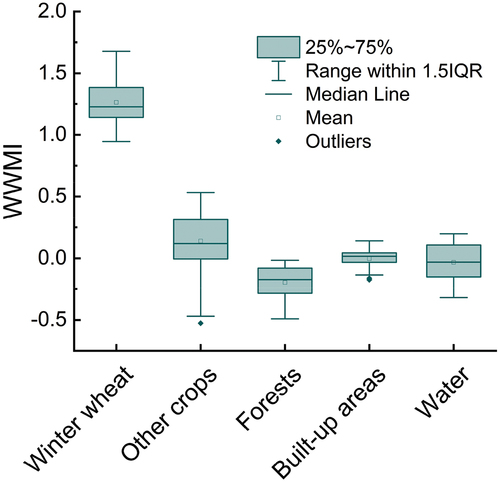
shows the box plots of the WWMI values for the samples of winter wheat, other crops, forests, built-up areas and water. The WWMI for winter wheat was obviously higher than those of the others. The mean values of the WWMI for winter wheat, other crops, forests, built-up areas, and water were 1.26, 0.14, −0.09, 0 and −0.04, respectively. These results indicated good separability between the winter wheat and nonwinter wheat samples. These results also demonstrated that the WWMI could distinguish between not only winter wheat and nonwinter wheat crops but also between winter wheat and noncrop land cover types.
Figure 4. Box plots of the WWMI of winter wheat, other crops, forests, built-up areas and water samples in Zhumadian.
The WWMI image in Zhumadian is shown in . The optimal threshold of the WWMI determined by the empirical threshold method was 0.53. With this threshold, winter wheat cultivation areas were identified with the pixel-based method, as shown in . There were clear boundaries between the wheat and nonwheat areas. The wheat cultivated area derived from the map (shown in was 8199.80 km2, which was 4.17% higher than the official statistics of Zhumadian (7871.50 km2); thus, the empirical threshold method exhibited good performance. The thresholds of the WWMI determined by the Otsu and Kapur methods were 0.56 and 0.64, respectively. With these thresholds, the WWMI-derived wheat areas were 7321.04 km2 and 6887.59 km2, which were 6.99% and 12.50% lower, respectively, than the official statistics. Thus, the empirical threshold method had the best performance for winter wheat mapping in Zhumadian, followed by the Otsu method, and the Kapur method performed the worst. In addition, compared with the Kapur method, the threshold determined by the Otsu method was closer to that determined by the empirical threshold, and the accuracy of the latter was higher than that of the former.
Figure 5. The (a) WWMI and (b) winter wheat map generated by the pixel-based WWMI in Zhumadian.
The accuracies of the WWMI-derived wheat maps using the empirical threshold, Otsu and Kapur methods were further validated by the official statistics at the county level. As shown in , for the empirical threshold method, the linear correlation between the official sown area statistics and the WWMI-derived wheat areas reached a significant level (R2 = 0.77, P < 0.001). The MRE between the official statistics and the WWMI-derived wheat areas was 14.73%, indicating a high accuracy in winter wheat mapping. The MREs and RMSEs between the official statistics and the WWMI-derived wheat areas using the Otsu (MRE = 15.73%, RMSE = 175.28 km2) and Kapur (MRE = 15.99%, RMSE = 194.29 km2) methods were lower than those of the empirical threshold method. In addition, the accuracy of the Otsu method was higher than that of the Kapur method. Although the empirical threshold method achieved a high accuracy, it relied on official statistics to constantly adjust the threshold of the WWMI, which was time-consuming and laborious. The two automatic threshold methods, Otsu and Kapur, automatically calculated the threshold based on only the WWMI image and thus had higher efficiencies. In particular, the accuracy of the Otsu method was close to that of the empirical threshold method, overcame the dependence on official statistics or samples and more effectively performed large-scale wheat mapping.
Figure 6. County-level comparisons between the official statistical data and the WWMI-derived winter wheat areas by the (a-b) empirical threshold, (c) Otsu, and (d) Kapur methods in Zhumadian. (a), (c) and (d) show the pixel-based results, and (b) shows the object-oriented results.
3.2. Comparison of the pixel-based and object-oriented methods
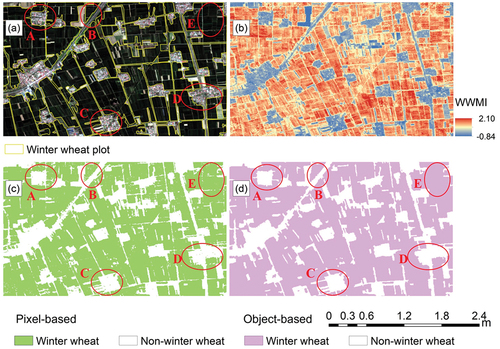
To evaluate the accuracy of the proposed WWMI at the object scale, the object-oriented method was combined with the WWMI and the optimal threshold to identify the winter wheat objects in Zhumadian. As shown in , there was a significant linear correlation between the officially sown area and the object-oriented wheat areas, with an R2 of 0.84 (P < 0.001). The MRE and RMSE were 12.63% and 119.86 km2, respectively, which were lower than those achieved by the pixel-based WWMI (). This demonstrated the advantage of the object-oriented WWMI over the pixel-based WWMI in the identification of wheat cultivated areas. To further compare the performances achieved by the pixel-based and object-oriented WWMI, a subset of the winter wheat map was analyzed (). The winter wheat-growing areas are highlighted with higher WWMI values, while others have lower WWMI values. As shown in and (d), both the pixel-based and object-oriented methods accurately identified the winter wheat cultivated parcels. The mapping result achieved by the pixel-based WWMI showed noticeable salt-and-pepper noise, while the object-oriented WWMI effectively retained patch information, as shown at sites A, B, C and D. However, some narrow field footpaths were not effectively identified from the object-oriented mapping results, whereas they were identified in the pixel-based mapping results, as shown at site E. Thus, the pixel-based and object-oriented mapping results had their own advantages and disadvantages.
Figure 7. Subsets of the (a) true color composite of the Sentinel-2 image acquired on 12 April 2020, and (b) WWMI image and winter wheat map achieved by the (c) pixel-based WWMI and (d) object-oriented WWMI in 2020. Sites A, B, C and D show salt-and-pepper noise in (c), and site E shows unidentified field footpaths in (d).
3.3. Implementation of the WWMI in Henan Province
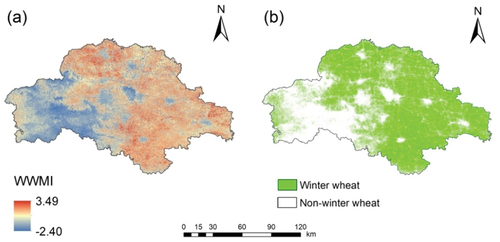
The WWMI was generated based on the composited EVI images covering Henan Province. As shown in , the WWMI map highlighted the winter wheat areas with higher WWMI values, while the WWMI values of other land cover types were lower. The optimal threshold determined in Zhumadian was combined with the WWMI image for winter wheat identification in the province. The WWMI-derived wheat area of the province was 52,475.67 km2, which was 7.51% smaller than the value of the official statistics (56,737.90 km2).
Figure 8. The (a) WWMI image and (b) winter wheat map generated using the WWMI in Henan Province for 2020.
The accuracy of the WWMI-derived winter wheat map was further evaluated by official statistics at the municipal and county levels. As shown in , there were significant linear relationships between the official sown area statistics and the WWMI-derived wheat areas at the municipal (R2 = 0.99, P < 0.001) and county (R2 = 0.93, P < 0.001) levels. The MREs between the official statistics and the WWMI-derived wheat areas were 11.63% and 22.50% at the municipal and county levels, respectively. These results indicated the good performance and robustness of the WWMI in winter wheat mapping on a large scale. As shown in , the accuracies varied among different cities in Henan Province. The accuracies in the cities of Sanmenxia, Luoyang and Zhengzhou were relatively low, with REs of over 20%, while those in Nanyang, Xinxiang and Zhumadian were relatively high, with REs of less than 5%. By comparing the topographic map of the province (shown in ) with the winter wheat mapping result, it was noted that the cities with low accuracies were mainly located in the mountainous areas of western Henan Province. The reason for this may have been that the wheat growth status in cities with more mountainous regions is greatly different from those of other cities in the plain regions; thus, their optimal WWMI thresholds were different. Application of the same optimal threshold for the entire province cannot reflect these differences in wheat growth states, and more reference data are needed to set the threshold for each city based on the empirical threshold method.
Figure 9. Comparisons of the official statistics and the WWMI-derived wheat areas in 2020 achieved by the (a-b) empirical threshold and (c-d) Otsu methods. (a) and (c) show the results at the municipal level. (b) and (d) show the results at the county level.
3.4. Application of the automatic threshold in winter wheat mapping
The Otsu method was used to automatically calculate the optimal thresholds of the WWMI for each city in Henan Province, which were used to identify the wheat cultivated areas in the province. The official sown area of winter wheat was then applied to verify the accuracies of the WWMI-derived wheat areas at the municipal and county levels. As shown in , the accuracies of the winter wheat areas achieved by the Otsu method were obviously improved at both the municipal (MRE = 6.78%) and county (MRE = 19.87%) levels when compared to the accuracies achieved by the empirical threshold method, which had MREs of 11.63% and 22.50% at the municipal and county levels, respectively. The growth states of winter wheat varied slightly due to the different climatic conditions and growth environments in the various cities. Especially in Sanmenxia, Luoyang and Zhengzhou, the wheat growth states differed greatly from those in other cities due to the large area of mountainous terrain. The optimal threshold was determined for each city using the Otsu method, which fully considered the differences in wheat growth conditions, rather than applying the same threshold for all cities. As shown in , for Sanmenxia, Luoyang and Zhengzhou, the REs achieved by the empirical threshold method were higher than 20%, whereas the REs achieved by the Otsu method were less than 10%. The accuracy of winter wheat identification was obviously improved by the Otsu method.
Table 3. The REs between the official statistics and the WWMI-derived wheat areas at the municipal level achieved by the empirical threshold and Otsu methods.
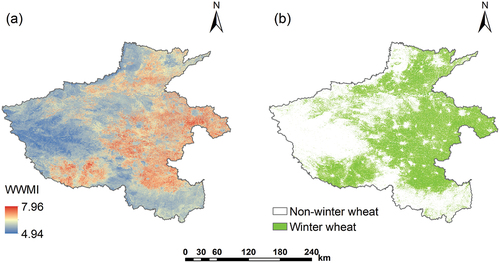
Moreover, a total of 180 wheat samples and 206 nonwheat samples were randomly selected by combining VHR image interpretation with the variation characteristics of the EVI time series of the samples. The nonwheat samples (other crops, forests, built-up areas and water) were merged into a single class. The accuracy of winter wheat identification was evaluated by comparison with these samples. The precision of the winter wheat spatial distribution results obtained with the Otsu method was evaluated using the confusion matrix (). In this confusion matrix, the OA of the wheat mapping was higher than 95%. The wheat mapping results had good accuracy despite a small number of misclassified and error-identified winter wheat pixels. Finally, the WWMI was combined with the Otsu method to achieve winter wheat identification in Henan Province in 2020, as shown in . The winter wheat area was mainly distributed in the Yellow River and Huaihe River Plains in the central and eastern parts of the province, as well as the Nanyang Basin in the southwestern part of the province, whereas the wheat was fragmented in the eastern Qinling Mountains in the northwest part of the province.
Table 4. Confusion matrix of winter wheat mapping results in 2020.
To further validate the robustness of the WWMI, it was combined with the Otsu method to identify the winter wheat-growing areas of Henan Province in 2019 without relying on any reference data. The identification accuracy was also evaluated by the official statistics (). The linear correlation between the official statistics and the WWMI-derived wheat areas reached a significant level at both the municipal (R2 = 0.91, P < 0.001) and the county (R2 = 0.82, P < 0.001) scales. The MREs between the official statistics and the WWMI-derived areas were 12.07% and 21.09% at the municipal and county levels, respectively, indicating a high accuracy in winter wheat mapping. However, the accuracy of winter wheat identification in 2019 was lower than that in 2020. The reason may be that there were more high-quality Sentinel-2 images that were not affected by clouds in 2020 than in 2019.
Figure 10. Comparisons of the official statistical data and the WWMI-derived wheat areas in 2019 achieved by the Otsu method at (a) the municipal and (b) the county levels.
4. Discussion
4.1. Comparison with the existing method
An existing winter wheat index (WWI) proposed based on a multitemporal Landsat NDVI was used for comparison (Qu, Li, and Zhang et al. Citation2021). A WWI map in Zhumadian was generated, and then the empirical threshold method was applied to acquire the optimal threshold of the WWI. The winter wheat map was generated based on the WWI, and the accuracy was evaluated by the official statistics as well. As shown in , the WWI achieved a high accuracy in wheat mapping with an MRE and RMSE of 15.90% and 186.89 km2, respectively, whereas the accuracy was lower than that of the WWMI (). The WWI exploited both the increase in the EVI from the seeding stage to the overwintering stage and the decrease in EVI from the heading stage to the harvesting stage of winter wheat. In addition to these changes, the WWMI also considered the decrease in EVI after the overwintering stage and the increase in EVI from the green-up stage to the heading stage, especially the rapid increase in EVI at the jointing stage of winter wheat, which was an important feature that distinguished winter wheat from other crops. Thus, the WWMI performed better than the WWI in winter wheat identification.
Figure 11. County-level comparisons between the official statistical data and the WWI-derived wheat areas in Zhumadian in 2020.
4.2. Advantages of the proposed method
Many studies have achieved satisfactory results in winter wheat identification, most of which involved supervised classifications, which require many samples to train the classifiers (Fang et al. Citation2020; Tianle et al. Citation2019; G.; Yang et al. Citation2021). To reduce the dependence on sample data, some authors developed a wheat mapping index to identify winter wheat-growing areas (X. Zhang et al. Citation2021; Qu, Li, and; Zhang et al. Citation2021; Qiu et al. Citation2017). However, in the index-based mapping method, reference data (e.g. official statistics or samples) are still needed to determine the optimal threshold to distinguish wheat and nonwheat areas. The reliance on reference data limits the application of index-based wheat identification in other regions and other years without these data, which is still a challenge for large-scale winter wheat mapping. In this study, the WWMI was developed by combining a Sentinel-2 EVI time series with the phenological features of winter wheat. Compared with supervised classifications, the WWMI effectively reduced the dependence on sample data in wheat mapping.
For the WWMI, threshold determination has a great effect on the wheat identification accuracy. In Zhumadian, the optimal threshold of the WWMI was determined by the empirical threshold method based on the official statistics, and the accuracy was high, with an MRE of less than 15%. However, when the optimal threshold in Zhumadian was applied to identify the wheat cultivated areas in Henan Province, the identification accuracies for some cities were low, with REs higher than 20%. As there are more mountainous areas in these cities and the wheat growth states are quite different from those of Zhumadian, the optimal thresholds for these cities also varied. In this case, it is time-consuming and impractical to calculate the optimal threshold of the WWMI for each city in the province. The automatic threshold methods, including the Kapur and Otsu methods, were used to automatically calculate the optimal threshold of the index, which did not rely on reference data to constantly adjust the threshold, thus further reducing the dependence on official agricultural statistics (Bouhennache et al. Citation2019; Han and Niu Citation2020; Yin et al. Citation2013).
The Kapur method is based on grayscale histograms, while the Otsu method is based on grayscale clustering. The Kapur method assumes that the target and background come from two different sources. Based on the grayscale histogram of an image, a reasonable threshold is determined by maximizing the posterior entropy, which minimizes the amount of lost information during transmission (Bhandari et al. Citation2014). The Otsu method examines the variance between the target and background parts based on the average gray level of the pixels. It tends to segment the target and background into two parts with a uniform grayscale distribution. Therefore, the Otsu method often yields a satisfactory result when the shape of the grayscale histogram of an image has a clear bimodal structure (Xiangyang et al. Citation2011). The sown area of winter wheat in Henan Province accounts for 52% of the total sown area of grain crops. Winter wheat can be clearly distinguished from other land cover types through WWMI values, and the histogram of WWMI showed obvious bimodal distribution. Therefore, the Otsu method performed better than the Kapur method in this study. Finally, the WWMI was combined with the Otsu method to extract the winter wheat-growing areas of the province in both 2019 and 2020 and achieved high accuracies. This verified the effectiveness and robustness of the proposed method for automatic winter wheat mapping to a large extent.
4.3. Potential refinements
In this research, the WWMI was constructed using a Sentinel-2 EVI time series, which was applied to extract the wheat cultivated areas in Henan Province for 2019 and 2020 and achieved high mapping accuracies. For the future, multisource data such as other optical satellite images, SAR images and topographic factors will be combined for winter wheat mapping, which will further improve the accuracy of wheat mapping, especially in regions with complex topography. The construction of a wheat mapping index based on Sentinel-1 polarization features and Sentinel-2 spectral features is also the focus of future study (Tian et al. Citation2020). In addition to winter wheat, the mapping index for other crops can also be developed based on a Sentinel-2 imagery time series, which will be combined with the automatic threshold method for the identification of other crops such as corn and cotton. Thus, this research provides a theoretical basis for automatic crop mapping on a large scale.
To ensure the consistency of the Sentinel-2 EVI interval for each pixel, in this study, the composited EVI was obtained by calculating the median value of all the EVI for each month. In future studies, composited EVI images will be obtained by calculating the median EVI for each growth stage of winter wheat. The winter wheat identification performance achieved by these two composite means will be compared to explore the optimal EVI composite method.
Compared with the pixel-based method, the object-oriented method reduced the influences of salt-and-pepper noise in the wheat map, so the accuracy of the latter was higher. However, the narrow field footpaths between wheat parcels were not effectively identified with the object-oriented method in this study. The reason may have been that the wheat objects obtained by image segmentation were not actually wheat parcels. In future studies, the actual wheat parcels could be identified based on the artificial vectorization method, and then the parcel-oriented method could be combined with the WWMI for winter wheat identification.
In this research, both the Otsu and Kapur methods were used to automatically calculate the threshold of the WWMI, and the Otsu method achieved a higher accuracy in wheat mapping at both the municipal and county levels. The performances of other automatic threshold methods (Nie et al. Citation2011; Rosin Citation2001) in determining the WWMI threshold will be evaluated in a future study.
5. Conclusion
A WWMI was constructed in this study for the automatic identification of winter wheat-growing areas in Henan Province. The phenology features derived from the Sentinel-2 EVI time series were applied to constitute the WWMI, which showed good separability between winter wheat and nonwinter wheat samples. The WWMI had a high accuracy in wheat mapping with the optimal threshold. Compared with supervised classification methods, the WWMI was highly effective and could identify winter wheat cultivation areas without training samples. Both the accuracy evaluation and visual interpretation results indicated that the object-oriented WWMI performed better than the pixel-based WWMI in wheat mapping. Compared with the existing winter wheat index, the WWMI achieved better performance. The winter wheat map in Henan Province, China, was generated by combining the WWMI with the Otsu method, which had MREs of 6.78% and 19.87% at the municipal and county levels, respectively. Compared with the empirical threshold method, the Otsu method reduced the reliance on official statistics in determining the optimal threshold of the WWMI. This study provided an efficient and practical approach for winter wheat identification by combining the WWMI with the Otsu method, which will offer a theoretical basis for identifying other crops at regional scales.
Author contributions
Conceptualization, Yi Xie and Shujing Shi; Data curation, Shujing Shi; Formal analysis, Yi Xie, Shujing Shi and Lan Xun; Funding acquisition, Yi Xie; Investigation, Yi Xie; Project administration, Yi Xie; Resources, Yi Xie; Writing – original draft, Yi Xie and Shujing Shi; Writing – review & editing, Yi Xie, Shujing Shi, Lan Xun, and Pengxin Wang.
Acknowledgments
We thank the Henan Meteorological Service for providing the 35 winter wheat samples.
Disclosure statement
No potential conflict of interest was reported by the author(s).
Data availability statement
The sample data that support the findings of this study is available at https://code.earthengine.google.com/69125eaba8bfba5facb27928bbe1f0b0. The official statistics are available on Henan Province Service of Statistics (http://tjj.henan.gov.cn/).
Additional information
Funding
References
- Bahram, S., B. Daneshfar, and A. M. Davidson. 2017. “Accurate Crop-Type Classification Using Multi-Temporal Optical and Multi-Polarization SAR Data in an Object-Based Image Analysis Framework.” International Journal of Remote Sensing 38 (14): 4130–19. https://doi.org/10.1080/01431161.2017.1317933.
- Bangira, T., S. Maria Alfieri, M. Menenti, and A. van Niekerk. 2019. “Comparing Thresholding with Machine Learning Classifiers for Mapping Complex Water.” Remote Sensing 11 (11). https://doi.org/10.3390/rs11111351.
- Belgiu, M., and O. Csillik. 2018. “Sentinel-2 Cropland Mapping Using Pixel-Based and Object-Based Time-Weighted Dynamic Time Warping Analysis.” Remote Sensing of Environment. Elsevier204:509–523. https://doi.org/10.1016/j.rse.2017.10.005.
- Bhandari, A. K., V. Kumar Singh, A. Kumar, and G. Kumar Singh. 2014. “Cuckoo Search Algorithm and Wind Driven Optimization Based Study of Satellite Image Segmentation for Multilevel Thresholding Using Kapur’s Entropy.” Expert Systems with Applications 41 (7): 3538–3560. Elsevier Ltd. https://doi.org/10.1016/j.eswa.2013.10.059
- Bouhennache, R., T. Bouden, A. Taleb-Ahmed, and A. Cheddad. 2019. “A New Spectral Index for the Extraction of Built-Up Land Features from Landsat 8 Satellite Imagery.” Geocarto International 34 (14): 1531–1551. Taylor & Francis. https://doi.org/10.1080/10106049.2018.1497094.
- Brown, J. C., J. H. Kastens, A. Camargo Coutinho, D. de Castro Victoria, and C. R. Bishop. 2013. “Classifying Multiyear Agricultural Land Use Data from Mato Grosso Using Time-Series MODIS Vegetation Index Data.” Remote Sensing of Environment 130:39–50. Elsevier Inc. https://doi.org/10.1016/j.rse.2012.11.009.
- Chang, Q., L. Peijun, and C. Zhang. 2021. “A Spectral Index for Winter Wheat Mapping Using Multi-Temporal Landsat NDVI Data of Key Growth Stages.” ISPRS Journal of Photogrammetry and Remote Sensing 175 (April): 431–447. Elsevier B.V. https://doi.org/10.1016/j.isprsjprs.2021.03.015.
- Choi, H., and R. Bindschadler. 2004. “Cloud Detection in Landsat Imagery of Ice Sheets Using Shadow Matching Technique and Automatic Normalized Difference Snow Index Threshold Value Decision.” Remote Sensing of Environment 91 (2): 237–242. https://doi.org/10.1016/j.rse.2004.03.007.
- Davoud, A., H. Salehi Shahrabi, M. Azadbakht, H. N. Hossein Aghighi, A. Alimohammadi, A. Akbar Matkan, and A. A. Matkan. 2019. “Automatic Canola Mapping Using Time Series of Sentinel 2 Images.” ISPRS Journal of Photogrammetry and Remote Sensing 156 (July): 63–76. https://doi.org/10.1016/j.isprsjprs.2019.08.007.
- Dong, J., W. Liu, W. Han, K. Xiang, T. Lei, and W. Yuan. 2020. “A Phenology-Based Method for Identifying the Planting Fraction of Winter Wheat Using Moderate-Resolution Satellite Data.” International Journal of Remote Sensing 41 (18): 6892–6913. https://doi.org/10.1080/01431161.2020.1755738.
- Fang, P., X. Zhang, P. Wei, Y. Wang, H. Zhang, F. Liu, and J. Zhao. 2020. “The Classification Performance and Mechanism of Machine Learning Algorithms in Winter Wheat Mapping Using Sentinel-2 10 M Resolution Imagery.” Applied Sciences (Switzerland) 10 (15). https://doi.org/10.3390/app10155075.
- Feyisa, G. L., H. Meilby, R. Fensholt, and S. R. Proud. 2014. “Automated Water Extraction Index: A New Technique for Surface Water Mapping Using Landsat Imagery.” Remote Sensing of Environment 140:23–35. Elsevier Inc. https://doi.org/10.1016/j.rse.2013.08.029.
- Gella, G. W., W. Bijker, and M. Belgiu. 2021 March. “Mapping Crop Types in Complex Farming Areas Using SAR Imagery with Dynamic Time Warping.” ISPRS Journal of Photogrammetry and Remote Sensing 175:171–183. Elsevier B.V. https://doi.org/10.1016/j.isprsjprs.2021.03.004.
- Ghorbanian, A., M. Kakooei, M. Amani, S. Mahdavi, A. Mohammadzadeh, and M. Hasanlou. 2020. “Improved Land Cover Map of Iran Using Sentinel Imagery within Google Earth Engine and a Novel Automatic Workflow for Land Cover Classification Using Migrated Training Samples.” ISPRS Journal of Photogrammetry and Remote Sensing 167 ( July): 276–288. Elsevier B.V. https://doi.org/10.1016/j.isprsjprs.2020.07.013.
- Han, L., J. Ding, J. Wang, J. Zhang, B. Xie, and J. Hao. 2022. “Monitoring Oasis Cotton Fields Expansion in Arid Zones Using the Google Earth Engine: A Case Study in the Ogan-Kucha River Oasis, Xinjiang, China.” Remote Sensing 14 (225): 1–14. https://doi.org/10.3390/rs14010225.
- Han, Q., and Z. Niu. 2020. “Construction of the Long-Term Global Surface Water Extent Dataset Based on Water-NDVI Spatio-Temporal Parameter Set.” Remote Sensing 12 (17): 2675. https://doi.org/10.3390/RS12172675.
- Huang, X., J. Huang, L. Xuecao, Q. Shen, and Z. Chen. 2022. “Early Mapping of Winter Wheat in Henan Province of China Using Time Series of Sentinel-2 Data.” GIScience & Remote Sensing 59 (1): 1534–1549. Taylor & Francis. https://doi.org/10.1080/15481603.2022.2104999.
- Jiao, X., J. M. Kovacs, J. Shang, H. McNairn, D. Walters, M. Baoluo, and X. Geng. 2014. “Object-Oriented Crop Mapping and Monitoring Using Multi-Temporal Polarimetric RADARSAT-2 Data.”ISPRS Journal of Photogrammetry and Remote Sensing 96. International Society for Photogrammetry and Remote Sensing, Inc (ISPRS): 38–46. https://doi.org/10.1016/j.isprsjprs.2014.06.014.
- Konduri, V. S., J. Kumar, W. W. Hargrove, F. M. Hoffman, and A. R. Ganguly. 2020. “Mapping Crops within the Growing Season Across the United States.” Remote Sensing of Environment 251(August). https://doi.org/10.1016/j.rse.2020.112048.
- Lambert, M. J., P. C. S. Traoré, X. Blaes, P. Baret, and P. Defourny. 2018. “Estimating Smallholder Crops Production at Village Level from Sentinel-2 Time Series in Mali’s Cotton Belt.” Remote Sensing of Environment 216 (June): 647–657. Elsevier. https://doi.org/10.1016/j.rse.2018.06.036
- Lei, G., L. Ainong, J. Bian, H. Yan, L. Zhang, Z. Zhang, and X. Nan. 2020. “OIC-MCE: A Practical Land Cover Mapping Approach for Limited Samples Based on Multiple Classifier Ensemble and Iterative Classification.” Remote Sensing 12 (6): 1–21. https://doi.org/10.3390/rs12060987.
- Linrong, L., S. Hongjun, D. Qian, and T. Wu. 2021. “A Novel Surface Water Index Using Local Background Information for Long Term and Large-Scale Landsat Images.” Isprs Journal of Photogrammetry & Remote Sensing 172:59–78. November 2020. https://doi.org/10.1016/j.isprsjprs.2020.12.003.
- Ludwig, C., A. Walli, C. Schleicher, J. Weichselbaum, and M. Riffler. 2019. “A Highly Automated Algorithm for Wetland Detection Using Multi-Temporal Optical Satellite Data.” Remote Sensing of Environment 224 ( February): 333–351. Elsevier. https://doi.org/10.1016/j.rse.2019.01.017.
- Luo, H. X., S. P. Dai, M. O. Li, E. P. Liu, Q. Zheng, Y. Y. Hu, and X. P. Yi. 2020. “Comparison of Machine Learning Algorithms for Mapping Mango Plantations Based on Gaofen-1 Imagery.” Journal of Integrative Agriculture 19 (11): 2815–2828. CAAS. Publishing services by Elsevier B.V. https://doi.org/10.1016/S2095-3119(20)63208-7
- Martinez, C., J. Andres, L. Elena Cué La Rosa, R. Queiroz Feitosa, and I. Del Arco Sanches. 2021. “Fully Convolutional Recurrent Networks for Multidate Crop Recognition from Multitemporal Image Sequences.” Isprs Journal of Photogrammetry & Remote Sensing. November 2020171:188–201. https://doi.org/10.1016/j.isprsjprs.2020.11.007.
- Martinis, S., A. Twele, and S. Voigt. 2009. “Towards Operational Near Real-Time Flood Detection Using a Split-Based Automatic Thresholding Procedure on High Resolution TerraSAR-X Data.” Natural Hazards & Earth System Science 9 (2): 303–314. https://doi.org/10.5194/nhess-9-303-2009.
- Nie, F., C. Gao, Y. Guo, and M. Gan. 2011. “Two-Dimensional Minimum Local Cross-Entropy Thresholding Based on Co-Occurrence Matrix.” Computers and Electrical Engineering 37 (5): 757–767. Elsevier Ltd. https://doi.org/10.1016/j.compeleceng.2011.06.006
- Oliphant, A. J., P. S. Thenkabail, P. Teluguntla, J. Xiong, M. Krishna Gumma, R. G. Congalton, and K. Yadav. 2019. “Mapping Cropland Extent of Southeast and Northeast Asia Using Multi-Year Time-Series Landsat 30-M Data Using a Random Forest Classifier on the Google Earth Engine Cloud.” International Journal of Applied Earth Observation and Geoinformation. August 2018 Elsevier81:110–124. https://doi.org/10.1016/j.jag.2018.11.014.
- Qiu, B., L. Difei, Z. Tang, C. Chen, and F. Zou. 2017. “Automatic and Adaptive Paddy Rice Mapping Using Landsat Images: Case Study in Songnen Plain in Northeast China.” Science of the Total Environment. Elsevier B.V.598:581–592. https://doi.org/10.1016/j.scitotenv.2017.03.221.
- Qiu, B., F. Jiang, C. Chen, Z. Tang, W. Wenbin, and J. Berry. 2021. “Phenology-Pigment Based Automated Peanut Mapping Using Sentinel-2 Images.” GIScience & Remote Sensing 58 (8): 1335–1351. Taylor & Francis. https://doi.org/10.1080/15481603.2021.1987005.
- Qiu, B., Y. Luo, Z. Tang, C. Chen, L. Difei, H. Huang, Y. Chen, N. Chen, and X. Weiming 2017. “Winter Wheat Mapping Combining Variations Before and After Estimated Heading Dates.”ISPRS Journal of Photogrammetry and Remote Sensing 123. International Society for Photogrammetry and Remote Sensing, Inc. (ISPRS): 35–46. https://doi.org/10.1016/j.isprsjprs.2016.09.016.
- Ren, J., Y. Shao, H. Wan, Y. Xie, and A. Campos. 2021. “A Two-Step Mapping of Irrigated Corn with Multi-Temporal MODIS and Landsat Analysis Ready Data.” ISPRS Journal of Photogrammetry and Remote Sensing 176 (April): 69–82. Elsevier B.V. https://doi.org/10.1016/j.isprsjprs.2021.04.007.
- Rosin, P. L. 2001. “Unimodal Thresholding.” Pattern Recognition 34 (11): 2083–2096. https://doi.org/10.1016/S0031-3203(00)00136-9.
- Sun, H., X. Aigong, H. Lin, L. Zhang, and Y. Mei. 2012. “Winter Wheat Mapping Using Temporal Signatures of MODIS Vegetation Index Data.” International Journal of Remote Sensing 33 (16): 5026–5042. https://doi.org/10.1080/01431161.2012.657366.
- Tao, J. B., W. B. Wu, Y. Zhou, Y. Wang, and Y. Jiang. 2017. “Mapping Winter Wheat Using Phenological Feature of Peak Before Winter on the North China Plain Based on Time-Series MODIS Data.” Journal of Integrative Agriculture 16 (2): 348–359. Chinese Academy of Agricultural Sciences. https://doi.org/10.1016/S2095-3119(15)61304-1.
- Tengfei, S. 2017. “Efficient Paddy Field Mapping Using Landsat-8 Imagery and Object-Based Image Analysis Based on Advanced Fractel Net Evolution Approach.” GIScience & Remote Sensing 54 (3): 354–380. Taylor & Francis. https://doi.org/10.1080/15481603.2016.1273438.
- Tianle, H., C. Xie, Q. Liu, S. Guan, and G. Liu. 2019. “Evaluation and Comparison of Random Forest and A-LSTM Networks for Large-Scale Winter Wheat Identification.” Remote Sensing 11 (14): 1665. https://doi.org/10.3390/rs11141665.
- Tian, H., J. Pei, J. Huang, L. Xuecao, J. Wang, B. Zhou, Y. Qin, and L. Wang. 2020. “Garlic and Winter Wheat Identification Based on Active and Passive Satellite Imagery and the Google Earth Engine in Northern China.” Remote Sensing 12 (21): 1–17. https://doi.org/10.3390/rs12213539.
- Wang, Y., S. Fang, L. Zhao, X. Huang, and X. Jiang. 2022. “Parcel-Based Summer Maize Mapping and Phenology Estimation Combined Using Sentinel-2 and Time Series Sentinel-1 Data.” International Journal of Applied Earth Observation and Geoinformation 108. November 2021 Elsevier B.V. https://doi.org/10.1016/j.jag.2022.102720.
- Wang, N., Y. Zhai, and L. Zhang. 2021. “Automatic Cotton Mapping Using Time Series of Sentinel-2 Images.” Remote Sensing 13 (7). https://doi.org/10.3390/rs13071355.
- Xiangyang, X., X. Shengzhou, L. Jin, and E. Song. 2011. “Characteristic Analysis of Otsu Threshold and Its Applications.” Pattern Recognition Letters 32 (7): 956–961. https://doi.org/10.1016/j.patrec.2011.01.021.
- Xie, Y. 2022. “Combining CERES-Wheat Model, Sentinel-2 Data, and Deep Learning Method for Winter Wheat Yield Estimation.” International Journal of Remote Sensing 43 (2): 630–648. Taylor & Francis. https://doi.org/10.1080/01431161.2022.2026521.
- Xie, Y., and J. Huang. 2021. “Integration of a Crop Growth Model and Deep Learning Methods to Improve Satellite-Based Yield Estimation of Winter Wheat in Henan Province, China.” Remote Sensing 13 (21): 4372. https://doi.org/10.3390/rs13214372.
- Xun, L., J. Zhang, D. Cao, S. Yang, and F. Yao. 2021. “A Novel Cotton Mapping Index Combining Sentinel-1 SAR and Sentinel-2 Multispectral Imagery.” ISPRS Journal of Photogrammetry and Remote Sensing 181 (September): 148–166. Elsevier B.V. https://doi.org/10.1016/j.isprsjprs.2021.08.021
- Yang, Y., B. Tao, W. Ren, D. P. Zourarakis, B. El Masri, Z. Sun, and Q. Tian. 2019. “An Improved Approach Considering Intraclass Variability for Mapping Winter Wheat Using Multitemporal MODIS EVI Images.” Remote Sensing 11 (10). https://doi.org/10.3390/rs11101191.
- Yang, G., Y. Weiguo, X. Yao, H. Zheng, Q. Cao, Y. Zhu, W. Cao, and T. Cheng. 2021. “AGTOC: A Novel Approach to Winter Wheat Mapping by Automatic Generation of Training Samples and One-Class Classification on Google Earth Engine.” International Journal of Applied Earth Observation and Geoinformation 102 (July): 102446. Elsevier B.V. https://doi.org/10.1016/j.jag.2021.102446.
- Yin, D., X. Cao, X. Chen, Y. Shao, and J. Chen. 2013. “Comparison of Automatic Thresholding Methods for Snow-Cover Mapping Using Landsat TM Imagery.” International Journal of Remote Sensing 34 (19): 6529–6538. https://doi.org/10.1080/01431161.2013.803631.
- You, N., and J. Dong. 2020. “Examining Earliest Identifiable Timing of Crops Using All Available Sentinel 1/2 Imagery and Google Earth Engine.” Isprs Journal of Photogrammetry & Remote Sensing. December 2019 Elsevier161:109–123. https://doi.org/10.1016/j.isprsjprs.2020.01.001.
- Zhang, H., H. Du, C. Zhang, and L. Zhang. 2021. “An Automated Early-Season Method to Map Winter Wheat Using Time-Series Sentinel-2 Data: A Case Study of Shandong, China.” Computers and Electronics in Agriculture 182. December 2020 Elsevier B.V. https://doi.org/10.1016/j.compag.2020.105962.
- Zhang, M., H. Lin, G. Wang, H. Sun, and F. Jing. 2018. “Mapping Paddy Rice Using a Convolutional Neural Network (CNN) with Landsat 8 Datasets in the Dongting Lake Area, China.” Remote Sensing 10 (11): 1840. https://doi.org/10.3390/rs10111840.
- Zhang, H. K., and D. P. Roy. 2017. “Using the 500 M MODIS Land Cover Product to Derive a Consistent Continental Scale 30 M Landsat Land Cover Classification.” Remote Sensing of Environment 197:15–34. The Authors. https://doi.org/10.1016/j.rse.2017.05.024.
- Zhong, L., H. Lina, H. Zhou, and X. Tao. 2019. “Deep Learning Based Winter Wheat Mapping Using Statistical Data as Ground References in Kansas and Northern Texas, US.” Remote Sensing of Environment 233 (September): 111411. Elsevier. https://doi.org/10.1016/j.rse.2019.111411.