
 ?Mathematical formulae have been encoded as MathML and are displayed in this HTML version using MathJax in order to improve their display. Uncheck the box to turn MathJax off. This feature requires Javascript. Click on a formula to zoom.
ABSTRACT
Rapid urbanization has dramatically increased the demand for river sand, leading to soaring sand extraction rates that often exceed natural replenishment in many rivers globally. However, our understanding of the geomorphic and social-ecological impacts arising from Sand Mining (SM) remains limited, primarily due to insufficient data on sand extraction rates. Conventionally, bathymetry surveys and compilation of declared amounts have been used to quantify SM budgets, but they are often costly and laborious, or result in inaccurate quantification. Here, for the first time, we developed a Remote Sensing (RS)-based Deep Learning (DL) framework to map SM activities and budgets in the Vietnamese Mekong Delta (VMD), a global SM hotspot. We trained a near real-time object detection system to identify three boat classes in Sentinel-1 imagery: Barge with Crane (BC), Sand Transport Boat (STB), and other boats. Our DL model achieved a 96.1% Mean Average Precision (mAP) across all classes and 98.4% for the BC class, used in creating an SM boat density map at an Intersection over Union (IoU) threshold of 0.50. Applying this model to Sentinel-1, 256,647 boats were detected in the VMD between 2014–2022, of which 17.4% were BC. Subsequently, the annual SM budget was estimated by correlating it with a recent riverbed incision map. Our results showed that, between 2015–2022, about 366 Mm3 of sand has been extracted across the VMD. The annual budget has progressively increased from 34.92 Mm3 in 2015 to 53.25 Mm3 in 2022 (by 52%), with an annual increment of around 2.79 Mm3. At the provincial-scale, Dong Thap, An Giang, Vinh Long, Tien Giang, and Can Tho were the locations of intensive mining, accounting for 89.20% of the total extracted volume in the VMD. Finally, our estimated budgets were validated with previous research that yielded a correlation coefficient of 0.99% (with bias of 2.65%). The automatic DL framework developed in this study to quantify SM budgets has a high potential to be applied to other deltas worldwide also facing intensive SM.
1. Introduction
Sand is essential for modern society as it forms the foundation for most of the structures. Apart from construction, which comprises approximately 50% of total sand consumption (Taylor Citation2019), high-tech industries such as glass, electronics, and aeronautics heavily rely on sand (Rashid and Nazir Citation2018). Consequently, the demand for sand is immense, making it the most extracted material group, surpassing fossil fuel extraction (Bendixen et al. Citation2019; Monteiro, Miller, and Horvath Citation2017). Roughly 32–50 billion tonnes of sand are used globally each year (equivalent to around 18 kg per individual daily), according to the United Nations Environment Programme (UNEP Citation2019). Sand is extracted from various sources, such as lakes, riverbeds, and deltas, to meet the growing demand. River sand is highly sought after in construction and high-tech industries for its superior quality, cost-effectiveness, and angular texture (Peduzzi Citation2014). The current global demand for sand, driven by rapid urbanization, population growth, and economic development (Miatto et al. Citation2017; Sverdrup, Koca, and Schlyter Citation2017), has caused extraction rates to exceed natural renewal rates by twofold (Asabonga et al. Citation2017; Ludacer Citation2018). This imbalance has led to substantial changes in the morphology, hydrology, and ecology of rivers worldwide (Rentier and Cammeraat Citation2022), especially in Southeast Asian rivers such as Irrawaddy, Salween, and Mekong (Best Citation2019). These situations are expected to worsen as projected sand demand is estimated to rise to 82 billion tons by 2060 (Fritts Citation2019; Torres et al. Citation2021).
In Southeast Asia, the Mekong Delta in Vietnam (or Vietnamese Mekong Delta, VMD) is a SM hotspot where intensive SM has been occurring since the 1980s (Bravard, Goichot, and Gaillot Citation2013). Known as the “rice bowl” of the country, the VMD has a population of approximately 18 million people and contributes over 50% of the nation’s food production GSO Citation2022. However, excessive SM in this region has resulted in various environmental consequences (Anthony et al. Citation2015) that have led to accelerated river channel erosion and riverbank instability that poses risks to the safety of bridges and embankments (Bendixen et al. Citation2019; Best Citation2019). Furthermore, the unsustainable extraction of sand has caused a lowering of the riverbed and a decrease in the frequency of seasonal floods (Park et al. Citation2020). These activities have far-reaching consequences on the ecosystem, compromising essential services such as providing nutrient-rich sediments, removing pollutants, replenishing groundwater, and preventing saltwater intrusion (Loc et al. Citation2017; Park et al. Citation2022). Consequently, coastal regions experienced heightened levels of salinity intrusion, particularly during the summer when the water level goes down, rendering the cultivation of salt-sensitive crops impractical for farmers (Eslami et al. Citation2019; Loc et al. Citation2021). Moreover, the sand removal from riverbeds disrupts the habitats of benthic fauna and flora, which are crucial ecosystem components (Torres et al. Citation2017; Zou et al. Citation2019). This disruption has a cascading effect on fishery catch, ultimately impacting the food security of riverine and coastal communities (Dugan et al. Citation2010; Padmalal et al. Citation2008).
Despite the studies mentioned above on SM in the Mekong, understanding the socio-environmental impacts remains limited due to a lack of accurate quantification of the SM budget. Without a budget to serve as baseline data on the level of SM activities, it is impossible to assess the impact of SM quantitatively. Admittedly, estimating the SM budget is methodologically challenging. The main difficulty in assessing the level of SM activities is that mining pits are underwater and not directly visible. Extensive bathymetric surveys are needed to measure the SM budget (Brunier et al. Citation2014; Jordan et al. Citation2019). However, conducting such field surveys is expensive, logistically challenging, and time-consuming, particularly for large or complex multi-channel rivers. Although several studies have estimated the SM budget using official statistics for smaller regions, official statistics in Southeast Asia, especially in Cambodia and Vietnam, are believed to significantly underestimate the accurate figures due to illegal SM (Tuyen Citation2023; Witness Citation2010). Few studies (Gruel et al. Citation2022; Hackney et al. Citation2021; Smigaj et al. Citation2023) have attempted to use satellite images to map SM activities and estimate budgets without solely relying on traditional field/official statistics-based approaches. Hackney et al. (Citation2021) estimated the extraction rate in Cambodia by manually counting Sand Transport Boats (STB) from a monthly composite of PlanetScope imagery and the boat’s carrying capacity. Although this research has a solid potential to be applied in other regions, the estimated budget may be uncertain due to the assumption that all STBs carry the same sand volume. Mapping rapidly moving STBs with monthly satellite imagery may further increase uncertainty. Gruel et al. (Citation2022) estimated the SM budget more systematically by counting the Barge with Crane (BC) to create a boat density map, which they subsequently calibrated with an incision map derived from a bathymetry survey. Both studies, however, depended on the manual identification and mapping of boats involved in SM, which is limited in scaling up to larger areas.
The recent advancements in artificial intelligence and computational processing capabilities have unlocked a transformative potential for automatically mapping SM activities across extensive geographical areas. DL models have made substantial strides across various domains (Ma et al. Citation2023; Yu et al. Citation2017) evident by their successful application in detecting lake ice and ships (Chang et al. Citation2019; Geng et al. Citation2021; Hass and Jokar Arsanjani Citation2020) and accurately estimating ship sizes (Geng et al. Citation2021). However, the specific challenge of mapping SM operations and budgets presents unique complexities, necessitating the precise classification of SM vessels. Smigaj et al. (Citation2023) automatically applied a DL model to map SM boats using PlanetScope imagery. Despite the innovative attempt, they have not quantified the SM budget. The use of the Faster R-CNN model, which has relatively lower accuracy in mapping small objects, may also contribute to the uncertainty of SM boat mapping (Chang et al. Citation2019; Paul et al. Citation2022). Thus, there is a need for a framework to map SM activities with relevant accuracy at minimal cost systematically.
In this paper, for the first time, we address methodological challenges in SM budget estimation and monitoring by developing a novel and cost-effective RS-based DL framework. We chose the VMD as an ideal testbed to implement our framework due to its high mining activities over a long history, which is similar to the other Southeast Asian rivers. Our framework utilizes publicly available radar-based imagery and DL algorithms to detect SM activities automatically, allowing for monitoring during cloudy weather conditions. Additionally, the framework benefits from the public availability of the You Only Look Once version 5 (YOLOv5) DL algorithm, known for its lightweight architecture that ensures swift real-time processing, high speed, and relatively high accuracy in mapping minuscule objects in satellite imagery (Chang et al. Citation2019; Jocher et al. Citation2021; Paul et al. Citation2022; Van Etten Citation2019). Finally, we evaluated the reliability of our framework by comparing our budget with that from prior research, which relied on manual mapping, comprehensive field data, or official declarations.
2. Data and methods
2.1. The Vietnamese Mekong Delta (VMD)
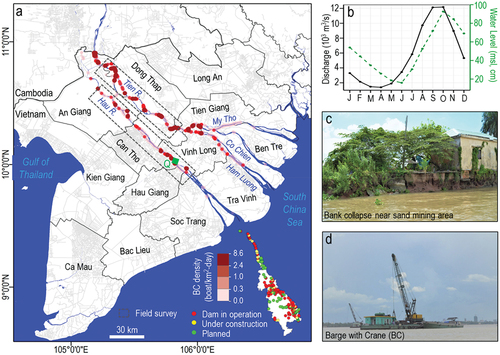
The Mekong River is the longest in Southeast Asia, originating from the Tibetan Plateau and spanning over six countries before reaching the South China Sea. The climate in the upper Mekong River is temperate, and the river channel is dominated by bedrock. The climate changes to tropical monsoons along the lower Mekong River, and riverbeds are dominated by fine sand and silt (Piman and Shrestha Citation2017). This unique sedimentation regime and bedload texture in the lower Mekong River make this section suitable for SM (Walling Citation2011). The VMD, an area of 40,000 km2 within the Mekong basin, is globally the third-largest delta, with a 710 km2 channel area. The delta is split between the Hau and Tien rivers, linked by the Vam Nao channel () in the middle of the An Giang and Dong Thap provinces. The annual VMD discharge at Neak Luong and Koh Kehl stations in Cambodia, located before the delta splits into two rivers, is approximately 13,000 m3/s (Gruel et al. Citation2022). Brunier et al. (Citation2014) found that around 75% of the total Mekong discharge comes from the Tien upstream, which is nearly equally divided between the Tien and Hau distributaries by the Vam Nao channel. The hydrological regime of the VMD features a dry season from November to May and a wet season from June to October (), accounting for 80% of the total annual discharge (MRC Citation2023).
Figure 1. (a) Map of the VMD illustrating the distribution and density of BC, district names, and an inset map displaying the location of operational, under construction, and planned dams. The Tien and Hau sections, corresponding to the bathymetry survey, are outlined by a gray dotted rectangle. The green square dot signifies Can Tho’s discharge station (Q), while the blue background indicates the water body. (b) Seasonal discharge and water level (2014–2022) at the Can Tho. (c) Photograph showing a significant bank collapse in an SM zone. (d) Photograph of a BC used for sand extraction from the riverbed. S. Kumar took both pictures during a field survey near Long Xuyen City on the Hau River on 27th June 2022.
2.2. Field surveys in the Mekong
We conducted field surveys in the years 2014, 2017, and 2022 in the VMD, shown as gray rectangles in . In July 2014, September 2017, and June 2022, river water depths at 491, 380, and 65 cross-sections across the Tien and Hau sections, respectively, were collected with intervals of 1–5 km. We employed a Teledyne Marine RD Instrument Acoustic Doppler Current Profiler (ADCP) and a dual-beam echosounder (Hummingbird Helix 10 Chirp SI GPS G2N) to measure water depth, with an accuracy of ± 0.1–1%. We initially extracted and processed the water depth data with WinRiver II, exporting it to text files, and then determined riverbed elevations by subtracting the water level from the water depth data. Water level were sourced from MRC hydrological stations during surveys (https://portal.mrcmekong.org/time-series/water-level). Elevation points were then interpolated at 120 m spatial resolution using isotropic universal Kriging with the exponential method and kernel function (Cressie Citation2015; Matheron Citation1963). We then generated a bathymetry difference map for the Tien section, which revealed continuous accumulation and incision of the riverbed from 2014 to 2017. This was used to develop a regression model to estimate the boat-driven incision map. In 2022, the Hau bathymetry provided insights into the current scale of SM activities. For further details on the processing steps and bathymetry data used in this study, refer to previous studies (Binh et al. Citation2021; Gruel et al. Citation2022; Lau et al. Citation2023). In addition, we captured photographs of bank collapses () and various individual boats, especially BC (), with their geographical locations. These photographs helped us identify boats in satellite images to create a DL training dataset.
2.3. Sentinel-1 data collection, pre-processing, and boat identifications
Sentinel-1, launched as the first radar imagery mission, is publicly available in the Sentinel-Standard Archive Format for Europe (SAFE) at 10 to 30 m spatial resolution, depending on the location (Supplementary Text 1 for details). In this study, we utilized Level-1 Ground Range Detected (GRD) data acquired in Interferometric Wide (IW) mode and with dual polarization operating at a C-band frequency of ~ 5.5. These images provide only amplitude information, which is typically recommended and considered sufficient for the given objective (Jafarzadeh et al. Citation2021 Moskolaï et al. Citation2022; Wang et al. Citation2019). Using the SNAP graph builder, we first pre-processed all available Sentinel-1 images from 1 July 2014, to 30 September 2022 (N = 665). This pre-processing workflow incorporated several operators, including “read,” “Apply Orbit File (AOF),” “Thermal Noise Removal,” “Calibration,” “Speckle-Filter,” “Terrain-Correction,” “LinearToFromdB,” and “Write” (Supplementary Text 2 and Table S1 for details).
Identifying various individual boats in Sentinel-1 is challenging due to its low spatial resolution and grayscale imagery. To mitigate this, we obtained cloud-free, high-resolution (3-4 m) PlanetScope optical imagery (Supplementary Text 3). Even with PlanetScope, differentiating boats remains challenging without individual reference images. Thus, we conducted field surveys around 9:30 AM on designated days, synchronizing with the PlanetScope satellite’s overpass, and captured photos of each boat. This allowed us to categorize boats in PlanetScope as BC, STB, and the “Others” category, which includes all non-SM boats such as cargo, fishing, pusher-puller, ferry, and passenger boats (). Besides field surveys, we used Google Earth images to understand boat metrics better. Recognizing individual boat shapes, colors, and patterns from field surveys and Google Earth images enabled the identification of individual boats in PlanetScope. After categorizing the boats in PlanetScope, we overlaid them onto corresponding Sentinel-1 images from the same date. This enabled us to discern the shapes and structures of individual boats in the Sentinel-1 images (), aiding in creating training datasets (Supplementary Text 4).
Table 1. Examples of the different boat types – BC, STB, and other – were identified from different sources: ground observations, Google Earth images, PlanetScope, and Sentinel-1. Ground observations and Google Earth images were pivotal in identifying boats within PlanetScope, facilitating the classification of boats in Sentinel-1. After identification in Sentinel-1, 1,364 boats were labeled as BC, 1,901 as STB, and 8,073 as other for developing training datasets.
2.4. Developing deep learning model for boat detection
2.4.1. Preparing training dataset
Our dataset preparation involves the following steps. First, we converted pre-processed Sentinel-1, originally in 32-bit float format, to 16-bit integers using the Linear (Slope-intercept) method. We experimented with other methods, such as Linear (95% clips) and Linear (Peak clips), and found that the Slope-intercept method provided the best results during the conversion process. Secondly, we divided large images into small patches with 640 pixels because this pixel-size patch is widely recommended for accurate and fast small object detection (Hass and Jokar Arsanjani Citation2020). Then, we used the Geospatial Data Abstraction Library (GDAL) Python package to transfer the image patches (tiff) into PNG format, which is compatible with our DL model. Lastly, we manually labeled each boat in these patches based on their shape and structure identified in section 2.2 using the LabelImg tool (Tzutalin Citation2015). We have annotated 1,111 image patches containing boat types ranging from 1 to 70, classified into three main categories: BC, STB, and Other ( & Supplementary Figure S1).
2.4.2. Deep learning model development
We employed a large version of YOLOv5l model, due to its unique blend of compact size and expedited processing speed, which surpassed other models in the YOLOv5 series (Jocher et al. Citation2021; Ren, Li, and Xu Citation2021). The YOLOv5l also demonstrated impressive performance on the COCO val2017 (Common Objects in Context) dataset, achieving an average precision of 72%, with a threshold of 0.5 (Lin et al. Citation2014). This model algorithm utilizes a Convolutional Neural Network (CNN) to identify objects within an image and comprises three components: Backbone, Neck, and Head (Jocher et al. Citation2021). The Backbone primarily extracts crucial features from the given input image, while the Neck utilizes PANet to create a feature pyramid network, aggregating the features and passing them to the Head for prediction. The Head generates predictions based on the anchor boxes for object detection.
In this paper, during model development, we fine-tuned the pre-trained weights of YOLOv5l (Ultralytics Citation2022). This pre-trained weight was initially trained on the COCO dataset, a large-scale object detection, segmentation, and captioning dataset. The main advantage of using pre-trained weights is establishing a solid benchmark for further fine-tuning, thus diminishing the requirement for massive datasets and extensive computational capacity (Hass and Jokar Arsanjani Citation2020). We randomly split the dataset into training (80%) and validation (20%) sets to optimize our DL model. The model was trained using batch sizes ranging from 16 to 32 over 100 to 1000 epochs, with all hyperparameter settings kept at their defaults. The final number of epochs and batch size were chosen based on fine-tuning, calibration, and validation results (Supplementary Text 5). To quantitatively evaluate model performance, we used five recognized metrics suitable for multi-class DL model assessment: Precision (P), Recall (R), F1 Score (F1), Mean Average Precision at 0.5 IoU ([email protected]), and mAP at IoU from 0.50 to 0.95 ([email protected]:0.95) ( & Supplementary Text 6 for details).
Table 2. Summary of metrics used in this research for evaluating the DL model performance.
2.5. River sand mining boats mapping and budget estimation
For our study, we exclusively focused on boats involved in SM, precisely the BC type, and excluded Boats with Pumps (BP), which pump sand from the riverbed, for several reasons. BPs have a significantly lower capacity, 20-30 m3/hr, compared to BCs; a BP takes about a day to collect 300 m3 of sand, while a BC can achieve this in approximately 3 hours (Huy Citation2017). BPs are primarily used for illegal mining (Truong Citation2022; Youth Citation2022); hence, they are smaller than BCs, enabling quick evasion and concealment from local authorities, usually operating at night and seldom staying long in one location. BPs are ineffective in rivers where the depth surpasses 8-9 m (Mecaflux Citation2023), and around 90% of the studied area has a river depth of over 9 m (Lau et al. Citation2023) (Supplementary Text 7 for details). STBs primarily function as sand transporters, moving sand from one location to another without contributing significantly to bathymetric change. Also, the STBs are widely used to transport other goods and materials between the VMD provinces, such as rice, fruits, etc., along the rivers. The mapping process for BC was conducted in the following steps (): Firstly, we automatically identified BC using the DL model and calculated their geographical coordinates (Supplementary Text 8). The geolocation points were then imported into ArcGIS to generate a boat density map, which helps identify SM hotspots within the VMD. To create the BC density map, a circular buffer with a radius of 200 m was utilized, as boat density calculated using a 200 m radius is well correlated with bathymetry changes (Gruel et al. Citation2022). Subsequently, the BC density map was interpolated to a spatial resolution of 120 m using the bilinear interpolation method.
Figure 2. The comprehensive methodological framework developed and utilized in this study.
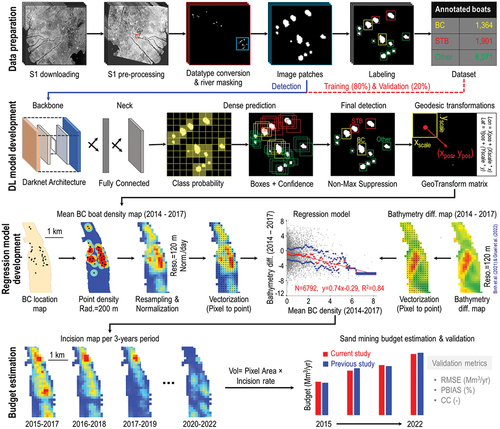
We plotted the corresponding values between bathymetry differences and BC density. We calculated the median bathymetry difference at each 0.1 BC density beam, from which a regression equation was derived. Although the VMD is influenced by various fluvial activities (Bendixen et al. Citation2019), including upstream dams that reduce sediment supply (Binh, Kantoush, and Sumi Citation2020; Lu, Kummu, and Oeurng Citation2014), we assumed that the bathymetry difference in our study primarily represents the incision depth due to excessive SM (Hackney et al. Citation2020) as other activities would result in the formation of gentle slopes and maintaining low erosion and lateral mobility. Our developed regression model enables us to estimate the riverbed incision rate based on daily BC density (1 image every six days), normalized every three years for each pixel. This regression model was applied between 2015 and 2022 in three-year intervals (2015–2017, 2016–2018 … 2020–2022, etc.) to estimate the BC density-driven incision rate. Using the equation below, we used these incision rates to estimate the total extraction volume for each three years. We then averaged overlapping values to attain an annual average (, Supplementary Table S3). Lastly, we validated our findings with previous research by applying well-established performance metrics such as Correlation Coefficient (CC), Percentage Bias (PBIAS), and Root Mean Square Error (RMSE). We also calculated the volume of sand extracted in different provinces using administrative borders for data scattering.
where, i denotes the pixel number in an incision map, T symbolizes the total number of pixels, incision ratei refers to the incision rate of pixel i in meters per three-year period, pixel areai represents the area of pixel i, (120 × 120 m2). c is a unit conversion factor (1,000,000).
3. Results and discussion
3.1. Deep learning model performance
Initially, the learning curve showed a steep drop, indicating rapid assimilation of the salient features within the dataset (). As training progressed, the rate of decrease slowed, and by 900 epochs, losses stabilized and reached a minimum of around 0.02 box, 0.01 objectness, and 0.002 classification, signifying successful model generalization and pattern learning beyond mere memorization of datasets. Learning curves across batch sizes of 16, 25, and 32 were consistent; however, the model with a batch of 16 exhibited the lowest loss, making it optimal for boat detection (), while larger batch sizes increased computational load without significant improvement. The model performance for each batch improved after 500 epochs and stabilized at 1,000 epochs (), implying the optimal epoch selection for small boat detection in Sentinel-1 imagery. The model with a batch of 16 consistently outperformed the others and achieved 96.0% [email protected] and 60% [email protected]:0.95 during training (). Hence, this model was chosen for further performance evaluation and boat mapping.
Figure 3. Deep Learning model performance evaluation. (a) Evolution of box, objectness, and classification loss functions of DL during the training and validation. The metrics presented in the graph enable a comparative analysis of the differences in learning curves during the training and validation. (b) A comparative analysis of model efficacy based on four evaluation metrics during training for three different batch sizes (16, 25, and 32). (c) Confusion matrix: illustrates the model’s performance trained with a batch of 16 on the validation dataset. (d) Precision-Recall curve: depicts the precision and recall trade-off for the DL model under the same training conditions (batch size 16).
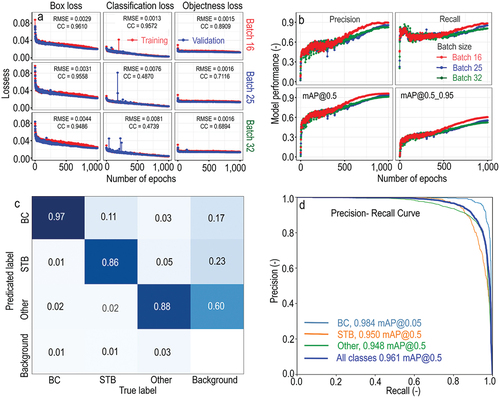
Our model demonstrated remarkable performance, accurately predicting the BC category in 97% of instances (). This attests to the proficiency of the model in reliably identifying BC instances. The model was correct 86% of the time for STB, although it mistakenly classified BC instances as STB in 11% of instances, signifying a minor overlap between these two classes. In the “Other” category, the model predicted accurately 88% of the time but misclassified as BC and STB in 3% and 5% of cases, respectively. However, it is essential to emphasize that this study primarily focuses on estimating large-scale SM budgets by mapping BC density. Therefore, the minor misclassifications amongst classes should not significantly impact our results. Our model achieved an overall mAP of 96.1% and 60.4% at IoU of 0.50 and 0.50_0.95 across all classes ( & Supplementary Table S2). For the BC, our primary focus, the PR curve indicated a high degree of precision and recall with a mAP of 98.4% and 69.6% at IoU of 0.5 and 0.50_0.95, respectively. This research’s outcomes significantly surpass previous studies’ findings (Kim et al. Citation2022; Zhang et al. Citation2022) in ship detection. According to Ultralytics (Citation2022), an [email protected]:0.95 above 50% is acceptable. Although the mAP precision reported in this study is superior to previous ones, there is still an opportunity for refinement and enhancement in model detection accuracy, achievable by expanding the number of datasets and optimizing the DL algorithms utilized. When examining P, R, and F1 scores at different confidence levels (Supplementary Figure S2-S4), our model excelled particularly in detecting the BC category, with Precision, Recall, and F1 values reaching 0.85, 0.88, and 0.91 for the BC category at 75% of IoU respectively.
3.2. Seasonal and inter-annual variability of sand mining activities
From 2014 to 2022, our model successfully identified a total of 256,647 boats (Supplementary Figure S5). Out of these, boats classified as BC made up 17.4% of the total detections. Approximately three-fourths of these BC were detected at a confidence level surpassing 0.85. STB comprised roughly 20.1% of the total detections, with 75% of them identified at a confidence level exceeding 0.72. The remaining 62.5% of boats were categorized as “Other,” detected with an average confidence of 0.76. Interestingly, the number of STB detections was slightly higher than BC, which corresponds with the expectation that STB should be more than BC since, on average, one BC can extract and load sand into 1–3 STBs. Field surveys and satellite imagery confirmed BC typically clusters with 1 to 3 STBs. Our model only identified solitary STB in the river, while those in clusters with BC were counted as a single BC due to the inherent difficulty in separating BC and STB at extraction sites. Counting STBs clustered with BC might raise their total, but this will not impact our budget estimation as it is independent of STB count (Hackney et al. Citation2021).
Our results indicate a statistically significant increase in the number of BC and STB (p < 0.05) over the last nine years (2014–2022) across the VMD, with an approximate growth rate of 0.04 boats per day (15 boats/yr) (). We also observed a significant increase in non-SM activities, averaging 44 boats/yr (p < 0.05). Furthermore, we found a significant decrease in SM operations from July to October, coinciding with the flood season that begins in July (). The dotted green line represents the water level at the Can Tho discharge station, located approximately 30 km from the mouth of the river (). Sand mining activities reach their lowest point in September when water levels surge above 80 cm from the mean sea level, despite water levels peaking in October. This discrepancy could have occurred because we recorded the water level at the downstream location of Can Tho, while SM took place across the entire VMD. Conversely, peak SM activities were recorded when the water level was at its lowest, around 25 cm, with the monthly BC count reaching 200. These findings highlight the significant influence of the water level on SM activities, particularly during the flood season when high water levels increase the energy requirements of SM and result in instability for BC and STB. Another notable observation from our study is a significant reduction in SM during December and February over the past nine years, potentially linked to the Christmas and Lunar New Year (LNY) holidays, which are major holidays in Vietnam (). During these holidays, work often ceases as people celebrate with their families. Our field survey along the entire VMD’s main rivers from January to February 2022 confirmed this.
Figure 4. Spatiotemporal dynamics and density of BC boats in the VMD (2014–2022): (a) Trends of BC, STB, and other boats over nine years. (b) Seasonal fluctuations in SM activities. (c) Average BC density map in the VMD from 2014 to 2022, created with a 200 m buffer at a 120 m resolution. (d,e) High BC density areas. (f-i). Tracing the evolution of zones exhibiting different boat densities over the nine years (2014–2022).
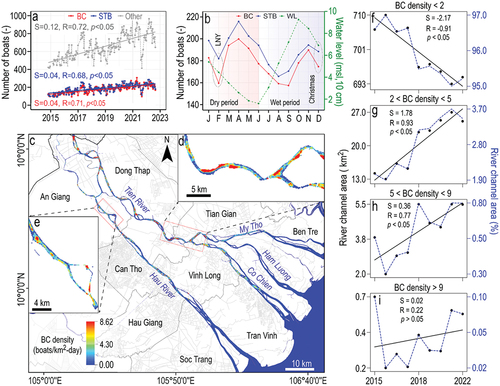
BC density map across the VMD exhibits significant spatial variability ranging from 0 to 8.62 boats/km2-day (). We have identified several major SM hotspots along the Cambodian border on the Tien River (). Intensive extraction sites were observed mainly in five provinces: An Giang, Dong Thap, Can Tho, Vinh Long, and Tien Giang, where the BC density exceeds 4 boats/km2-day. In provinces such as Soc Trang, Tra Vinh, and Ben Tre, the BC density was approximately 2 boats/km2-day or less, with most areas having a BC density of less than one boat/km2-day. These provinces are located near the river mouth, where the sand size is generally too fine for construction, mostly comprising silt and clay, possibly contributing to a decline in SM activities. By analyzing the trend of spatiotemporal dynamic BC density across the VMD (), we observed a significant decreasing trend in the area where BC density is less than 2 boats/km2-day with a slope of 2.17 km2/yr (R = −0.91, p < 0.05) over the last 9 years. This indicates that low SM areas are expanding into higher SM zones where the BC density exceeds 2 boats/km2-day. This finding is further supported by our analysis, which revealed a significant increasing trend in areas with BC density ranging from 2 to 5 boats/km2-day (), with a similar decreasing slope area where BC density is less than 2 boats/km2-day (R = 0.93, p < 0.05). It is worth noting that mining activities generally occur in groups, with typically 2 to 5 BC operating together, as evidenced by field surveys and remote sensing images. This trend suggests that areas with BC density lower than 2 boats/km2-day (710 km2 to 693 km2) are transitioning to BC density between 2 and 5 boats/km2-day (13 km2 to 27 km2). The areas with BC density ranging from 5 to 9 vary from 0.3% to 0.8% of the total area and display an increasing trend, although with a significantly lower slope (). This indicates that there is not much change in BC density in these areas. Similarly, areas with BC density exceeding 9 boats/km2-day show no significant changes and represent only 0.02% to 0.1% of the total area (). This implies that a BC density above 9 boats/km2-day is not economically or physically efficient for SM due to overcrowding, leading to congestion and decreased efficiency in the SM process.
3.3. Riverbed sand mining budget and validation across the Vietnamese Mekong Delta
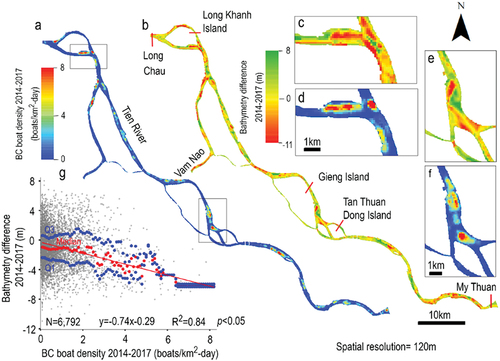
Upon mapping the incision rate against BC density for each pixel, we derived an R2 value of 0.84 for the median bathymetric difference (y = −0.74× − 0.29). This outcome corresponds to a median bathymetric difference of approximately −1.1 m for areas with boat densities fluctuating between 0 and 2 boats/km2-day (). The slope of the regression model, representing the relationship between bed incision and BC density, was statistically significant at a 95% confidence level (p < 0.05). Interestingly, for every additional boat/km2-day beyond the 2 boats/km2-day threshold, the median difference in bathymetry decreased by 1 m, indicating an increased incision of 1 m. Nevertheless, regions with boat densities exceeding 6 boat/km2-day displayed a comparable median incision of around −6 m. Upon contrasting the 2014–2017 period from 2020–2022 within the TS, BC density increased by approximately 65.4% on average, growing from 0.85 to 1.13 boats/km2-day. The variance within the lower range of BC density (<2 boats/km2-day) was notably higher than other ranges. This indicates that sand extraction is not significantly greater than sediment supply in these areas. In other words, the natural sediment supply balances out the sand extraction in these areas. Interestingly, these areas also exhibit significant deposition and riverbed incision. We hypothesize that various natural processes, such as tides, waves, storms, and floods, can induce changes in these areas, even with minimal SM.
Figure 5. Spatial regression model between bathymetry differences and BC density along the Tien Section from 2014–2017. (a,d,f) BC density (boats/km2-day). (b,c,e) Change in bathymetry throughout the same period. (g) A spatial correlation plot of BC density versus bathymetry difference at a 120 m resolution. Blue points correspond to the first Q1 and third Q3 quartiles, while the red point signifies the median of the bathymetry difference computed at each 0.1 increment of BC density.
Our study suggests that the VMD underwent a total mean incision of approximately 0.48 m in 8 years (2015–2022), with a rate of 0.053 m/yr (). This rate aligns with earlier studies (Gruel et al. Citation2022) (RMSE = 0.02 m, CC = 0.99, PBIAS = 6.73%). During this period, a significant volume of 365.86 Mm3 of sand was extracted, with an annual average of 45.73 Mm3 (, Supplementary Table S3–5). Extraction was predominantly concentrated in five provinces: Dong Thap, An Giang, Vinh Long, Tien Giang, and Can Tho (, Supplementary Table S5). These provinces collectively account for 326.97 Mm3, or 89.22%, of the total extraction volume in the VMD. Interestingly, provinces situated in the lower part of the VMD show lower extraction rates, totaling 39.41 Mm3. Dong Thap stands out for the most extensive SM, extracting 144.49 Mm3 of sand, or accounting for 39.5% of the total extraction. In contrast, Hau Giang reports the lowest rate, contributing to only 0.42% of the total extraction. The extraction rate has progressively increased from 2015 to 2022, with an average annual rise of 2.8 Mm3. Our SM budget was estimated at 34.92 Mm3 in 2015 and 53.26 Mm3 in 2022. When comparing our results with Gruel et al. (Citation2022), we found a correlation coefficient of 0.99, 2.65% PBIAS, and 2.75 RMSE values, demonstrating that our estimation aligns with prior research.
Figure 6. Sand volume extraction and riverbed incision rates. (a,b) Average incision rate across the VMD, with the provincial scatter and the average SM budget per district represented in varying shades of gray. (c) Comparison of the cumulative incision over the same period, paired with a statistical analysis in relation to prior research. (d) Comparison of the annual total extracted sand volume for the VMD with previous research, inclusive of statistical metrics and trend analysis. (e) Annual distribution of SM extraction across various districts within the VMD.
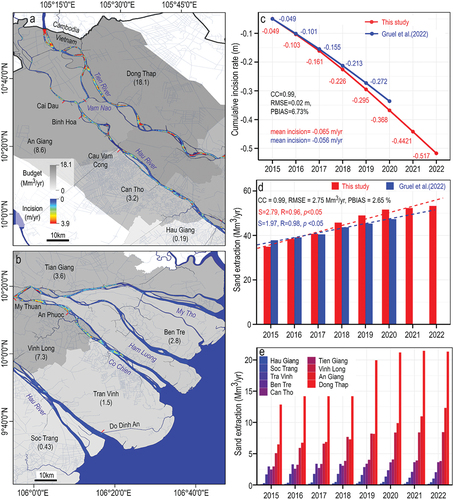
Examining the spatial-temporal dynamics of SM across the VMD over the past 8 years reveals distinctive patterns (, Supplementary Figure S6 &Table S5). Dong Thap, the province with the highest SM intensity, demonstrated a notable surge in sand extraction, peaking at 21.20 Mm3 in 2020—approximately 41% of that year’s extraction. This trend persisted until 2021, when a minor decline was noted, potentially due to the diversion of SM activities to the neighboring province, An Giang. While Dong Thap saw a steady increase in mining activities until 2017, An Giang experienced a decrease. However, by 2022, An Giang’s SM activities spiked to about 23% of total extraction, marking a significant increase of 16% in 2018. Other provinces, such as Tien Giang, Ben Tre, and Tra Vinh, situated on the Tien Riverside, reported a consistent decline in SM activities. This geographical shift in SM extraction is likely due to multiple factors. First, the availability of high-quality sand may have depleted due to dam construction and excessive SM (Räsänen et al. Citation2017), prompting a relocation of SM activities. Second, the sand particle size at the river mouth may have become too fine for construction purposes (Binh, Kantoush, and Sumi Citation2020; Collins and Dunne Citation1990), decreasing mining activities. Since the crux of SM is finding the balance between grain size and composition, mining too far upstream would waste time and money sorting the sediments, while downstream grains may be unsuitable (too rounded) (Rentier and Cammeraat Citation2022). Last, changes in regulatory rules and the number of licenses issued might have led to shifts in SM activities due to enhanced enforcement in different provinces in recent years (SIWRR Citation2013; AGPPC Citation2017; CTPPC Citation2018; DTPPC Citation2015).
3.4. Implications beyond the Mekong Delta: environmental impact, policy, and methodology
Our framework, which proficiently maps out current SM budgets accurately, is crucial for quantitatively understanding its environmental and societal impacts. Excessive SM can lead to an array of environmental issues such as riverbank instability, tidal dominance, saltwater intrusion, changes in flow regimes, disrupted flood frequency, ecosystem destabilization, decreased groundwater table, reduced aquifer recharge, degraded river water quality, ineffective irrigation systems, and loss of agricultural land and productivity (Anthony et al. Citation2015; Eslami et al. Citation2019; Loc et al. Citation2021; Park et al. Citation2020, Citation2022). Social issues, such as community displacement, livelihood disruption, health problems, infrastructure damage, and increased social inequality, could also arise (Loc et al. Citation2021; Tran et al. Citation2023). These environmental and social impacts have not been qualitatively understood due to the lack of accurate sand extraction rates. By quantifying sand extraction and comparing it to natural sediment replacement, we can more accurately measure the impact of SM. For example, Hackney et al. (Citation2020) estimated the annual average sand influx into the VMD at 6.18 ± 2.01 Mt/yr. Our estimates reveal a much higher annual average sand extraction rate of 69.28 Mt/yr (43.4 Mm3/yr, assuming a sand density of 1600 kg/m3, following Bravard et al. (Citation2013)). This suggests that current SM rates are about 11 times higher than the natural sediment replacement rate, which can create significant bed incisions and induce bank instability. Our budget estimate aids in mapping river depth and water level reduction due to mining. This data can be utilized as an input for various hydrodynamic and sediment transport models to quantify rates of bank and riverbed erosion, and information on decreased water levels can further assists in studies of salinity intrusion and groundwater fluctuations.
Additionally, our framework can automatically map near real-time SM activities and budgets at a low cost. By employing recent Sentinel-1 images, we can generate a BC density map (6–12 days) to understand the distribution of SM activities, irrespective of cloudy weather conditions. This information is a critical foundation for informed decision-making and effective resource management. As SM licenses are issued per province (AGPPC Citation2017; CTPPC Citation2018; DTPPC Citation2015; SIWRR Citation2013), we can directly compare the intensity of SM activities to the number of issued licenses within each province. For example, the Vietnamese government issued 13 licenses in Can Tho province for 2018–2020 (CTPPC Citation2018). If an outlier surge in activities is detected compared to the boat density map, the government can promptly dispatch teams to investigate, enabling consistent and proactive regulation enforcement. This curtails manpower requirements, transportation expenses, and related monitoring costs, resulting in an efficient and economical solution to manage SM activities. Our budget map also offers the opportunity to quantitatively assess the extent of illegal SM in the VMD at the provincial level by comparing the mapped extraction rates with government-issued licenses or permissible extraction rates set by the provincial government. For instance, in Dong Thap, a hotspot in the VMD, the government issued 22 licenses and set a total allowable rate of 18 Mm3/yr for 2015–2020 (DTPPC Citation2015). By comparing our calculated mining rate for Dong Thap in recent years (2020, 2021, and 2022) with the total allowable rate, we could quantify that the total extent of illegal SM in this province was 18%, 20%, and 19%, respectively. While illegal SM is a global issue increasingly recognized (Duan et al. Citation2019), current insufficient monitoring has led to substantial unreported annual sand losses, including US$4.1 billion in India (Mahadevan Citation2019), US$750 million in Cambodia (Sun Citation2016), and US$450 million in Indonesia (Yue-Choong Citation2006). Our framework is essential for identifying SM hotspots, enabling authorities to initiate monitoring efforts and potentially control illegal activities.
Lastly, our framework offers cost-effective benefits by utilizing publicly available remote sensing data and DL for SM monitoring. Notably, our framework’s geographical applicability can be extended to other rivers in Southeast Asia and even further, courtesy of publicly available Sentinel-1 imagery (Supplementary Figure S7) and satellite-driven bathymetry data. Many rivers in Southeast Asia, including Red in Vietnam (Phuong Citation2019) (Phuong, Citation2021), Irrawaddy in Myanmar (Gruel and Latrubesse Citation2021), and Progo and Jeneberang in Indonesia (Ikhsan, Rezanaldy, and Rozainy Citation2021; Kusumaningrum, Hafsari, and Syam Citation2021), face challenges with unregulated SM, highlighting the potential value of our framework. The utility of our framework extends beyond Southeast Asia as SM is also an issue in many rivers, including the Amazon and Paraíba do Sul in Brazil (Ferrer et al. Citation2021), Pearl, Yangtze, and Yellow in China (Lu et al. Citation2007), Son, Yamuna, Narmada, Hooghly, and Chambal in India (Roy, Agarwal, and Kumar Citation2023), and Congo, Masaani, and Kiungwani in Africa (Fröhlich Citation2017; Garzanti et al. Citation2019). These regions have extensive, unregulated SM, necessitating an assessment of its environmental and socioeconomic impacts. The adaptability of our framework makes it suitable for these diverse ecosystems, fostering a comprehensive, cost-effective approach to monitoring and managing SM operations. Overall, our framework stands as a robust, cost-effective instrument with significant global applicability potential in mapping SM activities.
4. Conclusions and final remarks
We developed a cost-effective RS-based DL framework for mapping SM activities and budgets in the VMD. Our DL model achieved 96.0% and 96.1% [email protected] during training and validation. Specifically, our main focus on the BC category had a mAP of 98.4% at IoU 0.5, showing the proficiency of the model in identifying BC. The results revealed a significant increase in BC and STB over time (p < 0.05), with a growth rate of 15 boats per year. BC density varied across the VMD, ranging from 0 to 8.62 boats/km2-day. Areas with BC density of less than 2 boats/km2-day showed a decreasing trend of 2.17 km2/yr (R = 0.91, p < 0.05) over 9 years. Areas with BC density of 2 to 5 boats/km2-day exhibited an increasing trend. From 2015 to 2022, a significant volume of 366 Mm3 of sand has been extracted in the VMD, averaging 45.73 Mm3 per year, resulting in a river incision rate of 0.053 m/yr.
Our framework demonstrates robustness and reliability in mapping SM budgets in large deltas, as evidenced by its successful application in the VMD. The VMD is among Southeast Asia’s largest and most heavily mined regions, sharing similarities with other Southeast Asian river deltas. The applicability of our framework extends beyond the VMD to other deltas globally facing excessive SM, as it overcomes challenges associated with traditional field-based surveys and provides a new and accurate baseline reference for monitoring SM budgets. This baseline will facilitate investigations into SM’s environmental and social impacts (e.g. riverbank collapse, infrastructure damage, saltwater intrusion, ecosystem destabilization, loss of agricultural land, and community displacement). Our research findings have significant policy implications for local and international governments, informing them about the extent and impacts of SM in southern Vietnam. This knowledge can help identify the scope of illegal mining, enabling authorities to enforce actions and establish regulatory frameworks for sustainable SM in the VMD.
Authorship contribution statement
Sonu Kumar: Conceptualization, methodology, Software, Data collection, Data processing and analysis, Visualization, Writing – original draft, Writing – review & editing. Edward Park: Conceptualization, Visualization, Supervision, Funding, Writing – original draft, Writing – review & editing. Dung Duc Tran. Data collection, Writing – original draft, Writing – Review & editing, Jingyu Wang: Conceptualization, Supervision, Huu Loc Ho: Data collection, Writing – review & editing. Lian Feng: Conceptualization, Sameh Kantoush: Data collection, Funding, Writing – review & editing Doan Van Binh: Data collection, Writing – review & editing, Dongfeng Li: Writing – review & editing. Adam D. Switzer: Conceptualization, Funding, Supervision, Writing – review & editing.
Supplementary_materials_Revised.docx
Download MS Word (1.7 MB)Acknowledgments
The authors also acknowledge the Education and Research Program of Planet and the Alaska Satellite Facility (ASF) for providing the high-resolution PlanetScope satellite imagery and the Sentinel-1 radar-based satellite imagery used in this research.
Disclosure statement
No potential conflict of interest was reported by the author(s).
Data availability statement
The datasets generated and analyzed during the current study can be requested by the corresponding author.
Supplementary material
Supplemental data for this article can be accessed online at https://doi.org/10.1080/15481603.2023.2285178
Additional information
Funding
References
- AGPPC. 2017. “Decision of Approval of Adjustment and Modification of Planning in the Survey, Exploitation, and Usage of Minerals in an Giang Province in the Period of 2008-2020 and Vision to 2030.” Accessed February 12, 2023. https://hethongphapluat.com/quyet-dinh-143-qd-ubnd-nam-2017-ve-phe-duyet-dieu-chinh-bo-sung-quy-hoach-tham-do-khai-thac-va-su-dung-khoang-san-tinh-an-giang-giai-doan-2008-2020-dinh-huong-den-nam-2030.html.
- Anthony, E. J., G. Brunier, M. Besset, M. Goichot, P. Dussouillez, and V. L. Nguyen. 2015. “Linking Rapid Erosion of the Mekong River Delta to Human Activities.” Scientific Reports 5 (1): 14745. https://doi.org/10.1038/srep14745.
- Asabonga, M., B. Cecilia, M. C., Mpundu, and N. M. D. Vincent. 2017. “The Physical and Environmental Impacts of Sand Mining.” Transactions of the Royal Society of South Africa 72 (1): 1–19. https://doi.org/10.1080/0035919X.2016.1209701.
- Bendixen, M., J. Best, C. Hackney, and L. L. Iversen, 2019. “Time is Running Out for Sand.” Nature 571 (7763): 29–31. https://doi.org/10.1038/d41586-019-02042-4.
- Best, J. 2019. “Anthropogenic Stresses on the World’s Big Rivers.” Nature Geoscience 12 (1): 7–21. https://doi.org/10.1038/s41561-018-0262-x.
- Binh, D. V. S., Kantoush, and T. Sumi. 2020. “Changes to Long-Term Discharge and Sediment Loads in the Vietnamese Mekong Delta Caused by Upstream Dams.” Geomorphology 353:107011. https://doi.org/10.1016/j.geomorph.2019.107011.
- Binh, D. V., S. A. Kantoush, T. Sumi. N. P. Mai, T. A. Ngoc, L. V. Trung, and T. D. An. 2021. “Effects of Riverbed Incision on the Hydrology of the Vietnamese Mekong Delta.” Hydrological Processes 35 (2): e14030. https://doi.org/10.1002/hyp.14030.
- Bravard, J.-P., M. Goichot, and S. Gaillot, 2013. “Geography of Sand and Gravel Mining in the Lower Mekong River. First Survey and Impact Assessment.” EchoGéo (26). https://doi.org/10.4000/echogeo.13659.
- Brunier, G., E. J. Anthony, M. Goichot, M. Provansal, and P. Dussouillez 2014. “Recent Morphological Changes in the Mekong and Bassac River Channels, Mekong Delta: The Marked Impact of River-Bed Mining and Implications for Delta Destabilisation.” Geomorphology 224:177–191. https://doi.org/10.1016/j.geomorph.2014.07.009.
- Chang, Y.-L., A. Anagaw, L. Chang, Y. C. Wang, C.-Y. Hsiao, and W.-H. Lee. 2019. “Ship Detection Based on YOLOv2 for SAR Imagery.” Remote Sensing 11 (7): 786. https://doi.org/10.3390/rs11070786.
- Collins, B., and T. Dunne, 1990. Fluvial Geomorphology and River-Gravel Mining: A Guide for Planners, Case Studies Included. Vol. 98. California Department of Conservation, Division of Mines and Geology.
- Cressie, N. 2015. Statistics for Spatial Data. John Wiley and Sons.
- CTPPC. 2018. “Decision of Approval of Planning in the Survey, Exploitation, and Usage of Minerals in Can Tho City Until 2020 and Vision to 2030.” Accessed January 12, 2023. https://thuvienphapluat.vn/van-ban/Tai-nguyen-Moi-truong/Quyet-dinh-44-QD-UBND-2018-Quy-hoach-tham-do-khai-thac-su-dung-khoang-san-Can-Tho-den-2020-379526.aspx.
- DTPPC. 2015. “Decision of Approval of Adjustment and Modification of Planning in the Survey, Exploitation, and Usage of Minerals (River Sand) in Dong Thap Province Until 2020.” chrome-extension://efaidnbmnnnibpcajpcglclefindmkaj/https://stnmt.dongthap.gov.vn/Uploads/File/Quyet%20dinh/1472QD-UB2015HC_TfN6CPeqKY.pdf.
- Duan, H., Z. Cao, M. Shen, D. Liu, and Q. Xiao. 2019. “Detection of Illicit Sand Mining and the Associated Environmental Effects in China’s Fourth Largest Freshwater Lake Using Daytime and Nighttime Satellite Images.” Science of the Total Environment 647:606–618. https://doi.org/10.1016/j.scitotenv.2018.07.359.
- Dugan, P. J., C. Barlow, A. A. Agostinho, E. Baran, G. F. Cada, D. Chen, I. G. Cowx, J. W. Ferguson, T. Jutagate, and M. Mallen-Cooper. 2010. “Fish Migration, Dams, and Loss of Ecosystem Services in the Mekong Basin.” Ambio 39 (4): 344–348. https://doi.org/10.1007/s13280-010-0036-1.
- Eslami, S., P. Hoekstra, N. Nguyen Trung, S. Ahmed Kantoush, D. Van Binh, D. Duc Dung, T. Tran Quang, and M. van der Vegt. 2019. “Tidal Amplification and Salt Intrusion in the Mekong Delta Driven by Anthropogenic Sediment Starvation.” Scientific Reports 9 (1): 18746. https://doi.org/10.1038/s41598-019-55018-9.
- Ferrer, L. M., D. A., Rodriguez, M. C, Forti, and F. Carriello. 2021. “The Anthropocene Landscape and Ecosystem Services in the Closure of Sand Mining: Paraíba do Sul River Basin–Brazil.” Resources Policy 74:102405. https://doi.org/10.1016/j.resourpol.2021.102405.
- Fritts, R. 2019. “The World Needs to Get Serious About Managing Sand, UN Report Says.” Science. https://doi.org/10.1126/science.aay0017.
- Fröhlich, S. 2017. “Sand Mining Decimates African Beaches.” Accessed August 20, 2023. https://www.dw.com/en/sand-mining-decimates-african-beaches/a-37546330.
- Garzanti, E., P. Vermeesch, G. Vezzoli, S. Andò, E. Botti, M. Limonta, P. Dinis, A. Hahn, D. Baudet, and J. De Grave. 2019. “Congo River Sand and the Equatorial Quartz Factory.” Earth Science Review 197:102918. https://doi.org/10.1016/j.earscirev.2019.102918.
- Geng, X., L. Shi, J. Yang, P. Li, L. Zhao, W. Sun, and J. Zhao. 2021. “Ship Detection and Feature Visualization Analysis Based on Lightweight CNN in VH and VV Polarization Images.” Remote Sensing 13 (6): 1184. https://doi.org/10.3390/rs13061184.
- Gruel, C. R., and E. M. Latrubesse, 2021. “A Monitoring System of Sand Mining in Large Rivers and Its Application to the Ayeyarwady (Irrawaddy) River, Myanmar.” Water 13 (17): 2331. https://doi.org/10.3390/w13172331.
- Gruel, C.-R., E. Park, A. D. Switzer, S. Kumar, H. L. Ho, S. Kantoush, D. Van Binh, and L. Feng. 2022. “New Systematically Measured Sand Mining Budget for the Mekong Delta Reveals Rising Trends and Significant Volume Underestimations.” International Journal of Applied Earth Observation and Geoinformation 108:102736. https://doi.org/10.1016/j.jag.2022.102736.
- GSO. 2022. “General Statistics Office: Agriculture, Forestry and Fisheries.” https://www.gso.gov.vn/nong-lam-nghiep-va-thuy-san/.
- Hackney, C. R., S. E., Darby, Parsons, J. Leyland, J. L Best, R. Aalto, A. P. Nicholas, and R. C. Houseago. 2020. “River Bank Instability from Unsustainable Sand Mining in the Lower Mekong River.” Nature Sustainability 3 (3): 217–225. https://doi.org/10.1038/s41893-019-0455-3.
- Hackney, C. R., G. Vasilopoulos, S. Heng, V. Darbari, S. Walker, and D. R. Parsons, 2021. “Sand Mining Far Outpaces Natural Supply in a Large Alluvial River.” Earth Surface Dynamics 9 (5): 1323–1334. https://doi.org/10.5194/esurf-9-1323-2021.
- Hass, F. S., and J. Jokar Arsanjani, 2020. “Deep Learning for Detecting and Classifying Ocean Objects: Application of YoloV3 for Iceberg–Ship Discrimination.” ISPRS International Journal of Geo-Information 9 (12): 758. https://doi.org/10.3390/ijgi9120758.
- Huy, N. H. T. 2017. “Each Sand Dredger Earns Hundreds of Millions of Dong Every Day.” CAND. Accessed September 23, 2023. https://cand.com.vn/dieu-tra-theo-don-ban-doc/Ky-2-Moi-tau-hut-cat-kiem-ca-tram-trieu-dong-moi-ngay-i431457/.
- Ikhsan, J., A. Rezanaldy., and M. Z. M. R. Rozainy, 2021. “Analysis of Sand Mining Impacts on Riverbed in the Downstream of the Progo River, Indonesia.” IOP Conference Series: Materials Science & Engineering 1144 (1): 012065. https://doi.org/10.1088/1757-899X/1144/1/012065.
- Jafarzadeh, H., M. Mahdianpari, S. Homayouni, F. Mohammadimanesh, and M. Dabboor. 2021. “Oil Spill Detection from Synthetic Aperture Radar Earth Observations: A Meta-Analysis and Comprehensive Review.” GIScience & Remote Sensing 58 (7): 1022–1051. 10.1080/15481603.2021.1952542
- Jocher, G., A. Stoken, A. Chaurasia, J. Borovec, Y. Kwon, K. Michael, L. Changyu, J., Fang, P, Skalski, and A. Hogan. 2021. “Ultralytics/Yolov5: V6. 0-YOLOv5n’Nano’models, Roboflow Integration, TensorFlow Export, OpenCv DNN Support.” Zenodo.
- Jordan, C., J. Tiede O., Lojek, J., Visscher, H. Apel, H. Q., Nguyen, C. N. X. Quang, and T. Schlurmann 2019. “Sand Mining in the Mekong Delta Revisited-Current Scales of Local Sediment Deficits.” Scientific Reports 9 (1): 17823. https://doi.org/10.1038/s41598-019-53804-z.
- Kim, J.-H., N. Kim, Y. W., Park, and C. S., Won 2022. “Object Detection and Classification Based on YOLO-V5 with Improved Maritime Dataset.” Journal of Marine Science and Engineering 10 (3): 377. https://doi.org/10.3390/jmse10030377.
- Kusumaningrum, D., T. A. Hafsari, and L. Syam, 2021. “Sand and the City: The Historical Geography of Sand Mining in Jeneberang River and Its Relation to Urban Development in South Sulawesi.” ETNOSIA: Jurnal Etnografi Indonesia 6 (2): 200–216. https://doi.org/10.31947/etnosia.v6i2.17918.
- Lau, S. R. Y., E. Park, D. D. Tran, and J. Wang, 2023. “Recent Intensification of Riverbed Mining in the Mekong Delta Revealed by Extensive Bathymetric Surveying.” Canadian Journal of Fisheries and Aquatic Sciences 626:130174. https://doi.org/10.1016/j.jhydrol.2023.130174.
- Lin, T.-Y., M. Maire, S. Belongie, J. Hays, P. Perona, D. Ramanan, P. Dollár, and C L., Zitnick. 2014. “Microsoft Coco: Common Objects in Context.” Computer Vision–ECCV 2014: 13th European Conference, Zurich, Switzerland, September 6-12, 2014, Proceedings, Part V 13.
- Loc, H. H. N. T. H. Diep, N. T. Can, K. N. Irvine, and Y. Shimizu. 2017. “Integrated Evaluation of Ecosystem Services in Prawn-Rice Rotational Crops, Vietnam.” Ecosystem Services 26:377–387. https://doi.org/10.1016/j.ecoser.2016.04.007.
- Loc, H. H. D. Van Binh, E., Park S., Shrestha, T. D., Dung, V. H., Son, N. H. T., Truc, N. P. Mai, and C. Seijger. 2021. “Intensifying Saline Water Intrusion and Drought in the Mekong Delta: From Physical Evidence to Policy Outlooks.” Science of the Total Environment 757:143919. https://doi.org/10.1016/j.scitotenv.2020.143919.
- Ludacer, R. 2018. “The World is Running Out of Sand-And There’sa Black Market for It Now.” Business Insider.
- Lu, X., M. Kummu, and C. Oeurng. 2014. “Reappraisal of Sediment Dynamics in the Lower Mekong River, Cambodia.” Earth Surface Processes and Landforms 39 (14): 1855–1865. https://doi.org/10.1002/esp.3573.
- Lu, X., S. Zhang, S. Xie, and P. Ma 2007. “Rapid Channel Incision of the Lower Pearl River (China) Since the 1990s as a Consequence of Sediment Depletion.” Hydrology and Earth System Sciences 11 (6): 1897–1906. https://doi.org/10.5194/hess-11-1897-2007.
- Mahadevan, P. 2019. “Sand Mafias in India.” Disorganized Crime in a Growing Economy.
- Matheron, G. 1963. “Principles of Geostatistics.” Economic Geology 58 (8): 1246–1266. https://doi.org/10.2113/gsecongeo.58.8.1246.
- Ma, Y. Z, Zhen., F, Li. F., Feng, and Y, Zhao. 2023. “An Innovative Lightweight 1D-CNN Model for Efficient Monitoring of Large-Scale Forest Composition: A Case Study of Heilongjiang Province, China.” GIScience & Remote Sensing 60 (1). https://doi.org/10.1080/15481603.2023.2271246.
- Mecaflux. 2023. “Max Height Suction Pump Cavitation and NPSH.” Accessed September 23, 2023. https://www.mecaflux.com/en/hauteur_aspiration.htm.
- Miatto, A., H. Schandl, T. Fishman, and H. Tanikawa. 2017. “Global Patterns and Trends for Non‐Metallic Minerals Used for Construction.” Journal of Industrial Ecology 21 (4): 924–937. https://doi.org/10.1111/jiec.12471.
- Monteiro, P. J., S. A. Miller, and A., Horvath 2017. “Towards Sustainable Concrete.” Nature Materials 16 (7): 698–699. https://doi.org/10.1038/nmat4930.
- Moskolaï, W. R., W. Abdou, A. Dipanda, and Kolyang. 2022. “A Workflow for Collecting and Preprocessing Sentinel-1 Images for Time Series Prediction Suitable for Deep Learning Algorithms.” Geomatics 2 (4): 435–456. https://doi.org/10.3390/geomatics2040024.
- MRC. 2023. “Mekong River Monitoring and Forecasting.” Accessed September 29, 2023. https://www.mrcmekong.org/.
- Padmalal, D., K. Maya, S. Sreebha, and R. Sreeja 2008. “Environmental Effects of River Sand Mining: A Case from the River Catchments of Vembanad Lake, Southwest Coast of India.” Environmental Geology 54 (4): 879–889. https://doi.org/10.1007/s00254-007-0870-z.
- Park, E., H. L. Ho, D. D. Tran, X. Yang, E. Alcantara, E. Merino, and V. H. Son. 2020. “Dramatic Decrease of Flood Frequency in the Mekong Delta Due to River-Bed Mining and Dyke Construction.” Science of the Total Environment 723:138066. https://doi.org/10.1016/j.scitotenv.2020.138066.
- Park, E., H. H. Loc, D. Van Binh, and S. Kantoush. 2022. “The Worst 2020 Saline Water Intrusion Disaster of the Past Century in the Mekong Delta: Impacts, Causes, and Management Implications.” Ambio 51 (3): 691–699. https://doi.org/10.1007/s13280-021-01577-z.
- Paul, S., S. Batra, K. Mohiuddin, M. N. Miladi, D. Anand, and A. Nasr. 2022. “A Novel Ensemble Weight-Assisted Yolov5-Based Deep Learning Technique for the Localization and Detection of Malaria Parasites.” Electronics 11 (23): 3999. https://doi.org/10.3390/electronics11233999.
- Peduzzi, P. 2014. “Sand, Rarer Than One Thinks.” Environmental Development 11 (208–218): 682.
- Phuong, H. 2019. “Authorities Apathetic as Red River is Sand-Mined to Death.” VnExpress International. https://e.vnexpress.net/news/news/authorities-apathetic-as-red-river-is-sand-mined-to-death-3982914.html.
- Piman, T., and M., Shrestha 2017. Case Study on Sediment in the Mekong River Basin: Current State and Future Trends. Stockholm, Sweden: Stockholm Environment Institute.
- Räsänen, T. A., P. Someth, H. Lauri, J. Koponen, J. Sarkkula, and M. Kummu. 2017. “Observed River Discharge Changes Due to Hydropower Operations in the Upper Mekong Basin.” Canadian Journal of Fisheries and Aquatic Sciences 545:28–41. https://doi.org/10.1016/j.jhydrol.2016.12.023.
- Rashid, K., and S., Nazir 2018. “A Sustainable Approach to Optimum Utilization of Used Foundry Sand in Concrete.” Science and Engineering of Composite Materials 25 (5): 927–937. https://doi.org/10.1515/secm-2017-0012.
- Ren, Y., X. Li, and H. Xu 2021. “A Deep Learning Model to Extract Ship Size from Sentinel-1 SAR Images.” IEEE Transactions on Geoscience and Remote Sensing 60:1–14. https://doi.org/10.1109/TGRS.2021.3063216.
- Rentier, E., and L. Cammeraat. 2022. “The Environmental Impacts of River Sand Mining.” Science of the Total Environment 838:155877. https://doi.org/10.1016/j.scitotenv.2022.155877.
- Roy, P., S., Agarwal, and A., Kumar. 2023. “These Satellite Images of Indian Rivers Highlight Environmental Impacts of Sand Mining.” https://www.downtoearth.org.in/news/mining/these-satellite-images-of-indian-rivers-highlight-environmental-impacts-of-sand-mining-88868.
- SIWRR. 2013. “Study on the Impacts of Sand-Mining Activities on Riverbed Changes in the Mekong Rivers (The Tien and the Hau) and Proposed Solutions in Management and Suitable Exploitation Planning.” Accessed January 10, 2023. http://www.siwrr.org.vn/?id=30.
- Smigaj, M., C. R. Hackney, P. K. Diem, N. T. Ngoc, D., Du Bui, S. E., Darby, and J., Leyland. 2023. “Monitoring Riverine Traffic from Space: The Untapped Potential of Remote Sensing for Measuring Human Footprint on Inland Waterways.” Science of the Total Environment 860:160363. https://doi.org/10.1016/j.scitotenv.2022.160363.
- Sun, H. 2016. “Sand Storm: $750 Million Worth of the Material is Unaccounted for in Cambodia. Radio Free Asia.” Radio Free Asia. Accessed July 05, 2023. https://www.rfa.org/english/news/cambodia/sand-storm-11022016160124.html.
- Sverdrup, H. U., D. Koca, and P. Schlyter. 2017. “A Simple System Dynamics Model for the Global Production Rate of Sand, Gravel, Crushed Rock and Stone, Market Prices and Long-Term Supply Embedded into the WORLD6 Model.” BioPhysical Economics and Resource Quality 2 (2): 1–20. https://doi.org/10.1007/s41247-017-0023-2.
- Taylor, T. 2019. “Global Perspective on Markets for Sand.” Accessed July 05, 2023. https://conversableeconomist.blogspot.com/2019/07/global-markets-for-sand.html.
- Torres, A., Brandt, J., Lear, K., and Liu, J. 2017. “A Looming Tragedy of the Sand Commons.” Science 357 (6355): 970–971. https://doi.org/10.1126/science.aao0503.
- Torres, A., M. U., Simoni, J. K. Keiding, D. B. Müller, S. O. Zu Ermgassen, J. Liu, J. A. Jaeger, M., Winter, and E. F. Lambin. 2021. “Sustainability of the Global Sand System in the Anthropocene.” One Earth 4 (5): 639–650. https://doi.org/10.1016/j.oneear.2021.04.011.
- Tran, D. D., N. D. Thien, K. W., Yuen R. Y. S., Lau, J. Wang, and E. Park 2023. “Uncovering the Lack of Awareness of Sand Mining Impacts on Riverbank Erosion Among Mekong Delta Residents: Insights from a Comprehensive Survey.” Scientific Reports 13 (1): 15937. https://doi.org/10.1038/s41598-023-43114-w.
- Truong, N. 2022. “Caught Red-Handed Many Illegal Sand Dredging Boats on Tien River.” Accessed September 23, 2023. https://vov.vn/phap-luat/bat-qua-tang-nhieu-tau-hut-cat-trai-phep-tren-song-tien-post987170.vov.
- Tuyen, D. 2023. “Sand Crisis in Mekong Delta.” Thanhnien. https://thanhnien.vn/khung-hoang-cat-o-dong-bang-song-cuu-long-18523070400213621.htm.
- Tzutalin, D. 2015. “tzutalin/labelImg.” Github.
- Ultralytics. 2022. “YOIOv5.Git Code.” https://github.com/ultralytics/yolov5.
- UNEP. 2019. “United Nations Environment Programme, 2019.” https://www.unep.org/annualreport/2019/index.php.
- Van Etten, A. 2019. “Satellite Imagery Multiscale Rapid Detection with Windowed Networks.” 2019 IEEE Winter Conference on Applications of Computer Vision (WACV).
- Walling, D. E. 2011. “Human Impact on the Sediment Loads of Asian Rivers.” Sediment Problems and Sediment Management in Asian River Basins 349:37–51.
- Wang, Y., C. Wang, H. Zhang, Y. Dong, and S. Wei. 2019. “A SAR Dataset of Ship Detection for Deep Learning Under Complex Backgrounds.” Remote Sensing 11 (7): 765. https://doi.org/10.3390/rs11070765.
- Witness, G. 2010. “Shifting Sand: How Singapore’s Demand for Cambodian Sand Threatens Ecosystems and Undermines Good Governance.” chrome-extension://efaidnbmnnnibpcajpcglclefindmkaj/https://cdn2.globalwitness.org/archive/files/pdfs/shifting_sand_final.pdf.
- Youth. 2022. “Sand Bandits’ Threaten My Thuan Bridge: People and Businesses Ask for Help Everywhere.” Thanhnien. Accessed September 23, 2023. https://thanhnien.vn/cat-tac-de-doa-cau-my-thuan-nguoi-dan-doanh-nghiep-cau-cuu-khap-noi-1851453124.htm.
- Yue-Choong, K. 2006. Environmental Management and Conflict in Southeast Asia: Land Reclamation and Its Political Impact. JSTOR.
- Yu, X., X., Wu, C. Luo, and P. Ren. 2017. “Deep Learning in Remote Sensing Scene Classification: A Data Augmentation Enhanced Convolutional Neural Network Framework.“ GIScience & Remote Sensing 54 (5): 741–758. https://doi.org/10.1080/15481603.2017.1323377.
- Zhang, X., M. Yan, D. Zhu, and Y. Guan 2022. “Marine Ship Detection and Classification Based on YOLOv5 Model.” Journal of Physics Conference Series 2181 (1): 012025. https://doi.org/10.1088/1742-6596/2181/1/012025.
- Zou, W., K. T. Tolonen, G. Zhu, B. Qin, Y. Zhang, Z. Cao, K. Peng, Y. Cai, and Z. Gong. 2019. “Catastrophic Effects of Sand Mining on Macroinvertebrates in a Large Shallow Lake with Implications for Management.” Science of the Total Environment 695:133706. https://doi.org/10.1016/j.scitotenv.2019.133706.