
 ?Mathematical formulae have been encoded as MathML and are displayed in this HTML version using MathJax in order to improve their display. Uncheck the box to turn MathJax off. This feature requires Javascript. Click on a formula to zoom.
ABSTRACT
Satellite datasets have revealed significant greening and soil drying in arid Central Asia. However, the influence mechanism of vegetation and climate on soil moisture dynamics is still unclear. In this study, we investigated the spatiotemporal consistency of vegetation and soil moisture changes, examined the controlling factors of soil moisture under different vegetation indices (normalized differential vegetation index, NDVI; leaf area index, LAI), and explored the time lag and accumulation effects of vegetation greening on the soil moisture in arid Central Asia in the period of 1985 to 2020. The results showed that the co-occurrence of vegetation greening and soil drying in 30.4% (NDVI) and 19.4% (LAI) of the study area spatially. Temporally, the soil moisture increased from 1985 to 1989, but decreased from 1989 or 1990 to 2020. In contrast, vegetation activity increased continuously during 1985–2020. Precipitation accounted for the most variance of the soil moisture. The vegetation greenness demonstrated positive correlations with soil moisture, representing 20.7% (for NDVI) and 39.3% (for LAI) of vegetated areas (areas with long-term mean NDVI ≥ 0.1 and LAI > 0), while negative correlations were observed in only 5.4% (for NDVI) and 3.3% (for LAI) of vegetated areas, respectively. Soil moisture exhibited varying time lag and accumulation effects in response to different vegetation indices, precipitation, and temperature. The main temporal effects of NDVI and temperature were simultaneous changes with no time lag or accumulation effects on soil moisture. In contrast, the main temporal effects of LAI and precipitation included 1-month lag in their influence on soil moisture. Considering the inconsistencies in spatiotemporal patterns between vegetation and soil moisture, as well as the dominance and time lag effects of precipitation on soil moisture variations, we concluded that climate, especially precipitation, rather than vegetation greening, regulates soil moisture in Central Asia. These findings provide a scientific basis for vegetation restoration or regional water resource management in drylands.
1. Introduction
Drylands cover approximately 41% of the Earth’s land surface (Li et al. Citation2021; Lan et al. Citation2022). They are characterized by water scarcity in a fragile ecological environment. As one of the most sensitive regions to global climate change, drylands have a warming rate that exceeds the global average (Zhang, Zhang et al. Citation2023). Since the 1980s, drylands have experienced significant vegetation greening on a global scale (Burrell, Evans, and De Kauwe Citation2020; Fensholt et al. Citation2012; Piao et al. Citation2020; Du et al. Citation2022). In light of the greening, the surface reflectance, water distribution, and heat changed, thereby influencing the Earth’s energy budget and water cycle (Lu et al. Citation2018; Zeng et al. Citation2017; Citation2018). Soil moisture plays a vital role in hydrological processes, energy conversion, climate change, and ecological dynamics (Choi and Jacobs Citation2007; Parajka et al. Citation2006; Stocker et al. Citation2019). It serves as a crucial link between precipitation, surface runoff, groundwater recharge, and vegetation dynamics, influencing hydrological interactions and climate fluctuations (Rodriguez-Iturbe Citation2000). Vegetation greening has an important impact on both the inflow and outflow of soil moisture, resulting in increased uncertainty in soil moisture changes (Lu et al. Citation2018; Zeng, Peng, and Piao Citation2018; Zhang et al. Citation2015). This, in turn, affects the global terrestrial water cycle process (Zhang, Keenan, and Zhou Citation2021). Therefore, it is of great significance to clarify the impact of vegetation greening on soil moisture changes, especially in drylands characterized by water scarcity.
Satellite remote sensing is an important tool in elucidating the role of drylands within the broader Earth system, particularly in improving global dryland data availability (Smith et al. Citation2019). It offers significant advantages over traditional ground-based methods, including cost-effective coverage of vast areas, the ability to monitor remote and inaccessible regions, and data acquisition at various resolutions (Wang, Wu et al. Citation2023; Wang, Zhen et al. Citation2023). The development of remote sensing provides extensive data to monitor dryland ecosystems across different spatiotemporal scales, creating opportunities for enhanced high-quality observations in arid regions (Smith et al. Citation2019). These include widely used vegetation indices such as the normalized differential vegetation index (NDVI) and leaf area index (LAI), which effectively characterize vegetation canopy structure and function (Bai et al. Citation2022). Furthermore, products such as the Soil Moisture Active Passive (SMAP) (Entekhabi et al. Citation2010) and the European Space Agency’s (ESA) Climate Change Initiative (CCI) (Liu et al. Citation2011) have been extensively employed to assess soil moisture variations, overcoming the limitations of sparsely distributed ground-based measurement stations. Image registration (Ren et al. Citation2023) and image fusion (Zhou, Sun et al. Citation2022; Sun et al. Citation2022) techniques effectively balance spatial and temporal resolutions in various remote sensing data, providing efficient solutions for integrating data synergistically. These approaches can generate more products, such as the spatiotemporal fusion microwave remote sensing products derived from CCI and SMAP (Jiang et al. Citation2019). Dryland ecosystems exhibit stronger spatiotemporal variability in vegetation and soil moisture compared to other ecosystems (Song et al. Citation2017; Zhang et al. Citation2020). Despite the growing amount of available data, local-scale variations in soil properties, topography, and land cover types make capturing accurate and representative measurements challenging (Goward, Xue, and Czajkowski Citation2002).
Numerous studies have examined the relationship between vegetation greening and soil moisture changes (Zhang, Wei et al. Citation2022; Zhang, Zhang et al. Citation2023; Chen et al. Citation2007; Deng et al. Citation2020; Li et al. Citation2022; Lian et al. Citation2020). However, four key challenges persist. First, there has been a lack of discussion regarding the consistency of their temporal and spatial trends, although lots of attention has been given to the temporal or spatial correlation between vegetation changes and soil moisture (Chen et al. Citation2007; Meng et al. Citation2022). It is crucial to clarify the spatial consistency of greening and soil drying, as well as the synchronicity of their variations, to comprehensively understand their relationship (Deng et al. Citation2020). Second, the influence factors, other than soil moisture and vegetation greening, were not separated (Deng et al. Citation2020), and areas where vegetation did not change (or degraded) were not excluded (Meng et al. Citation2022), when exploring the relationship between soil moisture and vegetation greening. This can lead to either overestimation or underestimation of the observed correlation. Third, the temporal effects of soil moisture on vegetation growth response vary across different scales (Li et al. Citation2022; Lian et al. Citation2020; Zhang, Wei et al. Citation2022). An increasing number of studies have revealed the potential time-dependent effects in vegetation response to soil moisture (Zhang, Wei et al. Citation2022), such as time lags and time accumulations (Ma et al. Citation2023). The specific temporal effects of soil moisture on vegetation response in arid Central Asia require additional research. Lastly, the differences in impacts of NDVI and LAI on soil moisture are not clear, as they may differ in characterizing the vegetation trends over time and space (Bai et al. Citation2022). Because of the aforementioned four challenges, the specific contribution of vegetation greening to soil moisture, particularly in drylands, remains an unanswered question.
Central Asia, situated among the largest drylands in the Northern Hemisphere, is dominated by mountains and deserts (Zhu et al. Citation2019). Over the past decades, this area has experienced significant climate changes. Temperature has risen rapidly since the mid-1990s, exceeding historical records (Davi et al. Citation2015; Du et al. Citation2015). Precipitation patterns have varied in different regions, with an increase in Xinjiang, China, and a decrease outside of China (Du et al. Citation2015; Jiang et al. Citation2017). During this period, vegetation activity has increased (Du et al. Citation2015; Jiang et al. Citation2017), while soil moisture has declined (Li et al. Citation2015). However, the precise association between vegetation greening and soil moisture drying in this area remains uncertain, exacerbated by the persistence of the four aforementioned challenges that are inherent to this region.
In this study, we explored spatiotemporal variations in the relationship between vegetation greenness (NDVI and LAI) and soil moisture in Central Asia with the following aims. First, we assessed the spatiotemporal consistency of vegetation greenness and soil moisture changes. Second, we decoupled the interaction between precipitation, temperature and vegetation greenness to disentangle the influence of each factor on soil moisture. Third, we determined the time lag and time accumulation effects of vegetation greenness on soil moisture under climate change.
2. Materials and methods
2.1. Study area and datasets
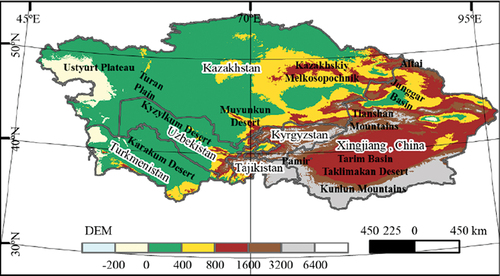
Central Asia (46°25´- 96°50´E, 34°25´- 55°50´N) is situated in the heartland of the Eurasian continent and comprises Kazakhstan, Kyrgyzstan, Tajikistan, Turkmenistan, and Uzbekistan, as well as the Xinjiang Uygur Autonomous Region in Northwest China (Deng and Chen Citation2017; Zhang, Luo et al. Citation2023). It is a vast region situated in the heart of the Asian continent, spanning from the northern reaches of Russia to the southern edge of Siberia, and it is bounded by the Caspian Sea to the west and China to the east (Jiang et al. Citation2017). Covering an area of approximately 5.67 million km2. To the east, the towering Altai, Kunlun, Tianshan, and Pamir mountain ranges dominate the landscape, while to the north of the Tianshan Mountains, the Junggar Basin Desert stretches out across the horizon, and to the south lies the vast expanse of the Taklimakan Desert. Further to the west, the vast Turan Plain and Caspian Sea Coastal Plain define the region’s borders, while the central part is largely covered by the Kazakhskiy Melkosopochnik. The southwestern reaches of Central Asia are marked by expansive, desolate deserts, including the Karakum Desert and Kyzyl Kum Desert (Jiang et al. Citation2017). Despite its varied terrain, Central Asia’s climate is predominantly arid, with a meager annual precipitation averaging only 219.1 mm and a mean annual temperature hovering at approximately 7.9°C (, A7).
Figure 1. Study area.
We collected datasets on the NDVI, LAI, soil moisture, climate and land cover of the study area ().
Table 1. Summary of the datasets used in the analysis.
We obtained the AVHRR (Advanced Very High-Resolution Radiometer) NDVI products in the period of 1985–2020 (https://www.ncei.noaa.gov/metadata/geoportal/rest/metadata/item/gov.noaa.ncdc:C01558/html#). We processed and generated the dataset with monthly maximum synthesis and cropped it with a spatial resolution of 5 km based on the Google Earth Engine (GEE) platform (https://earthengine.google.com/) (Gorelick et al. Citation2017).
We utilized the GLOBMAP-V3 dataset (Liu, Liu, and Chen Citation2012), a highly accurate and reliable source of LAI data. This dataset has provided consistent global coverage since 1981 at an 8 km spatial resolution. GLOBMAP-V3 combines AVHRR and MODIS data, employing the GLOBCARBON LAI algorithm (Deng et al. Citation2006) to derive LAI values. The dataset leverages the inversion results of AVHRR and MODIS data and establishes a pixel-level relationship between AVHRR GIMMS NDVI and MODIS LAI using overlapping observations. This allows for the retroactive derivation of AVHRR LAI based on the established correlation. For detailed algorithms, please refer to Liu et al (Liu, Liu, and Chen Citation2012).
It is commonly accepted that NDVI values ranging from 0 to 0.1 and LAI values equal to 0 indicate non-vegetated areas (Zhang and Ye Citation2021). To account for this, we applied a mask to exclude areas with NDVI values below 0.1 and LAI values below 0. The calculation was then performed on the remaining area.
We utilized the global remotely sensed soil moisture product provided by Jiang et al. (Citation2019, Citation2022). This dataset was generated by merging two microwave soil moisture products using the spatiotemporal fusion model (STFM) with nonlocal filters (Jiang et al. Citation2019). The merged products included the CCI 0.25° passive soil moisture product (version 6.1) (Gruber et al. Citation2019) and the SMAP 9 km soil moisture product (version 3) (Brown et al. Citation2013). Based on the evaluation and comparison of this dataset with in-situ data from the International Soil Moisture Network (ISMN) against the CCI dataset by Jiang et al. (Citation2022), we conducted additional validation to assess its accuracy. From both temporal and spatial perspectives, this validation focused on its applicability in arid Central Asia. At the monthly pixel scale, approximately 80% of the study area exhibited a significant correlation between both data products. In terms of temporal aspect, both products displayed a decreasing trend in soil moisture over time. In the spatial aspect, areas with dry soil moisture were predominantly concentrated in the northern part of Kazakhstan (Figure A11). The CCI datasets we used for validation can be downloaded from https://catalogue.ceda.ac.uk/uuid/f5ffbd016e6b44858a33ae38ed2a149e.
We used the precipitation (mm) and temperature (°C) products from the Climatic Research Unit (CRU) time-series data (Harris et al. Citation2020), with temporal and spatial resolutions of monthly and 0.5°, respectively. Previous versions of the dataset have been extensively evaluated and applied in both global and Chinese research endeavors (Lian et al. Citation2022).
We used two periods (1985 and 2020) of global land cover with a fine classification system at 30 m (GLC_FCS30 product, V1.0) ((Liu et al. Citation2021; Zhang et al. Citation2021) https://data.casearth.cn/), which contained 29 distinct land cover types. However, we found that including too many categories can complicate the analysis of experimental results. We excluded certain land cover types, such as water bodies, wetlands, permanent snow and ice and impervious surfaces. Furthermore, the remaining land cover types were merged into six larger groups, namely cropland, forest, grassland, shrubland, sparse vegetation and bare areas, following the IPCC (Intergovernmental Panel on Climate Change) land categories. This consolidation helped us streamline our analysis while still retaining the essential information we needed to understand the changes in land cover over time.
For further analysis, we resampled the data into a spatial resolution of 9 km, a monthly and yearly temporal resolution, and a time period of 1985–2020 using the inverse distance weighted (IDW) method (Bartier and Keller Citation1996).
2.2. Methods
2.2.1. Spatiotemporal consistency analysis of NDVI, LAI and soil moisture in Central Asia
We utilized a piecewise linear regression (PLR) model to detect the turning points of long-term grid sequences and assess the temporal consistency between NDVI (or LAI) and soil moisture. The PLR model is a widely used tool in remote sensing for identifying significant changes. It involves fitting separate linear regressions to the data before and after a potential turning point, which is determined by selecting the point with the smallest residual sum of squares (Liu, Peng, and Wang Citation2018). Hypothesis testing was conducted to evaluate the significance of the trend before and after the turning point. If both sides of the turning point passed the significance test, it was considered the actual turning point; otherwise, it was not considered. Only one turning point existed, referred to as the turning year. Detailed calculation equations can be found in reference (Liu, Peng, and Wang Citation2018).
We employed the Theil-Sen median trend analysis and the Mann – Kendall (MK) test to investigate the spatial characteristics of the NDVI, LAI, and soil moisture trends in Central Asia. By using a confidence level of 0.05, we assessed the significance of the trends at the pixel scale from 1985 to 2020. The combination of these two methods has proven highly effective in identifying and evaluating trends in long-term time series data (Cao et al. Citation2023; Fensholt et al. Citation2012; Jiang et al. Citation2015; Zhou, Liu et al. Citation2022). Detailed calculation formulas can be found in the references (Jiang et al. Citation2015; Wang et al. Citation2022).
The categorization of the slope (β) values in our study was based on the methodology described by Jiang et al. (Citation2015). Since areas with a Theil-Sen median slope of exactly 0 do not exist in reality, Jiang et al. (Citation2015) classified the trends based on the magnitude of the β values. Specifically, areas with β values between −0.0005 and 0.0005 were classified as stable, indicating little to no change in the respective parameter. Areas with β values greater than or equal to 0.0005 were classified as improved (wetting), indicating a positive trend or increase in the parameter. Conversely, areas with β values below 0.0005 were classified as degraded (drying), indicating a negative trend or decrease in the parameter. Additionally, we incorporated the significance test results of the MK test to further validate the trends (at a significance level of 0.05). By integrating the classifications based on the Theil-Sen median slope analysis and the significance test results of the MK test, we were able to categorize the trends into five distinct classes, as presented in .
Table 2. Classification of NDVI, LAI and soil moisture trends.
2.2.2. Controlling factors for the spatial patterns of soil moisture
We conducted Pearson partial correlation analysis at the pixel level to examine the influence of temporal changes in precipitation, temperature, and NDVI on soil moisture variation. The significance test for the partial correlation coefficients was based on a t test (at a significance level of 0.05), with specific calculation formulas detailed in reference (Song and Ma Citation2011; Wang et al. Citation2013). Multiple linear regression was applied to calculate the standardized regression coefficients. The variable exhibiting the largest absolute coefficient value was considered the predominant influence among these three factors on soil moisture (Wang et al. Citation2017).
2.2.3. Time lag and accumulation effects between NDVI (LAI) and soil moisture under climate change
We conducted partial correlation analysis with time lag (−accumulation) to further analyze the response relationship between soil moisture and vegetation greenness at the monthly scale, building upon the approach of Gessner et al (Gessner et al. Citation2013). Taking NDVI (LAI) as an example, lagged and accumulated vegetation variables were defined as follows:
where NDVI (LAI) values in the tth month with m-month lag and n-month accumulation are represented by Vt(m,n), which is calculated as the mean value of NDVI (LAI) in the lag month and in n previous months before the lag month. The parameter m denotes the number of lag months, while n denotes the number of accumulation months. Additionally, Vt-m-i represents the V(m + i) months before the tth month. Previous studies have reported that the time lag and accumulation effects of climatic variables on vegetation typically range from 0 to 3 months (Ding, Li, and Peng Citation2020; Ma et al. Citation2023). Therefore, both m and n are limited to the range of 0–3, and their sum cannot exceed 3.
Given the snow cover and frozen soil prevalent in Central Asia from November to February, we assumed minimal vegetation activity during this period. Therefore, our analysis focused on NDVI (LAI) data between March and October. We calculated correlation coefficients between NDVI (LAI) and soil moisture, excluding the effects of precipitation and temperature, for various lag and accumulation months. By finding the optimal values of m and n that resulted in the highest correlation coefficient, we determined the lag and accumulation times of vegetation variables significantly impacting soil moisture. At the pixel level with monthly intervals, we identified nine combinations, as shown in Table A1.
3. Results
3.1. Spatiotemporal consistency of vegetation and soil moisture changes in Central Asia
3.1.1. Temporal consistency analysis of NDVI, LAI and soil moisture in Central Asia
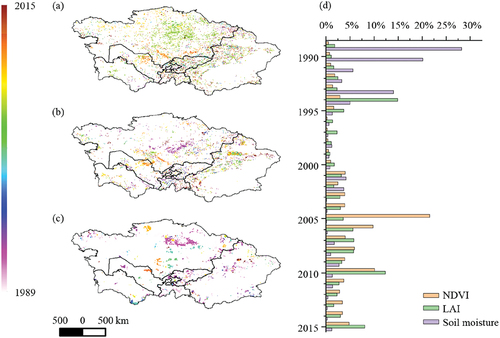
Soil moisture had the earliest occurrence of a mutation point, with 48.3% of the study area experiencing a mutation in 1989 and 1990. The mutations were concentrated in Kazakhskiy Melkosopochnik and dispersed in the Tianshan and Altai Mountains in Xinjiang (). The average trend in soil moisture varied from 1.26 × 10⁻³ m3·m−3· yr−1 to −0.12 × 10⁻³ m3·m−3· yr−1 before and after the turning year, respectively (Figure A1e, f). Regarding LAI, 54.1% of the study area distributed near Tianshan Mountain in Xinjiang, near the junction of Tajikistan and Xinjiang, and in southern Kazakhstan had changes after 2005. Contrarily, an earlier occurrence of a mutation point in 1994, accounted for 14.9%, was distributed in the central-southeastern region of Kazakhstan (). The average trend in LAI varied from 0.82 × 10⁻³· yr−1 to 0.83 × 10⁻³· yr−1 before and after the turning year, respectively (Figure A1c, d). Regarding the NDVI, 73.4% of the study area in central Kazakhstan and the Tianshan Mountains in Xinjiang changed after 2005 (). The average trend in NDVI varied from 0.64 × 10⁻³· yr−1 to 0.44 × 10⁻³· yr−1 (Figure A1a, b). The average greening rate of the LAI remained relatively stable before and after the turning year, while the average greening rate of the NDVI slowed down, suggesting a deceleration in the greening trend of vegetation across Central Asia. The average change rate of soil moisture exhibited a distinct difference before and after the turning year. After the turning year, the soil moisture changed from rising to falling.
Figure 2. Spatial distribution of turning years: NDVI (a), LAI (b), soil moisture (c), and the columnar diagram of the area proportion of each turning year (d). Blank areas indicate no turning year (P > 0.05).
3.1.2. Spatial consistency analysis of NDVI, LAI and soil moisture in Central Asia
The NDVI of vegetated areas (i.e. areas with NDVI ≥ 0.1 & LAI > 0) increased from 1985 to 2020 in Central Asia (), with an average Theil-Sen median slope of 1.6 (10−3·yr−1), ranging from −0.007 to 0.021 during 1985–2020 (Figure A2a). The areas with NDVI values that improved, stabilized, and degraded accounted for 72.1%, 19.9%, and 8.0%, respectively (Figure A3a). The LAI of vegetated areas also increased (), with an average Theil-Sen median slope of 2.4 (10−3·yr−1), ranging from −0.18 to 0.12 (Figure A2b). The areas with improved, stable, and degraded LAI values accounted for 66.2%, 15.1%, and 18.7%, respectively (Figure A3b). The soil moisture of vegetated areas decreased (), with an average Theil-Sen median slope of −0.22 (10−3 m3·m−3· yr−1), ranging from −0.0084 to 0.0089 (Figure A2c). During this period, soil moisture drying remained stable and wetting occurred in 36.8%, 45.8%, and 17.4% of Central Asia, respectively (Figure A3c).
Figure 3. Spatial distribution of the trend classes for NDVI (a), LAI (b) and soil moisture (c) from 1985 to 2020 in Central Asia.
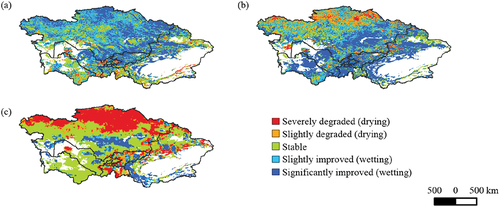
We found that the area where there was an improvement in the NDVI and soil drying simultaneously accounted for 30.4% of total vegetated areas (Figure A3). Similarly, the area where there was an improvement in the LAI and soil drying simultaneously accounted for 19.4% of total vegetated areas.
Kazakhstan contributed the most to the whole dry soil area (improved NDVI and LAI), accounting for 55.0% (69.0% and 57.4%) of the study area, followed by Xinjiang (19.4%, 14.4% and 23.6%), Turkmenistan (8.7%, 4.1% and 6.2%), Uzbekistan (8.4%, 6.1% and 6.4%), and Kyrgyzstan (5.2%, 4.7% & 3.7%), with Tajikistan contributing the least (3.3%, 1.7% and 2.7%) (Figure A3d-f).
3.2. Factors controlling the temporal trends of soil moisture based on different greenness indices
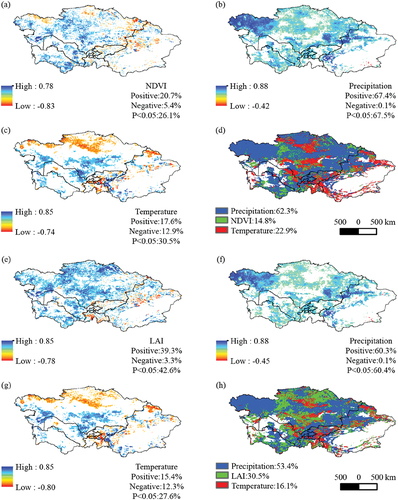
Regardless of whether the NDVI or LAI was used as the greenness index for calculating soil moisture in Central Asia, precipitation was positively correlated with soil moisture () and was the main factor controlling soil moisture in 62.3% (NDVI) and 53.4% (LAI) of vegetated areas, respectively (). When the NDVI was used as the greenness index, temperature (22.9%) had a stronger control on soil moisture in Central Asia than the NDVI (14.8%) (). When the LAI was used as the greenness index, the LAI (30.5%) had a stronger control on soil moisture in Central Asia than did temperature (16.1%) (). This difference was mainly caused by the transition from temperature control to vegetation control west of the Kazakhskiy Melkosopochnik and near the Muyunkum Desert, as well as the shift from temperature control to precipitation and vegetation control in the Kunlun Mountains region of Xinjiang. The influence of temperature on soil moisture showed spatial variations, with negative effects in the northern and northwestern parts of Kazakhstan, as well as the Altai region of Xinjiang; however, there were positive temperature effects on soil moisture in the southern and southwestern parts of Kazakhstan, southwestern Turkmenistan, and certain areas of the Kunlun Mountains (). The impact of vegetation on soil moisture exhibited both positive (NDVI: 20.7%; LAI: 39.3%) and negative effects (NDVI: 5.4%; LAI: 3.3%); however, the overall positive effect outweighed the negative effect ().
Figure 4. Partial correlation coefficients (Rp) between soil moisture and the following variables: (a) NDVI (removing the effects of precipitation and temperature), (b) precipitation (removing the effects of NDVI and temperature), (c) temperature (removing the effects of NDVI and precipitation), (e) LAI (removing the effects of precipitation and temperature), (f) precipitation (removing the effects of LAI and temperature), and (g) temperature (removing the effects of LAI and precipitation). Blank areas indicate partial correlations that failed the significance test (P > 0.05). The distribution and proportions of the area occupied by the controlling factors: (d) NDVI, precipitation and temperature; and (h) LAI, precipitation and temperature. Blank areas indicate NDVI < 0.1 or LAI ≤ 0 in Central Asia during the growing seasons.
Cropland, grassland and scattered forest were the main land cover types that caused differences between the LAI and NDVI (Figure A7h, i). The correlation analysis indicated that the correlation coefficients between the LAI and soil moisture were 63% for grassland and 49% for cropland, but not significant between the NDVI and soil moisture for grassland and cropland. We observed a negative correlation between forest NDVI and soil moisture (−32%), while there was no significant correlation between forest LAI and soil moisture (Figure A9).
We also analyzed the main controlling factors of soil moisture change before and after the turning year and found that precipitation remained the dominant factor influencing soil moisture (Figure A4). Before the soil moisture changed (1985–1990), when the soil moisture was increasing, the influence of precipitation, temperature, and vegetation index on soil moisture control was relatively balanced. During this period, both LAI and NDVI had similar impacts on soil moisture (Figure A4a, c). However, after the soil moisture changed (1991–2020), when the soil moisture was decreasing, the control strength of precipitation on soil moisture increased significantly, and the control area expanded (Figure A4b, d). Furthermore, the controlling factors for soil moisture after the change had a spatial distribution and control strength that closely resembled that of the overall study period.
By further extracting the regions where vegetation greening and soil drying occurred simultaneously (Figure A5), we found that the controlling factors for soil moisture in these areas followed the order of precipitation > temperature > vegetation index (NDVI or LAI). Only 3.8% (NDVI) and 4.1% (LAI) of vegetated areas exhibited a soil moisture decline driven by vegetation, and these areas were scattered across the Tianshan and Altai Mountains in Xinjiang, certain mountainous regions in Tajikistan and Kyrgyzstan, and the northern regions of Kazakhskiy Melkosopochnik in Kazakhstan.
3.3. Comparative analysis of time lag and accumulation effects of NDVI, LAI, temperature, and precipitation on soil moisture
The main combinations of lag and accumulation months of NDVI were 0-lag and 0-accumulation and 1-lag and 0-accumulation, accounting for 43.3% and 25.7%, respectively (Figure A6a). In the northern region, soil moisture and NDVI changed simultaneously, while in the southern region, there was 1-month lag relationship at approximately 45°N (). For precipitation, the primary combinations of lag and accumulation months were 1-lag and 0-accumulation, 0-lag and 3-accumulation, and 3-lag and 0-accumulation, accounting for 35.4%, 15.8%, and 15.9%, respectively (Figure A6a). Among them, the strongest lagged association, with 1-month lag, was observed in the northern and northwestern regions of Kazakhstan, while there was 3-month lag in the Kazakhskiy Melkosopochnik and Altai mountains and 1-month accumulation in the Muyunkum Desert and Tianshan Mountains (). The largest proportion of the combination of lag and accumulation months of temperature was 0-lag and 0-accumulation, indicating simultaneous changes, accounting for 46.2% (, Figure A6a).
Figure 5. The time (lag-accumulation) effects of soil moisture in combination with different factors: effects of soil moisture in combination with different factors: (a) NDVI, (b) LAI, (c) precipitation (with NDVI as the vegetation index), (d) precipitation (with LAI as the vegetation index), (e) temperature (with NDVI as the vegetation index), and (f) temperature (with LAI as the vegetation index).
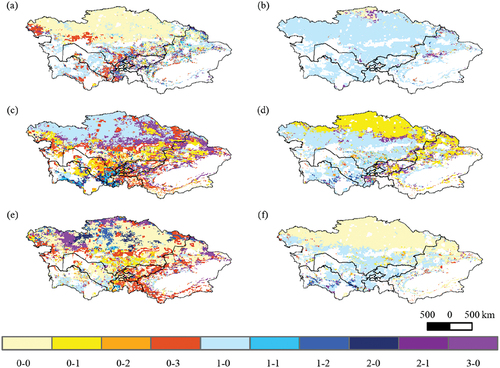
The combinations of lag and accumulation months of LAI were 1-1ag and 0-accumulation, accounting for 92.3% (Figure A6b). The main combinations of lag and accumulation months of precipitation were 1-lag and 0-accumulation and 0-lag and 1-accumulation, accounting for 51.3% and 35.2%, respectively (Figure A6b). Unlike above, precipitation had 1-month accumulation effect in northern Kazakhstan and 1-month lag effect in the other regions (). Consistent with the above, the largest proportion of the combination of lag and accumulation months of temperature was 0-lag and 0-accumulation, indicating simultaneous changes, accounting for 58.3% ().
We investigated the difference in the temporal response of soil moisture to the NDVI and LAI with different land cover types (Figure A10). We found that the NDVI of grassland, cropland and forest was negatively correlated with soil moisture with 1-month lag, while the NDVI of bare areas and shrubland was positively correlated with soil moisture with 1-month lag, and the soil moisture of sparse vegetation was not significantly responsive to NDVI. We also found that the LAI of all land cover types was positively correlated with soil moisture with 1-month lag (Figure A10).
4. Discussions
4.1. Possible mechanisms that dominate soil moisture variations in arid Central Asia
Our findings indicated that climate, particularly precipitation, played a dominant role in controlling soil moisture variability in Central Asia. Given the scarcity of water resources in this region, precipitation becomes the primary source of soil moisture (Wu, Geller, and Dickinson Citation2002). Moreover, the prevalence of loamy and sandy loamy soils with high infiltration rates (Zhang, Sun et al. Citation2022), combined with initially low soil moisture content, leads to a high conversion rate of precipitation into soil moisture (Wang et al. Citation2019). This exacerbates the impact of precipitation on soil moisture, highlighting its crucial role in regulating soil moisture in the area.
The influence of precipitation on soil moisture is a complex process. In general, a decrease in precipitation directly results in a reduction in soil moisture. However, an increase in precipitation does not always translate into an increase in soil moisture, as observed in the Kazakhskiy Melkosopochnik region (Figure A7f). As precipitation increases, a complex interplay between soil moisture absorption and infiltration rate emerges. Initially, arid soils can absorb a higher proportion of the additional water. However, as the soil approaches saturation, its capacity to absorb water diminishes, leading to a decline in the infiltration rate. Consequently, a larger fraction of the increased precipitation contributes to surface runoff instead of being absorbed into the soil moisture (Wang et al. Citation2019). Additionally, in drylands, exceptionally dry air can cause precipitation to evaporate before reaching the ground (Pal, Small, and Eltahir Citation2000; Small, Giorgi, and Sloan Citation1999). This, coupled with the potential negative feedback between soil moisture and precipitation, may lead to reduced available soil moisture due to increased evapotranspiration (Ragab and Prudhomme Citation2002; Seneviratne et al. Citation2010).
Temperature was the main factor controlling soil moisture loss in central Kazakhstan (). As temperatures increase, the increased evaporation demand and vapor pressure deficit lead to a potential increase in evapotranspiration (Seneviratne et al. Citation2010). In drylands, this can result in a further reduction in soil moisture. This feedback cycle can continue until the soil becomes completely dry, at which point the temperature increase is no longer constrained by further increases in evapotranspiration (Seneviratne et al. Citation2010). Despite increasing precipitation, a 20% rise in arid and semiarid ecosystems would be offset by a 3°C to 4°C increase in temperature (Li et al. Citation2015). It is noteworthy that for every 1°C increase in mean annual temperature, there is a 10% to 15% increase in evaporation (Li et al. Citation2015). Thus, a higher annual precipitation alone cannot compensate for the loss of soil moisture due to increasing temperatures.
The influence of vegetation on soil moisture was weaker than that of climatic factors (). Even though the LAI had a dominant effect surpassing temperature, it was far less significant than precipitation. It has been revealed that in arid climates, only 19% of plant transpiration depends on soil moisture replenished by recent precipitation (within a month) (Miguez-Macho and Fan Citation2021). This is attributed to the high water adsorption capacity of arid soils and the limited penetration depth that restricts the amount of water available for plant uptake (Seneviratne et al. Citation2010). Moreover, the LAI is more positively correlated with soil moisture (). Particularly in regions where soil moisture and vegetation greening occur simultaneously, the impacts of NDVI and LAI on soil moisture decreases are relatively similar, accounting for only 3.8% and 4.2% of vegetated areas, respectively (Figure A4). In other words, vegetation has a more positive effect on soil moisture in arid Central Asia. This can be explained by variations in vegetation, such as leaf orientation and leaf area, resulting in changes in the exposed soil surface area, thereby affecting soil evaporation (Seneviratne et al. Citation2010). Finally, vegetation in drylands often possesses greater drought tolerance mechanisms. These mechanisms reduce water loss by closing stomata, modifying leaf quantity and adjusting size to minimize transpiration surface area, and employing other adaptive features to lower water demands (Basu et al. Citation2016). These xerophytic traits enable plants to utilize limited water resources more effectively in arid conditions instead of relying excessively on soil moisture.
4.2. The discrepancies in soil moisture response were influenced by the distinct trends observed in NDVI and LAI
Theoretically, the disparity in trends between LAI and NDVI could be attributed to differences in vegetation canopy structure. The NDVI, as an indicator of vegetation vigor and photosynthetic capacity, primarily reflects the greenness of vegetation. While the NDVI is correlated with photosynthetic capacity and vegetation density, it is also influenced by factors such as soil color, leaf morphology, leaf angle distribution, and overall canopy structure (Samanta et al. Citation2012; Ukasha, Ramirez, and Niemann Citation2022). In contrast, LAI estimation methods aim to eliminate such unrelated factors and focus on quantifying leaf area (Samanta et al. Citation2012). When there is a change in leaf angle distribution, such as leaves becoming more vertical or horizontal, it may result in increased light interception and higher NDVI values, but such changes in canopy structure may not necessarily correspond to an overall increase in LAI.
Actually, we deduced that the disparity between LAI and NDVI observed in the northern and northwestern regions of Kazakhstan could be attributed to frequent economic and political reforms. The northern part of Kazakhstan is the main cropland for spring wheat, accounting for 52.3% of crop production (Li et al. Citation2020). The cropland in this region went through a period of abandonment in the early years following the dissolution of the Soviet Union (1991–2000). During this period, it became overgrown with weeds, shrubs (for three to five years), and even trees (Yan et al. Citation2020). These weeds, shrubs, and trees generally have smaller leaf areas compared to crops, which may result in a decrease in the overall LAI. In addition, in areas where different land cover types coexist, the relationship between the NDVI and LAI can change over time with phenological development, and their trends may not necessarily align completely (Gitelson et al. Citation2003; Ukasha, Ramirez, and Niemann Citation2022).
Additionally, the cultivation and abandonment of cropland in Kazakhstan, influenced by social systems and policies, have caused a 25–30% decline in the organic matter content of black soil in the northern region (Yan et al. Citation2020). This has led to a series of problems, such as soil salinization, land degradation, and a decrease in the water-holding capacity of fertile soils, which would directly aggravate soil drying (Yan et al. Citation2020).
It is worth noting that our study focuses on the consistency of vegetation greening and soil drying in terms of time and space. Furthermore, we aim to identify the main factors contributing to soil drying in this area. Although the areas where NDVI improvement and soil drying occurred simultaneously and LAI improvement and soil drying occurred simultaneously were different in size, their spatial distribution was basically consistent. It is notable that precipitation emerges as the main controlling factor (Figure A5). The different trends of the NDVI and LAI in northern Kazakhstan and their different effects on soil moisture did not alter our core conclusions. We maintain that climate, rather than greening, regulates soil moisture variation in Central Asia.
4.3. Temporal and spatial asynchrony of NDVI and LAI
We observed the presence of temporal and spatial asynchrony between the NDVI and LAI. Specifically, notable differences were observed in the northern region of Kazakhstan, particularly north of 45°N. The primary reason for the differential temporal response of NDVI and LAI to soil moisture between the northern and southern regions of Kazakhstan is likely the significant increase in vegetation water use efficiency (Zou et al. Citation2020). The enhancement of water use efficiency yields several benefits, including improved vegetation growth, increased photosynthetic rates, and an increased NDVI. Simultaneously, it reduces soil moisture evaporation loss and promotes higher soil moisture retention through increased vegetation cover (Zou et al. Citation2020). Additionally, the overall 1-month lag of the LAI behind the NDVI can be attributed to plant physiology (Ukasha, Ramirez, and Niemann Citation2022). The NDVI primarily reflects vegetation greenness, and this measure may decline over time. In contrast, the LAI provides a more comprehensive representation of vegetation growth across multiple leaf layers, with a particular emphasis on leaf abundance, which remains high (Ukasha, Ramirez, and Niemann Citation2022). The differential temporal response of soil moisture to the NDVI and LAI directly impacts the lagged accumulation relationships among precipitation, temperature, and soil moisture.
Regardless of the vegetation index used, the 1-month lag of soil moisture in response to precipitation was the most significant temporal accumulation pattern (Figure A6). However, the spatial distributions were completely opposite (). This result suggested that the influence of soil moisture on precipitation could be affected by vegetation (as precipitation, temperature, and soil moisture were consistent). As the leaf chlorophyll content increases with decreasing water stress, the NDVI increases with increasing precipitation, exhibiting a lagged relationship (Kogan Citation2019). However, the cumulative growth of leaf area requires time, and the LAI may depend on the cumulative precipitation over the past few months (Tesemma et al. Citation2014). The differential sensitivity of the NDVI and LAI to precipitation indirectly affects soil moisture. Additionally, the response of soil moisture to precipitation can be influenced by vegetation types and their phenological variations over time (Gitelson et al. Citation2003). For instance, when using LAI as a vegetation greenness index, sparse vegetation and shrubland show a negative correlation with precipitation and soil moisture (Figure A9). This discrepancy might be attributed to several factors. Firstly, the higher surface bareness and increased evaporation of precipitation have exhibited in areas with sparse vegetation and shrubland. Secondly, these areas may have dispersed and sparse root systems, which limit the absorption and retention of soil moisture (Archer et al. Citation2017). As a result, precipitation is more prone to rapid runoff and infiltration in these areas, leading to a negative correlation between soil moisture and precipitation.
Similarly, while soil moisture in most areas of Central Asia changes concurrently with temperature, spatial variations do exist (), although they are less pronounced than those of precipitation. Moreover, the influence of temperature on soil moisture is affected by vegetation, similar to the previous discussion. Transpiration and different vegetation types are likely reasons for the observed differences.
Overall, our findings indicate that in arid Central Asia, particularly in regions with sparse vegetation, the NDVI is a more sensitive hydroclimatic indicator than the LAI. However, the LAI shows a stronger correlation with soil moisture than the NDVI and exhibits more uniform and stable behavior. Therefore, for long-term studies, especially when investigating overall trends and influencing factors, we consider the LAI to be more suitable than the NDVI. However, it is important to note that the LAI may miss some smaller changes. Therefore, in future research, it is necessary to choose the most appropriate vegetation greenness index based on specific research requirements. This will allow for a more accurate analysis and interpretation of the impacts of hydroclimatic changes on vegetation and soil moisture.
Satellite remote sensing has greatly enriched our understanding of climate-vegetation-soil moisture in drylands, compensating for the limitations of time-space incoherence in traditional observation methods. Based on multiple key parameters, such as the vegetation index and soil moisture, change trends in drylands can be detected over time, and important information can be provided for monitoring and early warning. Our study emphasizes the greater role of climate change, particularly precipitation, in regulating soil moisture in arid Central Asia. The spatiotemporal distribution, intensity, and frequency of precipitation have undergone significant changes in this region, with an increase in extreme precipitation events (Yao et al. Citation2021). Therefore, understanding the relationship between precipitation and soil moisture is of vital importance for the stability of water resources, the health of vegetation ecosystems, and the sustainability of the ecological environment in arid Central Asia. We also acknowledge that although forests constitute a small portion of the region, they may exacerbate water scarcity due to their development of deeper and larger root systems to access more soil moisture for survival (Zhou et al. Citation2015). This finding has significant implications for the formulation of ecological restoration policies in water-limited areas. Hence, we recommend considering the potential negative impact of vegetation on water availability when implementing afforestation programs. Our research findings on the differential impacts of climate change and vegetation greening on soil moisture in Central Asia provide valuable information for regional-scale water resource management and ecological restoration.
5. Conclusion
We verified the relative importance of vegetation change and climate change to soil moisture and their intrinsic relationship based on multisource remote sensing data. Due to the inconsistencies in the spatiotemporal trends of soil moisture and vegetation greening in the arid Central Asian region, the precipitation dominates in the co-occurrence of vegetation greening and soil drying, both in specific areas and across the entire vegetation cover, we conclude that climate regulation, especially the change in precipitation, serves as the predominant influencer of soil moisture drying in Central Asia.
Appendix_A_TF.docx
Download MS Word (3.2 MB)Acknowledgments
We thank the Google Earth Engine platform for providing the geospatial datasets and the data processing and analysis algorithms.
Disclosure statement
No potential conflict of interest was reported by the author(s).
Data availability statement
The data that support the findings of this study are available from the corresponding author upon reasonable request.
Supplemental material
Supplemental data for this article can be accessed online at https://doi.org/10.1080/15481603.2023.2286744
Additional information
Funding
References
- Archer, S. R., E. M. Andersen, K. I. Predick, S. Schwinning, R. J. Steidl, and S. R. Wood. 2017. “Woody Plant Encroachment: Causes and Consequences.” In Rangeland Systems: Processes, Management and Challenges, edited by D. B. David, 25–17. Cham: Springer International Publishing.
- Bai, Y., S. Li, M. Liu, and Q. Guo. 2022. “Assessment of Vegetation Change on the Mongolian Plateau Over Three Decades Using Different Remote Sensing Products.” Journal of Environmental Management 317:115509. https://doi.org/10.1016/j.jenvman.2022.115509.
- Bartier, P. M., and C. P. Keller. 1996. “Multivariate Interpolation to Incorporate Thematic Surface Data Using Inverse Distance Weighting (IDW.” Computers & Geosciences 22 (7): 795–799. https://doi.org/10.1016/0098-3004(96)00021-0.
- Basu, S., V. Ramegowda, A. Kumar, and A. Pereira. 2016. “Plant Adaptation to Drought Stress.” F1000Research 5:F1000 Faculty Rev-1554. https://doi.org/10.12688/f1000research.7678.1.
- Brown, M. E., V. Escobar, S. Moran, D. Entekhabi, P. E. O’Neill, E. G. Njoku, B. Doorn, and J. K. Entin. 2013. “Nasa’s Soil Moisture Active Passive (SMAP) Mission and Opportunities for Applications Users.” Bulletin of the American Meteorological Society 94 (8): 1125–1128. https://doi.org/10.1175/BAMS-D-11-00049.1.
- Burrell, A. L., J. P. Evans, and M. G. De Kauwe. 2020. “Anthropogenic Climate Change Has Driven Over 5 Million Km2 of Drylands Towards Desertification.” Nature Communications 11 (1): 3853. https://doi.org/10.1038/s41467-020-17710-7.
- Cao, S., Y. He, L. Zhang, Q. Sun, Y. Zhang, H. Li, X. Wei, and Y. Liu. 2023. “Spatiotemporal Dynamics of Vegetation Net Ecosystem Productivity and Its Response to Drought in Northwest China.” GIScience & Remote Sensing 60 (1): 2194597. https://doi.org/10.1080/15481603.2023.2194597.
- Chen, L., Z. Huang, J. Gong, B. Fu, and Y. Huang. 2007. “The Effect of Land Cover/Vegetation on Soil Water Dynamic in the Hilly Area of the Loess Plateau, China.” Catena 70 (2): 200–208. https://doi.org/10.1016/j.catena.2006.08.007.
- Choi, M., and J. M. Jacobs. 2007. “Soil Moisture Variability of Root Zone Profiles within SMEX02 Remote Sensing Footprints.” Advances in Water Resources 30 (4): 883–896. https://doi.org/10.1016/j.advwatres.2006.07.007.
- Davi, N. K., R. D’Arrigo, G. Jacoby, E. R. Cook, K. Anchukaitis, B. Nachin, M. P. Rao, and C. Leland. 2015. “A Long-Term Context (931–2005 CE) for Rapid Warming Over Central Asia.” Quaternary Science Reviews 121:89–97. https://doi.org/10.1016/j.quascirev.2015.05.020.
- Deng, H., and Y. Chen. 2017. “Influences of Recent Climate Change and Human Activities on Water Storage Variations in Central Asia.” Canadian Journal of Fisheries and Aquatic Sciences 544: 46–57. https://doi.org/10.1016/j.jhydrol.2016.11.006.
- Deng, F., J. M. Chen, S. Plummer, M. Chen, and J. Pisek. 2006. “Algorithm for global leaf area index retrieval using satellite imagery.” IEEE Transactions on Geoscience & Remote Sensing 44 (8): 2219–2229. https://doi.org/10.1109/TGRS.2006.872100.
- Deng, Y., S. Wang, X. Bai, G. Luo, L. Wu, F. Chen, J. Wang, et al. 2020. “Vegetation Greening Intensified Soil Drying in Some Semi-Arid and Arid Areas of the World.” Agricultural and Forest Meteorology 292-293:108103. https://doi.org/10.1016/j.agrformet.2020.108103.
- Ding, Y., Z. Li, and S. Peng. 2020. “Global Analysis of Time-Lag and -Accumulation Effects of Climate on Vegetation Growth.” International Journal of Applied Earth Observation and Geoinformation 92:102179. https://doi.org/10.1016/j.jag.2020.102179.
- Du, L., L. Ma, H. Pan, C. Qiao, C. Meng, H. Wu, J. Tian, H. Yuan, and S. Chen 2022. “Carbon–Water Coupling and Its Relationship with Environmental and Biological Factors in a Planted Caragana Liouana Shrub Community in Desert Steppe, Northwest China.” Journal of Plant Ecology 15 (5): 947–960. https://doi.org/10.1093/jpe/rtac064.
- Du, J., J. Shu, J. Yin, X. Yuan, A. Jiaerheng, S. Xiong, P. He, and W. Liu. 2015. “Analysis on Spatio-Temporal Trends and Drivers in Vegetation Growth During Recent Decades in Xinjiang, China.” International Journal of Applied Earth Observation and Geoinformation 38:216–228. https://doi.org/10.1016/j.jag.2015.01.006.
- Entekhabi, D., E. G. Njoku, P. E. O’Neill, K. H. Kellogg, W. T. Crow, W. N. Edelstein, J. K. Entin, S. D. Goodman, T. J. Jackson, and J. Johnson. 2010. “The soil moisture active passive (SMAP) mission.” Proceedings of the IEEE 98 (5): 704–716. https://doi.org/10.1109/JPROC.2010.2043918.
- Fensholt, R., T. Langanke, K. Rasmussen, A. Reenberg, S. D. Prince, C. Tucker, R. J. Scholes, et al. 2012. “Greenness in Semi-Arid Areas Across the Globe 1981–2007 — an Earth Observing Satellite Based Analysis of Trends and Drivers.” Remote Sensing of Environment 121:144–158. https://doi.org/10.1016/j.rse.2012.01.017.
- Gessner, U., V. Naeimi, I. Klein, C. Kuenzer, D. Klein, and S. Dech. 2013. “The Relationship Between Precipitation Anomalies and Satellite-Derived Vegetation Activity in Central Asia.” Global and Planetary Change 110:74–87. https://doi.org/10.1016/j.gloplacha.2012.09.007.
- Gitelson, A. A., A. Viña, T. J. Arkebauer, D. C. Rundquist, G. Keydan, and B. Leavitt. 2003. “Remote Estimation of Leaf Area Index and Green Leaf Biomass in Maize Canopies.” Geophysical Research Letters 30 (5). https://doi.org/10.1029/2002GL016450.
- Gorelick, N., M. Hancher, M. Dixon, S. Ilyushchenko, D. Thau, and R. Moore. 2017. “Google Earth Engine: Planetary-Scale Geospatial Analysis for Everyone.” Remote Sensing of Environment 202:18–27. https://doi.org/10.1016/j.rse.2017.06.031.
- Goward, S. N., Y. Xue, and K. P. J. R. S. O. E. Czajkowski. 2002. “Evaluating Land Surface Moisture Conditions from the Remotely Sensed Temperature/Vegetation Index Measurements: An Exploration with the Simplified Simple Biosphere Model.” Remote Sensing of Environment 79 (2–3): 225–242. https://doi.org/10.1016/S0034-4257(01)00275-9.
- Gruber, A., T. Scanlon, R. van der Schalie, W. Wagner, and W. Dorigo. 2019. “Evolution of the ESA CCI Soil Moisture Climate Data Records and Their Underlying Merging Methodology.” Earth System Science Data 11 (2): 717–739. https://doi.org/10.5194/essd-11-717-2019.
- Harris, I., T. J. Osborn, P. Jones, and D. Lister. 2020. “Version 4 of the CRU TS Monthly High-Resolution Gridded Multivariate Climate Dataset.” Scientific Data 7 (1): 109. https://doi.org/10.1038/s41597-020-0453-3.
- Jiang, L., G. Jiapaer, A. Bao, H. Guo, and F. Ndayisaba. 2017. “Vegetation Dynamics and Responses to Climate Change and Human Activities in Central Asia.” Science of the Total Environment 599-600:967–980. https://doi.org/10.1016/j.scitotenv.2017.05.012.
- Jiang, H., H. Shen, X. Li, and L. Li. 2022. “The 43-Year (1978-2020) Global 9km Remotely Sensed Soil Moisture Product.” PANGAEA. https://doi.org/10.1594/PANGAEA.940409.
- Jiang, H., H. Shen, X. Li, C. Zeng, H. Liu, and F. Lei. 2019. “Extending the SMAP 9-Km Soil Moisture Product Using a Spatio-Temporal Fusion Model.” Remote Sensing of Environment 231:111224. https://doi.org/10.1016/j.rse.2019.111224.
- Jiang, W., L. Yuan, W. Wang, R. Cao, Y. Zhang, and W. Shen. 2015. “Spatio-Temporal Analysis of Vegetation Variation in the Yellow River Basin.” Ecological Indicators 51:117–126. https://doi.org/10.1016/j.ecolind.2014.07.031.
- Kogan, F. 2019. “Vegetation Health Method.” In Remote Sensing for Food Security, edited by F. Kogan, 51–73. Cham: Springer International Publishing.
- Lan, Z., S. Zhang, T. A. Sial, L. Wu, W. Chang, X. Li, J. Zhang, J. Fan, and X. Feng. 2022. “Fine-Scale Spatial Distribution of Soil Organic Carbon and Its Fractions After Afforestation with Pinus Sylvestris and Salix Psammophila in a Semiarid Desert of China.” Journal of Plant Ecology 15 (1): 141–154. https://doi.org/10.1093/jpe/rtab078.
- Lian, X., L. Jiao, Z. Liu, Q. Jia, J. Zhong, M. Fang, and W. Wang. 2022. “Multi-Spatiotemporal Heterogeneous Legacy Effects of Climate on Terrestrial Vegetation Dynamics in China.” GIScience & Remote Sensing 59 (1): 164–183. https://doi.org/10.1080/15481603.2021.2022426.
- Lian, X., S. Piao, L. Z. X. Li, Y. Li, C. Huntingford, P. Ciais, A. Cescatti, et al. 2020. “Summer Soil Drying Exacerbated by Earlier Spring Greening of Northern Vegetation.” Science Advances 6 (1): eaax0255. https://doi.org/10.1126/sciadv.aax0255.
- Li, Z., G. Fang, Y. Chen, W. Duan, and Y. Mukanov. 2020. “Agricultural Water Demands in Central Asia Under 1.5 °C and 2.0 °C Global Warming.” Agricultural Water Management 231:106020. https://doi.org/10.1016/j.agwat.2020.106020.
- Li, C., B. Fu, S. Wang, L. C. Stringer, Y. Wang, Z. Li, Y. Liu, and W. Zhou. 2021. “Drivers and Impacts of Changes in China’s Drylands.” Nature Reviews Earth and Environment 2 (12): 858–873. https://doi.org/10.1038/s43017-021-00226-z.
- Li, X., X. Gao, J. Wang, and H. Guo. 2015. “Microwave Soil Moisture Dynamics and Response to Climate Change in Central Asia and Xinjiang Province, China, Over the Last 30 Years.” Journal of Applied Remote Sensing 9 (1): 096012. https://doi.org/10.1117/1.JRS.9.096012.
- Liu, Y., R. Liu, and J. M. Chen. 2012. “Retrospective Retrieval of Long-Term Consistent Global Leaf Area Index (1981–2011) from Combined AVHRR and MODIS Data.” Journal of Geophysical Research: Biogeosciences 117 (G4). https://doi.org/10.1029/2012JG002084.
- Liu, Y. Y., R. Parinussa, W. A. Dorigo, R. A. De Jeu, W. Wagner, A. Van Dijk, M. F. McCabe, and J. Evans. 2011. “Developing an Improved Soil Moisture Dataset by Blending Passive and Active Microwave Satellite-Based Retrievals.” Hydrology and Earth System Sciences 15 (2): 425–436. https://doi.org/10.5194/hess-15-425-2011.
- Liu, Y., J. Peng, and Y. Wang. 2018. “Efficiency of landscape metrics characterizing urban land surface temperature.” Landscape and Urban Planning 180:36–53. https://doi.org/10.1016/j.landurbplan.2018.08.006.
- Liu, L., X. Zhang, Y. Gao, X. Chen, X. Shuai, and J. Mi. 2021. “Finer-Resolution Mapping of Global Land Cover: Recent Developments, Consistency Analysis, and Prospects.” Journal of Remote Sensing 1:38. https://doi.org/10.34133/2021/5289697.
- Li, W., Y. Wang, J. Yang, and Y. Deng. 2022. “Time-Lag Effect of Vegetation Response to Volumetric Soil Water Content: A Case Study of Guangdong Province, Southern China.” Remote Sensing 14 (6): 1301. https://doi.org/10.3390/rs14061301.
- Lu, C., T. Zhao, X. Shi, and S. Cao. 2018. “Ecological Restoration by Afforestation May Increase Groundwater Depth and Create Potentially Large Ecological and Water Opportunity Costs in Arid and Semiarid China.” Journal of Cleaner Production 176:1213–1222. https://doi.org/10.1016/j.jclepro.2016.03.046.
- Ma, M., Q. Wang, R. Liu, Y. Zhao, and D. Zhang. 2023. “Effects of Climate Change and Human Activities on Vegetation Coverage Change in Northern China Considering Extreme Climate and Time-Lag and -Accumulation Effects.” Science of the Total Environment 860:160527. https://doi.org/10.1016/j.scitotenv.2022.160527.
- Meng, F., M. Luo, C. Sa, M. Wang, and Y. Bao. 2022. “Quantitative Assessment of the Effects of Climate, Vegetation, Soil and Groundwater on Soil Moisture Spatiotemporal Variability in the Mongolian Plateau.” Science of the Total Environment 809:152198. https://doi.org/10.1016/j.scitotenv.2021.152198.
- Miguez-Macho, G., and Y. Fan. 2021. “Spatiotemporal origin of soil water taken up by vegetation.” Nature 598 (7882): 624–628. https://doi.org/10.1038/s41586-021-03958-6.
- Pal, J. S., E. E. Small, and E. A. Eltahir. 2000. “Simulation of Regional‐Scale Water and Energy Budgets: Representation of Subgrid Cloud and Precipitation Processes within RegCm.” Journal of Geophysical Research Atmospheres 105 (D24): 29579–29594. https://doi.org/10.1029/2000JD900415.
- Parajka, J., V. Naeimi, G. Blöschl, W. Wagner, R. Merz, and K. Scipal. 2006. “Assimilating scatterometer soil moisture data into conceptual hydrologic models at the regional scale.” Hydrology and Earth System Sciences 10 (3): 353–368. https://doi.org/10.5194/hess-10-353-2006.
- Piao, S., X. Wang, T. Park, C. Chen, X. Lian, Y. He, J. W. Bjerke, et al. 2020. “Characteristics, Drivers and Feedbacks of Global Greening.” Nature Reviews Earth and Environment 1 (1): 14–27. https://doi.org/10.1038/s43017-019-0001-x.
- Ragab, R., and C. Prudhomme. 2002. “Sw—Soil and Water: Climate Change and Water Resources Management in Arid and Semi-Arid Regions: Prospective and Challenges for the 21st Century.” Biosystems Engineering 81 (1): 3–34. https://doi.org/10.1006/bioe.2001.0013.
- Ren, K., W. Sun, X. Meng, G. Yang, J. Peng, J. Huang, and J. Li. 2023. “CDFSL: Image Registration for Spaceborne Hyperspectral and Multispectral Data Having Large Spatial-Resolution Difference.” IEEE Transactions on Geoscience & Remote Sensing 61:1–15. https://doi.org/10.1109/TGRS.2023.3286858.
- Rodriguez-Iturbe, I. 2000. “Ecohydrology: A hydrologic perspective of climate-soil-vegetation dynamies.” Water Resources Research 36 (1): 3–9. https://doi.org/10.1029/1999WR900210.
- Samanta, A., Y. Knyazikhin, L. Xu, R. E. Dickinson, R. Fu, M. H. Costa, S. S. Saatchi, R. R. Nemani, and R. B. Myneni. 2012. “Seasonal Changes in Leaf Area of Amazon Forests from Leaf Flushing and Abscission.” Journal of Geophysical Research: Biogeosciences 117 (G1). https://doi.org/10.1029/2011JG001818.
- Seneviratne, S. I., T. Corti, E. L. Davin, M. Hirschi, E. B. Jaeger, I. Lehner, B. Orlowsky, and A. J. Teuling. 2010. “Investigating Soil Moisture–Climate Interactions in a Changing Climate: A Review.” Earth Science Review 99 (3): 125–161. https://doi.org/10.1016/j.earscirev.2010.02.004.
- Small, E. E., F. Giorgi, and L. C. Sloan. 1999. “Regional climate model simulation of precipitation in central Asia: Mean and interannual variability.” Journal of Geophysical Research 104 (D6): 6563–6582. https://doi.org/10.1029/98JD02501.
- Smith, W. K., M. P. Dannenberg, D. Yan, S. Herrmann, M. L. Barnes, G. A. Barron-Gafford, J. A. Biederman, et al. 2019. “Remote Sensing of Dryland Ecosystem Structure and Function: Progress, Challenges, and Opportunities.” Remote Sensing of Environment 233:111401. https://doi.org/10.1016/j.rse.2019.111401.
- Song, Y., and M. Ma. 2011. “A Statistical Analysis of the Relationship Between Climatic Factors and the Normalized Difference Vegetation Index in China.” International Journal of Remote Sensing 32 (14): 3947–3965. https://doi.org/10.1080/01431161003801336.
- Song, C., L. Yuan, X. Yang, and B. Fu. 2017. “Ecological-hydrological processes in arid environment: Past, present and future.” Journal of Geographical Sciences 27 (12): 1577–1594. https://doi.org/10.1007/s11442-017-1453-x.
- Stocker, B. D., J. Zscheischler, T. F. Keenan, I. C. Prentice, S. I. Seneviratne, and J. Peñuelas. 2019. “Drought Impacts on Terrestrial Primary Production Underestimated by Satellite Monitoring.” Nature Geoscience 12 (4): 264–270. https://doi.org/10.1038/s41561-019-0318-6.
- Sun, W., K. Ren, X. Meng, G. Yang, C. Xiao, J. Peng, and J. Huang. 2022. “MLR-DBPFN: A Multi-Scale Low Rank Deep Back Projection Fusion Network for Anti-Noise Hyperspectral and Multispectral Image Fusion.” IEEE Transactions on Geoscience & Remote Sensing 60:1–14. https://doi.org/10.1109/TGRS.2022.3146296.
- Tesemma, Z. K., Y. Wei, A. W. Western, and M. C. Peel. 2014. “Leaf Area Index Variation for Crop, Pasture, and Tree in Response to Climatic Variation in the Goulburn–Broken Catchment, Australia.” Journal of Hydrometeorology 15 (4): 1592–1606. https://doi.org/10.1175/JHM-D-13-0108.1.
- Ukasha, M., J. A. Ramirez, and J. D. Niemann. 2022. “Temporal Variations of NDVI and LAI and Interactions with Hydroclimatic Variables in a Large and Agro-Ecologically Diverse Region.” Journal of Geophysical Research: Biogeosciences 127 (4): e2021JG006395. https://doi.org/10.1029/2021JG006395.
- Wang, X., T. Li, H. O. Ikhumhen, and R. M. Sá. 2022. “Spatio-Temporal Variability and Persistence of PM2.5 Concentrations in China Using Trend Analysis Methods and Hurst Exponent.” Atmospheric Pollution Research 13 (1): 101274. https://doi.org/10.1016/j.apr.2021.101274.
- Wang, Y., Y. Shen, Y. Chen, and Y. Guo. 2013. “Vegetation Dynamics and Their Response to Hydroclimatic Factors in the Tarim River Basin, China.” Ecohydrology 6 (6): 927–936. https://doi.org/10.1002/eco.1255.
- Wang, J., Y. Wu, Z. Hu, and J. Zhang. 2023. “Remote Sensing of Watershed: Towards a New Research Paradigm.” Remote Sensing 15 (10): 2569. https://doi.org/10.3390/rs15102569.
- Wang, Z., P. Xie, C. Lai, X. Chen, X. Wu, Z. Zeng, and J. Li. 2017. “Spatiotemporal Variability of Reference Evapotranspiration and Contributing Climatic Factors in China During 1961–2013.” Canadian Journal of Fisheries and Aquatic Sciences 544: 97–108. https://doi.org/10.1016/j.jhydrol.2016.11.021.
- Wang, Y., J. Yang, Y. Chen, G. Fang, W. Duan, Y. Li, and P. De Maeyer. 2019. “Quantifying the Effects of Climate and Vegetation on Soil Moisture in an Arid Area, China.” Water 11 (4): 767. https://doi.org/10.3390/w11040767.
- Wang, J., J. Zhen, W. Hu, S. Chen, I. Lizaga, M. Zeraatpisheh, and X. Yang. 2023. “Remote Sensing of Soil Degradation: Progress and Perspective.” International Soil & Water Conservation Research 11 (3): 429–454. https://doi.org/10.1016/j.iswcr.2023.03.002.
- Wu, W., M. A. Geller, and R. E. Dickinson. 2002. “The Response of Soil Moisture to Long-Term Variability of Precipitation.” Journal of Hydrometeorology 3 (5): 604–613. https://doi.org/10.1175/1525-7541(2002)003<0604:TROSMT>2.0.CO;2.
- Yan, H., C. Lai, K. Akshalov, Y. Qin, Y. Hu, and L. Zhen. 2020. “Social Institution Changes and Their Ecological Impacts in Kazakhstan Over the Past Hundred Years.” Environmental Development 34:100531. https://doi.org/10.1016/j.envdev.2020.100531.
- Yao, J., Y. Chen, J. Chen, Y. Zhao, D. Tuoliewubieke, J. Li, L. Yang, and W. Mao. 2021. “Intensification of Extreme Precipitation in Arid Central Asia.” Canadian Journal of Fisheries and Aquatic Sciences 598:125760. https://doi.org/10.1016/j.jhydrol.2020.125760.
- Zeng, Z., L. Peng, and S. Piao. 2018. “Response of Terrestrial Evapotranspiration to Earth’s Greening.” Current Opinion in Environmental Sustainability 33:9–25. https://doi.org/10.1016/j.cosust.2018.03.001.
- Zeng, Z., S. Piao, L. Z. Li, T. Wang, P. Ciais, X. Lian, Y. Yang, J. Mao, X. Shi, and R. B. Myneni. 2018. “Impact of Earth Greening on the Terrestrial Water Cycle.” Journal of Climate 31 (7): 2633–2650. https://doi.org/10.1175/JCLI-D-17-0236.1.
- Zeng, Z., S. Piao, L. Z. Li, L. Zhou, P. Ciais, T. Wang, Y. Li, X. Lian, E. F. Wood, and P. Friedlingstein. 2017. “Climate Mitigation from Vegetation Biophysical Feedbacks During the Past Three Decades.” Nature Climate Change 7 (6): 432–436. https://doi.org/10.1038/nclimate3299.
- Zhang, Y., T. F. Keenan, and S. Zhou. 2021. “Exacerbated Drought Impacts on Global Ecosystems Due to Structural Overshoot.” Nature Ecology & Evolution 5 (11): 1490–1498. https://doi.org/10.1038/s41559-021-01551-8.
- Zhang, K., J. S. Kimball, R. R. Nemani, S. W. Running, Y. Hong, J. J. Gourley, and Z. Yu. 2015. “Vegetation Greening and Climate Change Promote Multidecadal Rises of Global Land Evapotranspiration.” Scientific Reports 5 (1): 15956. https://doi.org/10.1038/srep15956.
- Zhang, X., L. Liu, X. Chen, Y. Gao, S. Xie, and J. Mi. 2021. “GLC_FCS30: Global Land-Cover Product with Fine Classification System at 30 M Using Time-Series Landsat Imagery.” Earth System Science Data 13 (6): 2753–2776. https://doi.org/10.5194/essd-13-2753-2021.
- Zhang, W., G. Luo, R. Hamdi, X. Ma, Y. Li, X. Yuan, C. Li, et al. 2023. “Can Gross Primary Productivity Products Be Effectively Evaluated in Regions with Few Observation Data?” GIScience & Remote Sensing 60 (1): 2213489. https://doi.org/10.1080/15481603.2023.2213489.
- Zhang, J., H. Sun, X. Jiang, and J. He. 2022. “Evaluation of Development Potential of Cropland in Central Asia.” Ecological Indicators 142:109250. https://doi.org/10.1016/j.ecolind.2022.109250.
- Zhang, W., F. Wei, S. Horion, R. Fensholt, M. Forkel, and M. Brandt. 2022. “Global Quantification of the Bidirectional Dependency Between Soil Moisture and Vegetation Productivity.” Agricultural and Forest Meteorology 313:108735. https://doi.org/10.1016/j.agrformet.2021.108735.
- Zhang, L., J. Xiao, Y. Zheng, S. Li, and Y. Zhou. 2020. “Increased carbon uptake and water use efficiency in global semi-arid ecosystems.” Environmental Research Letters 15:3. https://doi.org/10.1088/1748-9326/ab68ec.
- Zhang, Y., and A. Ye. 2021. “Quantitatively Distinguishing the Impact of Climate Change and Human Activities on Vegetation in Mainland China with the Improved Residual Method.” GIScience & Remote Sensing 58 (2): 235–260. https://doi.org/10.1080/15481603.2021.1872244.
- Zhang, Y., Y. Zhang, X. Lian, Z. Zheng, G. Zhao, T. Zhang, M. Xu, et al. 2023. “Enhanced Dominance of Soil Moisture Stress on Vegetation Growth in Eurasian Drylands.” National Science Review. https://doi.org/10.1093/nsr/nwad108.
- Zhou, R., Y. Liu, M. Cui, J. Lu, H. Shi, H. Ren, W. Zhang, and Z. Wen. 2022. “Global Assessment of Cumulative and Time-Lag Effects of Drought on Land Surface Phenology.” GIScience & Remote Sensing 59 (1): 1918–1937. https://doi.org/10.1080/15481603.2022.2143661.
- Zhou, J., W. Sun, X. Meng, G. Yang, K. Ren, and J. Peng. 2022. “Generalized Linear Spectral Mixing Model for Spatial–Temporal–Spectral Fusion.” IEEE Transactions on Geoscience & Remote Sensing 60:1–16. https://doi.org/10.1109/TGRS.2022.3188501.
- Zhou, G., X. Wei, X. Chen, P. Zhou, X. Liu, Y. Xiao, G. Sun, D. F. Scott, S. Zhou, and L. Han. 2015. “Global Pattern for the Effect of Climate and Land Cover on Water Yield.” Nature Communications 6 (1): 5918. https://doi.org/10.1038/ncomms6918.
- Zhu, S., C. Li, H. Shao, W. Ju, and N. Lv. 2019. “The Response of Carbon Stocks of Drylands in Central Asia to Changes of CO2 and Climate During Past 35 years.” Science of the Total Environment 687:330–340. https://doi.org/10.1016/j.scitotenv.2019.06.089.
- Zou, J., J. Ding, M. Welp, S. Huang, and B. Liu. 2020. “Using MODIS Data to Analyse the Ecosystem Water Use Efficiency Spatial-Temporal Variations Across Central Asia from 2000 to 2014.” Environmental Research 182:108985. https://doi.org/10.1016/j.envres.2019.108985.