
ABSTRACT
Despite the importance of the Amazonian rainforests in the global carbon cycle, their phenological responses measured by large field-of-view satellite sensors are still not completely understood. In this scenario, close-to-nadir observations at high spatial and temporal resolutions made by satellite constellations may contribute to improve this knowledge. Here, we investigated the sensitivity of five vegetation indices (VIs) to canopy shadows over 15 protected forests of the Amazon, and the possible existence of coupled effects of solar illumination and vegetation phenology on the VI determination. The VIs are the Enhanced Vegetation Index (EVI), Green-Red Normalized Difference (GRND), Modified Photochemical Reflectance Index (MPRI), Normalized Difference Vegetation Index (NDVI), and RedEdge Normalized Difference (REND). They were calculated from 432 images obtained in 2022 by the Planet’s eight-band SuperDove instrument. Few daily images acquired on the same day with distinct Solar Zenith Angle (SZA) were used to disentangle the effects of solar illumination from those of vegetation phenology. The results showed the presence of coupled effects of solar illumination and vegetation phenology on the EVI determination regardless of the site location, especially over dense forests. Such effects were not observed significantly in the GRND, MPRI, NDVI, and REND data. When the vegetation phenology was kept fixed in the analysis, solar illumination generated pseudo-greening effects from the EVI, even for small differences in SZA between daily observations. As the most sensitive VI to illumination conditions, the EVI increased from the beginning to the end of the dry season tracking solar angles and shade fractions. This dry-season trend was not observed for GRND, MPRI, NDVI, and REND, which presented low correlations with SZA and shade fractions. These four VIs were correlated with each other over most sites, which explained the agreement observed between their seasonal profiles. From the analysis of 15 sites distributed throughout the Amazon, our findings did not confirm patterns of large-scale greening at the end of the dry season. Local changes in greening (vegetation productivity) and browning were captured by the VIs over a few sites but in different periods of the dry season (June to September). At the high spatial scale of SuperDove observations, our results highlight the necessity of correcting solar and, in some cases, terrain illumination effects on the EVI before retrieving phenological metrics over the Amazon.
1. Introduction
Tropical forests of the Amazon have an essential role on global carbon cycle and climate change (Gatti et al. Citation2021; Malhi et al. Citation2008). However, studies using the Enhanced Vegetation Index (EVI) from the Moderate Resolution Imaging Spectroradiometer (MODIS) showed divergences in the phenological response of these forests during the dry season or with severe droughts (Atkinson, Dash, and Jeganathan Citation2011; Huete et al. Citation2006; Morton et al. Citation2014; Saleska et al. Citation2007; Samanta et al. Citation2010; Xu et al. Citation2011). The debate on the possible existence of green-up events (high vegetation productivity) at the end of the dry season or under severe droughts has implications for the comprehension of the tropical forest resilience to climate change (Anderson et al. Citation2010; Brando et al. Citation2010; Galvão et al. Citation2011; Moura et al. Citation2012, Citation2017; Petri and Galvão Citation2019). As discussed recently by Gonçalves et al. (Citation2023), the resolution of this controversy is crucial for understanding the relationships between climate anomalies and primary productivity in the Amazon.
While the debate on the intra-annual MODIS EVI behavior rarely occurs in other biomes from Brazil, such as the savannas with marked seasonal changes in vegetation reflectance to the satellites, it has been addressed divergently over evergreen forests of the Amazon. The reason is probably the low variability of their phenological signals. Seasonally, possible biophysical or non-biophysical factors to explain the MODIS EVI increase from the beginning to the end of the dry season, thus under increased water deficit and high insolation, were recently overviewed by Petri et al. (Citation2022). They highlighted the changes in canopy greening, leaf area index (LAI), vegetation structure, and canopy demography as the possible biophysical factors explaining the EVI variability. On the other hand, they indicated bidirectional effects as a potential non-biophysical factor causing the EVI variability. Even the use of different approaches for correcting bidirectional effects on the EVI determination has generated divergent results in the literature (Morton et al. Citation2014; Moura et al. Citation2017; Petri, Galvão, and Lyapustin Citation2019; Wu et al. Citation2016). In reality, a common point between these studies is the use of the same metric (EVI) and satellite sensor (MODIS) to perform the analyses. The use of other VIs to investigate this phenomenon has been rarely considered in the investigations (Petri and Galvão Citation2019).
In this context, the recent advent of the PlanetScope satellite constellation (Planet Labs Inc.) may contribute to resolve this controversy. The use of close-to-nadir-viewing observations by the CubeSats can reduce the uncertainties observed in MODIS EVI analysis caused, for instance, by view angle and view direction. The third generation of PlanetScope sensors, known as SuperDove or PSB.SD, is currently in orbit since 2020 (Tu et al. Citation2022). Operating in Sun-synchronous orbit from an altitude of 500 km, the SuperDove acquires images in frame sizes of 32 km × 20 km with spatial resolution of 3.7 m and radiometric resolution of 12 bits (Saunier and Cocevar Citation2022). In 2022, after the multiple launches of groups of CubeSats, the SuperDove reached the ability to obtain daily observations over the Amazon in eight spectral bands (blue I, blue II, green I, green II, red I, red II, red edge, and near-infrared (NIR)). Using the surface reflectance of these bands, we can calculate not only the EVI (Huete et al. Citation2002) but also other important vegetation indices (VIs) having different sensitivities to biophysical and biochemical attributes of the tropical forests. Examples include the Green-Red Normalized Difference (GRND) (Moura et al. Citation2017); the Modified Photochemical Reflectance Index (MPRI), a variant of the original formulation proposed by Gitelson et al. (Citation1996); the Normalized Difference Vegetation Index (NDVI) (Rouse et al. Citation1973); and the RedEdge Normalized Difference (REND) (Gitelson and Merzlyak Citation1994).
During data acquisition by the SuperDove, the influence of view angle and view direction on VI determination is reduced compared to MODIS. However, the effects of solar illumination are still present in the images, producing variations in canopy and terrain illumination conditions (Petri et al. Citation2022). Solar illumination effects on VI determination have been reported in studies of satellite orbit change (Galvão, de Souza, and Breunig Citation2020; Zhang and Roy Citation2016). Furthermore, the influence of illumination conditions on the calculation of the Near-Infrared Reflectance of Vegetation (NIRv) has been recently studied by Chen et al. (Citation2023) over mountainous and non-mountainous sites from Europe. When extracting phenological information from NIRv, they highlighted the importance of further studies to address the illumination effects on the determination of other VIs.
At the high spatial resolution of SuperDove, VIs can have different sensitivities to the influence of canopy shadows and terrain illumination on the signals measured by the satellite constellation. Depending on the sensitivity of each VI to shaded canopies, coupled effects of solar illumination and vegetation phenology may be observed together over evergreen forests of the Amazon. This possibility needs to be further investigated. Selection of the less sensitive VIs to such effects is important for future studies using high spatial and temporal resolution data of the SuperDove aiming at accurately extracting metrics of Land Surface Phenology (LSP). This is especially important over the Amazon, which covers impressively a large area of Brazil between 5 degrees north latitude and 15 degrees south latitude. During acquisition of the remote sensing data in the period representative of the Amazonian dry season (June to September, as discussed by Moura et al. Citation2015), differences in Solar Zenith Angle (SZA) are significative and can reach values higher than 16° (Galvão et al. Citation2011). Changes in Solar Azimuth Angle (SAA) and, especially SZA, can generate different amounts of canopy shadows viewed by the satellite constellations, affecting shade fractions from spectral mixture analysis (SMA) and image texture metrics (Petri et al. Citation2022). Because of the low seasonal variability in the phenological signal captured by the satellites over the Amazonian tropical forests, solar and terrain illumination effects on VI determination should be considered with care for selection of the most suitable indices for LSP investigations in this region.
In this study, we investigated the sensitivity of five VIs (EVI, GRND, MPRI, NDVI, and REND) to canopy and terrain shadows sensed by the SuperDove instrument over 15 protected forests of the Amazon. We evaluated for the first time the possible existence of coupled effects of solar illumination and vegetation phenology on the determination of these VIs. Using 432 images obtained in 2022 by the SuperDove satellite constellation, we analyzed the sensitivity of these five VIs to variations in solar angles and shade fractions from SMA, and the resultant modifications in image texture. By detecting the less sensitive VIs to illumination conditions, we inspected the consistency of their seasonal profiles in capturing greening and browning events over the sites. Finally, few daily CubeSat observations acquired on the same day with distinct SZA were additionally used to decouple the effects of solar illumination from those of vegetation phenology.
2. Methodology
2.1. Site selection and description
We selected 15 sites of 5 km × 5 km in size to cover distinct geographic locations (latitude and longitude) of the Amazon in Brazil (). The sites are located over protected areas of the Amazon (parks, ecological stations, biological reserves, and indigenous lands), thus representing forests with little to no human disturbances in recent years. They are organized in and with increasing latitude from north (site 1) to south (site 15) of the region. The sites include the Biological Reserve of Trombetas River (BRTR), Uatumã Biological Reserve (UBR), Jaú National Park (JNP), Juami-Japurá Ecological Station (JJES), Tapajós National Forest (TNF), National Park of Amazônia (NPA), Ecological Station of Terra do Meio (ESTM), National Park of Nascentes do Lago Jari (NPLJ), Juruena National Park (JUNP), National Park of Serra do Divisor (NPSD), National Forest Mapiá-Inauini (NFMI), Menkragnoti Indigenous Reserve (MIR), Japuira Indigenous Reserve (JIR), Pacaás Novos National Park (PNNP), and the Xingu Indigenous Park (XIP) ().
Figure 1. Location of the 15 sites selected for data analysis of the SuperDove satellite constellation in the Brazilian Amazon region. The map of mean Maximum Cumulative Water Deficit (MCWD) in the 1981–2020 period (mm.yr−1) is based on Silva Junior et al. (Citation2021). The sites are numbered with increasing latitude from north to south of the Amazon: 1. Biological Reserve of Trombetas River (BRTR); 2. Uatumã Biological Reserve (UBR); 3. Jaú National Park (JNP); 4. Juami-Japurá Ecological Station (JJES); 5. Tapajós National Forest (TNF); 6. National Park of Amazônia (NPA); 7. Ecological Station of Terra do Meio (ESTM); 8. National Park of Nascentes do Lago Jari (NPLJ); 9. Juruena National Park (JUNP); 10. National Park of Serra do Divisor (NPSD); 11. National Forest Mapiá-Inauini (NFMI); 12. Menkragnoti Indigenous Reserve (MIR); 13. Japuira Indigenous Reserve (JIR); 14. Pacaás Novos National Park (PNNP); and 15. Xingu Indigenous Park (XIP).
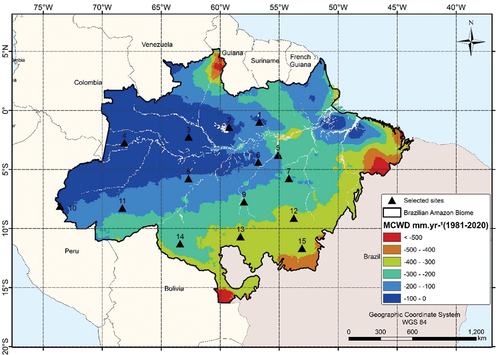
Table 1. Brief description of the 15 sites selected for analysis of the SuperDove data in the Brazilian Amazon. The central geographical coordinates of each site (5 km × 5 km size) are presented. The average Maximum Cumulative Water Deficit (MCWD) in the 1981–2020 period is based on Silva Junior et al. (Citation2021). The last two columns refer to the local range of elevation obtained from SRTM data.
Using these geographic locations, we also sampled distinct terra firme forest types (e.g. open and dense ombrophilous forests) and climatic conditions. For instance, sites located in the eastern Amazon (ESTM, MIR, and XIP; sites 7, 12 and 15 in ) have large mean negative values (1981–2020 period) of Maximum Cumulative Water Deficit (MCWD) than sites located in the western Amazon (JJES and NPSD; sites 1 and 10 in ). This fact indicates a decreasing gradient in water stress from east to west of the Amazon (Aragão et al. Citation2007; Silva Junior et al. Citation2021; Silveira et al. Citation2020). Located in the southern Amazon, the MIR, PNNP and XIP are the most affected sites by water stress (). In contrast, the Mean Annual Precipitation (MAP) on the JJES site is 3400 mm.yr−1 (WorldClim v2 data; Supplementary Figure S1) with MCWD between −100 and 0 mm.yr−1. The length of the dry season is therefore variable over the selected sites, reaching values of up to 5 months in the southeastern Amazon, and of less than 2 months toward the western Amazon. For practical comparisons, we assume hereafter the period between June and September as representative of the dry season for the entire region, following the discussion by Moura et al. (Citation2015). In this period, the highest and lowest values of SZA are observed in July and September, respectively.
Finally, except for the NPSD (site 10 in and ), the difference in the minimum and maximum elevation (last two columns of ), recorded by the Shuttle Radar Topography Mission (SRTM), was generally lower than 100 m.
2.2. SuperDove data acquisition
We focused on data acquisition in 2022, the year when the SuperDove instrument reached the capacity of acquiring near daily observations due to the large availability of CubeSats in orbit. The PlanetScope OrthoScene Surface Reflectance Product (Level 3B) was selected for the data analysis. This product includes geometric, atmospheric, and radiometric corrections. The Planet’s approach used for atmospheric correction combines the use of standard atmospheric models (6S radiative transfer code) with ancillary information on water vapor, ozone, and aerosol data provided by MODIS (Wang et al. Citation2020).
In Sun-synchronous orbit, the SuperDove obtained a total of 432 cloud-free images over the 15 sites. The data were acquired in eight spectral bands with a spatial resolution of 3.7 m and radiometric resolution of 12 bits (). Bandwidth ranged from 16 nm (Red-Edge) to 50 nm (Blue II). Even considering its ability to produce daily observations, the frequency of cloud-free images differed significantly from the rainy (October to May) to the dry (June to September) season of the Amazon, and across the sites. The frequency of SuperDove observations increased toward the dry season, and from north to south of the Amazon, with the reduction in cloud cover (). The period between January and March was the most difficult to obtain cloud-free images (DOY 1 to 90 in ). The minimum number of observations in 2022 was recorded on TNF site (n = 18 dates), an area marked by persistent cloud cover. The maximum number of scenes was obtained at XIP (n = 44 dates) in southern Amazon.
Figure 2. Frequency of cloud-free observations made by the SuperDove in 2022 for each of the 15 selected sites in the Amazon region. The total number of images is 432. The period representative of dry season (June to September) is highlighted by the shaded time interval. Approximate values of south latitude are only shown for reference. Site abbreviations are defined in . The colors facilitated graphical representation of the sites located in the north (magenta), center (blue), and south (red) regions of the Amazon.
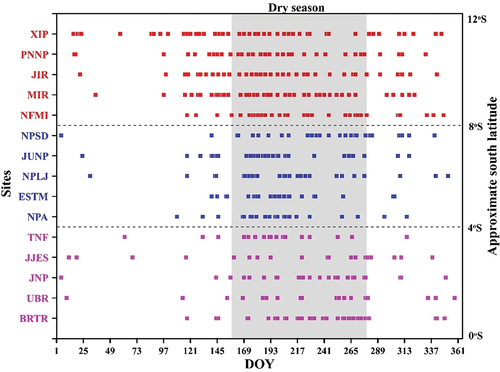
Table 2. Spectral bands and resolutions of the PlanetScope SuperDove instrument.
Data acquisition generally occurred in less than an hour between 14:00 and 15:00 UTC. As shown in Table S1 (Supplementary Material), SuperDove observations in most sites were generally recorded between 10:00 a.m. and 10:30 a.m. (local time). During image selection, we prioritize observations at close-to-nadir-viewing with less than 5° view angle (Table S1).
2.3. Selection of vegetation indices (VIs)
We selected five VIs to study their sensitivity to illumination conditions and the possible existence of coupled effects of vegetation phenology and solar illumination: the EVI, GRND, MPRI, NDVI, and REND (). Except for the EVI, the remaining indices are calculated using normalized reflectance differences between pairs of bands. These VIs explored different combinations of SuperDove bands positioned in the visible and NIR spectral regions. They were selected because of their sensitivity to different biophysical and biochemical attributes of tropical forests. For instance, the EVI is the most sensitive VI to vegetation structure because of its largest dependence on the NIR band reflectance when compared to the blue and red band reflectance (Galvão et al. Citation2011). The EVI reduces limitations of the NDVI associated with signal saturation over dense vegetation or with soil background influence over sparse vegetation (Haddad et al. Citation2022; Huete et al. Citation2002).
Table 3. Vegetation indices (VIs) selected for the data analysis. The original formulations were adapted to band positioning of the SuperDove instrument. Bands 2 (blue band II centered at 490 nm), 3 (green band I at 531 nm), 4 (green band II at 565 nm), 6 (red band II at 665 nm), 7 (red-edge band at 705 nm) and 8 (NIR band at 850 nm) were used in the equations. The predominant vegetation sensitivity of each index and related references are indicated. VI abbreviations are defined in the text. ρ is the reflectance.
Another potentially important VI in the study of Amazonian tropical forests is the GRND. It is potentially sensitive to leaf flushing (Moura et al. Citation2017). GRND may detect seasonal changes in new foliage, which tend to produce light green leaves or larger modifications in the reflectance of the SuperDove green band II, compared to the reflectance of the red band II ().
The equation adopted in for calculating the MPRI was just a variant of the original formulation proposed by Gamon et al. (Citation1997). It was adapted to transform negative values into positive ones. Using two adjacent narrow green bands of the SuperDove (Green I and II in ), the MPRI is potentially sensitive to changes in carotenoid pigments in live foliage. It is therefore a proxy of photosynthetic light use efficiency and, thus, vegetation productivity and stress (Gamon, Serrano, and Surfus Citation1997). The green band placed at 565 nm is used as a reference to track changes in carotenoids at 531 nm.
Finally, the REND explores the steeply sloped region of the vegetation reflectance spectrum (red-edge between 690 nm and 750 nm). The red-edge interval represents the transition from chlorophyll absorption to leaf-canopy scattering (Gitelson and Merzlyak Citation1994).
2.4. Data analysis
Our analysis addressed the effects of SZA and SAA on the determination of the five VIs listed in . Using the metadata available in the SuperDove dataset of each site, we first examined the behavior of these solar angles during image acquisition in 2022. We then inspected seasonal variations in average reflectance of the SuperDove bands used to obtain the VIs. For this purpose, we used an automated procedure to sample randomly 5% (approximately 90,000 pixels) of the total number of pixels of each scene after masking, whenever necessary, non-vegetated components. This strategy of sampling 5% of the pixels was employed to ensure confidence in representation of the high spatial resolution scene and to guarantee normal distribution of the data in the statistical analysis. Using the same sampling strategy, seasonal profiles were also generated for each VI and site in order to evaluate the possible influence of coupled biophysical and non-biophysical factors on the data variability. Running average from five-point window size was applied to smooth the data. We inspected the agreement between the seasonal profiles generated from different VIs by correlating them to each other on a per-site basis.
To investigate the influence of solar angles on the determination of VIs per site, we correlated SZA and SAA with average values of the EVI, GRND, MPRI, NDVI, and REND calculated from each date. Changes in both angles can potentially affect the amount of sunlit and shaded canopies viewed by the CubeSats, including resultant shadows from terrain illumination effects. Because shadow is the most important factor in solar illumination studies, we used the Sequential Maximum Angle Convex Cone (SMACC) technique to automatically find spectral endmembers and their abundances on each image (Gruninger, Ratkowski, and Hoke Citation2004). The technique has been implemented in the Environment for Visualising Images (ENVI) software (L3Harris Geospatial Solutions, Inc., version 5.6.3). The automated procedure was applied to each dataset and site using the surface reflectance of the eight SuperDove bands as input data for modeling. SMACC uses residual minimization (convex cone model) to find pixels with contrasting brightness in the scene. Thus, pixels with low and high reflectance are defined a priori as candidate endmembers. The process of finding these pixels is repeated until a user-defined number of endmembers is reached or when a pixel already detected is captured again (Gruninger, Ratkowski, and Hoke Citation2004). In our analysis, we defined the maximum number of endmembers as five for simplicity of the model and set the unmixing Root Mean Squared Error Tolerance to 0.01. We also constrained the endmember spectra to positive values for any wavelength. To merge candidate endmembers with spectra of similar shape or redundant reflectance response, the Spectral Angle Mapper (SAM) technique was used as part of the SMACC algorithm. We set an angle of 0.10 radians below which the merging was performed. Thus, we did not fix the endmembers per site or date to avoid any interference in the analysis. We kept focusing on the resultant shade fraction from SMACC, which was further correlated with solar angles and VIs.
Following the approach by Petri et al. (Citation2022), we performed Gray-Level Co-occurrence Matrix (GLCM) texture analysis over the NIR band 8 of the SuperDove (Haralick, Shanmugam, and Dinstein Citation1973). In the NIR spectral interval, the transmittance through canopies is higher than that observed in the visible region. Consequently, vegetation structure heterogeneity and canopy shadows are enhanced for the CubeSats. Using high spatial resolution data of the SuperDove, we investigated whether solar illumination effects produced textural variations in the images. For extracting texture metrics, we chose a window size of 3 × 3 pixels, a grayscale quantization level of 64, and a co-occurrence shift of 1 × 1 pixel. The selection of this window size followed the recommendations by Wood et al. (Citation2012) and Zhou et al. (Citation2017) to extract texture information efficiently from high spatial resolution images. Eight metrics were considered in the analysis with equations and meaning described by Haralick et al. (Citation1973) and Zhou et al. (Citation2017): texture mean, variance, dissimilarity, entropy, homogeneity, contrast, second moment, and correlation.
During the data analysis, we applied paired-samples t-tests over the texture metrics calculated from July and September on each site. These 2 months have the highest and lowest SZA in the dry season, respectively, representing the middle and end of this period in the Amazon. For each metric, we tested whether the average of the two datasets in July and September was different at 95% confidence interval. In addition to using p-values to detect statistically significant differences between the means of two datasets, we calculated the size of this effect using the standard deviation of the difference. We obtained the Hedges’ G metric and adopted the thresholds of 0.2, 0.5, and 0.8, respectively, to express small, medium, and large effects of solar illumination on the results (Lakens Citation2013).
Finally, considering the possibility that biophysical and non-biophysical signals can be coupled together in the determination of a given VI, we disentangled the impact of solar illumination from that of vegetation phenology. For decoupling these effects, two SuperDove observations made during the same day over the BRTR site were used in the data analysis. Because of the partial overlapping between the two image acquisitions, only small portions of the original scenes (stripe of 0.8 km × 1.6 km in size) were sensed twice on the same day. The SZA difference between the two daily acquisitions was small, reaching values of 9°. SAA and view angles were approximately similar. Assuming that no significant variations in vegetation structural properties occurred in a period lower than 1 hour, we tested the hypothesis that there were statistical differences in VI means between the pair of daily images. Moreover, we calculated the size of the differences caused solely by changes in SZA, plotting the results in histograms.
3. Results
3.1. Variations in reflectance, shade fraction, and image texture with solar angles
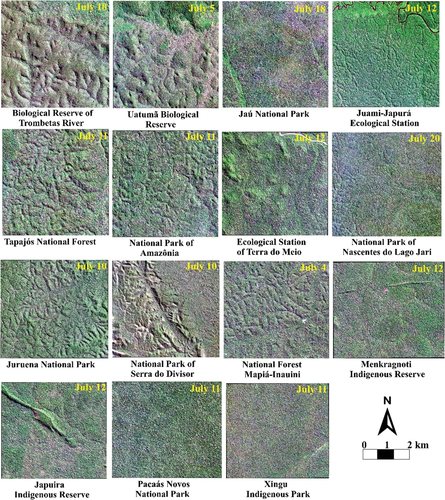
Despite the absence of strong variations in elevation data over most sites (), observations made by the SuperDove captured significant differences in smooth and rough surfaces across the sites (). The drainage network generally delineated minor topographic features derived from the undulating relief. At the high spatial resolution (3.7 m), these terrain illumination effects produced different amounts of shadows for the CubeSats. Topographic features were better visualized in the SuperDove images from July, thus obtained under high SZA. On the other hand, smoothed vegetated surfaces were mainly associated with open ombrophilous forests or transitional forests close to savannas, located in the southern Amazon (e.g. JIR, PNNP, and XIP sites in ).
Figure 3. SuperDove true-color composites obtained in July 2022 for each one of the 15 sites located in the Brazilian Amazon. The composites used the bands 6 (650–680 nm), 4 (547–583 nm), and 2 (465–515 nm) in red, green and blue colors, respectively.
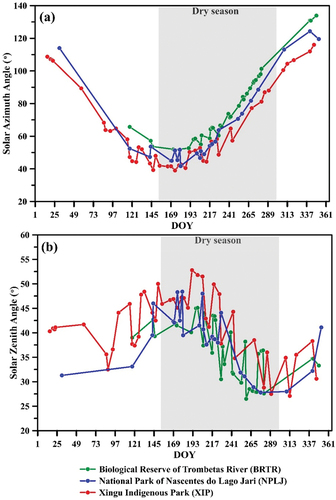
During the SuperDove imaging over the sites, the SZA amplitude (maximum minus minimum SZA in the time series) ranged from 16° (JJES and ESTM) to 28° (JIR) (Table S1 in Supplementary Material). The SAA amplitude in the time series varied from 64° (ESTM) to 84° (JNP). In , variations in SAA and SZA were plotted for two sites with extreme latitudinal location in the Amazon (BRTR in the north and XIP in the south). We also included a site located at middle latitude (NPLJ). Following the trend observed at all sites, the SAA increased from the beginning (DOY 169 in June) to the end of the dry season (DOY 273 in September), and from south (XIP) to north (BRTR) of the Amazon (). In contrast, the SZA decreased toward the end of the dry season, and increased from north to south of the Amazon (). The SAA reached maximum values over the three sites at the end of 2022, and then decreased from January to July up to DOY 193 (). In , data variability associated with SZA over the three sites resulted from variations in local time of the satellite constellation overpass (Supplementary Table S1). Variations in SAA and SZA for each one of the 15 selected sites are shown in the Supplementary Figure S2.
Figure 4. Variations in (a) Solar Azimuth Angle and (b) Solar Zenith Angle during SuperDove imaging in 2022 over three sites located at low (BRTR), middle (NPLJ), and high (XIP) latitudes of the Amazon. The dry season (June to September) is indicated for reference. Dates of image acquisition are represented by symbols. Solar angles were extracted from the SuperDove metadata.
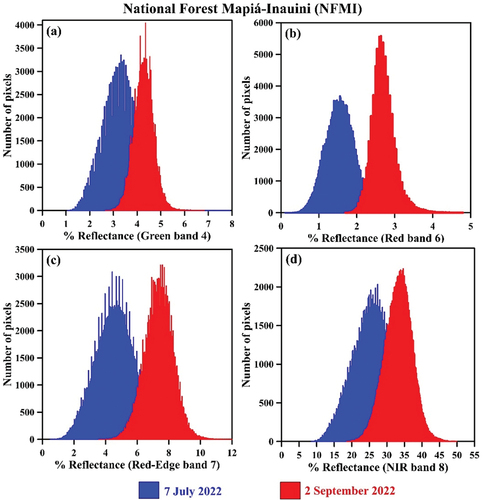
Both solar angles therefore affected the amounts of sunlit and shaded canopies viewed by the CubeSats as well as the magnitude of terrain illumination effects captured by the SuperDove. The increase in SAA and, especially, the decrease in SZA toward the end of the dry season, contributed to the reduced amounts of shadows viewed by the SuperDove in September (DOY 273), as proxied by shade fractions calculated over time using the SMACC technique (). The shade fraction was higher over dense ombrophilous forests of the BRTR site than over seasonal semi-deciduous forests of the XIP site. In both sites, the shade fraction decreased from July (DOY 193) to September (DOY 273) with decreasing SZA toward the end of the dry season. Consequently, the reflectance of red and NIR bands of the SuperDove generally tracked the temporal variations observed in shade fractions, as shown in for the XIP site. In fact, regardless of the geographic location of the site, the increase in reflectance was observed from July (highest SZA and lowest SAA) to September (lowest SZA and highest SAA) over all sites and bands used to calculate the VIs, as observed at the NFMI ().
Figure 5. Seasonal changes in shade fractions over the XIP and BRTR sites. The fractions were calculated from the SMACC technique using the reflectance of eight bands of the SuperDove for data modeling. The dry season (June to September) is indicated for reference. Running average was applied over the data.
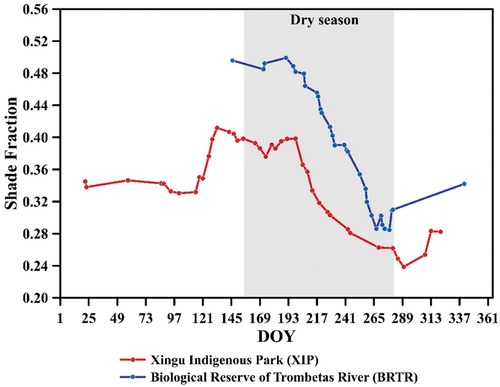
Figure 6. Seasonal changes in reflectance of the red and near-infrared (NIR) bands of the SuperDove for data acquired in 2022 over the Xingu Indigenous Park (XIP). The dry season (June to September) is indicated for reference.
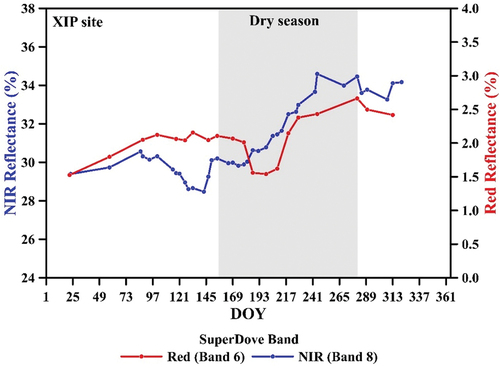
Figure 7. Reflectance differences in four bands used to calculate the vegetation indices between images acquired in the dry season under high (July) and low (September) Solar Zenith Angle (SZA). The data were obtained over the National Forest Mapiá-Inauini (NFMI).
When we calculated the GLCM texture metrics from the NIR band 8 of SuperDove, we observed large solar illumination effects for most sites only for texture mean (). In general, the texture mean (the local mean value of the 3 × 3-pixel processing window) increased from July (high SZA) to September (low SZA). On the other hand, texture variance (the local variance of the processing window) decreased toward the end of dry season due to the reduction in canopy and terrain shadows viewed by the SuperDove instrument. We did not observe a well-defined trend for the other six GLCM texture metrics ().
Table 4. Dry-season changes in GLCM texture metrics calculated from the near-infrared band 8 of the SuperDove. Pairs of images from July (high SZA) and September (low SZA) were selected on each site. Differences in angles (amplitude) for the two selected dates are shown in the last column (ΔSZA). Values of t for the comparison of means (paired-sample tests) and of Hedge’s G (H) for the comparison of effect size are presented for each metric. L for large (H > 0.80), M for medium (H between 0.50 and 0.80), and S for small (H < 0.50) indicate the effect size of solar illumination. Differences in means were statistically significant at the 0.05 level, except for a few relationships marked with asterisk (*). Large and medium effect sizes are highlighted in bold. Site abbreviations are defined in and .
3.2. VIs and sensitivity to illumination conditions
Compared to the GRND, MPRI, NDVI, and REND, the EVI was the most sensitive index to illumination conditions. An example is presented in for the JIR site, using a pair of SuperDove images obtained in the dry season with high SZA in July (47°) and low SZA in September (27°). From the left (12 July) to the right side (26 September) of : (i) the reflectance of the SuperDove NIR band 8 increased (bright pixels), and major and minor topographic features became less apparent for viewing; and (ii) the shade fraction decreased, as indicated by changes in the predominant density-sliced colors from blue and green to yellow.
Figure 8. Dry-season changes in the near-infrared (NIR) reflectance of the SuperDove band 8 and in the shade fraction. Results are presented for the Japuira Indigenous Reserve (JIR) for contrasting Solar Zenith Angles (SZA) during image acquisition on July 12 (high SZA) and September 26 (low SZA), 2022. The NIR reflectance increased from July to September (bright pixels), while the shade fraction decreased towards the end of the dry season (blue/green to yellow colors).
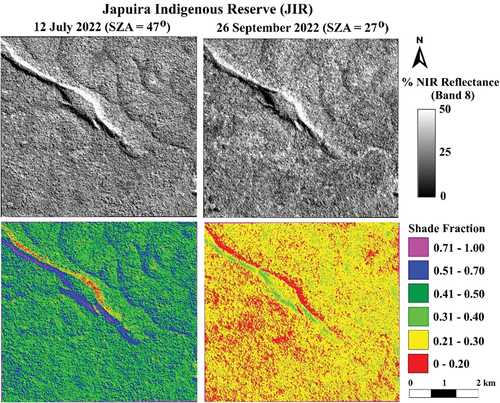
Figure 9. Dry-season changes in the Enhanced Vegetation Index (EVI), Green-Red Normalized Difference (GRND), Modified Photochemical Reflectance Index (MPRI), Normalized Difference Vegetation Index (NDVI), and Red Edge Normalized Difference (REND). Results are presented at the Japuira Indigenous Reserve (JIR) for contrasting Solar Zenith Angles (SZA) during image acquisition on July 12 (high SZA) and September 26 (low SZA), 2022. EVI increased from July to September, while GRND, NDVI, and REND decreased towards the end of the dry season.
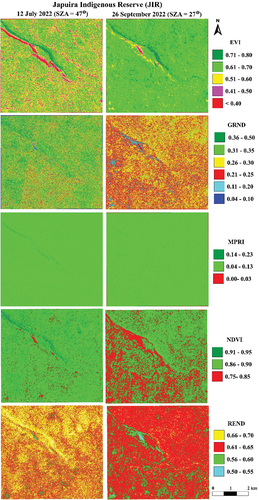
From the left (12 July) to the right side (26 September) of : (i) the EVI increased (changes into predominant green color), tracking the behavior of the NIR reflectance and shade fraction images of ; and (ii) the other VIs had an opposite behavior from that of EVI, decreasing toward the end of the dry season in September (predominance of red color) or keeping approximately the same values (e.g. MPRI in ). The effect of topographic shadows in the middle of the scene of the JIR site was strong on the EVI and was less apparent for the other VIs (). At the high spatial resolution of SuperDove observations, canopy shadows reduced the EVI values, as indicated by scattered red colors over pixels of the July image, which turned into green colors in the September image (). Because of the antagonistic behavior of the EVI in relation to the other VIs, solar illumination effects were probably coupled with the biophysical information on its determination.
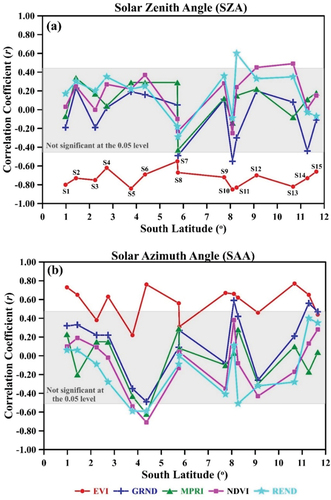
When we correlated each VI with the SZA, we observed statistically significant inverse relationships over all sites only for the EVI, which was an indicative of the existence of such coupled effects between biophysical and non-biophysical factors (). Since the GRND, MPRI, NDVI, and REND did not present significant correlations with SZA at the 0.05 level over most sites, we assumed that they reduced the influence of solar illumination on their determination. Surprisingly, the magnitude of the relationships between EVI and SZA in was not driven by the geographical location (latitude) of the sites. Results can indicate, to some extent, the forest type dependence of the relationships at the high spatial resolution. For instance, the largest r values between EVI and SZA were observed at sites 5 (TNF), 10 (NPSD), and 11 (NFMI), ranging from −0.83 to −0.85. These sites have predominantly dense ombrophilous forests. On the other hand, the relationships between EVI and SAA were positive over all sites, but less strong than those observed for SZA (). The largest positive r values for the EVI were obtained at BRTR in the northern Amazon (r = +0.73) and at NPA (r = +0.75) in the central Amazon ( and 10b). Except for a few sites, the other four VIs did not present statistically significant correlations with SAA ().
Figure 10. Pearson’s correlation coefficients for the relationships of vegetation indices with (a) Solar Zenith Angle, and (b) Solar Azimuth Angle for each of the 15 studies sites, organized with increasing latitude from north to south of the Amazon region. The shaded portion of the figures indicated correlations without statistical significance at the 0.05 level. The sites numbered by Sn in (a) are listed in .
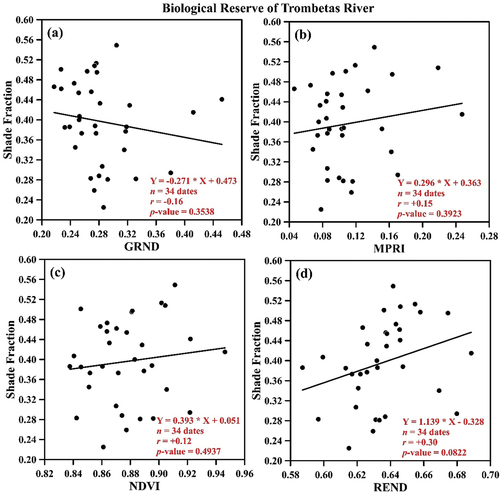
An example of the relationships between VIs and SZA is illustrated in for the BRTR site, located in the northern Amazon, thus close to the equatorial line. The EVI decreased with increasing SZA (r = −0.80) in a linear relationship (), while the results for the GRND (), MPRI (), NDVI () and REND () were not statistically significant at the 0.05 level, as indicated by p-values. The EVI was much more sensitive to solar illumination effects or shadows because it was highly dependent on the reflectance of the NIR band 8 of the SuperDove, as expressed by the high correlation coefficient between NIR reflectance and EVI in (r = +0.98). The strong dependence of the EVI on NIR-band reduces signal saturation that is commonly observed in the NDVI with increasing LAI over dense forests. The EVI was also inversely correlated with the shade fraction (r = −0.85 in ), which in turn was positively correlated with the SZA (r = +0.80 in ). When compared to the EVI (), the relationships of shade fractions with GRND (), MPRI (), NDVI (), and RENDVI () were weaker and not statistically significant at the 0.05 level. All the scatterplots for the relationships between VIs and SZA are presented on a per-site basis in Supplementary Figures S3 (EVI), S4 (GRND), S5 (MPRI), S6 (NDVI), and S7 (REND).
Figure 11. Relationships at the Biological Reserve of Trombetas River (BRTR) of Solar Zenith Angle (SZA) with the (a) Enhanced Vegetation Index (EVI), (b) Green-Red Normalized Difference (GRND), (c) Modified Photochemical Reflectance Index (MPRI), (d) Normalized Difference Vegetation Index (NDVI), and (e) Red Edge Normalized Difference (REND). Colored text in green summarizes statistically significant correlations at the 0.05 significance level, while text in red indicates the absence of significance, as expressed by p-values.
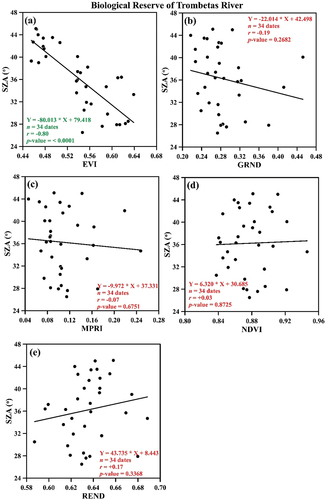
Figure 12. Relationships at the Biological Reserve of Trombetas River (BRTR) of the Enhanced Vegetation Index (EVI) with the (a) Near-Infrared (NIR) reflectance (SuperDove band 8) and (b) shade fraction from SMACC analysis. In (c), results are presented for the relationship between Solar Zenith Angle and shade fraction.
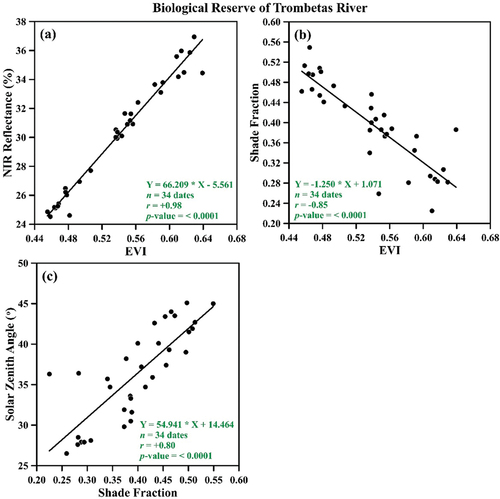
Figure 13. Relationships at the Biological Reserve of Trombetas River (BRTR) of the shade fraction from SMACC analysis with the (a) Green-Red Normalized Difference (GRND), (b) Modified Photochemical Reflectance Index (MPRI), (c) Normalized Difference Vegetation Index (NDVI), and (d) RedEdge Normalized Difference (REND). The relationships were not statistically significant at the 0.05 level.
3.3. VIs and vegetation phenology
We inspected the consistency of the seasonal profiles of the different VIs on each site from a phenological point-of-view. For instance, seasonal profiles obtained by the SuperDove satellite constellation over five sites of the Amazon are shown in for the EVI, GRND, MPRI, NDVI, and REND. There was an overall agreement in the seasonal behavior of GRND, MPRI, NDVI, and REND, which was not consistent with that from the EVI, the most sensitive VI to illumination effects. These four VIs were correlated with each other on a per-site basis with most sites presenting statistically significant positive correlations (0.01 level) (). In contrast, EVI was not significantly correlated with any other VI over most sites. Pearson’s correlation coefficients between the five VIs are shown for each1 of the 15 sites in Supplementary Tables S2 to S16.
Figure 14. Seasonal profiles obtained over tropical forests of five sites of the Amazon for the (a) Enhanced Vegetation Index (EVI), (b) Green-Red Normalized Difference (GRND), (c) Modified Photochemical Reflectance Index (MPRI), (d) Normalized Difference Vegetation Index (NDVI), and (e) Red Edge Normalized Difference (REND). The dry season (June to September) is indicated for reference. Running average was used to smooth the data. Solar illumination effects are coupled with vegetation phenology information on EVI profiles.
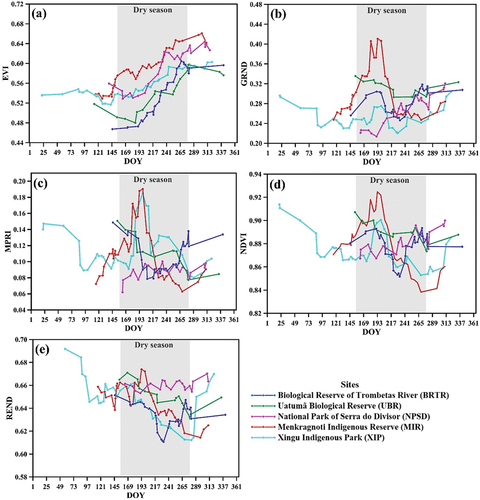
Table 5. Pearson’s correlation coefficients for the relationships between the five vegetation indices under analysis at the Menkragnoti Indigenous Reserve (MIR) site. Relationships statistically significant at the 0.01 level are indicated by asterisks.
In , the VI profiles showed a variety of tropical forest responses over the sites that deserved attention. For instance, as a predominantly structural index, the EVI separated dense ombrophilous forests of the BRTR (blue line in ) and UBR (green line in ) sites from open forests of the other locations. Dense ombrophilous forests produced great amounts of canopy shadows for the SuperDove and low NIR reflectance, thus generating lower EVI values than those observed in less shaded open forests. As illustrated in by the proximity of the EVI curves between the sites, the separability between dense and open forests was worse in September (DOY 273) than in July (DOY 193), that is, with decreasing SZA toward the end of the dry season (less shadows for the CubeSats). The EVI modifications with decreasing SZA were forest-type dependent and were stronger over dense forests than open forests, as indicated by the strongly ascending EVI curves observed at the BRTR and UBR sites ().
Other seasonal VI responses captured in the time series by the SuperDove included some greening effects (increase in vegetation productivity). These effects were better observed during the dry season over three sites: BRTR (blue line in ), MIR (red line), and XIP (cyan line). BRTR is located in the northern Amazon in a region less affected by water stress (site 1 in with MCWD between −200 and −100 mm.yr−1). In contrast, the other two sites are located in the southern Amazon in a region of high-water stress (sites 12 and 15 in with MCWD between −300 and −400 mm.yr−1).
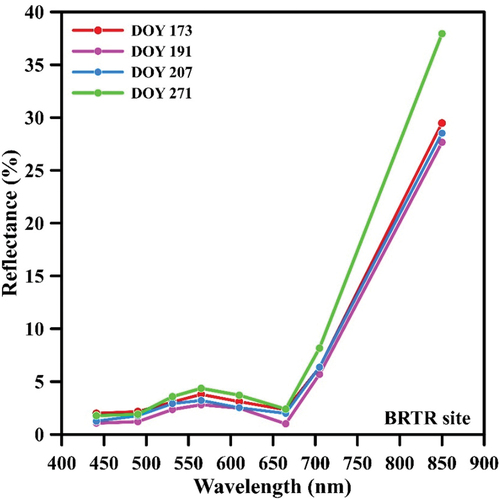
At the BRTR site, greening effects were recorded in two distinct events during the dry season by VIs like GRND () and NDVI (). As shown in for a small portion of the BRTR site, greening effects were first observed between June (DOY 173) and July (DOY 191) at low elevation terrains and under large SZA (40°). In , this fact was expressed by increasing greenish colors in RGB false-color composites using the SuperDove bands 6 (Red II), 8 (NIR), and 4 (Green II), respectively. The effects decreased at the end of July (DOY 207 in ) before spreading out to high elevations toward the end of the dry season under low SZA (DOY 271 in September with 28° of SZA). Therefore, greening effects produced surface reflectance changes in both visible and NIR bands of the SuperDove. The reflectance of all SuperDove bands decreased from June (DOY 173) to July (DOY 191) under large SZA, and then markedly increased toward the end of the dry season (DOY 271) due to the existence of coupled effects of solar illumination and vegetation phenology (). Except for the EVI that had an opposite trend in the time series (), solar illumination effects were reduced after the determination of the other VIs ().
Figure 15. Northeastern portion of the Biological Reserve of Trombetas River (BRTR), showing greening effects between June (DOY 173) and July (DOY 191). The effects were first observed at low elevation terrains, as expressed by greenish colors in the false-color composites using SuperDove bands 6 (red II), 8 (NIR), and 4 (green II). The effects decreased at the end of July (DOY 207) before spreading out to high elevations towards the end of the dry season (DOY 271; September).
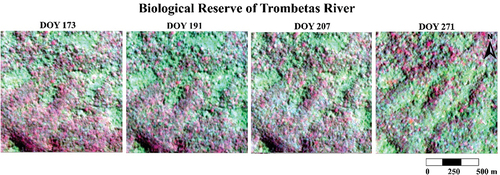
Figure 16. Average reflectance spectra measured by the SuperDove over the northeastern portion of the Biological Reserve of Trombetas River (BRTR). The symbols indicate the center of the bands. Changes in reflectance between DOY 173 (12 June 2022) and 271 (28 September 2022) are produced by coupled effects of solar illumination and vegetation phenology.
At the MIR and XIP sites, the GRND and MPRI increased between June (DOY 169) and July (DOY 193), indicating possible changes in photosynthetic processes and new foliage, respectively (). However, except for the EVI, such greening events observed between June and July were followed by decreasing values of the other VIs with increasing water stress toward the end of the dry season (DOY 265), thus producing browning effects in September. In fact, greening effects over the MIR and XIP sites were captured by all VIs, but in an antagonistic way. For example, GRND (), MPRI (), NDVI () and REND () showed an increase in July followed by a decrease toward the end of the dry season with increasing water stress. In contrast, the EVI recorded this event over both sites with increasing values from July to September due to the coupled influence of solar illumination on the vegetation phenological response ().
3.4. Decoupling vegetation phenology from solar illumination effects
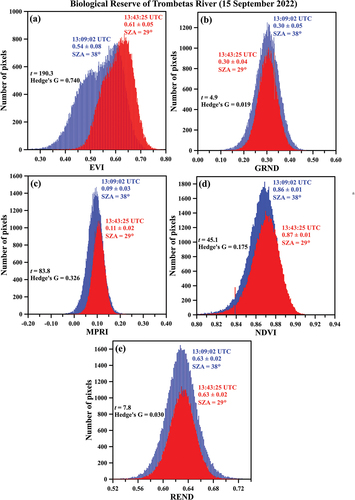
To confirm the hypothesis of the greater influence of solar illumination on the EVI determination and to decouple these illumination effects from those of vegetation phenology, we plotted in histograms derived from the use of a pair of images obtained by the SuperDove on 15 September 2022. The images were obtained over dense ombrophilous forests at the BRTR site. Despite the small difference in SZA between the two daily image acquisitions in a period less than 1 hour (ΔSZA = 9°), the Hedge’s G metric indicated a medium to large effect size (0.740) of solar illumination on the determination of EVI, which therefore recorded pseudo-greening effects (). In other words, EVI increased with decreasing SZA from earlier (38°) to later (29°) satellite overpass, having a change of approximately 0.74 standard deviation from the mean. In contrast, the size of the differences observed between average values of the other VIs was relatively small with Hedge’s G values ranging from 0.019 () to 0.326 (). Thus, when the vegetation phenology was kept fixed in the analysis, solar illumination affected the EVI () but had little impact on the determination of GRND (), MPRI (), NDVI (), and REND ().
Figure 17. Decoupling the effects of solar illumination from those of vegetation phenology at the Biological Reserve of Trombetas River (BRTR). Vegetation indices were calculated over the same area using SuperDove data obtained in less than one hour apart on September 15, 2022. Results are shown for the (a) Enhanced Vegetation Index (EVI), (b) Green-Red Normalized Difference (GRND), (c) Modified Photochemical Reflectance Index (MPRI), (d) Normalized Difference Vegetation Index (NDVI), and (e) Red Edge Normalized Difference (REND).
4. Discussion
The current work has different contributions to studies of vegetation phenology in tropical forests of the Amazon using satellite data. As far as we know, this is the first investigation in this region using the third generation of the Planet’s satellite constellation (SuperDove) with eight bands. By comparing the seasonal response in 2022 of five VIs calculated from 3.7-m spatial resolution SuperDove data, we demonstrated the effects of shaded terrain and canopies on their determination. Solar illumination had strong effects on the EVI and little effects on the GRND, MPRI, NDVI, and REND. In contrast with the EVI, these four VIs operate with normalized reflectance differences between pairs of bands, which reduces the influence of sunlit and shaded canopies on their determination. The effects on the EVI were forest-type dependent and were stronger over dense ombrophilous forests than over less shaded open forests. From the beginning (June) to the end (September) of the dry season, the EVI tracked solar angles and shade fractions.
Our findings on the EVI sensitivity to illumination conditions were consistent to some extent with results from a recent study by Chen et al. (Citation2023) using NIRv. This VI was calculated from the Operational Land Imager (OLI)/Landsat-8 data over two sites from Europe. A common point between EVI and NIRv is their high dependence on the NIR reflectance response, as demonstrated in previous studies based on the EVI (Galvão et al. Citation2011; Samanta et al. Citation2012). According to Chen et al. (Citation2023), illumination effects must be corrected from NIRv for the accurate retrieval of phenological metrics, especially over mountainous areas. The illumination conditions affected differently the performance of NIRv to capture the seasonal variability of gross primary production (GPP) in spring and autumn. Our results were also consistent with previous studies using other sensors that have demonstrated the sensitivity of EVI to canopy shadows (Galvão et al. Citation2011; Moura et al. Citation2012, Citation2017; Petri et al. Citation2022) or terrain illumination effects (Matsushita et al. Citation2007; Oliveira, Galvão, and Ponzoni Citation2021). The sensitivity of some VIs to changes in illumination conditions was also observed in studies of satellite orbit drift. The changes in orbit caused modifications in the time of satellite overpass or SZA during imaging (Galvão, de Souza, and Breunig Citation2020; Zhang and Roy Citation2016).
As a novel contribution of the work, we showed for the first time the existence of coupled effects of solar illumination and vegetation phenology on the EVI determination. For each visible, red-edge, and NIR band of the SuperDove, the reflectance increased with the reduction of canopy and terrain shadows viewed by the CubeSats at decreasing SZA toward the end of the dry season. After the VI calculation over the studied sites, these coupled effects were strong on the EVI and were weak on the GRND, MPRI, NDVI, and REND. Some evidence of these effects included the strong correlations observed between the EVI, solar angles, and shade fractions. The evidence included also pseudo-greening events generated from SuperDove images obtained twice over the same site and day under a small SZA difference, thus when the vegetation phenology was kept fixed in the analysis. As a result of these coupled effects, the EVI presented a contrasting response at the end of the dry season when compared to the seasonal response of the GRND, MPRI, NDVI, and REND. These four VIs were correlated with each other in most sites under analysis.
Another important contribution of our work is related to the possible occurrence of large-scale greening and browning events in the Amazon at the end of the dry season (Huete et al. Citation2006) or associated with severe droughts (Atkinson, Dash, and Jeganathan Citation2011; Saleska et al. Citation2007; Xu et al. Citation2011). The dry-season period is marked by increasing water stress and high sunlight availability toward September (Moura et al. Citation2015). Severe droughts are generally followed by increasing events of fire and tree mortality (Aragão et al. Citation2007). It is true that the EVI pattern captured by MODIS during the dry season was consistent across other sensors (Gonçalves et al. Citation2023), as demonstrated here with the SuperDove data. However, in our study, greening and browning events were detected in data of other less influenced VIs by solar illumination (GRND, MPRI, NDVI, and REND) only over a few Amazonian sites, and in different periods of the dry season. For instance, greening events were detected by most SuperDove VIs at the middle and end of the dry season over the MIR and BRTR sites, respectively. On the other hand, browning events were captured by the SuperDove at the end of the dry season (high water stress) over the XIP site.
Our findings demonstrated the importance of using high spatial and temporal resolution data from satellite constellations to obtain phenological information that would be rarely retrieved from moderate-to-low spatial resolution observations. At this scale of imaging (3.7-m spatial resolution), the SuperDove instrument captured distinct canopy phenological events that were tracked over time using pixel reflectance spectra and color composites. The large VI variability observed in our seasonal reflectance profiles was consistent with tower-based observations in eastern Amazon using a hyperspectral camera (Moura et al. Citation2017). Using these observations, Moura et al. (Citation2017) showed occurrences of greening and browning events in different months of the dry season that were dependent on the vegetation species. At a site located in the central Amazon, Lopes et al. (Citation2016) observed leaf flushing events in images generated by a tower-based RGB camera that followed the local period of high insolation. Wu et al. (Citation2016) have associated greening events with changes in the abundance of mature leaves in the canopy detected by the satellite sensors.
Although out of the scope of the current investigation, an expected question from our findings is whether solar illumination effects are still significant during MODIS imagery over the Amazon at moderate spatial resolution (250 m). At this scale of observation, shadow effects tend to be aggregated toward the sensor. Our preliminary analysis indicates the possible existence of MODIS illumination effects over the studied sites regardless of their geographical location. For instance, in Figure S8 (Supplementary Material), we compared the seasonal changes in SZA during imaging acquisition in 2022 by both the SuperDove and MODIS/Terra. The data from the MOD13Q1 product (v.6.1) (MODIS/Terra Vegetation Indices 16-Day L3 Global 250 m SIN Grid) were obtained at the NFMI site (site 11 in ), located in the southwestern Amazon. The use of this 16-day composite product reduces, to some extent, uncertainties caused by the variable view angle, view direction, and atmospheric effects during the large field-of-view data acquisition by MODIS. The difference in SZA observed in Figure S8 between both sensors resulted from the earlier SuperDove overpass over this site when compared to MODIS. The relationships of SZA with average values of the EVI and NDVI, calculated from 5 × 5 pixels using only high-quality data (code zero in the pixel reliability metadata), confirmed the existence of a correlation between SZA and MODIS EVI (r = −0.73 in Figure S9a), which was not observed for the MODIS NDVI (r = +0.10 in Figure S9b).
Our work has also some limitations that should be considered in future studies. For instance, we did not evaluate the impact of illumination conditions on the retrieval of LSP metrics from the EVI or from the other less sensitive VIs to such effects. Considering the decrease in frequency of the SuperDove observations in the rainy season of the Amazon () and the low variability of phenological signal of the evergreen forests, the determination of metrics such as the start (SOS) and end (EOS) of season may be challenging over tropical forests compared to the savannas in Brazil. As another limitation of the work, we did not take into account in detail the influence of terrain illumination on adding signal to shade fractions or the effect of topographic correction on VI determination. Nevertheless, just a few studied sites have strong topographic effects or marked variations in elevation, slope, and aspect. This is the case of the NPSD site in . In the literature, different investigations have shown that the EVI was more sensitive than the NDVI to terrain illumination or topographic effects (Matsushita et al. Citation2007; Oliveira, Galvão, and Ponzoni Citation2021). In subtropical deciduous forests from south Brazil, slope and aspect were factors of spectral variability in the analysis of phenological metrics derived from the EVI (Galvão et al. Citation2016).
Finally, we recommend that future studies of vegetation phenology in the Amazon using high spatial resolution data from satellite constellations should consider the combined analysis of different VIs, especially those less sensitive to illumination conditions. At this spatial scale of satellite observations, solar and terrain illumination effects are sources of uncertainty for the accurate retrieval of phenological metrics over the Amazon, especially over sites having dense tropical forests or significant variations in topographic attributes (e.g. elevation, slope, or aspect). Correction for such effects on SuperDove data over these areas are therefore recommended when using anisotropic or sensitive VIs to illumination conditions such as the EVI and, probably, NIRv.
5. Conclusions
At the high spatial resolution of SuperDove observations over tropical forests of the Amazon, the most sensitive VI to changes in canopy and terrain illumination conditions was the EVI, which tracked solar angles and shade fractions toward the end of the dry season. The decrease in SZA produced increasing reflectance on each of the eight SuperDove bands, affecting also texture mean and variance. The illumination effects were reduced after the determination of GRND, MPRI, NDVI, and REND, which included normalized reflectance differences between pairs of bands in their formulations.
We concluded for the existence of coupled effects of solar illumination and vegetation phenology on the EVI determination regardless of the site location in the Amazon. These effects explained the antagonistic behavior of the EVI when compared to the overall agreement observed between the seasonal profiles of GRND, MPRI, NDVI, and REND. Moreover, our findings did not confirm patterns of large-scale greening at the end of the dry season under water stress and high insolation. Local changes in greening and browning were captured by the VIs over some sites but in different periods of the dry season between June and September.
Supplementary_Material_Galvao.docx
Download MS Word (3.1 MB)Acknowledgments
We thank ©2022 Planet Labs Inc. for providing the 432 images made available by the NICFI (Norway’s International Climate and Forest Initiative). L. S. Galvão has been supported by the Conselho Nacional de Desenvolvimento Científico e Tecnológico (CNPq) (grant number 307792/2021-8). Thanks are extended to three anonymous reviewers for the nice comments and suggestions.
Disclosure statement
No potential conflict of interest was reported by the author(s).
Data availability statement
The data that support the findings of this study are available from the corresponding author (L.S.G.) upon reasonable request.
Supplementary material
Supplemental data for this article can be accessed online at https://doi.org/10.1080/15481603.2023.2290354
Additional information
Funding
References
- Anderson, L. O., Y. Malhi, L. E. Aragão, R. Ladle, E. Arai, N. Barbier, and O. Phillips. 2010. “Remote Sensing Detection of Droughts in Amazonian Forest Canopies.” New Phytologist 187 (3): 733–24. https://doi.org/10.1111/j.1469-8137.2010.03355.x.
- Aragão, L. E. O., Y. Malhi, R. M. Roman‐Cuesta, S. Saatchi, L. O. Anderson, and Y. E. Shimabukuro. 2007. “Spatial patterns and fire response of recent Amazonian droughts.” Geophysical Research Letters 34 (7): L07701. https://doi.org/10.1029/2006GL028946.
- Atkinson, P. M., J. Dash, and C. Jeganathan. 2011. “Amazon Vegetation Greenness as Measured by Satellite Sensors Over the Last Decade.” Geophysical Research Letters 38 (19): L19105. https://doi.org/10.1029/2011GL049118.
- Brando, P. M., S. J. Goetz, A. Baccini, D. C. Nepstad, P. S. Beck, and M. C. Christman. 2010. “Seasonal and interannual variability of climate and vegetation indices across the Amazon.” Proceedings of the National Academy of Sciences 107 (33): 14685–14690. https://doi.org/10.1073/pnas.0908741107.
- Chen, R., G. Yin, G. Liu, Y. Yang, C. Wang, Q. Xie, W. Zhao, and A. Verger. 2023. “Correction of Illumination Effects on Seasonal Divergent NIRv Photosynthetic Phenology.” Agricultural and Forest Meteorology 339:109542. https://doi.org/10.1016/j.agrformet.2023.109542.
- Galvão, L. S., F. M. Breunig, T. S. Teles, W. Gaida, and R. Balbinot. 2016. “Investigation of Terrain Illumination Effects on Vegetation Indices and VI-Derived Phenological Metrics in Subtropical Deciduous Forests.” GIScience & Remote Sensing 53 (3): 360–381. https://doi.org/10.1080/15481603.2015.1134140.
- Galvão, L. S., A. A. de Souza, and F. M. Breunig. 2020. “A Hyperspectral Experiment Over Tropical Forests Based on the EO-1 Orbit Change and PROSAIL Simulation.” GIScience & Remote Sensing 57 (1): 74–90. https://doi.org/10.1080/15481603.2019.1668595.
- Galvão, L. S., J. R. dos Santos, D. A. Roberts, F. M. Breunig, M. Toomey, and Y. M. de Moura. 2011. “On Intra-Annual EVI Variability in the Dry Season of Tropical Forest: A Case Study with MODIS and Hyperspectral Data.” Remote Sensing of Environment 115 (9): 2350–2359. https://doi.org/10.1016/j.rse.2011.04.035.
- Gamon, J. A., L. Serrano, and J. S. Surfus. 1997. “The Photochemical Reflectance Index: An Optical Indicator of Photosynthetic Radiation-Use Efficiency Across Species, Functional Types, and Nutrient Levels.” Oecologia 112 (4): 492–501. https://doi.org/10.1007/s004420050337.
- Gatti, L. V., L. S. Basso, J. B. Miller, M. Gloor, L. Gatti Domingues, H. Cassol, G. Tejada, et al. 2021. “Amazonia as a Carbon Source Linked to Deforestation and Climate Change.” Nature 595 (7867): 388–393. https://doi.org/10.1038/s41586-021-03629-6.
- Gitelson, A., and M. N. Merzlyak. 1994. “Quantitative Estimation of Chlorophyll-A Using Reflectance Spectra: Experiments with Autumn Chestnut and Maple Leaves.” Journal of Photochemical and Photobiology B: Biology 22 (3): 247–252. https://doi.org/10.1016/1011-1344(93)06963-4.
- Gitelson, A. A., M. N. Merzlyak, and H. K. Lichtenthaler. 1996. “Detection of Red Edge Position and Chlorophyll.” Journal Plant of Physiology 148 (3–4): 501–508. https://doi.org/10.1016/S0176-1617(96)80285-9.
- Gonçalves, N. B., R. Dalagnol, J. Wu, A. Pontes-Lopes, S. C. Stark, and B. W. Nelson. 2023. “Amazon Forest Spectral Seasonality is Consistent Across Sensor Resolutions and Driven by Leaf Demography.” ISPRS Journal of Photogrammetry and Remote Sensing 196:93–104. https://doi.org/10.1016/j.isprsjprs.2022.12.001.
- Gruninger, J. H., A. J. Ratkowski, and M. L. Hoke. 2004. “The sequential maximum angle convex cone (SMACC) endmember model.” Proceedings of the Society of Photo-Optical Instrumentation Engineers (SPIE) 5425:1–14. https://doi.org/10.1117/12.543794.
- Haddad, I., L. S. Galvão, F. M. Breunig, R. Dalagnol, V. Bourscheidt, and A. D. Jacon. 2022. “On the Combined Use of Phenological Metrics Derived from Different PlanetScope Vegetation Indices for Classifying Savannas in Brazil.” Remote Sensing Applications: Society & Environment 26:100764. https://doi.org/10.1016/j.rsase.2022.100764.
- Haralick, R. M., K. Shanmugam, and I. Dinstein. 1973. “Textural Features for Image Classification.” IEEE Transactions on Systems, Man, and Cybernetics 3 (6): 610–621. https://doi.org/10.1109/TSMC.1973.4309314.
- Huete, A. R., K. Didan, T. Miura, E. P. Rodriguez, X. Gao, and L. G. Ferreira. 2002. “Overview of the Radiometric and Biophysical Performance of the MODIS Vegetation Indices.” Remote Sensing of Environment 83 (1–2): 195–213. https://doi.org/10.1016/S0034-4257(02)00096-2.
- Huete, A. R., K. Didan, Y. E. Shimabukuro, P. Ratana, S. R. Saleska, L. R. Hutyra, and R. Myneni. 2006. “Amazon Rainforests Green‐Up with Sunlight in Dry Season.” Geophysical Research Letters 33 (6): L06405. https://doi.org/10.1029/2005GL025583.
- Lakens, D. 2013. “Calculating and Reporting Effect Sizes to Facilitate Cumulative Science: A Practical Primer for T-Tests and ANOVAs.” Frontiers in Psychology 4:article 863. https://doi.org/10.3389/fpsyg.2013.00863.
- Lopes, A. P., B. W. Nelson, J. Wu, P. M. L. A. Graça, J. V. Tavares, N. Prohaska, G. A. Martins, and S. R. Saleska. 2016. “Leaf Flush Drives Dry Season Green-Up of the Central Amazon.” Remote Sensing of Environment 182:78–90. https://doi.org/10.1016/j.rse.2016.05.009.
- Malhi, Y., J. T. Roberts, R. A. Betts, T. J. Killeen, W. Li, and C. A. Nobre. 2008. “Climate Change, Deforestation, and the Fate of the Amazon.” Science 319 (5860): 169–172. https://doi.org/10.1126/science.1146961.
- Matsushita, B., W. Yang, J. Chen, Y. Onda, and G. Qiu. 2007. “Sensitivity of the Enhanced Vegetation Index (EVI) and Normalized Difference Vegetation Index (NDVI) to Topographic Effects: A Case Study in High-Density Cypress Forest.” Sensors 7 (11): 2636–2651. https://doi.org/10.3390/s7112636.
- Morton, D. C., J. Nagol, C. C. Carabajal, J. Rosette, M. Palace, B. D. Cook, and P. R. North. 2014. “Amazon Forests Maintain Consistent Canopy Structure and Greenness During the Dry Season.” Nature 506 (7487): 221–224. https://doi.org/10.1038/nature13006.
- Moura, Y. M., L. S. Galvão, J. R. dos Santos, D. A. Roberts, and F. M. Breunig. 2012. “Use of MISR/Terra Data to Study Intra-And Inter-Annual EVI Variations in the Dry Season of Tropical Forest.” Remote Sensing of Environment 127:260–270. https://doi.org/10.1016/j.rse.2012.09.013.
- Moura, Y. M., L. S. Galvão, T. Hilker, J. Wu, S. Saleska, C. H. Do Amaral, and L. E. Aragão. 2017. “Spectral Analysis of Amazon Canopy Phenology During the Dry Season Using a Tower Hyperspectral Camera and Modis Observations.” ISPRS Journal of Photogrammetry and Remote Sensing 131:52–64. https://doi.org/10.1016/j.isprsjprs.2017.07.006.
- Moura, Y. M., T. Hilker, A. I. Lyapustin, L. S. Galvão, J. R. Santos, L. O. Anderson, C. H. R. Sousa, and E. Arai. 2015. “Seasonality and Drought Effects of Amazonian Forests Observed from Multi-Angle Satellite Data.” Remote Sensing of Environment 171:278–290. https://doi.org/10.1016/j.rse.2015.10.015.
- Oliveira, L. M., L. S. Galvão, and F. J. Ponzoni. 2021. “Topographic Effects on the Determination of Hyperspectral Vegetation Indices: A Case Study in Southeastern Brazil.” Geocarto International 36 (19): 2186–2203. https://doi.org/10.1080/10106049.2019.1690055.
- Petri, C. A., and L. S. Galvão. 2019. “Sensitivity of Seven MODIS Vegetation Indices to BRDF Effects During the Amazonian Dry Season.” Remote Sensing 11 (14): 1650. https://doi.org/10.3390/rs11141650.
- Petri, C. A., L. S. Galvão, L. E. O. C. Aragão, R. Dalagnol, C. T. Almeida, A. H. M. Oliveira, and I. M. Felix. 2022. “Solar Illumination Effects on the Dry-Season Variability of Spectral and Spatial Attributes Calculated from PlanetScope Data Over Tropical Forests of the Amazon.” International Journal of Remote Sensing 43 (11): 4087–4116. https://doi.org/10.1080/01431161.2022.2106801.
- Petri, C. A., L. S. Galvão, and A. I. Lyapustin. 2019. “MODIS BRDF Effects Over Brazilian Tropical Forests and Savannahs: A Comparative Analysis.” Remote Sensing Letters 10 (2): 95–102. https://doi.org/10.1080/2150704X.2018.1526425.
- Rouse, J. W., R. H. Haas, J. A. Schell, and D. W. Deering 1973. “Monitoring Vegetation Systems in the Great Plains with ERTS.” Paper presented at the Third ERTS-1 Symposium, Washington, DC, December 10–14 ( NASA SP-351, vol. 1, pp. 309–317).
- Saleska, S. R., K. Didan, A. R. Huete, and H. R. Da Rocha. 2007. “Amazon forests green-up during 2005 drought.” Science 318 (5850): 612–612. https://doi.org/10.1126/science.1146663.
- Samanta, A., S. Ganguly, H. Hashimoto, S. Devadiga, E. Vermote, Y. Knyazikhin, and R. B. Myneni. 2010. “Amazon Forests Did Not Green‐Up During the 2005 Drought.” Geophysical Research Letters 37 (5): L05401. https://doi.org/10.1029/2009GL042154.
- Samanta, A., Y. Knyazikhin, L. Xu, R. E. Dickinson, R. Fu, M. H. Costa, S. S. Saatchi, R. R. Nemani, and R. B. Myneni. 2012. “Seasonal Changes in Leaf Area of Amazon Forests from Leaf Flushing and Abscission.” Journal of Geophysical Research 117:G01015. https://doi.org/10.1029/2011JG001818.
- Saunier, S., and P. Cocevar 2022. “Technical Note on Quality Assessment for SuperDove. EarthNet Data Assessment Pilot (EDAP).” Technical Report 41: Issue 1.
- Silva Junior, C. H. L., W. A. Campanharo, L. O. Anderson, and L. E. O. C. Aragão. 2021. “Global CHIRPS MCWD (Maximum Cumulative Water Deficit) Dataset.” Zenodo. https://doi.org/10.5281/zenodo.4903340.
- Silveira, M. V., C. A. Petri, I. S. Broggio, G. O. Chagas, M. S. Macul, C. C. Leite, and L. E. Aragão. 2020. “Drivers of Fire Anomalies in the Brazilian Amazon: Lessons Learned from the 2019 Fire Crisis.” Land 9 (12): 516. https://doi.org/10.3390/land9120516.
- Tu, Y., K. Johansen, B. Aragon, M. M. El Hajj, and M. F. McCabe. 2022. “The Radiometric Accuracy of the 8-Band Multi-Spectral Surface Reflectance from the Planet SuperDove Constellation.” International Journal of Applied Earth Observation and Geoinformation 114:103035. https://doi.org/10.1016/j.jag.2022.103035.
- Wang, J., D. Yang, M. Detto, B. W. Nelson, M. Chen, K. Guan, and J. Wu. 2020. “Multi-Scale Integration of Satellite Remote Sensing Improves Characterization of Dry-Season Green-Up in an Amazon Tropical Evergreen Forest.” Remote Sensing of Environment 246:111865. https://doi.org/10.1016/j.rse.2020.111865.
- Wood, E. M., A. M. Pidgeon, V. C. Radeloff, and N. S. Keuler. 2012. “Image Texture as a Remotely Sensed Measure of Vegetation Structure.” Remote Sensing of Environment 12:516–526. https://doi.org/10.1016/j.rse.2012.01.003.
- Wu, J., L. P. Albert, A. P. Lopes, N. Restrepo-Coupe, M. Hayek, K. T. Wiedemann, and S. R. Saleska. 2016. “Leaf Development and Demography Explain Photosynthetic Seasonality in Amazon Evergreen Forests.” Science 351 (6276): 972–976. https://doi.org/10.1126/science.aad5068.
- Xu, L., A. Samanta, M. H. Costa, S. Ganguly, R. R. Nemani, and R. B. Myneni. 2011. “Widespread decline in greenness of Amazonian vegetation due to the 2010 drought.” Geophysical Research Letters 38 (7): L07402. https://doi.org/10.1029/2011GL046824.
- Zhang, H. K., and D. P. Roy. 2016. “Landsat 5 Thematic Mapper Reflectance and NDVI 27-Year Time Series Inconsistencies Due to Satellite Orbit Change.” Remote Sensing of Environment 186:217–233. https://doi.org/10.1016/j.rse.2016.08.022.
- Zhou, J., R. Yan Guo, M. Sun, T. T. Di, S. Wang, J. Zhai, and Z. Zhao. 2017. “The Effects of GLCM Parameters on LAI Estimation Using Texture Values from Quickbird Satellite Imagery.” Scientific Reports 7 (1): 1–12. https://doi.org/10.1038/s41598-017-07951-w.