
 ?Mathematical formulae have been encoded as MathML and are displayed in this HTML version using MathJax in order to improve their display. Uncheck the box to turn MathJax off. This feature requires Javascript. Click on a formula to zoom.
ABSTRACT
The South-to-North Water Diversion Project Middle Route (SNWD-MR) annually diverts hundreds of millions of cubic meters of water from the Danjiangkou Reservoir to Beijing, significantly impacting the regional groundwater cycle. To conserve water resources, the government has implemented ecological water replenishment (EWR) in some water systems. This study aimed to study the coupled process of groundwater dynamics and land subsidence (LS) in Yongding River (YDR) basin (Beijing section) following the implementation of the SNWD-MR and EWR. First, an Interferometric Synthetic Aperture Radar (InSAR) time series technique was used to detect spatial and temporal distributions of surface displacement between 2015 and 2020 based on satellite images from Sentinel-1A/B. The results indicated a predominant LS deceleration trend during the InSAR observation period. The area with subsidence velocity below 20 mm/yr decreased significantly by 18.6% after SNWD-MR and EWR (from 2016 to 2020). Then, groundwater level fluctuations during the InSAR observation period were analyzed using groundwater measurement well data. Over 60% of these wells showed a rebound in groundwater levels after the implementation of SNWD-MR and EWR. The polynomial distribution lag model (PDL) revealed the association between LS and groundwater level changes, depicting both short- and long-term lag effect. The results showed significant spatial and temporal heterogeneity on the short- and long-term response between groundwater level change and regional subsidence. In addition, we calculated the differential subsidence slope based on the InSAR-derived LS and analyzed its impact on the river slope after SNWD-MR and EWR. The results show that two sections with significant severe differential subsidence slope occur between 0 and 14,000 m and between 54,000 and 78,000 m along the YDR. The slope change caused by LS may reduce the conveyance capacity of surface canals, and more attention should be paid in those two sections. These findings have an important scientific significance for management strategy for LS control against the background of SNWD-MR and EWR.
1. Introduction
As a crucial resource for current and future generations, groundwater plays an important role in human health, economic development, and environmental ecosystems (Gleeson et al. Citation2016, Citation2020; Mukherjee et al. Citation2021). In recent decades, with the rapidly growing population, fast-expanding economic activities, and increased groundwater consumption, many parts of the world have been experiencing extensive groundwater depletion (Frappart and Ramillien Citation2018; Huang et al. Citation2015; Rodell, Velicogna, and Famiglietti Citation2009; Scanlon, Longuevergne, and Long Citation2012). This overexploitation results in dropping groundwater levels and a reduction in aquifer system’s permeability and porosity, ultimately triggering environmental issues such as land subsidence (LS), salt water intrusion, groundwater quality deterioration, ecosystem degradation, and even a threat to global water security (Frappart and Ramillien Citation2018; Wu Citation2003; Zhao et al. Citation2019).
According to the literature, LS was identified at 200 locations in 34 countries worldwide because of groundwater resource overexploitation (Herrera-García et al. Citation2021). During groundwater extraction, pore fluid pressure reduction correlates with effective stress (portion of the total stress that is borne by the solid grains in the skeleton of the rock matrix) increase, causing aquifer system consolidation and thus LS occurrence (Chaussard et al. Citation2014; D. L. Galloway et al. Citation1998; Hoffmann et al. Citation2001). LS displays distinct deformation features under different conditions: (1) seasonal, reversible deformation occurs when the effective stress is below preconsolidation stress (the maximum level of past stress of a skeletal element); (2) conversely, LS exhibits irreversible inelastic deformation (Chaussard et al. Citation2013; D. Galloway, Jones, and Ingebritsen Citation1999). The major consequences of subsidence include a threat to geological stability and urban infrastructure safety, an increase in flood susceptibility and ground fissure risk, and a reduction in the aquifer-system storage capacity, all endangering human lives and regional sustainable development (Chaussard et al. Citation2014; Herrera-García et al. Citation2021; Horst et al. Citation2018; Lyu et al. Citation2020; Ma et al. Citation2019; Miller and Shirzaei Citation2019; Perissin et al. Citation2012). Two main methods have been used to mitigate subsidence due to groundwater withdrawal: reducing groundwater withdrawal and artificial groundwater recharge (an engineered process where excess water is used to replenish aquifers) (Galloway et al. Citation2011).
Significant LS due to groundwater depletion has been observed in various locations globally, including Jakarta/Indonesia, Tokyo/Japan, California’s Central Valley, Iran, Netherlands, etc. Beijing, China, as one of the world’s megacities has also experienced severe water shortages. In 2019, Beijing had per-capita water resources of 114.0 m3 with over 21.5 million residents (Bian Citation2020), which is far below the internationally recognized absolute scarcity level of 500 m3. Groundwater is the primary source of water supply in Beijing and excessive groundwater extraction has led to a significant drop in groundwater levels. Over the past few decades, the Beijing Plain has experienced significant LS because of the aquifer system compaction. It has been determined that for every 1 m drop in water level, the corresponding LS amount is 10.12 mm (Liu et al. Citation2016). The South-to-North Water Diversion Project (SNWD) aims to control water resource in northern China. Since the SNWD Middle Route (SNWD-MR) began operation at the end of 2014, over 6.459 × 10⁹ m3 of water has been transported to Beijing by May 2021. The government has limited the use of groundwater and increased the surface water supply from the SNWD-MR. The transfer of water from the SNWD-MR has effectively reduced groundwater extraction, stabilized the groundwater level, and promoted groundwater table recovery in Beijing (Long et al. Citation2020; Sun et al. Citation2022; Yang et al. Citation2022; Zhang et al. Citation2022). In particular, Long et al. pointed out that water diverted from the SNWD-MR to Beijing reduced the cumulative groundwater depletion, accounting for 40% of the total groundwater storage recovery (Long et al. Citation2020).
The development of LS in Beijing following diminished groundwater extraction after SNWD-MR has drawn lots of attention (). Previous research mainly utilized Interferometric Synthetic Aperture Radar (InSAR) technique to evaluate the change of LS in the Beijing Plain before and after SNWD-MR. Results indicated the LS in the Beijing Plain has been partially alleviated after SNWD-MR. Zhu et al. (Citation2020) identified the confined aquifer groundwater level raised by 3–4 m was due to the SNWD-MR water partially reducing the groundwater pumping rates, while the decrease in the pumping rates has significantly reduced the subsidence velocity in that portion of the Beijing Plain. In this context, Yang et al. (Citation2021) pointed out that the main contribution layer of LS shifted to strata at a depth of 100 m. Although most of the Beijing Plain experienced decelerating or steady LS after SNWD-MR, the localized unevenness of accumulative subsidence has amplified (Lyu et al. Citation2019), potentially posing significant threats to urban infrastructure safety. To conserve and protect groundwater resources, Beijing’s municipal water system has implemented ecological water replenishment (EWR), such as the Yongding River (YDR), which further affects groundwater recharge (Bian Citation2020; Hu et al. Citation2020; Li et al. Citation2021; Yang et al. Citation2019). Li et al. found that the area of rising quaternary groundwater levels exceeded 450 km2 only during replenishment in 2020, with the maximum increase exceeding 5 m in the YDR basin (Li et al. Citation2021). This also indirectly influences the evolution of LS. However, there are few comprehensive reports on the groundwater variations and land subsidence in Beijing after the SNWD-MR and EWR. Further investigation is needed into the variations of groundwater levels under the combined effect of SNWD-MR and EWR and its correlation to the new evolution of LS, especially the surface displacement pattern driven by the recovery of groundwater. Previous studies focused on the relationship between groundwater level change and LS, indicating LS time series lagged several months behind the groundwater level changes (Chen et al. Citation2019, Miller and Shirzaei Citation2015; Gao et al. Citation2018), while the lag effect of LS under the groundwater level rise remained unclear.
Table 1. Summary of relevant studies on the effects of the SNWD on land subsidence in Beijing.
In this study, the Yongding River Basin (Beijing section) was chosen as the study area to investigate the influence of water diversion from the SNWD-MR and EWR on the evolution of LS patterns. The objectives of this study are, firstly, to analyze the evolution of LS after SNWD-MR and EWR using Sentinel-1 (S1) images. Secondly, to examine the characteristics of groundwater level changes using observation wells dataset. Thirdly, to reveal the lag effect between the change of groundwater level and the evolution of LS using the polynomial distribution lag model (PDL). The outcome of the study will provide scientific significance for management strategies to control land subsidence.
2. Study area description
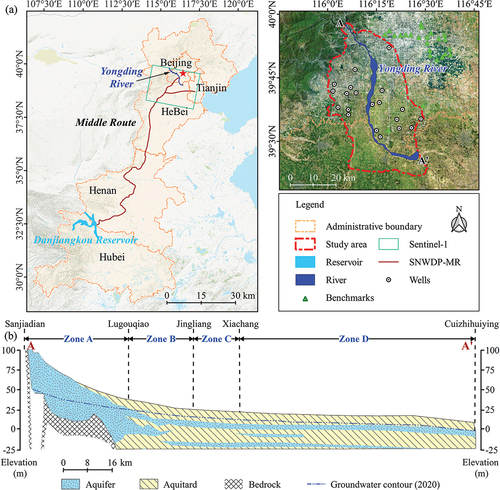
Beijing (39°28′-41°05′N, 115°25′-117°30′E), the capital of China, is located in the northwestern part of the North China Plain, covering an area about 16,807 km2 while the plain area accounts for 6390 km2. As the main river in Beijing, the YDR plays a crucial role in urban development, water resource management, and ecological protection. The Beijing section of the YDR stretches over 187 km in total length. According to the different characteristics, the river can be classified into the mountain zone section, the northern plain section and the southern plain section. The groundwater in the YDR basin is primarily found in Quaternary aquifers. From north to south, the aquifer system gradually transforms from a single, coarse-grained sandy gravel aquifer to multiple, silty fine sand layers ().
Figure 1. Description of the study area. (a) The coverage of the synthetic aperture radar (SAR) datasets and the position of the south-to-north water diversion project middle route (SNWD-MR) are displayed in the upper left panel. The positions of the monitoring wells and levelling benchmarks are displayed in the upper right panel. (b) Lithological distribution along the Beijing section of the Yongding River (YDR) (revised after (Cao et al. Citation2022)). The aquifer system can be divided into zone a (single layer of sand and gravel), zone B (multiple layers of sand and gravel and a few sand layers), zone C (multiple layers of sand and a few gravel layers), and zone D (multiple layers of sand).
The SNWD has played a role in groundwater storage recovery and partial alleviation of the LS problem in the Beijing Plain. EWR has also impacted the groundwater level change in local areas, which has indirectly impacted LS development. In this paper, we selected the YDR basin (Beijing section) as the study area, along with the InSAR technique and multiple datasets, to evaluate the combined impact of the SNWD and EWR on LS.
3. Materials and methods
3.1. SAR datasets
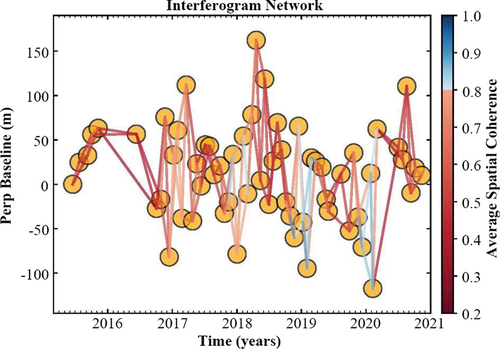
In this study, the single-look complex (data) acquired by Sentinel-1 (S1) satellite was used to obtain surface deformation information. The SAR datasets can be found at the Alaska Satellite Facility (https://search.asf.alaska.edu). S1 (operating at the C-band 5.6-cm wavelength) consists of two polar-orbiting satellites, Sentinel-1A (S1A) launched by the European Space Agency (ESA) on 3 April 2014 and Sentinel-1B (S1B) launched on 25 April 2016. Each S1 satellite has a 12-day repeat cycle at the equator. In this study, S1A and S1B consist of a stack of 60 interferometric wide-swath (IW) single-look complex images captured between June 2015 and November 2020. Detailed information about the SAR data can be found in .
Table 2. Characteristics of the SAR images used in this study.
3.2. MT-InSAR processing
To measure time-series surface deformation across the study area, we utilized small baseline subset (SBAS) technique on S1A images. The main processing steps are presented in . We firstly used ISCE software (Roseu et al. Citation2012) to produce stacks of interferograms. To maintain the phase quality of the interferograms, in the small baseline approach, only interferometric pairs with short temporal and spatial baselines are used (Haghshenas and Motagh Citation2019). displays the SBAS network of interferograms for the S1 datasets. For all interferograms, the flat earth effect and topographic contributions were eliminated using precise orbit data from the S1 satellite and the ~30 m 1-arcsecond Advanced Spaceborne Thermal Emission and Reflection Radiometer Global Digital Elevation Model (ASTER GDEM) V2, respectively. Then, phase unwrapping was performed using the statistical-cost network-flow algorithm (SNAPHU) in MintPy (https://github.com/insarlab/MintPy). The bridging and phase closure methods were used to correct unwrapping errors, which addressed the limitations of the phase-unwrapping error on the accuracy and precision of the derived surface deformation. Time-series analysis through MintPy (Zhang et al. Citation2019) was performed to track ground deformation between the first and last SAR data. Additionally, to overcome the limitations associated with the atmospheric delay, the ERA5 dataset from the European Centre for Medium-Range Weather Forecasts (ECMWF) was used to correct the tropospheric delay and eliminate linear ramps to minimize the ionospheric delay and residual tropospheric delay.
Figure 2. The framework of the SBAS technique.
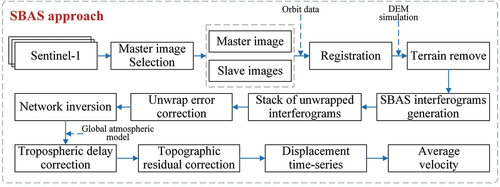
Figure 3. The SBAS network of interferograms for SAR datasets.
The products of MintPy MT-InSAR processing include the mean line-of-sight (LOS) velocity and the time series of surface deformation, after which the spatiotemporal evolution of LS can be analyzed. To ensure the accuracy of the InSAR measurement results, the vertical displacement rates derived from the InSAR data are validated using leveling measurements. In this study, the LOS measurements () were directly converted into the vertical direction (
) relying on the incidence angle (
) of the SAR satellite (
), assuming that the detected movements mostly occur along the vertical direction during the SAR image acquisition period. This assumption has been confirmed in previous studies (Guo et al. Citation2003; Xie et al. Citation2002), which found that this area experiences low relative horizontal motion (1.57–1.93 mm/yr) based on GPS and leveling observations. Subsequently, the vertical displacements were validated against leveling data.
4. Results
4.1. InSAR results
To investigate the evolution pattern of surface deformation in the YDR basin, we applied the SBAS technique to 60 S1A/B images spanning from June 2015 to November 2020. The incidence angle of the SAR datasets used in this study area ranges from 34.5° to 37.1°. After vertical projection, a mean velocity map of the study area was obtained. indicates that the overall displacement velocity varied from −62.3 (where negative values denote subsidence) to 22.4 mm/yr (with positive values indicating uplift), with a standard deviation of 8.91 mm/yr over the observation period. A total of 681,762 slowly decorrelating filtered phase (SDFP) pixels with high coherence (>0.85) were identified in the study area. The results reveal regions of significant LS mainly in the YDR downstream area, with the centers of subsidence funnels located in the southern part of Daxing, northeast of Zhuozhou, and at the junction of Guan and Daxing.
Figure 4. (a) The vertical displacement velocity map along the YDR derived from the S1A/B datasets is computed using the small baseline subset (SBAS) technique, where negative values indicate subsidence and positive values indicate uplift., (b) the histogram of the mean displacement rate., and (c) the statistics of various subsidence velocities at slowly decorrelating filtered phase (SDFP) points are presented.
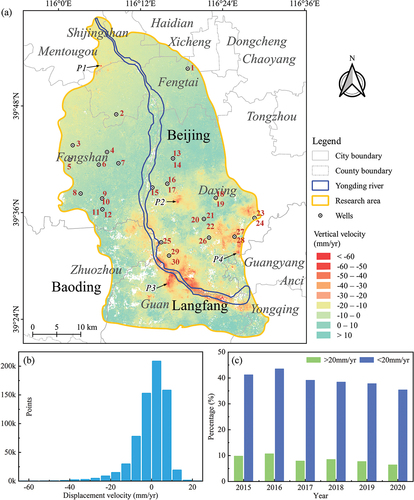
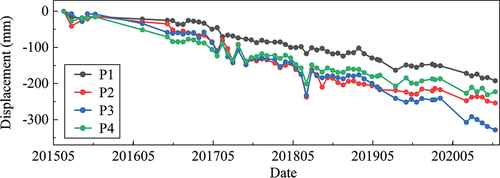
The mean displacement velocity distribution during the InSAR observation period reveals that the subsidence velocity was mostly less than 20 mm/yr . The SDFP points with subsidence velocity lower than 20 mm/yr account for about 42.1% of the total points in the study area, while the SDFP points with subsidence velocity greater than 20 mm/yr accout for only 4.0%. Calculation of the number of SDFP points by subsidence level indicated a mild increasing trend in points exceeding 20 mm/yr from 2015 to 2016 and 2017 to 2018, yet a declining trend in percentage from 8.5% to 6.4% from 2018 to 2020 . The number of points with rates below 29 mm/yr rose initially and then declined, reducing by 18.6% from 2016 to 2020. illustrates the accumulative time-series displacement at specific points. For example, the accumulative subsidence at P4 exceeded 30 cm in nearly 6 years. The time series displacements at four points showed a persistent decreasing trend with only minor nonlinear fluctuations. The time series displacements at four points showed seasonal variations: from November to March of the following year, subsidence disappeared or even increased, after which LS continued.
Figure 5. Accumulative time-series deformation revealed by the InSAR technique, which highlights selected points in , is shown.
4.2. Validation with leveling measurements
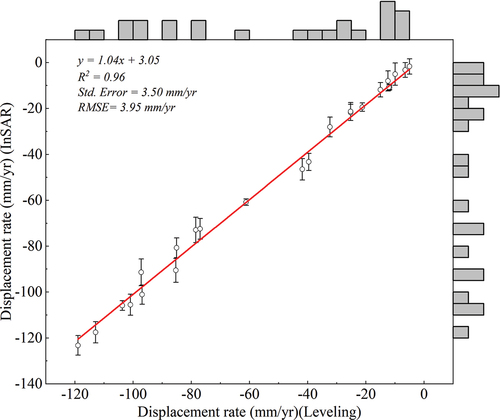
This study assessed the precision of InSAR-derived observations by comparing them with ground-leveling measurements. In this study, 24 leveling benchmarks were acquired annually from 2017 to 2018 (represented in as green triangles). The average values of the measurements from pixels within a certain radius (100 m in our case) centered on each benchmark were calculated as the corresponding InSAR measurements by assuming that the ground did not significantly change within this distance. A cross-comparison between the leveling and InSAR measurements was performed using a linear analysis, as shown in . The correlation coefficient was 0.96, and the standard deviation was 3.50 mm/yr. To compare the two measurements, the root-mean-square error (RMSE) and maximum and minimum errors were calculated for each leveling benchmark. The maximum and minimum values of the RMSE between the InSAR and leveling measurements were 4.12 mm/yr and 0.29 mm/yr, respectively. The average RMSE reached 3.95 mm/yr. The maximum and minimum errors between the two measurements were 5.83 mm/yr and 0.96 mm/yr, respectively, with a mean difference of 3.74 mm/yr. The favorable agreement between the two measurements suggests the reliability of the InSAR-derived displacement velocity values for further analysis.
Figure 6. Cross-comparison between interferometric synthetic aperture radar (InSAR) measurements and levelling data.
4.3. Groundwater level changes
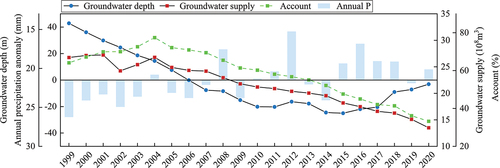
illustrates the mean groundwater depth from 1999 to 2020 in the Beijing Plain (marked by a solid black line with blue points). The groundwater level continuously decreased from 1999 to 2011, recovering slightly from 2011 to 2012 (+2.7%). The groundwater depth records showed a significant recovery between 2015 and 2020 (+14.4%) compared to the start of SNWD-MR operation. The mean groundwater depth overall rose by more than 3.6 m within 6 years, from 25.66 m in 2014 to 22.03 m in 2020.
Figure 7. Annual precipitation anomalies and water resource information for the Beijing plain from 1999 to 2020.
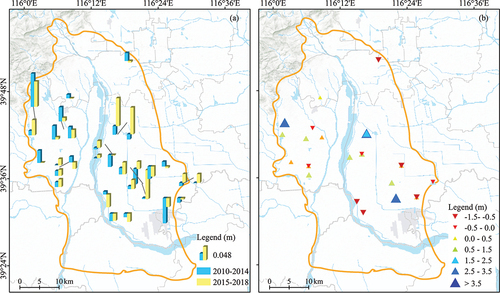
Then, 30 groundwater monitoring wells were used to investigate the groundwater level changes along the YDR basin. The locations of the observation wells are marked by the black circles in (detailed data in Table S1). The variations in groundwater levels before and after SNWD-MR operation are depicted in . From 2010 to 2014, approximately 45% of the wells showed a downward trend in groundwater levels, while the groundwater levels at other well locations showed an upward trend. From 2015 to 2018, only 38% of the wells showed a downward trend in groundwater levels. During the 2010–2014 period, groundwater levels (2015–2018) showed relative rising trends at 61% of all well sites. The change in the annual groundwater level in 2018 compared to 2014 is depicted in . In comparison, the groundwater level showed increasing trends in over 60% of the wells in 2014, with a maximum increase of nearly 4 m.
Figure 8. (a) Distribution of monthly groundwater level changes in 31 wells from 2010 to 2014 and from 2015 to 2018. (b) The change in groundwater levels in 2018 compared to 2014.
5. Discussion
5.1. The impact of the SNWD and EWR on groundwater levels
5.1.1. Regional changes
The SNWD-MR diverts water from the Danjiangkou Reservoir to Beijing to alleviate severe water shortages since late 2014. Specifically, Beijing follows the priority order of drinking, storing, and replenishing water resources obtained from the SNWD-MR (Du et al. Citation2021). As shown in , the proportion of groundwater in the total water supply (green line) has decreased since 2004. Despite a groundwater reduction of more than 25% from 2004 to 2014 before the SNWD-MR (from 77.45% in 2004 to 52.17% in 2014), it remained Beijing’s main water source. However, since SNWD-MR initiation, the groundwater contribution has significantly decreased, dropping nearly 19% from 2014 to 2020.
The mean groundwater depth records () show recovery between 2011 and 2012 before the SNWD-MR operation and between 2015 and 2020 since the start of the SNWD-MR operation. A study by Long et al. showed that the water diverted from the SNWD-MR to Beijing reduced water depletion in the region by 40% from 2006 to 2018 (Long et al. Citation2020). Significantly, the early recovery of groundwater depth was accompanied by an increase in precipitation (2011 to 2012), while the groundwater depth rose with a concurrent decrease in precipitation since 2015. The change in groundwater depth indicated the impact of the SNWD on groundwater storage recovery. Zhang et al. showed that the SNWD has a greater effect than climatic factors (Zhang et al. Citation2022).
5.1.2. Local changes
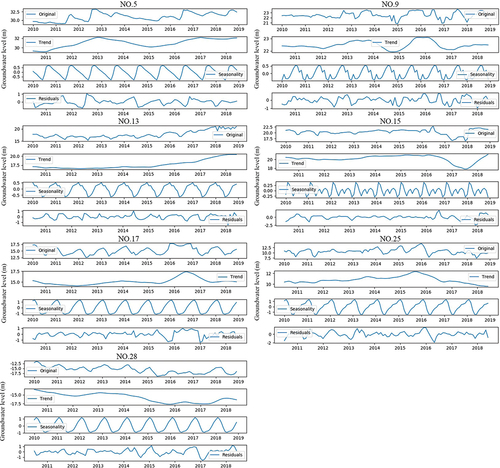
Groundwater storage has indicated a clear increasing tendency in Beijing since the start of SNWD-MR operation (Zhang et al. Citation2022), with the groundwater level around the EWR area rebounding more significantly (Du et al. Citation2021). The EWR of the YDR has been a crucial project, with the cumulative discharge of the Guanting Reservoir reaching 2.23 × 10⁸ m3 in 2016. In 2019, Beijing implemented the largest-scale EWR effort. As reported by the Haihe River Water Conservancy Commission, the cumulative EWR of the YDR exceeded 6 × 10⁸ m3 in 2019 and 2020. After water is recharged into the river, a portion of it infiltrates through the riverbed to recharge the underlying groundwater. Groundwater level variation before and after the SNWD is depicted in . To further examine groundwater level changes under the combined effects of the SNDW and EWR, seasonal-trend decomposition based on loess (STL) (Apaydin et al. Citation2021; Cleveland et al. Citation1990; He et al. Citation2021) was used. The nonlinear trend in the time-series groundwater level exhibited significant variations at different locations. For instance, the trend in groundwater change exhibited a fluctuating pattern in wells 1, 4, 5, and 7 to 11 (Figure S1 in the Supplementary Material). We observed a clear upward trend in groundwater levels at some well locations.
For instance, monitoring well No. 5 showed an increase in groundwater levels from 2015 to 2017, followed by a relatively stable trend (). The location of monitoring well No. 9 exhibited groundwater recovery after the SNWD, but groundwater level decreased noticeably from 2016 to 2017 and then slightly ascended afterward. At other well locations, such as well No. 13, the groundwater level has increased since 2015 (with an increase exceeding 3 m), which indicates groundwater recovery due to the combined effect of the SNDW and EWR. On the other hand, the groundwater level in well No. 29 showed a decreasing trend (nearly 7 m) from 2010 to 2016. After EWR, the change in groundwater level showed a slight recovery between 2016 and 2017 and a relatively significant recovery after May 2017. The groundwater level remained relatively stable at some well locations before and after the SNDW, such as well No. 15, until a significant decline occurred between 2016 and June 2017. Additionally, wells No. 17 and 25 had peaks in groundwater levels after SNWD and EWR, but both trended downward subsequently. Groundwater level variations could be influenced by numerous factors, including water recharge duration and scale, hydrogeological conditions, precipitation, and human activities (Cao et al. Citation2022; Hu et al. Citation2020; Li et al. Citation2021; Sun et al. Citation2021; Wang et al. Citation2021).
Figure 9. The nonlinear trend of time series groundwater level marked by black circles in .
5.2. The potential risk caused by the LS phenomenon
LS can cause changes in the river gradient, which can reduce the conveyance capacity of surface canals and increase the risk of riverine flooding (Bagher-Gabkosh et al. Citation2021). With the use of the InSAR technique, continuous LS information along the YDR can be captured. The stability of the YDR’s surface environment against the background of the SNWD and EWR was evaluated, which could provide technical support for river ecological health assessment programs. Prior studies indicated that SNWD-induced groundwater fluctuations mitigated LS in the Beijing Plain. This study presents statistical subsidence velocity results , demonstrating a declining trend for subsidence velocities over/less than 20 mm/yr (34.7% decrease in 2015, and 14.1% decrease 2020).
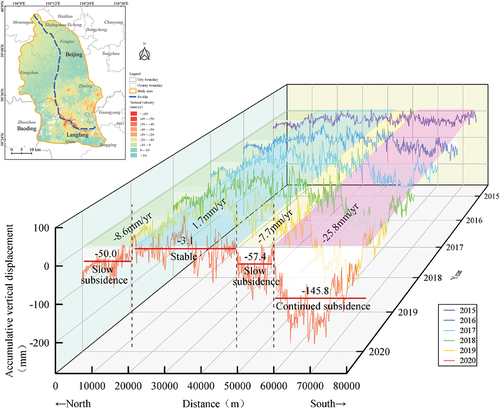
To investigate the vertical subsidence pattern along the YDR, we obtained subsidence profiles from north to south along the river’s centerline. The blue dashed line delineates the profile location (upper left in ). Two slow subsidence areas and a continued subsidence zone were detected during the InSAR observation period, corresponding to the time-series characteristics of the subsidence. Those two slow subsidence areas are located at distances ranging from 0 to 13,000 m and 43,000 to 54,000 m, respectively, with subsidence rates of 8.6 and 7.7 mm/yr, respectively. At distances between 54,000 and 78,000 m along the profile, LS demonstrated a constant pattern, identified as the continuous subsidence section. The average cumulative subsidence and subsidence rate in this section reached 145.8 mm and 25.8 mm/yr, respectively, with a maximum accumulation of nearly 260.0 mm.
Figure 10. Profiles of the InSAR vertical subsidence time series (June 2015 to November 2020) marked by a blue dashed line in the upper left corner.
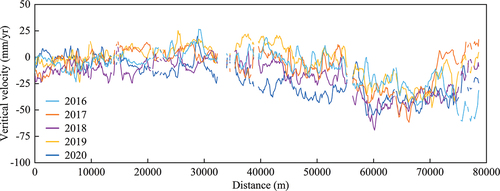
indicates a significant subsidence at distances between 55,000 and 72,000 m along the YDR’s centerline. The aquifer system gradually transitions from a single aquifer to multiple aquifers from north to south along the YDR, with water abundance and permeability gradually decreasing. Due to hydrogeological conditions, the groundwater recharge in the YDR changes from a satisfactory level to a medium level (from north to south) (Cao et al. Citation2022). With the enhanced EWR of the YDR in 2019 and 2020, the displacement velocity at distances between 0 and 15,000 m showed an upward trend during this period.
Figure 11. Annual subsidence rate along the YDR (2016–2020).
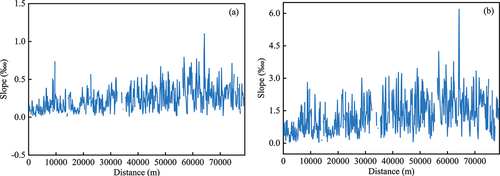
The main impact of the regional LS phenomenon on the YDR is a change in the line’s slope. To evaluate the surface stability along the YDR after the SNWD and EWR, we calculated the differential subsidence slope along the river. As shown in , the area where the slope variation was greater than 0.6‰ was mainly located from 55,000 to 74,000 m, with the maximum value reaching 1.1‰. We also observed a sharp increase in the subsidence slope at distances between 0 and 14,000 m. The areas with a cumulative subsidence slope greater than 3‰ mostly occurred at distances between 55,000 and 74,000 m, with the maximum value exceeding 6.0‰ . With the change in the cumulative subsidence slope, a sharp gradient can be identified from 0 to 14,000 m along the river. The results showed that there are two sections with a relatively high subsidence slope value along the river. Based on previous data, the LS monitoring at distances from 0–14,000 m and 54,000–78,000 m along the YDR should be strengthened to ensure the ecological health of the river.
Figure 12. (a) Annual subsidence slope and (b) accumulative subsidence slope along YDR obtained from InSAR measurements (2015–2020).
5.3. Linking groundwater level and LS
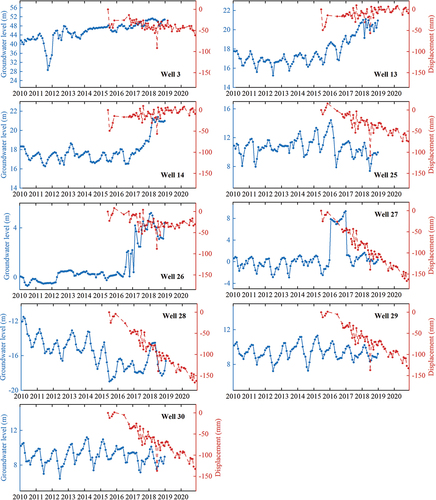
presents the change in groundwater levels after SNWD-MR and EWR. The confined groundwater levels in wells No. 3, 13, 14, and 26 have risen by more than 3.5 m since December 2014. During the InSAR observation period, the accumulative LS at wells No. 3, 13/14, and 26 reached −61, −9, and −30 mm, respectively. LS was more serious in the southern part of the study area. The accumulative LS at wells No. 25, 27/28, and 29/30 was −75, −162, and −132 mm, respectively, from June 2015 to November 2020. Nine typical wells were chosen for a correlation analysis between confined groundwater level changes and LS evolution. The comparison results showed several discrepancies in the relationship between groundwater level change and surface displacement (). At certain locations, land displacement coincided with an increase in groundwater levels (e.g. wells 13, 14). In well No. 25, there was a decrease in groundwater levels at the same time as LS. While at others, the trend of land subsidence did not match the groundwater variation.
Figure 13. The groundwater level changes, and ground displacement retrieved from the InSAR technique at the monitoring wells (the locations are shown in ).
Previous studies in Beijing indicate that the LS phenomenon lags behind groundwater level change (Chen et al. Citation2019; Gao et al. Citation2018; Lyu et al. Citation2020). This research further examines the lag effect utilizing a polynomial distribution lag (PDL) model. The results are summarized in , where is the displacement in month
, representing the response variable, and the time-series groundwater level (
,
, … ,
) is the predictor variable. The response of land displacement to groundwater level changes exhibited variability. For example, at wells No. 13, 14, 27, and 29, there was no noticeable lag between the change in groundwater level and displacement of land (Table S2). In contrast, certain wells demonstrated a considerable lag, with surface displacement trailing groundwater level changes by several months.
Table 3. The lag period (month) of the LS response to changes in groundwater levels in the groundwater observation wells (part).
At well No. 26, the groundwater level increased by 4.4 m (2015–2018). The PDL method revealed that the land displacement lagged 4 months behind the groundwater level change, with R2 of 0.70. At this site, for every 1 m rise in the groundwater level, land displacement increased by 0.48 mm in the current month and 0.17 mm in the next month. As a result, the ability of the water level to drive surface uplift weakened, and negative effects started to emerge from the third month on. The lag effect exhibited the opposite features in well No. 3. Land displacement lagged 6 months behind groundwater level change, and there was a negative effect between groundwater level rise and land displacement. At well No. 25, the LS lagged the groundwater level decline by 6 months, with a 1 m groundwater level decrease, accompanied by a short-term decrease of nearly 5 mm (short-term effect), and a long-term effect that resulted in a subsidence of approximately 16 mm.
Wells No. 29 and 30 are situated at single site, recording an accumulative LS greater than 130 mm during the InSAR observation period. Groundwater levels in the overlapping InSAR and groundwater measurements period showed a decreasing tendency. The lag between the measured groundwater level change and the LS varied. For well No .30, the ground subsidence 5 months behind the groundwater level change, where the long-term impact of every 1 m of groundwater decline on land displacement resulted in subsidence of approximately 43 mm. In other significant subsidence areas, for instance, at well No. 28, despite significant LS occurring at these sites, the groundwater level increased by 2.4 m. Table S2 illustrates a relatively long-term lag negative effect between displacement and groundwater level rise at well No. 28. The results indicated that even if the water level rises, LS will continue. This trend was mainly driven by the long-term decline in groundwater levels in recent decades.
6. Conclusion
This paper focused on the impacts of SNWD-MR and EWR on groundwater level and LS. In this study, we studied LS in the YDR basin (Beijing section) with SBAS technology using 60 S1 images from 2015 to 2020. The results indicated a declining trend in the subsidence velocity and spatial distribution from 2018 to 2020, indicating effective water resource management in reducing LS. The results of InSAR were coupled to calculate the differential subsidence slope along YDR to comprehend the effect of regional subsidence on river slope after SNWD-MR and EWR. Two sections exhibited notable severe differential subsidence slope at 0–14000 m and 54,000–78000 m along the YDR, demanding extra attention. The analysis of groundwater levels showed the impact of the SNWD on groundwater storage recovery in the Beijing Plain. In 2018, groundwater level rose significantly in over 60% wells along the YDR, with a maximum increase of nearly 4 m. Groundwater level change before and after SNWD-MR revealed the proactivity of human intervention policy in conserving and restoring groundwater resources along YDR. Unfortunately, the long-term impact of EWR on groundwater resources remains uncertain due to the limited groundwater monitoring well period.
Then, a comparison of the LS phenomenon and changes in groundwater levels helped explain how changes in groundwater levels could affect land displacement patterns in the context of SNWD and EWR. Utilizing the PDL technique, we detected both short- and long-term lag effects between groundwater level change and LS time series at monitoring well locations. Particularly, well No. 26 showcased a land rebound followed by a groundwater level rise. At other sites, the lag effect indicated a negative response between the LS phenomenon and changes in groundwater levels.
The outcome of this study has improved our understanding of subsidence mechanisms against the background of SNWD-MR and EWR. They are valuable in supporting strategic decisions about water resource and LS management. Limited by the collected datasets, we only analyzed the response between LS and groundwater level change between 2015 and 2018. Meanwhile, the long-term correlation between groundwater level recovery and LS response needs to be further explored under the background of SNWD-MR and EWR. Moreover, the evolution characteristics of LS unevenness and its harm need to be further discussed.
Supplement materials.docx
Download MS Word (4.1 MB)Acknowledgments
We thank the European Space Agency for their great efforts in developing and distributing remotely sensed SAR data and for their generosity in making Sentinel-1 available at no cost.
Disclosure statement
The authors declare that they have no known competing financial interests or personal relationships that could have appeared to influence the work reported in this paper.
Data availability statement
Upon reasonable request, the corresponding author can provide the data that support the study’s conclusions.
Supplementary material
Supplemental data for this article can be accessed online at https://doi.org/10.1080/15481603.2024.2315708
Additional information
Funding
References
- Apaydin, H., M.T. Sattari, K. Falsafian, and R. Prasad. 2021. “Artificial Intelligence Modelling Integrated with Singular Spectral Analysis and Seasonal-Trend Decomposition Using Loess Approaches for Streamflow Predictions.” Journal of Hydrology 600: 126506. https://doi.org/10.1016/j.jhydrol.2021.126506.
- Bagher-Gabkosh, M., S. Hosseini, B. Ataie-Ashtiani, Y. Sohani, H. Ebrahimian, F. Morovat, and S. Ashrafi. 2021. “Land Subsidence: A Global Challenge.” Science of the Total Environment 778:Article 146193. https://doi.org/10.1016/j.scitotenv.2021.146193.
- Bian, Y. 2020. “Study on the Influence of Ecological Water Supplement of Yongding River on Groundwater Dynamics in Beijing.” Master’s thesis, China University of Geosciences (Beijing). https://doi.org/10.27493/d.cnki.gzdzy.2020.001781.
- Cao, X., Y. Zhai, M. Li, C. Pan, F. Zheng, H. Lu, X. Xia, Y. Teng, and J. Wang. 2022. “The Suitability Assessment of Groundwater Recharge by Leakage of the Yongding River.” Hydrogeology and Engineering Geology 49(01): 20–17. https://doi.org/10.16030/j.cnki.issn.1000-3665.202107069.
- Chaussard, E., F. Amelung, H. Abidin, and S. H. Hong. 2013. “Sinking Cities in Indonesia: ALOS PALSAR Detects Rapid Subsidence Due to Groundwater and Gas Extraction.” Remote Sensing of Environment 128:150–161. https://doi.org/10.1016/j.rse.2012.10.015.
- Chaussard, E., S. Wdowinski, E. Cabral-Cano, and F. Amelung. 2014. “Land Subsidence in Central Mexico Detected by ALOS InSAR Time-Series.” Remote Sensing of Environment 140:94–106. https://doi.org/10.1016/j.rse.2013.08.038.
- Chen, B., H. Gong, K. Lei, J. Li, C. Zhou, M. Gao, H. Guan, and W. Lv. 2019. “Geoinformation Land Subsidence Lagging Quantification in the Main Exploration Aquifer Layers in Beijing Plain, China.” International Journal of Applied Earth Observation and Geoinformation 75(August 2018):54–67. Elsevier https://doi.org/10.1016/j.jag.2018.09.003.
- Cleveland, R. B. W.S. Cleveland, J.E. McRae, and I. Terpenning. 1990. “STL: A Seasonal-Trend Decomposition Procedure Based on Loess.” Journal of Official Statistics 6: 3–73.
- Du, Z., L. Ge, A. H.-M. Ng, X. Lian, Q. Zhu, F. G. Horgan, and Q. Zhang. 2021. “Analysis of the Impact of the South-To-North Water Diversion Project on Water Balance and Land Subsidence in Beijing, China Between 2007 and 2020.” Journal of Hydrology 603 (PB): 126990. Elsevier B.V https://doi.org/10.1016/j.jhydrol.2021.126990.
- Du, Z., L. Ge, A. H. M. Ng, X. Li, L. Li, and J. Sequeira. 2017. “Mapping Land Subsidence Over the Eastern Beijing City Using Satellite Radar Interferometry*.” International Journal of Digital Earth 11 (1): 1–26. Taylor & Francis https://doi.org/10.1080/17538947.2017.1336651.
- Frappart, F., and G. Ramillien. 2018. “Monitoring Groundwater Storage Changes Using the Gravity Recovery and Climate Experiment (GRACE) Satellite Mission: A Review.” Remote Sensing 10 (6): 829. https://doi.org/10.3390/rs10060829.
- Galloway, D. L., and T. J. Burbey. 2011. “Review: Regional Land Subsidence Accompanying Groundwater Extraction.” Hydrogeology Journal 19 (8): 1459–1486. https://doi.org/10.1007/s10040-011-0775-5.
- Galloway, D. L., K. W. Hudnut, S. E. Ingebritsen, S. P. Phillips, G. Peltzer, F. Rogez, and P. A. Rosen. 1998. “Detection of Aquifer System Compaction and Land Subsidence Using Interferometric Synthetic Aperture Radar, Antelope Valley, Mojave Desert, California.” Water Resources Research 34 (10): 2573–2585. https://doi.org/10.1029/98WR01285.
- Galloway, D., D. R. Jones, and S. E. Ingebritsen. 1999. Land Subsidence in the United States. Washington, DC: U.S. Geological Survey, U.S. Department of the Interior. http://pubsdata.usgs.gov/pubs/circ/circ1182/.
- Gao, M., H. Gong, B. Chen, X. Li, C. Zhou, M. Shi, Y. Si, Z. Chen, and G. Duan. 2018. “Regional Land Subsidence Analysis in Eastern Beijing Plain by InSar Time Series and Wavelet Transforms.” Remote Sensing 10 (3): 1–17. https://doi.org/10.3390/rs10030365.
- Gleeson, T., K. M. Befus, S. Jasechko, E. Luijendijk, and M. B. Cardenas. 2016. “The Global Volume and Distribution of Modern Groundwater.” Nature Geoscience 9 (2): 161–167. https://doi.org/10.1038/ngeo2590.
- Gleeson, T., M. Cuthbert, G. Ferguson, and D. Perrone. 2020. “Global Groundwater Sustainability, Resources, and Systems in the Anthropocene.” Annual Review of Earth and Planetary Sciences 48 (1): 431–463. https://doi.org/10.1146/annurev-earth-071719-055251.
- Guo, L., W. Bo, and G. Yang. 2003. “Characteristics of Current Deformation of Fault Belts in North China.” Geodesy and Geodynamics 23 (2): 29–36.
- Haghshenas, M., and M. Motagh. 2019. “Ground Surface Response to Continuous Compaction of Aquifer System in Tehran, Iran: Results from a Long-Term Multi-Sensor InSAR Analysis.” Remote Sensing of Environment 221:534–550. Elsevier. https://doi.org/10.1016/j.rse.2018.11.003.
- He, H., S. Gao, T. Jin, S. Sato, and X. Zhang. 2021. “A Seasonal-Trend Decomposition-Based Dendritic Neuron Model for Financial Time Series Prediction.” Applied Soft Computing 108:107488. https://doi.org/10.1016/j.asoc.2021.107488.
- Herrera-García, G., P. Ezquerro, R. Tomas, M. Béjar-Pizarro, J. López-Vinielles, M. Rossi, Mateos, et al. 2021. “Mapping the Global Threat of Land Subsidence.” Science 371 (6524): 34–36. https://doi.org/10.1126/science.abb8549.
- Hoffmann, J., H. A. Zebker, D. L. Galloway, and F. Amelung. 2001. “Seasonal Subsidence and Rebound in Las Vegas Valley, Nevada, Observed by Synthetic Aperture Radar Interferometry.” Water Resources Research 37 (6): 1551–1566. https://doi.org/10.1029/2000WR900404.
- Horst, T., M. M. Rutten, N. C. van de Giesen, and R. F. Hanssen. 2018. “Monitoring Land Subsidence in Yangon, Myanmar Using Sentinel-1 Persistent Scatterer Interferometry and Assessment of Driving Mechanisms.” Remote Sensing of Environment. https://doi.org/10.1016/j.rse.2018.08.004.
- Huang, Z., Y. Pan, H. Gong, P. J. F. Yeh, X. Li, D. Zhou, and W. Zhao. 2015. “Subregional-Scale Groundwater Depletion Detected by GRACE for Both Shallow and Deep Aquifers in North China Plain.” Geophysical Research Letters 42 (6): 1791–1799. https://doi.org/10.1002/2014GL062498.
- Hu, L., J. Guo, S. Zhang, K. Sun, and Z. Yang. 2020. “Response of Groundwater Regime to Ecological Water Replenishment of the Yongding River.” Hydrogeology and Engineering Geology 47 (5): 5–11.
- Li, H., Y. Cui, Y. Ren, Y. Jiang, Y. Cui, R. Wu, and S. Wang. 2021. “Analysis on the Effect of Ecological Water Replenishment of Yongding River in Spring 2020 on Groundwater Conservation in Beijing.” Urban Geology 16 (2): 133–138. https://doi.org/10.3969/j.issn.1007-1903.2021.02.002.
- Liu, H., W. Cui, Y. Luo, K. Lei, Y. Yang, F. Tian, and M. Tian. 2022. “Study on the Variation Law of Land Subsidence, Groundwater Level and Pore Water Pressure in Tianzhu, Beijing Based on Stratified Monitoring.” Geological Bulletin of China 41 (04): 692–701. https://doi.org/10.12097/j.issn.1671-2552.2022.04.013.
- Liu, M., W. Kou, Y. Luo, R. Wang, F. Tian, C. Zhao, and K. Liu. 2016. “Analysis of the Relationship Between Groundwater Exploitation and Land Subsidence in Beijing.” Urban Geology 11 (1): 21–25. https://doi.org/10.3969/j.issn.1007-1903.2016.01.005.
- Long, D., W. Yang, B. R. Scanlon, J. Zhao, D. Liu, P. Burek, Y. Pan, L. You, and Y. Wada. 2020. “South-To-North Water Diversion Stabilizing Beijing’s Groundwater Levels.” Nature Communications 11:3665. https://doi.org/10.1038/s41467-020-17428-6.
- Lyu, M., Y. Ke, L. Guo, X. Li, L. Zhu, H. Gong, and C. Constantinos. 2019. “Change in Regional Land Subsidence in Beijing After South-To-North Water Diversion Project Observed Using Satellite Radar Interferometry.” GIScience & Remote Sensing (1): 140–156. Taylor & Francis https://doi.org/10.1080/15481603.2019.1676973.
- Lyu, M., Y. Ke, X. Li, L. Zhu, L. Guo, and H. Gong. 2020. “Detection of Seasonal Deformation of Highway Overpasses Using the Ps-InSar Technique: A Case Study in Beijing Urban Area.” Remote Sensing 12 (18): 3071. https://doi.org/10.3390/RS12183071.
- Ma, P., W. Wang, B. Zhang, J. Wang, G. Shi, G. Huang, F. Chen, L. Jiang, and H. Lin. 2019. “Remotely Sensing Large- and Small-Scale Ground Subsidence: A Case Study of the Guangdong–Hong Kong–Macao Greater Bay Area of China.” Remote Sensing of Environment 232:111282. https://doi.org/10.1016/j.rse.2019.111282.
- Miller, M. M., and M. Shirzaei. 2015. “Spatiotemporal Characterization of Land Subsidence and Uplift in Phoenix Using InSAR Time Series and Wavelet Trans- Forms.” Journal of Geophysical Research: Solid Earth 120: 5822–5842. https://doi.org/10.1002/2015JB012017.
- Miller, M. M., and M. Shirzaei. 2019. “Land Subsidence in Houston Correlated with Flooding from Hurricane Harvey.” Remote Sensing of Environment 225:308–378. https://doi.org/10.1016/j.rse.2019.03.022.
- Mukherjee, A., B. R. Scanlon, A. Aureli, S. Langan, H. Guo, and A. McKenzie. 2021. “Global Groundwater: From Scarcity to Security Through Sustainability and Solutions.” Global Groundwater. https://doi.org/10.1016/b978-0-12-818172-0.00001-3.
- Perissin, D., Z. Wang, and H. Lin. 2012. “Shanghai Subway Tunnels and Highways Monitoring Through Cosmo-SkyMed Persistent Scatterers.” ISPRS Journal of Photogrammetry and Remote Sensing 73:58–67. https://doi.org/10.1016/j.isprsjprs.2012.07.002.
- Rodell, M., I. Velicogna, and J. S. Famiglietti. 2009. “Satellite-Based Estimates of Groundwater Depletion in India.” Nature 460 (7258): 999–1002. https://doi.org/10.1038/nature08238.
- Roseu, P. A., E. Gurrola, G. F. Sacco, and H. Zebker. 2012. “The InSAR Scientific Computing Environment.” In 9th Proceedings of the European Conference on Synthetic Aperture Radar, EUSAR, Nuremberg, Germany. https://ieeexplore.ieee.org/document/6217174/citations?tabFilter=papers#citations.
- Scanlon, B. R., L. Longuevergne, and D. Long. 2012. “Ground Referencing GRACE Satellite Estimates of Groundwater Storage Changes in the California Central Valley, USA.” Water Resources Research 48 (4). https://doi.org/10.1029/2011WR011312.
- Sun, K., L. Hu, J. Guo, Z. Yang, Y. Zhai, and S. Zhang. 2021. “Enhancing the Understanding of Hydrological Responses Induced by Ecological Water Replenishment Using Improved Machine Learning Models: A Case Study in Yongding River.” Science of the Total Environment 768:145489. Elsevier B.V. https://doi.org/10.1016/j.scitotenv.2021.145489.
- Sun, J., L. Hu, D. Li, K. Sun, and Z. Yang. 2022. “Data-Driven Models for Accurate Groundwater Level Prediction and Their Practical Significance in Groundwater Management.” Journal of Hydrology 608:127630. Elsevier B.V. https://doi.org/10.1016/j.jhydrol.2022.127630.
- Wang, B., X. Yao, H. Wei, Q. Wang, and H. Sun. 2021. “Influence of Ecological Water Supplement on Groundwater Level in the South Section of Yongding River Plain.” Beijing Water (03): 14–17. https://doi.org/10.19671/j.1673-4637.2021.03.004.
- Wu, Y. 2003. “Mechanism Analysis of Hazards Caused by the Interaction Between Groundwater and Geo-Environment.” Environmental Geology 44:811–819. https://doi.org/10.1007/s00254-003-0819-9.
- Xie, J., G. Yang, and W. Bo. 2002. “Study on the Regional Deformation Field and Strong Earthquake Risk of Beijing Area in the Near Future.” North China Earthquake Science 20 (1): 1–9.
- Yang, Y., J. Gu, and Y. Li. 2019. “Analysis on Infiltration Capacity and Influence Range of Yongding River Under the Condition of Long-Time Discharge.” Geotechnical Investigation & Surveying 47 (6): 29–35.
- Yang, Y., H. Liu, Y. Luo, K. Lei, and X. Wang. 2021. “Development Characteristics of Land Subsidence in Eastern Beijing.” Shanghai Land & Resources 42 (1): 7–12+18. https://doi.org/10.3969/j.issn.2095-1329.2021.01.002.
- Yang, W., D. Long, B. R. Scanlon, P. Burek, C. Zhang, Z. Han, J. J. Butler, Y. Pan, X. Lei, and Y. Wada. 2022. “Human Intervention Will Stabilize Groundwater Storage Across the North China Plain.” Water Resources Research 58 (2): 1–21. https://doi.org/10.1029/2021wr030884.
- Zhang, Y., F. Heresh, and A. Falk. 2019. “Small Baseline InSAR Time Series Analysis: Unwrapping Error Correction and Noise Reduction.” Computers and Geosciences. https://doi.org/10.1016/j.cageo.2019.104331.
- Zhang, X., X. Wu, R. Zhao, W. Mu, and C. Wu. 2022. “Identifying the Facts and Driving Factors of Deceleration of Groundwater Table Decline in Beijing During 1999–2018.” Journal of Hydrology 607 (September 2021): 127475. https://doi.org/10.1016/j.jhydrol.2022.127475. Elsevier B.V.
- Zhao, Q., B. Zhang, Y. Yao, W. Wu, G. Meng, and Q. Chen. 2019. “Geodetic and Hydrological Measurements Reveal the Recent Acceleration of Groundwater Depletion in North China Plain.” Journal of Hydrology 575:1065–1072. https://doi.org/10.1016/j.jhydrol.2019.06.016.
- Zhu, L., H. Gong, Y. Chen, S. Wang, Y. Ke, G. Guo, X. Li, B. Chen, H. Wang, and P. Teatini. 2020. “Effects of Water Diversion Project on Groundwater System and Land Subsidence in Beijing, China.” Engineering Geology 276:Article 105763. https://doi.org/10.1016/j.enggeo.2020.105763.