
 ?Mathematical formulae have been encoded as MathML and are displayed in this HTML version using MathJax in order to improve their display. Uncheck the box to turn MathJax off. This feature requires Javascript. Click on a formula to zoom.
ABSTRACT
Vegetation, as a crucial carbon sink, is facing extensive degradation under the mounting pressures of urbanization and excessive resource exploitation, exacerbating the imbalance between carbon sources and sinks. In response, the ecological spatial network has emerged as a comprehensive conservation strategy to establish and maintain connectivity and interactions among diverse ecosystems, ensuring the continuous provision of ecological services and preservation of biodiversity. A pivotal indicator in this context is vegetation carbon use efficiency (CUE), which elucidates the relationship between CO2 assimilation through photosynthesis and biomass growth. In this study, utilizing remote sensing data, the Yellow River Basin (YRB) was selected as a case study to analyze vegetation CUE through the Carnegie Ames Stanford Approach (CASA) and Light Use Efficiency-Normalized Difference Water Index (LUE-NDWI) models. Furthermore, the Morphological Spatial Pattern Analysis (MSPA) method and Integrated Valuation of Ecosystem Services and Tradeoffs (InVEST) model were employed to delineate ecological sources for woodlands, shrublands, and grasslands, while the Minimum Cumulative Resistance (MCR) model was used to identify ecological corridors, forming an ecological spatial network within the YRB. Subsequently, the interrelationship between topological metrics and vegetation CUE was analyzed, and optimization strategies were proposed based on the significance of the structure and function. The findings revealed that: (1) Vegetation CUE exhibited a spatially decreasing trend from the western to eastern regions, with spatial patterns correlated with vegetation types, temperature, and precipitation distribution; (2) The ecological spatial network demonstrated a denser configuration in the upper and middle reaches and a sparser and shorter pattern in the lower reaches, with seamless connectivity among all regions; (3) Significant correlations were observed between topological metrics and vegetation CUE, prompting the adoption of ecological construction and protection measures when functional importance is deficient, and enhancing the connectivity of ecological sources through the augmentation of ecological corridors when structural importance is lacking. The implementation of these strategies is expected to bolster the ecological functions of the network, facilitate carbon cycling, and exert a positive and far-reaching impact on the sustainable development of the ecological environment in the YRB.
1. Introduction
Vegetation CUE pertains to the ratio of net primary productivity (NPP) or net ecosystem productivity to gross primary productivity (GPP) (Chen, Yu, and Wang Citation2019). It serves as a key functional parameter within the carbon cycle, elucidating the efficacy with which vegetation ecosystems convert atmospheric carbon dioxide into biomass and sequester carbon (Murshed et al. Citation2022). Precisely characterizing and quantifying the spatiotemporal variations of vegetation CUE assumes utmost significance for the assessment and projection of carbon budgets, while also providing a theoretical foundation for the management of vegetation carbon sinks under the backdrop of climate change (Z. Yang et al. Citation2023). Up to the present, the predominant methodology for quantitatively analyzing vegetation CUE involves computing Vegetation NPP and GPP. Approaches such as the utilization of vegetation index models, niche models, ecosystem models, and climate-driven models have garnered widespread acceptance (Cao et al. Citation2023; Kafy et al. Citation2023). Ecosystem models, despite their inherent complexity, distinguish themselves by their capacity to simulate the carbon dynamics of ecosystems and furnish prolonged prognostications contingent upon climatic variations and anthropogenic influences (Xu, Zhang, et al. Citation2023). Notably, upon meticulous examination of copious literature and linear regression against established datasets, the CASA model demonstrates pronounced proficiency in NPP computation, whereas the LUE-NDWI model excels in GPP computation (Hou et al. Citation2023; Srinet et al. Citation2022). Nevertheless, these models are not without limitations. Perturbations induced by cloud cover, atmospheric conditions, and land surface features may introduce errors, particularly in estimating vegetation CUE within specific geographical locales and intricate habitats (Z. Wang et al. Citation2021). However, through judicious data curation and error rectification, these limitations can be effectively mitigated, if not entirely rectified (Y. Zhang et al. Citation2019).
Despite numerous studies exploring the relationships among vegetation structure, environmental factors, landscape patterns, and vegetation CUE, there is a relative dearth of research on the directional associations between vegetation patches and CUE (Mathias and Trugman Citation2022). Traditional landscape pattern analysis methods fail to assess whether interactions among patches can affect vegetation CUE. However, the application of complex network theory offers a fresh perspective for identifying key areas of vegetation CUE (H. Guo et al. Citation2021). Complex networks provide an abstraction of complex systems, treating system components as nodes and representing their interactions through interconnected edges while disregarding their specific properties (J. Yang, Zeng, and Cheng Citation2020). Complex networks serve to describe the structural connectivity and evolutionary patterns of diverse networks, including those in social, medical, and biological contexts (F. Wang et al. Citation2023). Consequently, the integration of complex network theory into the domain of ecology has engendered the formulation of ecological spatial networks. This adaptation permits a more nuanced and quantitative scrutiny of fundamental ecological system attributes, including stability, vulnerability, and resilience (Xu, Yu, et al. Citation2023). Such an approach proves instrumental in the identification of pivotal nodes within the network and the precise quantification of the repercussions of environmental perturbations on the entirety of the system. Ecological spatial networks consist of ecological sources and ecological corridors (Qiu et al. Citation2023). Ecological sources refer to areas that provide a variety of ecosystem services and make substantial contributions to ecosystem development, whereas ecological corridors represent linkages between sources, facilitating functions such as information transfer, material cycling, and energy flow (Fan et al. Citation2023). In contrast to landscape pattern indices that characterize overall regional attributes, ecological spatial networks concentrate on the topological features of a region. These topological characteristics have been verified to influence ecosystem services and have been optimized in conjunction with ecosystem services (Qiu et al. Citation2022). Thus far, optimization of ecological spatial networks has predominantly focused on urban or national scales and employed process-based models for evaluating ecosystem services (Huang, Wang, and Chen Citation2022). To enhance the functionality and benefits of ecological spatial networks, it is imperative to consider the influence of different ecological processes (such as species migration, community dynamics) on ecosystem services (such as water source protection, climate regulation) and undertake comprehensive assessments thereof (Fortin, Dale, and Brimacombe Citation2021). By delving into a comprehensive examination of ecosystem services, species diversity, and the evolutionary dynamics of ecosystems, ecological spatial networks will be highlighted.
The YRB boasts an extensive geographical expanse with diverse vegetation types, including woodlands, grasslands, and croplands, representing various habitats. However, the ecological environment in this region is relatively fragile, facing challenges such as water scarcity, land degradation, and ecosystem deterioration (Zhou et al. Citation2022). As a crucial ecological barrier and an economically significant development area in China, it is imperative to urgently elucidate the vegetation CUE and unveil the response capacity of vegetation ecosystems to environmental changes (Jiang et al. Citation2020). At a large regional scale, investigating vegetation CUE entails exploring the complex interaction networks among plant types, wherein the interaction intensities may not exhibit pronounced differentiation (A. Wang et al. Citation2022). Therefore, this study aimed to employ land cover data to identify ecological sources, while utilizing Digital Elevation Model (DEM), slope, Normalized Difference Vegetation Index (NDVI), NDWI, nighttime light, and road density data to construct an ecological resistance surface. By employing the MCR model, ecological corridors were simulated, leading to the establishment of a woodland-shrubland-grassland ecological spatial network in the YRB. Additionally, vegetation CUE of the YRB was computed using the CASA model and the LUE-NDWI model. Correlations between CUE and topology metrics were explored, and optimization strategies were proposed based on the significance of structure-function relationships. These strategies aimed to facilitate more efficient circulation of elements and functions within the ecological spatial network. The research sought to enhance understanding of the carbon cycling processes in vegetation ecosystems within the region, providing scientific support for global climate change mitigation efforts and ecological conservation endeavors.
2. Materials and methods
2.1. Study area
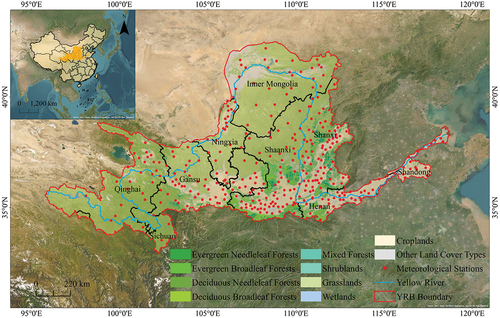
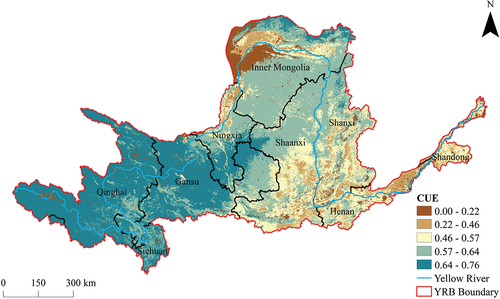
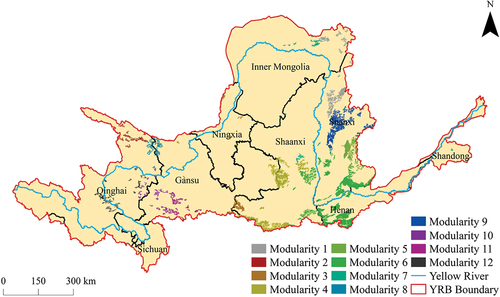
The YRB encompasses a vast geographical expanse, traversing three major topographical steps and four significant geomorphological units, namely the Qinghai-Tibet Plateau, the Inner Mongolian Plateau, the Loess Plateau, and the Huang-Huai-Hai Plain. Positioned within the arid and semi-arid regions of China, the basin exhibits pronounced variations in climate (Jian, Zhang, and Wang Citation2022). The southeastern sector falls within a semi-humid climatic zone, characterized by comparatively abundant annual precipitation and a plentiful water resource base. In contrast, the central region lies within a semi-arid climatic zone, experiencing infrequent annual precipitation and elevated evapotranspiration rates, resulting in limited water resources. The northwestern reaches belong to an arid climatic zone, with meager precipitation and severely constrained surface water resources. Vegetation distribution within the basin is influenced by geographic location and monsoonal dynamics, spanning four distinct vegetation zones from east to west: the deciduous broadleaf forest zone, the grassland zone, the desert zone, and the Qinghai-Tibet Plateau vegetation zone (Fang et al. Citation2021). The eastern deciduous broadleaf forest zone exhibits a humid climate and thriving vegetation, providing invaluable habitats for diverse biological communities. The central grassland zone is characterized by aridity, featuring expansive grassland landscapes that serve as crucial ecological transition areas. In the western desert zone, arid conditions prevail, with vegetation being scarce. The vegetation zone in the Qinghai-Tibet Plateau is located in the elevated regions of the western basin, functioning as a pivotal water conservation area and harboring biodiversity hotspots () (N. Wang et al. Citation2023).
Figure 1. Geographical location and land cover types of the YRB.
2.2. Data sources and descriptions
Land cover types were obtained from the Land Processes Distributed Active Archive Center, specifically utilizing the International Geosphere-Biosphere Programme classification system. The following 10 categories were reclassified: evergreen needleleaf forests, evergreen broadleaf forests, deciduous needleleaf forests, deciduous broadleaf forests, mixed forests, shrublands, grasslands, wetlands, croplands, and other land cover types. Subsequently, the land cover data for the YRB in the year 2021 were extracted. NDVI, NDWI, and nighttime light data were acquired from the Google Earth Engine. Based on Landsat 8 dataset, with the help of the platform, images with less than 5% cloud were selected, and the algorithm was used to perform de-cloud processing, banding operation, and mean synthesis. The data were clipped to represent the NDVI, NDWI, and nighttime light within the YRB for the year 2021. Monthly mean temperature and monthly total precipitation data were sourced from the China Meteorological Data Center. With the help of Kriging interpolation, the internal checking method was verified, in which: the mean standardized was close to 0, the root-mean-square standardized was close to 1, and the average standard error was close to the root-mean-square, thus the accuracy was high. The monthly mean temperature and monthly total precipitation data of the YRB in 2021 were cropped out. Monthly total solar radiation data were obtained from the European Centre for Medium-Range Weather Forecasts. These data were combined and clipped to represent the monthly total solar radiation within the YRB for the year 2021. DEM data were derived from the NASA Shuttle Radar Topography Mission dataset, and the DEM data for the YRB in 2021 were clipped accordingly. Slope data for the YRB in 2021 were extracted from the DEM data. Road data were acquired from OpenStreetMap and subjected to kernel density analysis to derive road density data for the YRB in 2021. Considering the spatial extent of the YRB, all raster datasets were resampled to a resolution of 500 m × 500 m. The Krasovsky_1940_Albers projection coordinate system was employed for consistent spatial reference across all datasets ().
Table 1. The data sources in this study.
2.3. Research framework
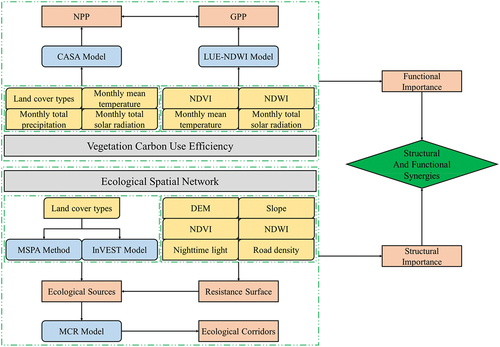
Based on a multi-source remote sensing data approach, the CASA model was utilized to generate vegetation NPP, while the LUE-NDWI model was employed to estimate vegetation GPP. The vegetation CUE for the YRB was subsequently calculated as the ratio of NPP to GPP. Core regions were delineated and analyzed using the MSPA method, and habitat quality was assessed using the InVEST model. Ecological sources were identified through spatial overlay analysis, integrating six resistance factors: DEM, slope, NDVI, NDWI, nighttime light, and road density. These factors were synthesized to construct a least-cost resistance surface. The MCR model was then applied to delineate ecological corridors, thereby establishing the woodland-shrubland-grassland ecological spatial network within the YRB. Employing complex network theory, the variations in different topological characteristics were investigated, along with their relationship to vegetation CUE. In light of the significance of structure-function relationships, optimization strategies were proposed ().
Figure 2. Research framework for structural and functional optimizations between ecological spatial network and vegetation CUE.
2.4. Methods
2.4.1. Vegetation CUE
The CASA model, based on the physiological processes of vegetation, incorporates photosynthetically active radiation (PAR) and LUE to estimate vegetation NPP (H. Yang et al. Citation2021). It is extensively utilized for NPP calculations due to its consideration of environmental conditions and vegetation-specific characteristics. With fewer easily obtainable parameters, the CASA model minimizes errors resulting from simplifications or estimations (Yin et al. Citation2020). The calculation can be expressed as follows (1), (2) and (3).
Where denotes the absorbed PAR by pixel
in month
;
denotes the actual LUE of pixel
in month
;
denotes the total solar radiation at pixel
in month
;
denotes the fraction of incident PAR absorbed by vegetation;
and
denote the effects of low and high temperatures, respectively, on LUE;
denotes the coefficient reflecting the impact of water stress;
denotes the maximum attainable LUE.
The LUE model elucidates the interception and utilization efficiency of light energy in vegetation photosynthesis, while also establishing the relationships between LUE and GPP, as well as LUE and environmental factors (Martini et al. Citation2019). It has been extensively applied in the estimation of vegetation GPP (Tagliabue et al. Citation2019). In the context of the LUE-NDWI model, the inclusion of the NDWI allows for a more comprehensive representation of vegetation water stress factors (Bao et al. Citation2022). The calculation can be expressed as follows (4), (5), (6) and (7).
Where denotes the fraction of incident
absorbed by vegetation;
denotes the maximum LUE, conventionally assigned a value of 2.14 gC/MJ;
denotes the selection of the minimum value between
and
;
denotes the temperature stress regulatory factor;
denotes the average temperature;
,
, and
denote the lower, upper, and optimal temperature thresholds for photosynthesis, typically set at 0°C, 40°C, and 20.33°C, respectively.
denotes the water stress regulatory factor.
Despite the wide-scale adoption of the aforementioned models at global, national, provincial, municipal, and county levels, inherent uncertainties persist (S. Wang et al. Citation2023). In order to further validate the accuracy of the CASA and LUE-NDWI model estimations, a comparative analysis will be conducted, contrasting the NPP and GPP values of different vegetation types in the YRB with previous research findings (Meraj et al. Citation2022; Shekhar, Buchmann, and Gharun Citation2022). Moreover, a data-driven approach will be employed to assess the model performance against MODIS data (http://lpdaac.usgs.gov/), utilizing the determination coefficient R2 as a measure of the regression equation’s goodness-of-fit to the observed data. The R2 value, ranging from 0 to 1, will provide insights into the extent of fit, with higher values indicating stronger concordance, while lower values denote diminished agreement (Dechant, Ryu, and Kang Citation2019).
2.4.2. Ecological sources
The MSPA method is an image processing technique that utilizes geometric concepts for the quantification, identification, and segmentation of raster images. It aims to characterize the geometric shapes and connectivity patterns within the images (Lin et al. Citation2023). It underscores the importance of structural connectivity while being contingent upon land-use data. Specifically, woodlands, shrublands, and grasslands were designated as foreground values, with other land use types categorized as background values. Parameters such as edge widths were systematically adjusted, and core zones were strategically identified to serve as the primary ecological sources. The InVEST model integrates the sensitivity of threat factors and the magnitude of external threats. It combines the effects of proximity and spatial weighting of threat factors to assess the habitat condition of distinct land cover units (Aneseyee et al. Citation2020). Employing cropland and other land cover types as sources of threat, and following established guidelines and relevant literature, the model quantifies the habitat quality index (Yohannes et al. Citation2021). The results are overlaid, taking into consideration the prioritization of areas with superior ecological characteristics and high habitat quality for conservation purposes. Consequently, regions with elevated values are selected as primary ecological sources.
2.4.3. Ecological resistance surface
By considering both geographical and environmental factors, ecological processes are more prone to occur in regions characterized by low terrain, gentle slopes, dense vegetation, proximity to water sources, and sparse human infrastructure (Mu et al. Citation2022). Therefore, with regard to the ecological characteristics of the YRB, six factors, namely DEM, slope, NDVI, NDWI, nighttime light, and road density, were selected to assess the spatial resistance levels. To determine the resistance values associated with these factors, a natural break classification method was employed, which involved dividing the factor ranges into distinct and discontinuous classes. Higher resistance values indicate greater costs in terms of energy flow across these factors, whereas lower resistance values suggest lower costs (W. Xu et al. Citation2021). Building upon this framework, the weights of each resistance factor were determined using the entropy-based method. Subsequently, raster computations were conducted to generate the ecological resistance surface, thus capturing the spatial patterns of resistance across the study area ().
Table 2. The resistance factor evaluation system of the YRB.
2.4.4. Ecological corridors
The MCR model initially emerged within the context of studying species migration processes and has since undergone significant improvements by relevant scholars, making it widely applicable for the identification and extraction of ecological corridors (Dai, Liu, and Luo Citation2021). Notably, this model is characterized by its simplicity, extensibility, and broad applicability. It has the capacity to simulate and compute the optimal pathway for species or energy flow from a source point to a target point based on the minimum cumulative resistance values (C. Liu et al. Citation2022). Moreover, the MCR model effectively captures the likelihood and directional tendencies of ecological flows, encompassing material flow, energy flow, and information flow among patches. The calculation can be expressed as follows (8).
Where denotes the minimum cumulative resistance value;
denotes the positive correlation between minimum cumulative resistance and ecological processes;
denotes the spatial distance from source point
to landscape unit
;
denotes the resistance coefficient of landscape unit
to ecological processes.
2.4.5. Topology metrics
When conceptualizing ecological sources as nodes and ecological corridors between them as edges, the vegetation structure encompassing woodlands, shrublands, and grasslands is abstracted as a complex network. Analyzing the topological structure of the ecological spatial network facilitates the depiction of inherent interconnections among ecological sources and the overall connectivity of the vegetation (Wu et al. Citation2022). It is noteworthy that the directionality of material, energy, and species flow between ecological sources varies across different ecological processes. Consequently, each patch within the network assumes the dual role of a source and a sink, while each ecological corridor within ecologically vulnerable and sensitive areas assumes paramount importance (Cagua, Wootton, and Stouffer Citation2019). In light of the aforementioned considerations, the topological structure of the ecological spatial network in the YRB was characterized and analyzed using the framework of undirected and unweighted networks within complex network theory. Key metrics including degree centrality, closeness centrality, and eigenvector centrality were employed to capture and elucidate the intricate network properties.
2.4.6. Pearson correlation coefficient
The Pearson correlation coefficient, is a statistical measure that assesses the degree of linear correlation between two random variables (Arif et al. Citation2021). Taking values between −1 and 1, with larger absolute values indicating stronger correlation, it serves as a significant tool for quantifying the relationship between variables (Tian et al. Citation2022). In the context of ecological systems, vegetation CUE emerges as a crucial indicator, characterizing the efficiency of carbon utilization within the ecosystem. Analyzing the intricate mechanisms of carbon cycling and its propagation and transformation in the framework of ecological spatial networks necessitates an exploration of the intricate relationship between the network’s topological structure and the observed vegetation CUE. The calculation can be expressed as follows (9).
Where denotes the calculated value of a specific topology metric for the source
;
denotes the mean value of the topology metric within a given category;
denotes the observed vegetation CUE for the source
;
denotes the mean value of vegetation CUE;
denotes the sample size.
2.4.7. Structural and functional synergies
The significance of the structural organization in an ecological spatial network is typically quantified using topology metrics such as degree centrality, closeness centrality, and eigenvector centrality. Conversely, the functional relevance of the network is assessed by ecological attributes including area, NDVI, and CUE. When considering the combined effects of both structural organization and functional attributes, the issue of their synergistic relationship emerges (Jahanishakib et al. Citation2021). A congruent match between structural importance and functional relevance indicates a synergistic state, while a mismatch implies a lack of synergy. To evaluate the degree of synergy between structural organization and functional attributes for individual ecological sources, a comprehensive assessment framework is established. The calculation can be expressed as follows (10), (11) and (12).
Where denotes the degree of synergy between structural organization and functional attributes for the ecological source
;
denotes the structural importance of the ecological source
;
,
, and
denote its degree centrality, closeness centrality, and eigenvector centrality, respectively;
denotes the functional importance of the ecological source
;
,
, and
denote its area, NDVI, and CUE, respectively;
and
denote the maximum and minimum values of each parameter across all ecological sources within the network.
3. Results
3.1. Calculation of vegetation CUE
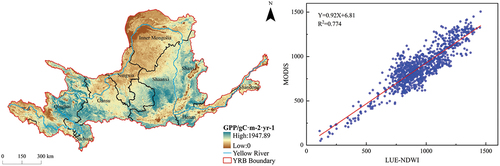
Based on the outcomes of the CASA model (), from the perspective of vegetation types, the NPP values in the YRB exhibited a pronounced elevation, particularly evident in deciduous broadleaf forests, predominantly concentrated in Shaanxi. The remaining regions with high NPP values were primarily located in the upstream of Qinghai and Gansu, characterized by shrublands and grasslands, as well as in the midstream of Shanxi, Shaanxi, and Henan, where the landscape comprised shrublands, grasslands, and croplands. These areas boasted elevated vegetation coverage, favorable temperature conditions, abundant precipitation, and ample solar radiation. A comparative assessment with MODIS data, employing a random sample of 1000 points, yielded a coefficient of determination R2 of 0.698, indicating a commendable reliability of the CASA model in predicting vegetation NPP in the YRB. Conversely, according to the findings of the LUE-NDWI model (), from the perspective of vegetation types, the GPP values in the YRB’s woodlands continued to display noteworthy peaks, primarily concentrated in Shaanxi. Notably different from the NPP results, the grasslands in upstream Qinghai, Sichuan, and Gansu also manifested elevated GPP values, significantly influenced by the factors of photosynthetically active radiation and water stress. Additionally, the midstream regions of Shanxi and Henan also exhibited heightened GPP values, prominently influenced by the interplay between photosynthetically active radiation and temperature stress. In comparison to MODIS data, utilizing a random sample of 1000 points, a coefficient of determination R2 of 0.774 was achieved, affirming the robustness and credibility of the LUE-NDWI model in estimating vegetation GPP in the YRB.
Figure 3. Calculation results of NPP by CASA model (left) and its linear regression analysis with available MODIS data (right).
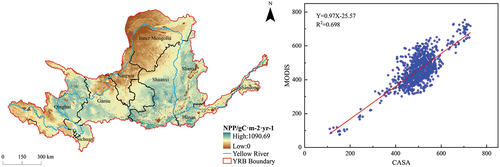
Figure 4. Calculation results of GPP by LUE-NDWI model (left) and its linear regression analysis with available MODIS data (right).
Based on the findings (), vegetation CUE of the YRB demonstrated a spatially heterogeneous pattern, varying from 0 to 0.76, with a mean value of 0.59. Notably, the western regions exhibited higher CUE values, gradually declining toward the eastern regions, reflecting an evident west-to-east gradient. This distinctive variation was closely linked to the spatial distribution of influential factors such as vegetation types, temperature, and precipitation regimes within the basin. Specifically, CUE values within the range of 0 to 0.22 covered 5.85% of the total area and were predominantly associated with non-vegetated regions, primarily concentrated in other land-use categories in the southern part of the Inner Mongolia, with sporadic occurrences within the watershed’s hydrological network. Within the interval of 0.22 to 0.46, CUE values covered 6.59% of the total area and were concentrated in the upstream regions, notably in Ningxia and Inner Mongolia, primarily characterizing croplands, in addition to some mixed forests in the midstream of Shanxi and Shaanxi, along with certain northern croplands in Henan. Encompassing 14.01% of the total area, CUE values ranging from 0.46 to 0.57 exhibited a slight increase in certain croplands in the western part of Shandong, while being predominantly concentrated in deciduous broadleaf forests in the midstream of Shanxi, Shaanxi, and Henan, including specific grasslands in the northern part of Shaanxi. Covering 34.46% of the total area, CUE values within the range of 0.57 to 0.64 were primarily concentrated in grasslands within the upstream of Gansu and Inner Mongolia, as well as in grasslands within the midstream of Shanxi and Shaanxi. Finally, CUE values falling within the range of 0.64 to 0.76 encompassed 39.09% of the total area and were prominently distributed in high-altitude grasslands (above 1500 m) of the upstream of Qinghai, Sichuan, and Gansu, as well as in specific grasslands within the central region of the Inner Mongolia. These results underscored the intricate spatial heterogeneity of CUE across the YRB and its close association with diverse vegetation types and prevailing environmental conditions.
Figure 5. Calculation results of vegetation CUE according to NPP and GPP.
3.2. Identification of ecological sources and generation of ecological resistance surface
Based on the results of the screening and classification (), a total of 203 ecological sources were identified in the YRB, covering a combined area of approximately 47,929 km2, with an average area of about 236.11 km2. Among them, the largest source spanned 5030 km2, while the smallest encompassed 31 km2. Specifically, there were 53 woodland ecological sources, constituting 26.11% of the total, which were distributed along the Fen River, Luo River, and Wei River. The shrubland ecological sources, located in the transitional zone between woodlands and grasslands, were relatively small in size and susceptible to being masked by either woodlands or grasslands, leading to their classification as woodland or grassland ecological sources. The majority of the ecological sources, totaling 150, were grassland habitats, comprising 73.89% of the overall distribution, and were found in Qinghai, Gansu, and Inner Mongolia. Further examination of the literature revealed that various national-level nature reserves, including Mengda, Xinglong Mountain, Daqing Mountain, Pangquangou, and Zhouzhi, adjoined these ecological sources. Moreover, additional nature reserves also intersected with scattered ecological sources within the YRB.
Figure 6. Ecological sources (a) and ecological resistance surfaces (b) in the YRB.
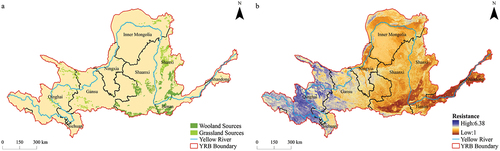
Based on the results of the superimposition of resistance values (), the ecological resistance surface within the YRB exhibited pronounced regional heterogeneity, characterized by a discernible pattern of higher resistance in the western reaches and lower resistance in the eastern stretches. The resistance values fluctuated in the range of 1 to 6.38. The western region was characterized by intricate DEM, encompassing elevated mountainous terrain and plateaus, resulting in pronounced steepness of slope and consequent reduction in the NDVI. Precipitation scarcity constrained the NDWI, leading to a paucity of water bodies and a sparser manifestation of nighttime light. The constrained road density arose from the formidable challenges posed by the rugged mountainous landscape, impeding road construction efforts. In contrast, the eastern region featured relatively level DEM with gentle slope, contributing to an augmented NDVI. The NDWI attested to a comparatively abundant water resource. Concentrated and flourishing nighttime light signified a sophisticated infrastructure, reflected in the heightened road density, indicative of a more advanced transportation network. Specifically, elevated resistance values were observed in the eastern part of Qinghai and the southern part of Gansu. These areas were predominantly hilly and mountainous, characterized by significant variations in DEM and slope, which presented challenges for road construction and consequently led to relatively lower road density, thereby contributing to the higher resistance values. Conversely, the western part of Shanxi and the northern part of Shaanxi exhibited intermediate levels of resistance. Despite relatively suboptimal infrastructure development in these regions, other contributing factors to resistance remained at moderate levels, thereby striking a balance and effectively mitigating the impact of road density-related resistance shortcomings. In contrast, the southern part of Shanxi, the central part of Shaanxi, and the northern part of Henan manifested lower resistance values. These areas were predominantly characterized by plains with relatively gentle terrain, featuring lower DEM and slope, facilitating more convenient road construction and, in turn, resulting in reduced resistance values. Nonetheless, it was essential to acknowledge that the escalation of urbanization and population density expansion continued to exert a discernible influence on the ecological resistance surface.
3.3. Extraction of ecological corridors and simulation of ecological spatial networks
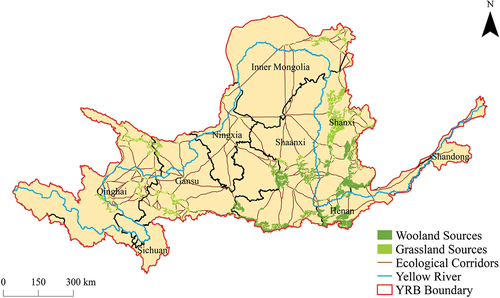
Based on the findings of the MCR model, the woodland-shrubland-grassland ecological spatial network in the YRB exhibited a notable regional variation, characterized by 311 identified ecological corridors with a combined length of approximately 11,058.51 km and an average length of approximately 35.56 km. The longest corridor stretched over 434.19 km, while the shortest corridor measured a mere 0.71 km. Geospatially, these ecological corridors demonstrated significant heterogeneity in their distribution. In the upstream region, the ecological sources were predominantly composed of grasslands. Despite their numerical abundance, comprising a total of 114 distinct sources, their aggregated spatial extent was relatively modest, approximately 10,280 km2. Owing to a marginally elevated composite ecological resistance in the proximate regions, the ecological corridors within this locale exhibited a greater numerical abundance and extended spatial dimensions. Specifically, there were a total of 182 corridors, collectively spanning an approximate distance of 7312.01 km. These corridors exhibited a network-like configuration, mainly concentrated in the eastern portion of Qinghai, the southern section of Gansu, and the southern part of Inner Mongolia. In contradistinction, the midstream region manifested a prevalence of woodlands within its ecological sources, displaying a heightened abundance and expanded spatial footprint. A total of 87 such sources were identified, collectively encompassing an approximate area of 37,566 km2. The ambient regions, characterized by a comparatively diminished composite ecological resistance, consequently exhibited a reduced quantity of ecological corridors, with a correspondingly diminished overall length. Precisely, 128 corridors were discerned, with a combined extent approximating 3312.31 km. However, these corridors were characterized by robust and well-balanced connectivity, predominantly concentrated in the southern part of Shanxi, the central part of Shaanxi, and the northern part of Henan. In the downstream region, a conspicuous scarcity of ecological sources was observed, with a nominal presence of merely two discernible sources, encompassing an approximate land area of 83 km2. However, the surrounding areas met the minimum criteria for ecological corridors, allowing for connectivity with midstream ecological sources. Nevertheless, given the dearth of ecological sources, the ecological corridors in this locale were predisposed to fragmentation, as evidenced by the identification of a solitary corridor spanning approximately 434.19 km. Consequently, there existed an exigent necessity to enhance both the ecological underpinning and the facilitation of ecological connectivity. Overall, the woodland-shrubland-grassland ecological spatial network in the YRB exhibited distinct characteristics, including denser and longer corridors in the upper and middle reaches, sparser and shorter corridors in the middle and lower reaches, and the presence of a continuous corridor system connecting the entire network from the upper to the lower reaches, thereby facilitating ecological flow and exchange ().
Figure 7. Woodland-shrubland-grassland ecological spatial network in the YRB.
3.4. Selection of topology metrics and connection of correlations
Ecological centrality measures played a crucial role in quantifying the significance of ecological sources within a network. Specifically, three centrality metrics were employed: degree centrality, closeness centrality, and eigenvector centrality () (H. Liu et al. Citation2022). Degree centrality, reflecting the number of direct connections a source possessed, served as an indicator of its importance within the ecological spatial network. Notably, the maximum degree centrality was recorded at 0.06 for deciduous broad-leaved forests located at the border of Gansu and Shaanxi, while the average degree centrality across all sources was 0.02. Closeness centrality assessed the accessibility of a source to other sources in the network, capturing the extent to which a source was proximate to the network’s central core. Remarkably, the ecological spatial network exhibited a maximum closeness centrality value of 0.19, associated with a grassland region situated in the central part of Ningxia. The average closeness centrality of the network was 0.12. Eigenvector centrality, on the other hand, characterized the influence and connectedness of sources, with higher values indicating that a source was encompassed by other well-connected sources. In line with the degree centrality findings, the maximum eigenvector centrality of 1 was observed again in the same deciduous broad-leaved forests at the Gansu-Shaanxi border. The average eigenvector centrality stood at 0.15, reflecting the propensity of sources to be surrounded by highly connected neighbors. A comprehensive assessment of the ecological spatial network in the YRB revealed an average degree of 3.06, signifying that each ecological source was typically linked to 3.06 ecological corridors. Moreover, the network’s diameter was determined to be 21, while the average path length measured 8.34, with a modularity index of 0.77, highlighting the presence of well-defined community structures. The emergence of communities within a network engendered functional specialization among network nodes, with nodes within disparate communities often displaying analogous functionalities or tasks. Systematic analysis of the network’s community structure enhanced the identification of pivotal nodes throughout the entirety of the network. This analytical framework facilitated the discernment of nodes critical to the overarching architectural and functional integrity of the network. These communities segregated the 203 ecological nodes into 12 distinct groups. Community 6 stood out with the highest number of ecological sources (31), distributed across the southern parts of Shanxi and the central parts of Shaanxi, as well as the northern parts of Henan. In contrast, Community 7 comprised the fewest ecological sources (11), distributed in the southern parts of Inner Mongolia and the northern parts of Shaanxi ().
Figure 8. Topological properties of nodes including degree centrality (a), closeness centrality (b), and eigenvector centrality (c) in the ecological spatial network.
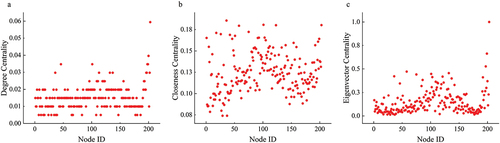
Figure 9. Community division of ecological sources in the YRB.
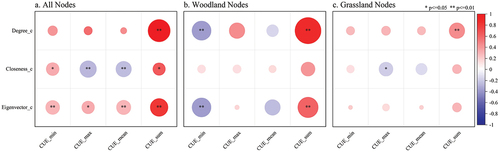
In the given context, the vegetation CUE was integrated into the woodland-shrubland-grassland ecological spatial network within the YRB. Subsequently, the minimum, maximum, average, and cumulative values of vegetation CUE were derived for each ecological source, and their correlations with degree centrality, closeness centrality, and eigenvector centrality were rigorously examined (). The findings revealed noteworthy patterns for all nodes, wherein the minimum vegetation CUE exhibited a significant positive association with both closeness centrality and eigenvector centrality. Conversely, the maximum and average vegetation CUE demonstrated significant negative correlations with closeness centrality while being positively correlated with eigenvector centrality. Additionally, the total vegetation CUE manifested significant positive correlations with degree centrality, closeness centrality, and eigenvector centrality. Moreover, a more detailed analysis of woodland nodes elucidated a significant negative correlation between the minimum vegetation CUE and both degree centrality and eigenvector centrality. Conversely, the cumulative vegetation CUE exhibited significant positive correlations with degree centrality and eigenvector centrality. Similarly, among grassland nodes, the maximum vegetation CUE exhibited a significant negative correlation with closeness centrality, while the cumulative vegetation CUE displayed a significant positive correlation with degree centrality. Within ecosystems, species that exhibited heightened node centrality often occupied pivotal positions in the network, thereby exerting amplified influence and control. Concurrently, vegetation CUE served as a metric reflective of the internal operational dynamics of a community, delineating how the community strategically deployed resources and executed functional processes. The observed correlation between node centrality and CUE suggested that entities occupying critical positions within the network wielded significance not solely at the individual node level but also wielded substantial influence over the overall utility and efficiency of the community. This correlation introduced potential dynamics that could induce discernible shifts in the stability and resilience of the ecosystem. Species characterized by elevated node centrality could wield pronounced influence over the structural integrity and stability of the entire ecosystem, while an augmentation in CUE held promise for fostering more judicious resource utilization. Nonetheless, it was imperative to acknowledge that such enhancements could concurrently render the ecosystem more susceptible to perturbations, given the heightened reliance on specific nodes. As an overarching implication, augmenting positively correlated topological metrics while mitigating negatively correlated topological metrics was found to enhance vegetation CUE within the ecological spatial network. These findings underscored the importance of network topology in influencing vegetation CUE dynamics and offered valuable insights for the management and conservation of ecological systems.
Figure 10. Pearson’s correlation coefficients matrix between vegetation CUE and topological properties of all nodes (a), woodland nodes (b), and grassland nodes (c).
3.5. Synergy analysis of structural characterization and vegetation CUE
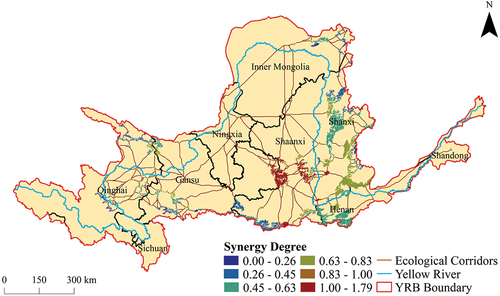
The assessment of the structural and functional importance of ecological sources within the woodland-shrubland-grassland ecological spatial network of the YRB was undertaken. Subsequently, the degree of synergy between structural and functional importance for each ecological source was quantified. Among them, a total of 20 ecological sources exhibited structural importance surpassing functional importance. These sources were primarily characterized by vast expanses of woodlands as the dominant land-use type, with all topological metrics surpassing the average values. The physical structure and organization of these sources provided a stable foundation for sustaining CUE and played an indispensable bridging role within the ecological spatial network. Notably, these sources were predominantly distributed in the northern part of Gansu, the southern part of Shanxi, and the central part of Shaanxi, with scattered occurrences in Ningxia and Inner Mongolia. Conversely, a larger group of 183 ecological sources exhibited functional importance outweighing structural importance. These sources were characterized by a predominant presence of grasslands as the primary land-use type. Despite the relative disadvantages of grasslands in terms of area and NDVI when compared to woodlands, their proportionate contribution to CUE exceeded that of woodlands. Additionally, these sources demonstrated relatively weaker structural attributes. Nevertheless, their functional importance emerged as a distinct feature. These sources were predominantly distributed in the eastern part of Qinghai, the southern part of Gansu, the central part of Shanxi, the southern part of Shaanxi, and the northern part of Henan, with sporadic occurrences in Ningxia, Inner Mongolia, and Shandon. In conclusion, the findings of this study revealed a diverse range of ecological sources with varying degrees of synergy between structural and functional importance. Woodlands played a vital role in providing stability and organizational support for CUE, while grasslands excelled in functional importance despite their relatively weaker structural attributes. These results hold substantial implications for the past management and conservation of ecological systems within the YRB ().
Figure 11. Structural-functional synergy degree in the ecological spatial network.
For ecologically sources characterized by a deficiency in functional importance, those exhibiting a structural-functional synergy index greater than 1.5, the implementation of ecological construction and conservation measures, such as blue-green protection, is imperative. (1) In grassland ecosystems, a meticulously balanced amalgamation of organic and mineral fertilizers is systematically administered to ameliorate soil structure. Indigenous grass species, including Puccinellia distans and Achnatherum sibiricum, alongside other flora resilient to arid and saline conditions, are introduced. Employing a scientifically rigorous transplantation methodology ensures the viability and proliferation of these species in the novel environment, thereby fostering a progressive resurgence of vegetative cover. (2) In wetland ecosystems, aimed at water quality refinement, the establishment of a wetland ecological framework capitalizes on the adsorption and decomposition attributes inherent to wetland vegetation. Water-purifying hydrophytic species such as Calamus and Reed are incorporated, harnessing their efficacious capacity for the degradation of organic constituents and adsorption of contaminants, thereby heightening the ecological efficacy of wetland environments. (3) In desert ecosystems, the introduction of xerophytic species such as Caragana microphylla and Sea-buckthorn acts to configure a vegetative barrier, mitigating the erosive impact of wind and sand. The profound root systems and luxuriant foliage of these plants contribute substantively to soil conservation, effecting enhancements in soil structure and quality. Additionally, these species furnish commensurate nutrients and water provisions, thereby catalyzing the ecological rehabilitation and fortification. Conversely, ecologically sources exhibiting a deficiency in structural importance, those with a structural-functional synergy index less than 0.5, necessitate the enhancement of ecological corridors to bolster the interconnectivity of the ecological source network. (1) In woodland ecosystems, a meticulous topographical survey and comprehensive soil analysis are conducted, taking into account terrain features, soil characteristics, and the distribution of water resources. The planning and construction of aqueducts and aquatic corridors are undertaken judiciously. In consideration of carbon exchange dynamics within ecological sources, the dimensions of aquatic corridors are engineered to facilitate extensive interaction between aquatic and terrestrial ecosystems. Additionally, it is imperative to ensure that aqueducts maintain the natural hydrological flow, minimizing disturbances to the ecosystem. (2) In desert ecosystems, the design of shelterbelt forests is informed by the integration of vegetation adaptability and terrain features. Through rigorous ecological assessments, the determination of vegetation types and densities ensures the effective enhancement of vegetation cover. The dimensions of shelterbelt forests are modulated to strike an optimal balance between vegetation growth requirements and protective efficacy. When determining distances, the emphasis is on the ease of construction and stable operation, ensuring that ecological corridors are not excessively protracted, particularly when established between relatively proximate ecological sources. Considering diverse factors, including land use and climatic conditions, spatial optimization strategies are formulated, employing GIS and RS technologies to maximally enhance the structure and functionality of ecosystems. Simultaneously, restrictions on the number of new corridors are imposed to ensure their seamless integration with existing corridors, thereby upholding the stability of the overall ecological spatial network.
4. Discussion
4.1. Optimization proposals in the YRB
In the context of the CASA model, the average NPP for woodlands in the YRB was reported as 615.57 gC·m−2·yr−1, while shrublands exhibited an average NPP of 392.23 gC·m−2·yr−1, and grasslands displayed an average NPP of 434.91 gC·m−2·yr−1. In contrast, according to the LUE-NDWI model, the GPP for woodlands was substantially higher, with an average value of 1284.15 gC·m−2·yr−1, whereas shrublands exhibited an average GPP of 1203.11 gC·m−2·yr−1, and grasslands presented an average GPP of 612.52 gC·m−2·yr−1. The considerable discrepancy between NPP and GPP in woodlands contributed to a relatively low CUE, while the proximity of NPP and GPP in grasslands resulted in an exceptionally high CUE. This had similar results to previous studies (X. Liu et al. Citation2024). It was evident that changes in vegetation CUE were subject to the influence of various factors, such as topographic elevation, climatic conditions, and vegetation types. Among these factors, vegetation type emerged as the predominant determinant impacting CUE variations, while temperature, precipitation, and the maximum light use efficiency factor played a significant role in inducing fluctuations, with geographic location and the external environment indirectly influencing CUE dynamics (Dusenge, Duarte, and Way Citation2019). In the context of network topology metrics, optimizing the ecological sources of woodlands requires an enhancement of heterogeneity in the degree distribution, creating a more pronounced differentiation in the connectivity with other sources, thereby elevating their degree centrality. To achieve an optimal network structure, adopting configurations such as “small-world networks” or “scale-free networks” is recommended, thus bolstering their eigenvector centrality (Y. Lu et al. Citation2022). Similarly, for grassland ecological sources, strategic node placement and resource allocation strategies should be employed to increase the average shortest path length to other sources, consequently reducing their closeness centrality (H. Zhang et al. Citation2023).
In the woodland-shrubland-grassland ecological spatial network within the YRB, the primary focus has been on addressing functional importance for most ecological sources, while the aspect of structural importance requires further attention (Kowe et al. Citation2021). To enhance the structural importance of ecological sources in the network, strategies aimed at promoting ecological connectivity are commonly employed. For instance, in regions characterized by a proliferation of ecological corridors in the middle reaches of the YRB, susceptible to disturbances, the establishment of ecological connectivity bridges or the conservation of existing ecologically critical nodes can create multiple pathways facilitating access through central ecological sources (Zeng et al. Citation2023). Additionally, augmenting ecological stepping stones indirectly reinforces the structural importance of ecological sources. In regions such as the central part of Gansu, the southern part of Inner Mongolia, and the northern part of Henan, the addition of new ecological sources is envisaged to enhance energy flow between these areas and their surrounding source regions. Furthermore, various measures can be adopted to strengthen the structural importance of ecological sources within the network (Brimacombe et al. Citation2023). Firstly, augmenting the node degree centrality, optimizing the closeness centrality and eigenvector centrality, and forming clusters are some of the strategies aimed at reinforcing connectivity and intermediary roles of ecological sources in the network. Enabling the involvement of sources in critical corridors can elevate their influence and status, thereby enhancing their significance within the network’s topological structure. Secondly, the application of social network analysis and influence maximization algorithms facilitates the identification of influential ecological sources and their subsequent enhancement. Moreover, a comprehensive assessment of node importance can be achieved through the consideration of multiple centrality indicators. Lastly, due attention should be accorded to the dynamic nature of the ecological spatial network, facilitating timely adaptations to changes in the network’s structure in order to achieve optimization effects. Such endeavors provide valuable support for the optimization and application of the woodland-shrubland-grassland ecological spatial network within the YRB.
4.2. Limitations and future perspectives
The study employed the maximum light use efficiency from the CASA and LUE-NDWI models, selecting parameter values based on prior research conducted at a national scale in China. While this approach exhibited a degree of feasibility, it was imperative to acknowledge the substantial heterogeneity in ecological environments across diverse regions, encompassing variations in vegetation types, soil properties, and moisture conditions (Sun et al. Citation2023). Light use efficiency underwent dynamic changes in response to seasonal and climatic fluctuations. The utilization of fixed parameters may have inadequately captured the nuanced seasonal disparities, particularly in regions characterized by pronounced seasonal climatic variations, such as the YRB. Additionally, the parameter values within the models were typically derived under specific soil moisture conditions, and fluctuations in soil moisture could impart a significant impact on light use efficiency. Moreover, as the lack of field-based measurements necessitated the use of MODIS data for model validation, disparities between the MODIS data and actual observations persisted. Consequently, the acquisition of field-based observational data emerges as a pivotal challenge for future endeavors aimed at enhancing the precision and validation of the models (M. Wang et al. Citation2021).
This study was undertaken with a foundation of understanding the vegetation patterns of woodlands, shrublands, and grasslands within the YRB. Distinct regions exhibited disparate vegetation patterns, growth conditions, and spatial factors. The expansive geographical expanse encompassed a diverse array of vegetation types, including forests, grasslands, and wetlands, constituting multifaceted ecosystems. Disparities in both topography and land use contributed to the heterogeneity observed in vegetation distribution. The region manifested varied climatic conditions, featuring both arid and semi-arid climates, coupled with a diversity of soil types. This environmental complexity imposed a spectrum of growth constraints upon the plant community. These nuanced growth conditions engendered pronounced differentials in their impact on light use efficiency and the functionality of the ecosystem. Consequently, optimizing the vegetation of woodlands, shrublands, and grasslands necessitates context-specific strategies tailored to the unique characteristics of each area. Future research should focus on elucidating the driving factors influencing the spatial distribution of vegetation patterns in the YRB, serving as the basis for developing meticulous and regionally adapted optimization schemes for the vegetation cover (B. Guo et al. Citation2022). Moreover, the study employed network analysis to investigate the spatial structure of the vegetation, considering ecological corridors with uniform weights connecting sources of woodlands, shrublands, and grasslands. Accordingly, topology metrics of an undirected and unweighted network were utilized to examine the vegetation structure. However, given the diverse natural conditions such as topography, climate, and ecological attributes across different regions, the composition and size of the sources linked by ecological corridors may vary, leading to differential ecological corridor importance. As a result, future research should explore the adoption of a weighted network approach to analyze the vegetation structure, accounting for the spatial variability and ecological significance of corridors (Z. Lu, Li, and Zhou Citation2023). In contrast to conventional binary network models, the weighted network model incorporates edge weights, facilitating a nuanced and comprehensive analysis of interspecies interactions. Through the quantification of ecological attributes, such as interaction strength and energy flow, the weighted network model not only elucidates the presence or absence of connections among species but also furnishes intricate insights into the intensity of these connections and associated ecological processes. Its distinctive advantage resides in its capacity to discern asymmetry and heterogeneity within ecological systems. Furthermore, the current research on optimization strategies for ecological spatial networks remained limited, lacking a comprehensive and scientifically rigorous research framework. To address this gap, future investigations should integrate the topological structure of the ecological spatial network and the functional relationship of CUE, while considering the unique characteristics of the basin. A meticulous examination of network structure entails a detailed scrutiny of inter-nodal connections, relational density, and overall topological configuration. This encompasses a quantitative evaluation of fundamental network metrics, including node degree, clustering coefficients, and centrality indices. Subsequent to this structural analysis, a comprehensive assessment of network functionality is undertaken, with particular emphasis on discerning the roles and interplays of constituent nodes and edges within the network architecture. Finally, a nuanced investigation into regional characteristics is performed, incorporating considerations of topographical features, soil composition, and climatic variables (Lian et al. Citation2022). This multifaceted approach is designed to yield a thorough comprehension of the network’s inherent attributes across diverse geographical contexts.
5. Conclusion
This study was based on an analysis of the vegetation patterns in the YRB, which led to the construction of an ecological spatial network using the MCR model. Additionally, the CASA and LUE-NDWI models were applied to estimate the vegetation CUE within the basin. By integrating the structural and functional characteristics, the interrelationship between the woodland-shrubland-grassland ecological spatial network and the vegetation CUE was examined, and optimization strategies were subsequently proposed.
In the YRB, discernible disparities in CUE were observed across different vegetation types. Notably, grasslands exhibited the highest CUE values, followed by woodlands, and then shrublands. Furthermore, a spatial trend was identified, indicating a declining pattern in CUE values from the western to the eastern regions. This spatial variation was associated with the distribution of vegetation types, as well as climatic factors such as temperature, precipitation, and maximum light use efficiency.
In the YRB, ecological sources of woodlands, shrublands, and grasslands were predominantly concentrated along the Fen River, Luo River, and Wei River, in addition to high-altitude areas encompassing Qinghai and Gansu. The woodland-shrubland-grassland ecological spatial network demonstrated a dense configuration in the upper and middle reaches, with a sparser distribution in the middle and lower reaches. Furthermore, the upper, middle, and lower reaches were interconnected to form a cohesive network.
In the context mentioned above, significant correlations were established between the centrality measures (degree centrality, closeness centrality, and eigenvector centrality) of the woodland-shrubland-grassland ecological spatial network and the vegetation CUE, thus revealing a substantive association between the structural and functional characteristics of the ecological spatial network. In alignment with a synergy analysis, ecological interventions were proposed for regions characterized by a deficit in functional importance, as notably exemplified in locales such as Gansu and Ningxia. Measures involving blue protection and green enhancement were advocated to foster substantive ecological construction and conservation. In locales marked by a shortfall in structural importance, typified by provinces including Qinghai and Inner Mongolia, the augmentation of ecological corridors was posited as a strategic imperative to elevate the connectivity of ecological source sites within the broader network.
Disclosure statement
No potential conflict of interest was reported by the author(s).
Data availability statement
The data that supported the findings of this study were obtained from publicly available datasets, and the websites providing access to these datasets were included in the article.
Additional information
Funding
References
- Aneseyee, A. B., T. Noszczyk, T. Soromessa, and E. Elias. 2020. “The InVEST Habitat Quality Model Associated with Land Use/Cover Changes: A Qualitative Case Study of the Winike Watershed in the Omo-Gibe Basin, Southwest Ethiopia.” Remote Sensing 12 (7): 1103. https://doi.org/10.3390/rs12071103.
- Arif, M., M. Tahir, J. Zheng, and C. Li. 2021. “Impacts of Riparian Width and Stream Channel Width on Ecological Networks in Main Waterways and Tributaries.” Science of the Total Environment 792:148457. https://doi.org/10.1016/j.scitotenv.2021.148457.
- Bao, S., A. Ibrom, G. Wohlfahrt, S. Koirala, M. Migliavacca, Q. Zhang, and N. Carvalhais. 2022. “Narrow but Robust Advantages in Two-Big-Leaf Light Use Efficiency Models Over Big-Leaf Light Use Efficiency Models at Ecosystem Level.” Agricultural and Forest Meteorology 326:109185. https://doi.org/10.1016/j.agrformet.2022.109185.
- Brimacombe, C., K. Bodner, M. Michalska-Smith, T. Poisot, and M.-J. Fortin. 2023. “Shortcomings of Reusing Species Interaction Networks Created by Different Sets of Researchers.” PLOS Biology 21 (4): e3002068. https://doi.org/10.1371/journal.pbio.3002068.
- Cagua, E. F., K. L. Wootton, D. B. Stouffer. 2019. “Keystoneness, Centrality, and the Structural Controllability of Ecological Networks.” The Journal of Ecology 107 (4): 1779–21. https://doi.org/10.1111/1365-2745.13147.
- Cao, D., J. Zhang, T. Zhang, F. Yao, R. Ji, S. Zi, H. Li, and Q. Cheng. 2023. “Spatiotemporal Variations and Driving Factors of Global Terrestrial Vegetation Productivity Gap Under the Changing of Climate, CO2, Landcover and N Deposition.” Science of the Total Environment 880:162753. https://doi.org/10.1016/j.scitotenv.2023.162753.
- Chen, Z., G. Yu, and Q. Wang. 2019. “Magnitude, Pattern and Controls of Carbon Flux and Carbon Use Efficiency in China’s Typical Forests.” Global and Planetary Change 172:464–473. https://doi.org/10.1016/j.gloplacha.2018.11.004.
- Dai, L., Y. Liu, and X. Luo. 2021. “Integrating the MCR and DOI Models to Construct an Ecological Security Network for the Urban Agglomeration Around Poyang Lake, China.” Science of the Total Environment 754:141868. https://doi.org/10.1016/j.scitotenv.2020.141868.
- Dechant, B., Y. Ryu, and M. Kang. 2019. “Making Full Use of Hyperspectral Data for Gross Primary Productivity Estimation with Multivariate Regression: Mechanistic Insights from Observations and Process-Based Simulations.” Remote Sensing of Environment 234:111435. https://doi.org/10.1016/j.rse.2019.111435.
- Dusenge, M. E., A. G. Duarte, and D. A. Way. 2019. “Plant Carbon Metabolism and Climate Change: Elevated CO2 and Temperature Impacts on Photosynthesis, Photorespiration and Respiration.” The New Phytologist 221 (1): 32–49. https://doi.org/10.1111/nph.15283.
- Fang, M., G. Si, Q. Yu, H. Huang, Y. Huang, W. Liu, and H. Guo. 2021. “Study on the Relationship Between Topological Characteristics of Vegetation Ecospatial Network and Carbon Sequestration Capacity in the Yellow River Basin, China.” Remote Sensing 13 (23): 4926. https://doi.org/10.3390/rs13234926.
- Fan, J., Q. Wang, M. Ji, Y. Sun, Y. Feng, F. Yang, and Z. Zhang. 2023. “Ecological Network Construction and Gradient Zoning Optimization Strategy in Urban-Rural Fringe: A Case Study of Licheng District, Jinan City, China.” Ecological Indicators 150:110251. https://doi.org/10.1016/j.ecolind.2023.110251.
- Fortin, M.-J., M. R. T. Dale, and C. Brimacombe. 2021. “Network Ecology in Dynamic Landscapes.” Proceedings of the Royal Society B: Biological Sciences 288 (1949): rspb.2020.1889, 20201889. https://doi.org/10.1098/rspb.2020.1889.
- Guo, B., C. Wei, Y. Yu, Y. Liu, J. Li, C. Meng, and Y. Cai. 2022. “The Dominant Influencing Factors of Desertification Changes in the Source Region of Yellow River: Climate Change or Human Activity?.” Science of the Total Environment 813:152512. https://doi.org/10.1016/j.scitotenv.2021.152512.
- Guo, H., Q. Yu, Y. Pei, G. Wang, and D. Yue. 2021. “Optimization of Landscape Spatial Structure Aiming at Achieving Carbon Neutrality in Desert and Mining Areas.” Journal of Cleaner Production 322:129156. https://doi.org/10.1016/j.jclepro.2021.129156.
- Hou, G., S. Wu, W. Long, C. Chen, Z. Zhang, Y. Fang, Y. Zhang, and G. Luo. 2023. “Quantitative Analysis of the Impact of Climate Change and Oasification on Changes in Net Primary Productivity Variation in Mid-Tianshan Mountains from 2001 to 2020.” Ecological Indicators 154:110820. https://doi.org/10.1016/j.ecolind.2023.110820.
- Huang, L., J. Wang, and X. Chen. 2022. “Ecological Infrastructure Planning of Large River Basin to Promote Nature Conservation and Ecosystem Functions.” Journal of Environmental Management 306:114482. https://doi.org/10.1016/j.jenvman.2022.114482.
- Jahanishakib, F., A. Salmanmahiny, S. H. Mirkarimi, and F. Poodat. 2021. “Hydrological Connectivity Assessment of Landscape Ecological Network to Mitigate Development Impacts.” Journal of Environmental Management 296:113169. https://doi.org/10.1016/j.jenvman.2021.113169.
- Jiang, Z.-Y., Z.-G. Yang, S.-Y. Zhang, C.-M. Liao, Z.-M. Hu, R.-C. Cao, and H.-W. Wu. 2020. “Revealing the Spatio-Temporal Variability of Evapotranspiration and Its Components Based on an Improved Shuttleworth-Wallace Model in the Yellow River Basin.” Journal of Environmental Management 262:110310. https://doi.org/10.1016/j.jenvman.2020.110310.
- Jian, S., Q. Zhang, and H. Wang. 2022. “Spatial–Temporal Trends in and Attribution Analysis of Vegetation Change in the Yellow River Basin, China.” Remote Sensing 14 (18): 4607. https://doi.org/10.3390/rs14184607.
- Kafy, A.-A., M. Saha, M. A. Fattah, M. T. Rahman, B. M. Duti, Z. A. Rahaman, A. Bakshi, S. Kalaivani, S. Nafiz Rahaman, and G. S. Sattar. 2023. “Integrating Forest Cover Change and Carbon Storage Dynamics: Leveraging Google Earth Engine and InVest Model to Inform Conservation in Hilly Regions.” Ecological Indicators 152:110374. https://doi.org/10.1016/j.ecolind.2023.110374.
- Kowe, P., O. Mutanga, J. Odindi, and T. Dube. 2021. “Effect of Landscape Pattern and Spatial Configuration of Vegetation Patches on Urban Warming and Cooling in Harare Metropolitan City, Zimbabwe.” GIScience & Remote Sensing 58 (2): 261–280. https://doi.org/10.1080/15481603.2021.1877008.
- Lian, X., L. Jiao, Z. Liu, Q. Jia, J. Zhong, M. Fang, and W. Wang. 2022. “Multi-Spatiotemporal Heterogeneous Legacy Effects of Climate on Terrestrial Vegetation Dynamics in China.” GIScience & Remote Sensing 59 (1): 164–183. https://doi.org/10.1080/15481603.2021.2022426.
- Lin, J., S. Qiu, X. Tan, and Y. Zhuang. 2023. “Measuring the Relationship Between Morphological Spatial Pattern of Green Space and Urban Heat Island Using Machine Learning Methods.” Building & Environment 228:109910. https://doi.org/10.1016/j.buildenv.2022.109910.
- Liu, X., Q. Lai, S. Yin, Y. Bao, S. Tong, Z. Adiya, A. Sanjjav, and R. Gao. 2024. “Spatio-Temporal Patterns and Control Mechanism of the Ecosystem Carbon Use Efficiency Across the Mongolian Plateau.” Science of the Total Environment 907:167883. https://doi.org/10.1016/j.scitotenv.2023.167883.
- Liu, C., W. Li, J. Xu, H. Zhou, C. Li, and W. Wang. 2022. “Global Trends and Characteristics of Ecological Security Research in the Early 21st Century: A Literature Review and Bibliometric Analysis.” Ecological Indicators 137:108734. https://doi.org/10.1016/j.ecolind.2022.108734.
- Liu, H., T. Niu, Q. Yu, L. Yang, J. Ma, S. Qiu, R. Wang, W. Liu, and J. Li. 2022. “Spatial and Temporal Variations in the Relationship Between the Topological Structure of Eco-Spatial Network and Biodiversity Maintenance Function in China.” Ecological Indicators 139:108919. https://doi.org/10.1016/j.ecolind.2022.108919.
- Lu, Y., Y. Liu, D. Huang, and Y. Liu. 2022. “Evolution Analysis of Ecological Networks Based on Spatial Distribution Data of Land Use Types Monitored by Remote Sensing in Wuhan Urban Agglomeration, China, from 2000 to 2020.” Remote Sensing 14 (11): 2618. https://doi.org/10.3390/rs14112618.
- Lu, Z., W. Li, and S. Zhou. 2023. “Constructing a Resilient Ecological Network by Considering Source Stability in the Largest Chinese Urban Agglomeration.” Journal of Environmental Management 328:116989. https://doi.org/10.1016/j.jenvman.2022.116989.
- Martini, D., J. Pacheco-Labrador, O. Perez-Priego, C. V. D. Tol, T. S. Madany, T. Julitta, M. Rossini, et al. 2019. “Nitrogen and Phosphorus Effect on Sun-Induced Fluorescence and Gross Primary Productivity in Mediterranean Grassland.” Remote Sensing 11 (21): 2562. https://doi.org/10.3390/rs11212562.
- Mathias, J. M., A. T. Trugman. 2022. “Climate Change Impacts Plant Carbon Balance, Increasing Mean Future Carbon Use Efficiency but Decreasing Total Forest Extent at Dry Range Edges.” Ecology Letters 25 (2): 498–508. https://doi.org/10.1111/ele.13945.
- Meraj, G., S. Kanga, A. Ambadkar, P. Kumar, S. K. Singh, M. Farooq, B. A. Johnson, A. Rai, and N. Sahu. 2022. “Assessing the Yield of Wheat Using Satellite Remote Sensing-Based Machine Learning Algorithms and Simulation Modeling.” Remote Sensing 14 (13): 3005. https://doi.org/10.3390/rs14133005.
- Mu, H., X. Li, H. Ma, X. Du, J. Huang, W. Su, Z. Yu, et al. 2022. “Evaluation of the Policy-Driven Ecological Network in the Three-North Shelterbelt Region of China.” Landscape and Urban Planning 218:104305. https://doi.org/10.1016/j.landurbplan.2021.104305.
- Murshed, M., N. Apergis, M. S. Alam, U. Khan, and S. Mahmud. 2022. “The Impacts of Renewable Energy, Financial Inclusivity, Globalization, Economic Growth, and Urbanization on Carbon Productivity: Evidence from Net Moderation and Mediation Effects of Energy Efficiency Gains.” Renew Energy 196:824–838. https://doi.org/10.1016/j.renene.2022.07.012.
- Qiu, S., M. Fang, Q. Yu, T. Niu, H. Liu, F. Wang, C. Xu, M. Ai, and J. Zhang. 2023. “Study of Spatialtemporal Changes in Chinese Forest Eco-Space and Optimization Strategies for Enhancing Carbon Sequestration Capacity Through Ecological Spatial Network Theory.” Science of the Total Environment 859:160035. https://doi.org/10.1016/j.scitotenv.2022.160035.
- Qiu, S., Q. Yu, T. Niu, M. Fang, H. Guo, H. Liu, S. Li, and J. Zhang. 2022. “Restoration and Renewal of Ecological Spatial Network in Mining Cities for the Purpose of Enhancing Carbon Sinks: The Case of Xuzhou, China.” Ecological Indicators 143:109313. https://doi.org/10.1016/j.ecolind.2022.109313.
- Shekhar, A., N. Buchmann, and M. Gharun. 2022. “How Well Do Recently Reconstructed Solar-Induced Fluorescence Datasets Model Gross Primary Productivity? Remote Sens.” Remote Sensing of Environment 283:113282. https://doi.org/10.1016/j.rse.2022.113282.
- Srinet, R., S. Nandy, T. Watham, H. Padalia, and N. R. Patel. 2022. “Coupling Earth Observation and Eddy Covariance Data in Light-Use Efficiency Based Model for Estimation of Forest Productivity.” Geocarto International 37 (25): 7716–7732. https://doi.org/10.1080/10106049.2021.1983032.
- Sun, Y., D. Peng, X. Guan, D. Chu, Y. Ma, and H. Shen. 2023. “Impacts of the Data Quality of Remote Sensing Vegetation Index on Gross Primary Productivity Estimation.” GIScience & Remote Sensing 60 (1): 2275421. https://doi.org/10.1080/15481603.2023.2275421.
- Tagliabue, G., C. Panigada, B. Dechant, F. Baret, S. Cogliati, R. Colombo, M. Migliavacca, et al. 2019. “Exploring the Spatial Relationship Between Airborne-Derived Red and Far-Red Sun-Induced Fluorescence and Process-Based GPP Estimates in a Forest Ecosystem.” Remote Sensing of Environment 231:111272. https://doi.org/10.1016/j.rse.2019.111272.
- Tian, Y., Z. Wen, X. Zhang, M. Cheng, and M. Xu. 2022. “Exploring a Multisource-Data Framework for Assessing Ecological Environment Conditions in the Yellow River Basin, China.” Science of the Total Environment 848:157730. https://doi.org/10.1016/j.scitotenv.2022.157730.
- Wang, S., B. Fu, F. Wei, S. Piao, F. T. Maestre, L. Wang, W. Jiao, et al. 2023. “Drylands Contribute Disproportionately to Observed Global Productivity Increases.” Science Bulletin 68 (2): 224–232. https://doi.org/10.1016/j.scib.2023.01.014.
- Wang, A., A.-A. Kafy, Z. A. Rahaman, M. T. Rahman, A. A. Faisal, and F. Afroz. 2022. “Investigating Drivers Impacting Vegetation Carbon Sequestration Capacity on the Terrestrial Environment in 127 Chinese Cities.” Environmental and Sustainability Indicators 16:100213. https://doi.org/10.1016/j.indic.2022.100213.
- Wang, Z., S. Liu, Y.-P. Wang, R. Valbuena, Y. Wu, M. Kutia, Y. Zheng, et al. 2021. “Tighten the Bolts and Nuts on GPP Estimations from Sites to the Globe: An Assessment of Remote Sensing Based LUE Models and Supporting Data Fields.” Remote Sensing 13 (2): 168. https://doi.org/10.3390/rs13020168.
- Wang, M., S. Wang, J. Zhao, W. Ju, and Z. Hao. 2021. “Global Positive Gross Primary Productivity Extremes and Climate Contributions During 1982–2016.” Science of the Total Environment 774:145703. https://doi.org/10.1016/j.scitotenv.2021.145703.
- Wang, F., Q. Yu, S. Qiu, C. Xu, J. Ma, and H. Liu. 2023. “Study on the Relationship Between Topological Characteristics of Ecological Spatial Network and Soil Conservation Function in Southeastern Tibet, China.” Ecological Indicators 146:109791. https://doi.org/10.1016/j.ecolind.2022.109791.
- Wang, N., X. Zha, C. Huang, Y. Zhang, Y. Zhou, J. Pang, X. Rong, R. Shang, and J. Chai. 2023. “Age and Causes of the Yellow River Dissecting the Zoige Basin in the Eastern Tibetan Plateau, China.” Science of the Total Environment 857:159481. https://doi.org/10.1016/j.scitotenv.2022.159481.
- Wu, H., B. Hu, H. Han, X. Cheng, and F. Kang. 2022. “Network Analysis Reveals the Regulatory Effect of Mixed Stands on Ecosystem Structure and Functions in the Loess Plateau, China.” Science of the Total Environment 824:153588. https://doi.org/10.1016/j.scitotenv.2022.153588.
- Xu, W., J. Wang, M. Zhang, and S. Li. 2021. “Construction of landscape ecological network based on landscape ecological risk assessment in a large-scale opencast coal mine area.” Journal of Cleaner Production 286:125523. https://doi.org/10.1016/j.jclepro.2020.125523.
- Xu, C., Q. Yu, F. Wang, S. Qiu, M. Ai, and J. Zhao. 2023. “Identifying and Optimizing Ecological Spatial Patterns Based on the Bird Distribution in the Yellow River Basin, China.” Journal of Environmental Management 348:119293. https://doi.org/10.1016/j.jenvman.2023.119293.
- Xu, C., Q. Zhang, Q. Yu, J. Wang, F. Wang, S. Qiu, M. Ai, and J. Zhao. 2023. “Effects of Land Use/Cover Change on Carbon Storage Between 2000 and 2040 in the Yellow River Basin, China.” Ecological Indicators 151:110345. https://doi.org/10.1016/j.ecolind.2023.110345.
- Yang, Z., Q. Yu, Z. Yang, A. Peng, Y. Zeng, W. Liu, J. Zhao, and D. Yang. 2023. “Spatio-Temporal Dynamic Characteristics of Carbon Use Efficiency in a Virgin Forest Area of Southeast Tibet.” Remote Sensing 15 (9): 2382. https://doi.org/10.3390/rs15092382.
- Yang, J., C. Zeng, and Y. Cheng. 2020. “Spatial Influence of Ecological Networks on Land Use Intensity.” Science of the Total Environment 717:137151. https://doi.org/10.1016/j.scitotenv.2020.137151.
- Yang, H., X. Zhong, S. Deng, and H. Xu. 2021. “Assessment of the Impact of LUCC on NPP and Its Influencing Factors in the Yangtze River Basin, China.” Catena 206:105542. https://doi.org/10.1016/j.catena.2021.105542.
- Yin, L., E. Dai, D. Zheng, Y. Wang, L. Ma, and M. Tong. 2020. “What Drives the Vegetation Dynamics in the Hengduan Mountain Region, Southwest China: Climate Change or Human Activity?” Ecological Indicators 112:106013. https://doi.org/10.1016/j.ecolind.2019.106013.
- Yohannes, H., T. Soromessa, M. Argaw, and A. Dewan. 2021. “Spatio-Temporal Changes in Habitat Quality and Linkage with Landscape Characteristics in the Beressa Watershed, Blue Nile Basin of Ethiopian Highlands.” Journal of Environmental Management 281:111885. https://doi.org/10.1016/j.jenvman.2020.111885.
- Zeng, Y., Q. Yu, X. Wang, J. Ma, C. Xu, S. Qiu, W. Liu, and F. Wang. 2023. “Research on the Relationship Between the Structure of Forest and Grass Ecological Spaces and Ecological Service Capacity: A Case Study of the Wuding River Basin.” Remote Sensing 15 (9): 2456. https://doi.org/10.3390/rs15092456.
- Zhang, Y., D. Kong, R. Gan, F. H. S. Chiew, T. R. McVicar, Q. Zhang, and Y. Yang. 2019. “Coupled Estimation of 500 M and 8-Day Resolution Global Evapotranspiration and Gross Primary Production in 2002–2017.” Remote Sensing of Environment 222:165–182. https://doi.org/10.1016/j.rse.2018.12.031.
- Zhang, H., S. Lin, Q. Yu, G. Gao, C. Xu, and H. Huang. 2023. “A Novel Forest EcoSpatial Network for Carbon Stocking Using Complex Network Theory in the Yellow River Basin.” Remote Sensing 15 (10): 2612. https://doi.org/10.3390/rs15102612.
- Zhou, Z., X. Sun, X. Zhang, and Y. Wang. 2022. “Inter-Regional Ecological Compensation in the Yellow River Basin Based on the Value of Ecosystem Services.” Journal of Environmental Management 322:116073. https://doi.org/10.1016/j.jenvman.2022.116073.