
 ?Mathematical formulae have been encoded as MathML and are displayed in this HTML version using MathJax in order to improve their display. Uncheck the box to turn MathJax off. This feature requires Javascript. Click on a formula to zoom.
ABSTRACT
Industrial land status, encompassing quantity, distribution and efficiency, is pivotal in urban planning and sustainable development. However, obtaining detailed and up-to-date industrial land maps poses a significant challenge in many developing countries due to rapid urban expansion. Furthermore, the identification and efficiency assessment of industrial land at the parcel scale are rarely undertaken. To address these challenges, our study proposes an innovative approach to map industrial land, categorize its types and assess its efficiency at the parcel scale. We select Shenzhen, one of China’s largest industrial cities, as a case study to demonstrate the effectiveness of our method. Our results unveil several key findings: (1) Shenzhen’s urban area was meticulously segmented into 15,591 multi-size socio-economic parcels, of which 5,738 were identified as industrial parcels (IPs); (2) IPs were further categorized into three distinct types: office industrial parcels at 69.47%, manufacturing industrial parcels at (6.08%) and comprehensive industrial parcels at 24.45%; (3) Their efficiency was classified into four levels: low (20.30%), middle (35.73%), fine (35.97%) and high (8.00%). Efficient IPs were predominately concentrated in the southwest, whereas other IPs clustered in the northwest. Our findings can provide valuable insights into industrial land identification, classification and efficiency evaluation at parcel scale.
1. Introduction
Industrial land, as a crucial carrier of industrial production activities, represents the fundamental input element for fostering industrial development (W. Chen et al. Citation2020), exerting a substantial influence on the resilience and spatial dimensions of long-term industrial growth. Since the reform and opening-up in 1978, China has accelerated its integration into the global development framework and become a world factory (Liang et al. Citation2021). This rapid industrialization has necessitated a substantial supply of industrial land to sustain further industrial advancement (Wu et al. Citation2014). China’s industrial land area is 11,336.75 km2, accounting for nearly 20% of the urban built-up areas in 2021. In comparison, the proportion of industrial land in most developed countries is less than 10%, but industrial land efficiency is much higher than that of China. Despite China’s industrial sector contributing significantly to the GDP, there has been a marginal annual decrease of 0.43% in the industrial added value’s contribution to the GDP from 1978 to 2021 (National Bureau of Statistics of China Citation2022). The rapid expansion coupled with low-density development of industrial land has led to the problems of idleness, vacancy, inefficiency, and pollution (Ma et al. Citation2020). Therefore, as China transitions toward high-quality development amid the increasing scarcity of land resources, there is an urgent need for precise industrial land mapping and efficiency assessment at the parcel level. Such efforts are crucial both academically and in policy-making contexts, with the accurate identification of industrial land at the parcel scale being a fundamental step toward assessing its efficiency.
In the realm of urban land use mapping, the utilization of satellite and airborne remote sensing technologies has revolutionized our capacity to map the distribution and functions of urban land use at fine-grained level (Chen, Xu, and Gong Citation2021). These technologies provide detailed spatial and continuous temporal information, enabling precise analysis of urban landscapes (Du et al. Citation2021). Notably, machine learning and deep learning techniques like convolutional neural networks (CNNs), have significantly advanced the classification of spectral, textural, and geometrical features across various spatial scales (Du et al. Citation2021). However, a notable limitation in current remote sensing approaches is their primary focus on physical attributes like spectrum, texture, geometry (Fassnacht et al. Citation2016). While these aspects are essential for land use mapping, they omit a critical component: social attribute information. Relying solely on these physical features can hinder accurate assessments of real-time production activities or industrial land reclassification. The advent of open social data, such as Open Street Map (OSM), points of interest (POIs) and Tencent location-based service (LBS), enables us to quantify human activities and gain deeper insights into urban structure (Chen, Xu, and Gong Citation2021; Gong et al. Citation2020). Nevertheless, relying exclusively on social media big data is impractical due to challenges such as incomplete information and concerns regarding data quality and reliability (J. Liu et al. Citation2016). By integrating social insights with remotely sensed data, we can unlock the potential for a more precise characterization of urban land patterns (J. Liu, Cheng, and Zhang Citation2017). Therefore, our research aims to explore the combined utilization of multi-sized parcels generated from OSM, functional attributes of industrial POIs, and the distinct spectral and structural features of factory rooftops in remote sensing images. A key contribution of this study is to assess the effectiveness of integrating multiple data sources for identifying the spatial distribution and functional types of industrial land.
Addressing industrial land efficiency is pivotal in tackling urban sprawl and promoting sustainable urban development (Tu, Yu, and Ruan Citation2014). In previous studies, researchers have employed various methods, such as Principal Component Analysis (F. Deng et al. Citation2020), Data Envelopment Analysis (L. Zhang, Zhao, and Zha Citation2021), and Stochastic Frontier Approach (Mardani et al. Citation2017). However, it’s important to note that these methods sometimes compress the richness of the original data, potentially leading to an incomplete reflection of the actual industrial context (L. Zhang, Zhao, and Zha Citation2021). In response to these limitations, the entropy-weight Technique for Order of Preference by Similarity to Ideal Solution (TOPSIS) has been introduced. This approach is designed to provide a multidimensional assessment, objectively weigh various factors, minimize subjectivity, facilitate informed decision-making, and generate more robust results (Lu et al. Citation2011). Recent research has expanded its focus, beyond economic efficiency, considering environmental efficiency (Woo et al. Citation2015), green efficiency (J. Zhang et al. Citation2018) and industrial structure (Xiong, Ma, and Ji Citation2019). This holistic view incorporates considerations of negative outputs such as pollutant emissions and energy consumption (W. Chen et al. Citation2020; Xiong, Ma, and Ji Citation2019; J. Zhang et al. Citation2018), alongside traditional indicators like land use and economic output. Despite these methodological advancements, much of the existing studies has been conducted at relatively coarse scales, such as provinces (S. Liu et al. Citation2021), economic regions (Z.-H. Wang et al. Citation2012), municipalities (W. Zhang et al. Citation2022), or industrial park levels (Fan et al. Citation2017), with a notable gap in parcel-level analysis. Nonetheless, it’s crucial to acknowledge the inherent variations in resource endowments, industrial structure, and development levels within Chinese cities. These disparities inevitably result in spatial differences in industrial land efficiency. Therefore, conducting research at the parcel level becomes imperative for gaining a fine-grained understanding of urban growth and sustainable development.
In summary, existing research on industrial land identification, classification and efficiency assessment exhibits four noteworthy limitations. First, while classification strategies are crucial for urban land use mapping (Chen, Xu, and Gong Citation2021), prior research has predominantly focused on spectral characteristics to determine land use types, often neglecting features specific to industrial areas. The potential for enhancing accuracy through the integration of remote sensing indices with social attributes for industrial land remains largely unexplored. Second, there is a noticeable lack of detailed reclassification methods that consider both spectral characteristics and social attributes. Third, the majority of studies concentrate on analysis at the administrative district level, overlooking the critical insights that can be gained from finer, parcel-scale analysis (S. Liu et al. Citation2021; Xiong, Ma, and Ji Citation2019). Lastly, there is a scarcity of studies tracking the chronological development of IPs across varying efficiency levels, leaving a gap in our understanding of industrial land dynamics over time.
This study sets out to address these gaps through a comprehensive investigation of industrial land in Shenzhen, aiming to provide valuable insights into urban land classification and sustainable industrial development. Shenzhen serves as an ideal study area due to its rapid industrial land expansion, significant industrial footprint, high population density, limited geographical space, and pressing population-resource challenges.
To bridge the current research gaps, we have established five key objectives: 1) refine the identification of IPs within the broader urban landscape through the development of the Industrial Parcel Extraction Index (); 2) Develop comprehensive criteria and benchmarks for categorizing IPs into three distinct types based on physical attributes and production type; 3) analyze the spatial distribution patterns of various IP types to illuminate developmental, accessibility, and economic influences; 4) devise a comprehensive suite of efficiency indicators encompassing economic productivity, social impact, and environmental effect; and 5) Investigate the temporal and spatial dynamics of IPs with varying efficiency levels to uncover underlying trends and driving factors. By meeting these objectives, our study aims to facilitate the transition to a more localized, parcel-based approach in industrial land classification and efficiency evaluation.
2. Study area and research data
2.1 Study area
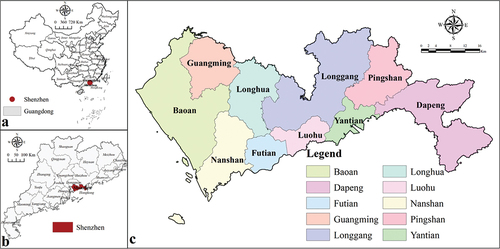
Located in southern Guangdong Province, adjacent to Hong Kong, Shenzhen covers an area of 1997.47 km2, with coordinates ranging from 22°27′-22°52′N and 113°46′-114°37′E, as depicted in . Since the mid-1980s, Shenzhen has rapidly transformed from its rural origins into a pivotal industrial city, gaining recognition as a significant special economic zone in China (Zacharias and Tang Citation2010). In 2022, it achieved a remarkable industrial milestone with its added industrial value reaching 1.13 trillion-yuan, accounting for 33.80% of its total GDP, securing a national leadership position (National Bureau of Statistics of China Citation2022). The prime driver of Shenzhen’s socioeconomic progress has consistently been its industrial sector, significantly impacting land use. Statistical data reveals the rapid expansion, from under 3 km2 in 1985 to a peak of 316 km2 in 2015 (Ministry of Housing and Urban-Rural Development of the People’s Republic of China Citation2020), with an impressive annual growth rate of 10.43 km2. By 2021, industrial land constituted 13.76% of Shenzhen’s urban area, ranking it second among prefecture-level cities nationwide, surpassed only by Dongguan. However, Shenzhen’s population density, highlighted by the Seventh National Population Census data, stands at 8791 people per km2, surpassing those of renowned international metropolises like Tokyo (6027) and London (5197) (Qian Citation2022). This density not only underscores the city’s success but also magnifies the strain on its resources and land use. Compounding this challenge is Shenzhen’s commitment to ecological conservation: over half of the land area has been designated as ecologically protected, prohibiting further development (Hong et al. Citation2016). This policy, while essential for sustainable urban planning, further limits the available land for industrial expansion. The juxtaposition of Shenzhen’s high population density against its ecological protection efforts brings into sharp focus the critical issue of optimizing industrial land use. Efficiently utilizing industrial parcels becomes imperative to balance industrial development with environmental sustainability and to mitigate the population-resource paradox. This unique context underscores the importance of our study’s focus on industrial parcel identification, type classification, and efficiency evaluation, which is crucial for navigating the constraints imposed by Shenzhen’s dense urban environment and its commitment to ecological preservation.
Figure 1. Geographical location and map of Shenzhen in Guangdong Province, South China; (a) Location of Shenzhen in China; (b) Location of Shenzhen in Guangdong province; (c) Districts in Shenzhen.
2.2 Research data
In this study, seven types of data were utilized to generate urban parcels, identify IPs from urban parcels and evaluate the efficiency of IPs, as outlined in . The retrieval and preprocessing of these datasets were described below.
OSM data. OSM has emerged as a high-quality, globally comprehensive map due to its open-editing nature and free accessibility. It’s been widely used in urban studies for tasks such as functional zone identification and economic efficiency evaluation (Brovelli et al. Citation2017; X. Huang and Wang Citation2019). For our purposes, we sourced OSM data from Geofabrik. We applied this data to segment urban areas into multi-size parcels and to estimate traffic accessibility, leveraging its detailed road network information.
POIs data. POIs data, with its fine spatial resolution and detailed classification, surpasses traditional land use data in identifying urban functions, assessing vibrancy, and evaluating efficiency (K. Liu et al. Citation2020). We acquired POIs data for Shenzhen from Amap, a leading mapping, navigation, and location-based services platform in China. Specifically, we collected 84,364 POIs records related to industrial enterprises and their associated support facilities of Shenzhen for the year 2020, utilizing Amap’s API through the DataMap Excel plugin, as detailed in .
Landsat 8 imagery. We leveraged Landsat 8 imagery for its capability to extract color steel tiles (CSTs), a roofing material prevalent in industrial settings (P. Li et al. Citation2017). This imagery features a panchromatic band with a 15-meter spatial resolution and eight multi-spectral bands with a 30-meter resolution, spanning a 185 km swath. For comprehensive coverage of Shenzhen, we meticulously selected two cloudless images taken on 6 January 2020, and 18 February 2020.
LJ1-01 Nightlight data. This dataset, known for its superior spatial resolution over DMSP/OLS and NPP-VIIRS nighttime light data Citation2019, providing images with a 130-meter resolution. We obtained the data from the high fraction tube platform, ensuring that selected images provided complete coverage of Shenzhen with less than 10% cloud cover.
WorldPop Mainland China Dataset. The WorldPop dataset offers the finest spatial resolution (100 meters) for China, making it invaluable for population studies. We utilized the 2020 version of this gridded population dataset, accessible through the WorldPop project, employing the dasymetric mapping method with random forest for population distribution.
Air Pollutants data. For a comprehensive analysis of air quality, we used the ChinaHighPM2.5 dataset, featuring high-resolution (1 km) ground-level air pollutants data for 2020 (Wei et al. Citation2021). The datasets were generated through artificial intelligence techniques that consider the spatiotemporal variations in air quality. You can access the datasets at https://zenodo.org/record/6398971.
Statistical Data. Key indicators like industrial water and energy consumption per GDP unit were sourced from the Shenzhen Municipal Bureau of Statistics’ 2021 report. This data aids in evaluating the resource and environmental consumption intensity associated with industrial land use.
CNLUCC. The national-scale, multi-temporal CNLUCC database offers a detailed view of land use/cover changes, derived from Landsat imagery. It utilizes a dual-level classification system to categorize land into six major categories and 25 sub-types. For our study, we selected datasets with a 30-meter resolution covering key periods (1980, 1990, 1995, 2000, 2005, 2010, 2015, and 2020), focusing on their application to urban and industrial land analysis.
Table 1. Datasets used in this study.
Table 2. Descriptions and counts of POIs categories for Shenzhen, 2020.
3. Methodology
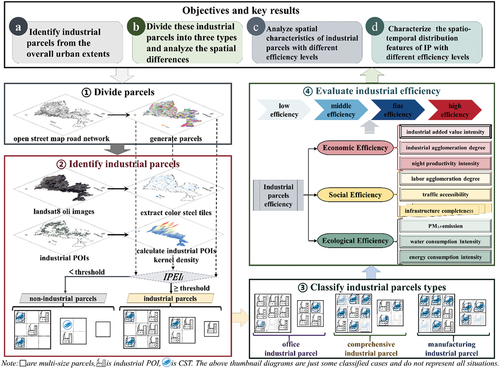
TIn this study, we delineate our main workflow as illustrated in . Initially, multi-size parcels are generated as the fundamental analytical units based on the OSM data, following the method of Liu and Long (Citation2016) in Section 3.1. Subsequently, we introduce the industrial parcel extraction index in Section 3.2 to distinguish IPs from all segmented urban parcels. Following this distinction, we further categorize the IPs into three distinct categories by assessing the proportion of industrial enterprise density and CSTs coverage within each parcel (Section 3.3). Next, in Section 3.4, we apply preprocessing techniques to nine selected indexes to accurately represent economic, social and ecological efficiency. Finally, we evaluate industrial land efficiency at parcel scale, which reveals different spatial patterns of IPs with four efficiency levels. For the visualization of our findings, all maps are produced using ArcGIS10.8 (ESRI, Redlands, CA, USA), while other analysis graphics, such as alluvial map, are generated using Origin 2022 (Northampton, MA, USA).
Figure 2. The framework for identifying industrial parcels and evaluating their efficiencies.
3.1 Delineating parcel boundaries
The working definition of a parcel in our framework is a continuously built-up area bounded by roads. Identifying land parcels and delineating road space are therefore dual problems. In other words, our approach begins with the delineation of road space, and individual parcels are formed as polygons bounded by roads. Our approach follows the method proposed by Liu et al. (Citation2016), and the delineation of road space and parcels is performed as follows:
3.1.1 Road network construction and topology inspection
Our first step involves constructing a comprehensive road network using all categories of roads available from OSM data, with the following steps to ensure topological accuracy:
Extend isolated roads by 100 meters to facilitate connections with adjacent road elements.
Trim unconnected or standalone roads to streamline the network.
Eliminate overlapping roads to resolve redundancies.
3.1.2 Road categorization and buffer creation
The road network is then categorized into three distinct levels:
First level: Motorways and trunk roads.
Second level: Primary and secondary roads.
Third level: Tertiary and track roads.
For each level, buffers are applied with specific widths 50 m, 40 m, and 30 m, thereby defining the road network space around these roads.
3.1.3 Extraction of independent land units
By subtracting the defined road network space from the overall study area, we isolate independent land units. This subtraction not only yields multi-sized socio-economic parcels but also helps in omitting smaller, fragmented patches, thereby streamlining parcel identification.
To circumvent topological inaccuracies prevalent in OSM data, we employ experience-based parameter settings, a practice endorsed by Liu et al. (Citation2016) for parcel subdivision. These parameters, refined through empirical application, are essential for enhancing the reliability of OSM data processing. All mapping and analytical operations are conducted using ArcGIS 10.8 software.
3.2 Identifying industrial parcels
To distinguish IPs from other urban parcel types, such as residential, commercial, or cultural, two crucial factors must be considered: the concentration of industrial POIs and the presence of CSTs, which are indicative of industrial activity. Addressing this distinction involves overcoming five technical challenges: (1) extracting CSTs, (2) avoiding potential coordinates deviation of industrial POIs in space, (3) integrating the segmented urban parcels, CSTs and industrial kernel density, (4) determining the optimal classification threshold, and (5) validating the identification results.
To tackle these challenges, we have implemented five solutions, which are outlined below:
3.2.1 Extracting CSTs
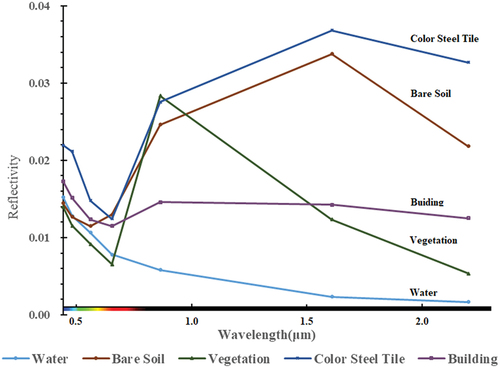
CSTs provide essential insights into the physical attributes of IPs. To extract CSTs, we analyze the reflectance values across blue, green, red, and near-infrared spectral bands, which exhibit unique signatures distinct from other terrestrial objects (refer to ).
Figure 3. Spectral reflectance curves of different surface objects.
We employ a specific formula, , to suppress the spectral features associated with water bodies and other ground objects that are not excluded from consideration. For the denominator, we determine that using
provides greater stability.
By combining these two components, we derive the CST extraction formula:
where, RB, RG, RR and RNIR correspond the reflectance value in the red, green, blue and near-infrared bands, respectively; CSTI denotes the color steel tile index.
Applying this formula reveals a distinct breaking point in the pixel brightness distribution curve, marking the optimal threshold for distinguishing CSTs from other objects. Pixels falling to the right of this threshold are identified as CSTs, offering a higher precision in CST extraction and ensuring a comprehensive profile of industrial areas.
3.2.2 Kernel Density Estimation (KDE)
KDE is a widely-used approach for analyzing the spatial properties of point events, such as industrial POIs, and quantifying their distribution across urban landscapes. KDE effectively transforms discrete data points into a continuous density surface, thereby revealing the spatial decay impact of urban facilities and enriching the data’s interpretive value (Yu, Ai, and Shao Citation2015). We select KDE to evaluate the industrial attributes within each parcel, aiming for a nuanced representation that captures spatial decay patterns. The specific formula and calculation details utilized for KDE in our study are provided in Supplementary Information 1.1.
3.2.3 Calculating the for  each parcel
To further refine our analysis, we introduce the , a metric devised to identify parcels that predominantly feature industrial activities. This index serves a dual purpose: it quantitatively characterizes the proportions of industrial POIs and the image features of CSTs that distinguished IPs from other parcels.
The formula for calculating was as follows:
In this equation, signifies the index for evaluating industrial prominence within a given parcel i, integrating both POIs and CSTs data; CSTAi represents the total area covered by CSTs within parcel i;
and
denote the maximum and minimum CST areas observed across all parcels, respectively;
is the mean kernel density of industrial POIs within parcel i;
and
are the highest and lowest kernel density values of industrial POIs across all parcels, respectively.
The formula integrates the spatial distribution of industrial POIs and the physical attributes of CSTs, facilitating the identification of parcels with significant industrial activity. The combination of these factors into the provides a robust quantitative measure for distinguishing industrial parcels. It enables a comprehensive assessment of parcels by considering both the physical infrastructure and the spatial density of industrial activities. This nuanced approach aids in pinpointing industrial parcels within the urban mosaic, paving the way for a deeper exploration of industrial types and their spatial characteristics, as discussed in Section 3.3.
3.2.4 Determining the threshold with the F1-score
In this research, our classification methodology’s efficacy is evaluated using a multifaceted set of metrics that include accuracy, precision, recall, and notably, the F1-score. The F1-score is highly regarded in land classification studies for its ability to balance precision and recall effectively. This balance offers a comprehensive assessment of classification performance, adeptly navigating the trade-off between false positives and false negatives (H. Huang et al. Citation2015). For an in-depth discussion on these evaluation metrics and their significance, we direct readers to Supplementary Information 1.2.
3.2.5 Accuracy evaluation
To gauge the accuracy and reliability of our model, we conduct a comparative analysis using three distinct benchmarks: Amap, GF-2 Imagery, and the Shenzhen Detailed Planning Map (2020–2035). We also utilize the essential urban land use categories in China (EULUC-China) data from 2018, as mapped by Gong et al. (Citation2020). These benchmarks offer diverse data sources, each with unique attributes, collectively contributing to a comprehensive evaluation of the model’s performance across different data types.
First and foremost, Amap provides real-time, user-generated data, allowing us to assess how well our model aligns with practical applications. This dynamic data source yields valuable insights into the model’s practical utility. Moving on to GF-2 Imagery, this benchmark offers high-resolution satellite imagery, which is crucial for accurately identifying intricate details within IPs. Leveraging advanced imagery enhances our ability to detect even the smallest ground-level features. The Shenzhen Detailed Planning Map (2020–2035) is an officially endorsed dataset supported by governmental authorities. It lends credibility to the data and serves as a reliable point of reference for validation purposes. Its meticulous and up-to-date information reinforces the reliability of our evaluation. EULUC-China utilizes a combination of 10-meter satellite images, OpenStreetMap data, nighttime lights, POI data, and Tencent social big data, all from 2018, as input features. Training and validation samples are collected through a crowdsourcing approach involving 21 research groups in 27 selected representative cities. For the entire country of China, a total of 440,798 parcels are mapped using the two-level EULUC classification system. Statistically, within the 166,338 square kilometers of impervious area in China in 2018, the city-level overall accuracy varies from 40.4% to 82.9%. This study has been cited 236 times, attaining broad recognition within the realm of urban cartography. Moreover, both this investigation and our own research employ datasets comprising OSM, POIs, and remote sensing data as inputs, rendering the results amenable to comparative analysis.
In conclusion, the scientificity, accuracy, and advantages of our industrial land identification model are rigorously verified through a multifaceted approach using these four distinct benchmarks. Each benchmark contributes unique insights and strengths to our evaluation, collectively showcasing the model’s reliability and applicability in real-world scenarios. For detailed insights into our evaluation methodology, please see Supplementary information 1.3.
3.3 Classifying industrial parcel types
In their seminal work, Chen et al. (Citation2023) articulate a definition of industrial land that encompasses sites dedicated to manufacturing, warehousing, logistics, research, and related functions. This expansive definition not only sets the stage for a robust framework to categorize IPs but also facilitates the analysis of the spatial structure of the industrial landscapes, allowing for nuanced pattern analysis across various IP types (Guo, Peng, and Zhou Citation2019).
To refine the classification of IPs in our analysis further, we introduce two pivotal indicators: the proportion of CSTs and the value. These indicators are instrumental in shedding light on the infrastructure’s nature and the broader industrial milieu of each parcel. The CSTs proportion serves as an indicator of the extent to which CSTs – materials frequently employed in industrial construction – are present, offering insights into the parcel’s manufacturing infrastructure. Meanwhile, the
amalgamates the presence of CSTs with the density of industrial POIs, furnishing a well-rounded perspective on a parcel’s industrial essence and its context.
For operationalizing these insights, we establish specific threshold values for both CSTs proportion and , based on statistical analysis. We opt for thresholds at half of the mean and the mean itself, yielding three distinct intervals for each parameter and resulting in nine unique combinations. These combinations facilitate the segregation of IPs into three distinct classifications: office industrial parcels (OIPs), manufacturing industrial parcels (MIPs), and comprehensive industrial parcels (CIPs). For an illustrative breakdown of this classification scheme, in our study serves as a visual guide. Employing these categorical distinctions, as illustrated in , allows for a detailed and precise mapping of the spatial distribution and characteristics of diverse IPs. This methodology not only enhances our understanding of the industrial landscape but also enables a granular differentiation among various types of industrial properties.
Figure 4. The subdivision of three types of industrial parcels.
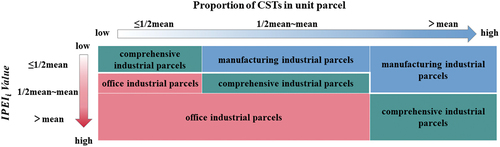
Table 3. The typical features and image references of three types of industrial parcels.
3.4 Evaluating industrial efficiency
In this study, we employ the entropy-weighted TOPSIS to assess industrial efficiency using a carefully selected set of nine indicators. The methodological approach encompasses several key steps: data standardization, normalization of the decision matrix, determination of ideal positive and negative ideal values, calculation of separation measures, and identification of the relative closeness to the ideal solution (Alao, Popoola, and Ayodele Citation2021). For an in-depth exploration of the TOPSIS method and associated formulas, we invite readers to refer to Supplementary Information 1.4.
Our choice of these nine indicators aims to provide a comprehensive and multidimensional assessment of industrial efficiency, including economic, social, and ecological dimensions. Specifically, economic efficiency is quantified using Industrial Added Value Intensity (IAVI), Industrial Agglomeration Degree (IAD), and Night Productivity Intensity (NPI). Social efficiency is assessed through Labor Agglomeration Degree (LAD), Traffic Accessibility (TA), and Supporting Facilities Completeness (SFC). Meanwhile, ecological efficiency is gauged using PM2.5 Emissions (PME), Industrial Water Consumption per Unit of GDP (IWCPUG), and Industrial Energy Consumption per Unit of GDP (IECPUG). Detailed descriptions of these indicators are provided in .
Each set of indicators contributes uniquely to our comprehensive understanding of industrial efficiency. Economic and social indicators are considered positive, enhancing efficiency, whereas ecological indicators are treated as negative, with their increase indicating a decrease in overall efficiency (Al-Tuwaijri, Christensen, and Hughes Citation2004). This distinction is crucial for interpreting the results accurately.
Our evaluation process, meticulously carried out in ArcGIS, involves calculating, standardizing, and weighting the indicator values for all analyzed IPs. This groundwork enables us to classify IPs into four distinct efficiency levels, adopting a classification system that merges analytical depth with ease of understanding for policymakers. This tiered system does not only simplify the intricate analysis into actionable insights but also upholds the integrity of the TOPSIS principles, ensuring our findings align with the study’s objectives and provide a solid basis for informed decision-making.
Table 4. The evaluation index system of industrial efficiency.
4. Results
4.1 Spatial distribution of industrial parcels
In this study, a total of 15,591 parcels are generated within the urban extents of Shenzhen. Among these, 5,738 parcels are identified as IPs. The identification process involves a detailed comparative analysis utilizing high-resolution imagery, Amap, the Shenzhen Detailed Planning Map (Public Edition) and the EULUC-China dataset. This methodical approach yields an overall accuracy rate of 78.6% in pinpointing industrial land, underscoring the reliability of our findings. For those interested in the nuances of our validation process, we delve deeper into the methodologies in Supplementary Information 3.7.
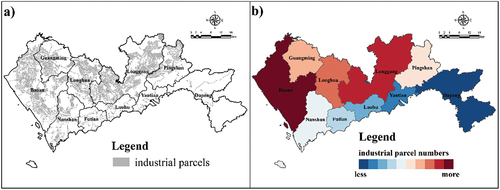
Our analysis reveals that IPs collectively cover an area of 551.03 km2, accounting for approximately 27.59% of Shenzhen’s total urban land area. A significant observation from our study was the concentration of IPs primarily in the northwest regions of the city, areas characterized by flat terrain and favorable policies, as depicted in . However, this concentration is not uniformly distributed across Shenzhen’s 10 districts. Instead, we observe a pronounced clustering effect, with the districts of Longgang, Baoan, Longhua, and Guangming alone hosting nearly 80% of the total IPs. This pattern of distribution, aptly described as “West Dense, East Sparse,” highlights the heterogeneous spatial distribution of industrial activities across Shenzhen and points to the strategic alignment of industrial development with urban planning and policy incentives in the city.
Figure 5. The spatial distribution of industrial parcels in Shenzhen. (a). Industrial parcels at parcel scale; (b). Industrial parcel numbers with districts as the statistical unit.
4.2 Spatial differences of industrial parcels of three different types
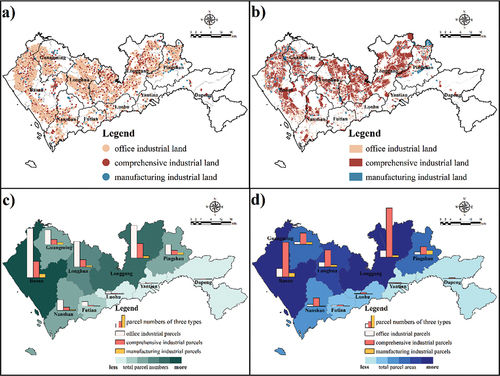
The categorization of IPs in Shenzhen reveals intriguing patterns. OIPs constitute 69.47% of the total number of parcels, while MIPs and CIPs make up 24.45% and 6.08%, respectively. In terms of parcel areas, MIPs dominate with 74.98%, followed by OIPs at 16.34%, and CIPs at 8.68%. This distribution highlights a significant trend: OIPs were the most numerous, as highlighted in , yet MIPs occupy the largest area within the urban fabric, as demonstrated in .
When delving into the specifics of IPs, CIPs emerge as particularly dense with industrial POIs and CSTs, indicating a high level of industrial activity. Conversely, OIPs are marked by a lower presence of CSTs, pointing to their office-centric nature. MIPs, while expansive, host a smaller proportion of industrial POIs compared to the other categories. For a detailed breakdown of these categories and their characteristics, we direct readers to Supplementary Table S2. Additionally, Supplementary Fig1 offers a visual representation of CSTs distribution across the different IP types, providing an intuitive understanding of their physical makeup.
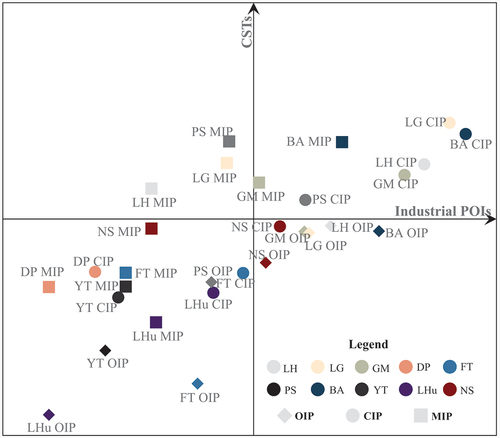
To further dissect these distinctions, a detailed four-quadrant map () categorizes the IPs based on their characteristics. The first quadrant encompasses the majority (over 70%) of CIPs, highlighting areas with significant accumulations of comprehensive industrial activities. The second quadrant highlights areas with a high concentration of MIPs, particularly noticeable in Pingshan, Longgang, and Longhua. These areas are characterized by substantial CST density alongside a lower density of industrial POIs. The third quadrant includes smaller-scale IPs, accounting for roughly 43.33% of the total IPs. This quadrant is not confined to specific boroughs or industrial categories, indicating a more dispersed pattern of industrial parcels. Finally, the fourth quadrant features districts such as Baoan, Longhua, Longgang, and Guangming, which are abundant in OIPs but have fewer CSTs.
Figure 6. The Four-quadrant evaluation of different types of industrial parcels. (OIPs, CIPs and MIPs represent office, comprehensive and manufacturing IPs, respectively. LH, LG, GM, DP, FT, PS, BA, YT, LHu and NS represent Longhua district, Longgang district, Guangming district, Dapeng district, Futian district, Pingshan district, Baoan district, Yantian district, Longhu district, and Nanshan district).
At the district level, the distribution of IPs in Shenzhen exhibits significant variations among different types. Most OIPs are concentrated in districts such as Baoan, Longgang, Longhua, and Guangming, representing 32.46%, 21.53%, 16.91%, and 9.78% respectively, as indicated in , in terms of parcel numbers, and 29.33%, 23.29%, 15.78%, and 8.16% respectively, as shown in , in terms of parcel areas. The spatial distribution of CIPs closely mirrors that of OIPs, with Longgang, Baoan, Longhua, and Guangming hosting the majority, accounting for 37.07%, 26.13%, 12.70%, and 7.89% respectively. Despite being the smallest in scale among the three types, MIPs are still concentrated in specific districts, including Pingshan, Baoan, Guangming, and Longhua, which collectively represent 26.71%, 24.56%, 15.02%, and 13.47% of the total MIPs, respectively.
Figure 7. The spatial distribution of three different types of industrial parcels. (a) shown as point, (b) shown as parcel, (c) shown as district (parcel numbers), and (d) shown as district (parcel areas).
4.3 Industrial efficiency evaluation results
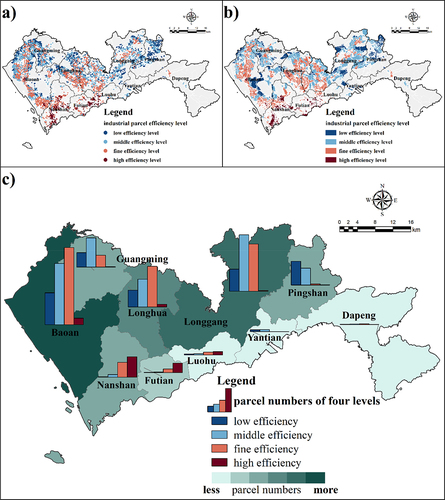
An analysis of industrial efficiency in Shenzhen unveils a distinct spatial pattern, with higher efficiency observed in the southern region and lower efficiency in the northern region. Efficiency scores range from 0.05 to 0.89. To quantify this, we find that IPs are categorized as having low (20.30%), middle (35.73%), fine (35.97%), or high (8.00%) efficiency (). These efficiency levels correspondingly covered 19.63%, 39.03%, 36.18%, and 5.17% of the total area (). These findings suggest that improving industrial efficiency has the potential to save approximately 323.51 km2 of urban space.
District-level analysis further illuminates the spatial disparities in industrial efficiency (). Nanshan stands out with the highest proportion of high-efficiency IPs at 49.44%, followed by Futian and Baoan with 20.22% and 13.10% respectively. Conversely, Baoan, Longgang, and Pingshan districts are noted for their higher shares of low-efficiency IPs, constituting 32.76%, 30.31%, and 20.07% of their industrial areas. Interestingly, IPs with fine and moderate levels of efficiency were predominantly situated in the northwestern and north-central parts of Shenzhen, especially within Longgang, Baoan, Guangming, and Pingshan.
Figure 8. Industrial parcels efficiency evaluation and cluster analysis results. (a) Shown as point, (b) Shown as parcel, (c) Shown as district (parcel number).
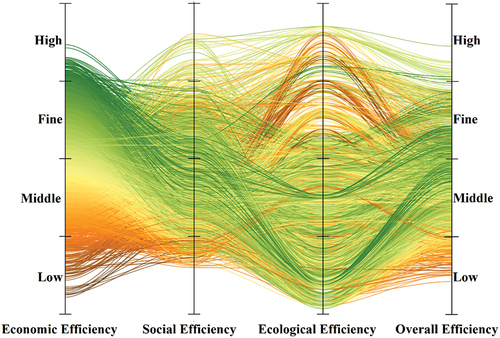
reveals the variability of efficiency across three key subsystems within Shenzhen’s industrial landscape. For economic efficiency, the classification of IPs results in the following distributions: 10.18% low, 24.87% middle, 37.96% fine, and 26.99% high. Interestingly, a substantial portion of IPs classified as middle (42.8%), fine (61.20%), and high (90.10%) in economic efficiency concurrently experience a decline in social efficiency levels. From a social efficiency standpoint, IPs are distributed as 26.87% low, 37.10% middle, 27.27% fine, and 8.76% high. Notably, about 34.87% of IPs show a transition from a lower level of social efficiency to a higher level of ecological efficiency, underscoring the dynamic nature of efficiency metrics across different dimensions. Regarding ecological efficiency, IPs are categorized as 30.08% low, 29.68% middle, 33.83% fine, and 6.41% high. This categorization underscores the varied environmental performance among IPs.
Figure 9. Evolution characteristics of four efficiency types among four levels.
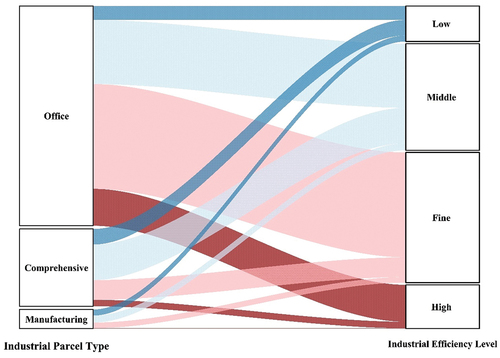
also unveils marked differences in the efficiency profiles among various IP types. Specifically, MIPs demonstrate efficiency proportions of 31.69% low, 36.56% middle, 29.60% fine, and 2.15% high. CIPs show a different pattern, with 20.10% low, 46.07% middle, 25.46% fine, and 8.37% high efficiency. OIPs present yet another distribution, with 6.38% low, 29.16% middle, 47.68% fine, and 16.78% high efficiency.
Figure 10. The alluvial diagram of the efficiency hierarchy of various types of industrial parcels.
4.4 Temporal and spatial distribution of IP with different efficiencies
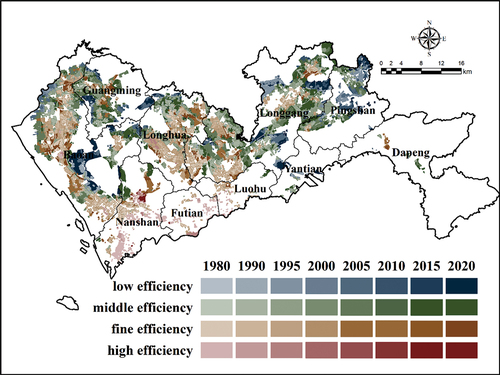
To provide a detailed understanding of the distribution changes of IPs in Shenzhen from 1980 to 2020, this study integrates IPs maps with the LUCC dataset. This integration facilitates a visual examination across different efficiency categories, detailed in and further quantified in Supplementary Table S3. Throughout the study period, while IPs consistently expanded, there was a noticeable trend toward a decreasing proportion of highly efficient IPs.
In 1980, the total area of IPs stood at 13.87 km2, signaling the nascent stage of Shenzhen’s industrial development. At this time, 44.48% of this area was deemed efficient, predominantly located in Nanshan and Futian. The decade from 1980 to 1990 witnessed IPs expanding by an average annual rate of 5.08 km2, primarily in the Futian, Longgang, and Luohu Districts, marking the emergence of parcels with fine efficiency. The expansion continued from 1990 to 1995, maintaining pace yet seeing a threefold increase in the overall rate of expansion, alongside ongoing efficiency improvements. Between 1995 and 2000, the expansion accelerated to 12.83 km2 per year, with Baoan making significant contributions to this growth. The period from 2000 to 2005 represented a peak in IPs expansion, averaging 35.41 km2 per year, uniformly distributed across all 10 districts of Shenzhen. However, post-2005, the expansion rates started to decline, averaging 9.87 km2, 4.25 km2, and 1.16 km2 annually up to 2020. Despite the slowdown, this latter period witnessed substantial conversions of non-industrial to industrial parcels, notably in Baoan and Longgang. Interestingly, the proportion of IPs across the four efficiency categories remained relatively stable in these newly developed industrial areas.
Figure 11. The establishment years of industrial parcels of four efficiency levels.
5. Discussion
Over the past four decades, the industrial sector has emerged as a pivotal engine for Shenzhen’s economic growth, significantly shaping the city’s urban pattern (Dou and Chen Citation2017). This study embarks on an analysis of industrial efficiency, leveraging the identification of IPs to provide a foundational reference for empirical efficiency evaluation research. By integrating multi-source spatial data, we accurately identify IPs and classify their types, laying the groundwork for a comprehensive efficiency assessment.
5.1 Reasons for the spatial and temporal differentiation of industrial efficiency
Industrial land efficiency in Shenzhen City has undergone significant temporal variations, primarily shaped by historical factors and evolving policy frameworks. This analysis outlines the key phases and their impacts on Shenzhen’s industrial land development:
5.1.1 Early Reform and Opening Up (1980–1995)
Capitalizing on its proximity to Hong Kong and its status as a Special Economic Zone (SEZ), Shenzhen attracted industries through a “front shop, back factory” model Citation2020. The early years saw rapid expansion of IPs fueled by land sales and leases under the “exchange land for market” strategy. By 1995, the number of IPs outside the SEZ surpassed those within, albeit with a lower industrial added value.
5.1.2 Economic Globalization and Challenges (1995–2005)
This period witnessed Shenzhen grappling with the dual forces of economic globalization and the return of Hong Kong and Macao. The era brought foreign investments and advanced technologies, spurring industrial upgrades and IP expansion, particularly in Baoan and Longgang (K. Liu et al. Citation2020). However, Shenzhen’s finite land resources were stretched thin, exacerbating disparities between the former SEZ and the rest of the city due to varying environmental regulations (O’Donnell, Wong, and Bach Citation2017; J. Zhang Citation2012).
5.1.3 Connotative Development Stage (2005–2015)
Focusing on enhancing industrial quality, Shenzhen aimed to foster high-tech industries based on core technological innovation. Divergent policies for the SEZ and areas outside it led to differences in IP management (J. Chen Citation2006), causing fragmentation in distribution and polarization in efficiency (Y. Deng, Fu, and Sun Citation2018; X. Liu et al. Citation2007). The expansion of the SEZ to include the entire city in 2010 aimed to mitigate these issues (National Assembly of the PRC Citation2010).
5.1.4 Sustaining Growth with Limitations (2015–2020)
Facing the challenge of limited land resources, Shenzhen strove to sustain growth while the expansion of IPs slowed. Efforts to enhance industrial added value included macro-policy adjustments, support for technological innovation, and infrastructure improvements (Lai, Chan, and Choy Citation2017; Pan and Du Citation2021), focusing on balanced citywide development.
In essence, the evolution of industrial land efficiency in Shenzhen reflects the interplay of historical factors and policy differences between the former SEZ and other areas. These elements have significantly influenced the industrial structure, accessibility, and public service provision, leading to the “West Dense, East Sparse” and “West Strong, East Weak” regional imbalances (Lai et al. Citation2020). Addressing these complex challenges is crucial for the sustainable growth of Shenzhen’s industrial sector.
5.2 Novelty of the proposed method
Our research methodology provides a comprehensive solution to the existing limitations in the identification, classification, and efficiency assessment of industrial land. By leveraging global accessible, open-source geospatial data resources, our approach is scalable for regional and national applications.
Initially, this study advances industrial land identification by integrating remote sensing indices with social media data, improving the delineation of industrial roof’s physical and functional attributes. Unlike prior studies that rely solely on POIs, which may lead to biased or inaccurate functional categorization (Qiao, Huang, and Tian Citation2019; Z. Wang et al. Citation2019; Xue, Xiao, and Li Citation2020), our method incorporates a data fusion approach that yields dual attributes, thereby increasing identification accuracy. Furthermore, by combining the CSTs proportion and the value within each parcel, we reclassify industrial land, achieving a more granular understanding of the internal features of IPs, an aspect not covered in previous research. Contrary to earlier industrial efficiency studies focused on administrative-scale analysis (Jiang Citation2021; S. Liu et al. Citation2021; Xia et al. Citation2020; L. Zhang, Zhao, and Zha Citation2021), our approach delves into finer parcel-scale analysis, crucial for precise industrial land monitoring and refined regulatory decisions. Lastly, IPs, categorized according to their efficiency levels, were overlaid with LUCC data spanning multiple years. This methodology enables the delineation of chronological distribution patterns of IPs across various efficiency categories, thereby elucidating efficiency trends and driving factors. Such an approach marks a pioneering attempt within the realm of industrial land utilization.
5.3 Limitations and prospects
Accurately and promptly identifying, classifying, and assessing the efficiency of IPs at a fine scale is crucial for effective urban land regulation and industrial development management. This precision empowers us to discern subtle changes, including the expansion and contraction of industrial land, variations in efficiency among different types of IPs, and spatial and temporal disparities across various efficiency classes.
However, it is imperative to acknowledge several limitations within our current methodology. Firstly, this research is constrained by its exclusive reliance on OSM data for parcel generation, potentially leading to inaccuracies or errors. The quality, accuracy, and completeness of OSM data significantly vary across different regions, attributed to its primary sourcing from non-standardized amateur contributions (J. Liu et al. Citation2016). Despite these constraints, utilizing OSM data remains the most effective and practical method for industrial parcels mapping (Gong et al. Citation2020). To improve the methodological rigor and address these limitations, enhancing road network details and applying image segmentation techniques are expected to augment the accuracy and utility of IPs assessments.
Secondly, while factors such as CST distribution, parcel functionality, and parcel size are critical for identifying IPs, a better understanding of how these factors affect classification performance is needed. To enhance the reliability of our identification and classification model, we can integrate high-resolution imagery and relevant attributes related to industrial land. Additionally, leveraging big data from the industrial sector can facilitate more comprehensive classification based on industry categories.
Furthermore, while our study provided a basic timeline of IPs with varying efficiency levels, further research is needed to reconstruct historical datasets and project temporal changes for a more thorough understanding of industrial efficiency over time.
In summary, despite these recognized limitations, our study makes a substantial contribution to comprehending the identification, categorization, and assessment of efficiency in industrial land at the parcel scale. It notably highlights the contrasting efficiency differences among various types of IPs. These findings underscore the significance of addressing disparities in industrial spatial development, which may require decisive action from governments and communities. Ultimately, this research can serve as a valuable reference for industrial land management during periods of rapid urbanization, benefiting not only China but also other nations.
6. Conclusions
In conclusion, our study addresses significant research gaps in industrial land identification, classification and efficiency assessment. By introducing the , we have refined the process of identifying IPs within the complex urban tapestry of Shenzhen. This novel approach enables us to categorize IPs into three distinct types based on their physical attributes and production types, offering deep insights into their spatial distribution and impacts.
Our comprehensive set of efficiency indicators uncovers the varied performance of different IP types, along with their spatio-temporal variations. Conducted against the backdrop of Shenzhen – a city synonymous with rapid industrial growth and unique urban challenges – our research makes a pivotal contribution toward advancing parcel-based industrial land classification and efficiency evaluation on both local and regional scales. We identify a notable clustering of industrially intensive parcels in the western region of Shenzhen, observing higher efficiency levels within the boundaries of the former SEZ as opposed to the surrounding areas. Our findings elucidate the diverse characteristics and performance metrics of different IP types, including their size, efficiency, and evolution over time. Notably, MIPs encounter challenges with low utilization rates and land efficiency, which has prompted a gradual shift away from the city center to facilitate industrial upgrading. OIPs characterized by their compact structures and high efficiency, emerge as conducive environments for high-tech enterprises with geographically dispersed operations. CIPs predominantly located outside the SEZ, demonstrate moderate industrial efficiency levels. The evolution of industrial parcels in Shenzhen has traversed several distinct phases: from an exploratory phase between 1980 and 1995, through a period of rapid expansion from 1995 to 2005, followed by a slowdown in growth and industrial restructuring from 2005 to 2015. Post-2015, the focus has shifted toward fostering high-quality development amidst resource constraints.
These insights lay a foundation for pinpointing areas with inefficient IPs, thereby informing the creation of targeted local policies and strategies to enhance industrial efficiency. Ultimately, our research offers invaluable perspectives on formulating sustainable industrial strategies, benefiting not only Shenzhen but also other cities worldwide experiencing rapid development.
Supplemental Material
Download MS Word (12.7 MB)Data availability statement
The data that support the findings of this study are freely available in the OpenStreetMap Foundation (https://download.geofabrik.de/asia/china.html), Amap Services (https://www.amap.com/), National Aeronautics and Space Administration (https://search.earthdata.nasa.gov/), WorldPop Mainland China dataset (https://www.worldpop.org/), ChinaHighPM2.5 dataset (https://weijing-rs.github.io/product.html), National Bureau of Statistics of China (http://www.stats.gov.cn/), China Land Use/Land Cover Change (CNLUCC) (http://www.resdc.cn/DOI, 2018. DOI:10.12078/2018070201).
Disclosure statement
No potential conflict of interest was reported by the authors.
Supplementary material
Supplemental data for this article can be accessed online at https://doi.org/10.1080/15481603.2024.2344405
Additional information
Funding
References
- Alao, M. A., O. M. Popoola, and T. R. Ayodele. 2021. “Selection of Waste-To-Energy Technology for Distributed Generation Using IDOCRIW-Weighted TOPSIS Method: A Case Study of the City of Johannesburg, South Africa.” Renewable Energy 178:162–22. https://doi.org/10.1016/j.renene.2021.06.031.
- Al-Tuwaijri, S. A., T. E. Christensen, and K. E. Hughes. 2004. “The Relations Among Environmental Disclosure, Environmental Performance, and Economic Performance: A Simultaneous Equations Approach.” Accounting, Organizations & Society 29 (5): 447–471. https://doi.org/10.1016/S0361-3682(03)00032-1.
- Bilgen, S. 2014. “Structure and Environmental Impact of Global Energy Consumption.” Renewable and Sustainable Energy Reviews 38:890–902. https://doi.org/10.1016/j.rser.2014.07.004.
- Borjas, G. J., and J. C. Van Ours. 2010. Labor economics. Boston: McGraw-Hill/Irwin.
- Brovelli, M. A., M. Minghini, M. Molinari, and P. Mooney. 2017. “Towards an Automated Comparison of OpenStreetmap with Authoritative Road Datasets.” Transactions in GIS 21 (2): 191–206. https://doi.org/10.1111/tgis.12182.
- Chen, J. 2006. “Development of Chinese Small and Medium‐Sized Enterprises.” Journal of Small Business and Enterprise Development 13 (2): 140–147. https://doi.org/10.1108/14626000610665854.
- Chen, H., K. Chen, and Y. Shen. 2023. “Practice and Reflections on the Mixed Land Use Policy for Secondary and Tertiary Industries—A Case Study of Guangzhou.” Natural Resource Economics of China 1–13. https://doi.org/10.19676/j.cnki.1672-6995.000861.
- Chen, W., S. Ning, W. Chen, E. Liu, Y. Wang, and M. Zhao. 2020. “Spatial-Temporal Characteristics of Industrial Land Green Efficiency in China: Evidence from Prefecture-Level Cities.” Ecological Indicators 113:106256. https://doi.org/10.1016/j.ecolind.2020.106256.
- Chen, B., B. Xu, and P. Gong. 2021. “Mapping Essential Urban Land Use Categories (EULUC) Using Geospatial Big Data: Progress, Challenges, and Opportunities.” Big Earth Data 5 (3): 410–441. https://doi.org/10.1080/20964471.2021.1939243.
- Dang, G., and L. S. Pheng. 2015. “Infrastructure Investments in Developing Economies.” Springer Science Business Media Singapore 10:978–981. https://doi.org/10.1007/978-981-287-248-7.
- Deng, Y., B. Fu, and C. Sun. 2018. “Effects of Urban Planning in Guiding Urban Growth: Evidence from Shenzhen, China.” Cities 83:118–128. https://doi.org/10.1016/j.cities.2018.06.014.
- Deng, F., L. Xu, Y. Fang, Q. Gong, and Z. Li. 2020. “PCA-DEA-tobit Regression Assessment with Carbon Emission Constraints of China’s Logistics Industry.” Journal of Cleaner Production 271:122548. https://doi.org/10.1016/j.jclepro.2020.122548.
- Dou, P., and Y. Chen. 2017. “Dynamic Monitoring of Land-Use/land-Cover Change and Urban Expansion in Shenzhen Using Landsat Imagery from 1988 to 2015.” International Journal of Remote Sensing 38 (19): 5388–5407. https://doi.org/10.1080/01431161.2017.1339926.
- Duan, J. 2020. The Shenzhen experiment: The story of China’s instant city. London: Harvard University Press.
- Du, S., S. Du, B. Liu, and X. Zhang. 2021. “Mapping Large-Scale and Fine-Grained Urban Functional Zones from VHR Images Using a Multi-Scale Semantic Segmentation Network and Object Based Approach.” Remote Sensing of Environment 261:112480. https://doi.org/10.1016/j.rse.2021.112480.
- Fan, Y., B. Bai, Q. Qiao, P. Kang, Y. Zhang, and J. Guo. 2017. “Study on Eco-Efficiency of Industrial Parks in China Based on Data Envelopment Analysis.” Journal of Environmental Management 192:107–115. https://doi.org/10.1016/j.jenvman.2017.01.048.
- Fassnacht, F. E., H. Latifi, K. Stereńczak, A. Modzelewska, M. Lefsky, L. T. Waser, C. Straub, and A. Ghosh. 2016. “Review of Studies on Tree Species Classification from Remotely Sensed Data.” Remote Sensing of Environment 186:64–87. https://doi.org/10.1016/j.rse.2016.08.013.
- Gong, P., B. Chen, X. Li, H. Liu, J. Wang, Y. Bai, J. Chen, et al. 2020. “Mapping Essential Urban Land Use Categories in China (EULUC-China): Preliminary Results for 2018.” Science Bulletin 65 (3): 182–187. https://doi.org/10.1016/j.scib.2019.12.007.
- Guo, G., Z. Peng, and Z. Zhou. 2019. “Impact of Industrial Enterprise Type of Macro Perspective on Industrial Land Use Efficiency.” Resource and Environment in the Yangtze Basin 28 (2): 241–249.
- Hoekstra, A. Y., and A. K. Chapagain. 2007. “Water Footprints of Nations: Water Use by People As a Function of Their Consumption Pattern.” In Integrated Assessment of Water Resources and Global Change: A North-South Analysis, edited by E. Craswell, M. Bonnell, D. Bossio, S. Demuth, and N. V. D. Giesen, 35–48. Springer Netherlands. https://doi.org/10.1007/978-1-4020-5591-1_3.
- Hong, W., R. Jiang, C. Yang, F. Zhang, M. Su, and Q. Liao. 2016. “Establishing an Ecological Vulnerability Assessment Indicator System for Spatial Recognition and Management of Ecologically Vulnerable Areas in Highly Urbanized Regions: A Case Study of Shenzhen, China.” Ecological Indicators 69:540–547. https://doi.org/10.1016/j.ecolind.2016.05.028.
- Huang, X., and Y. Wang. 2019. “Investigating the Effects of 3D Urban Morphology on the Surface Urban Heat Island Effect in Urban Functional Zones by Using High-Resolution Remote Sensing Data: A Case Study of Wuhan, Central China.” Isprs Journal of Photogrammetry & Remote Sensing 152:119–131. https://doi.org/10.1016/j.isprsjprs.2019.04.010.
- Huang, H., H. Xu, X. Wang, and W. Silamu. 2015. “Maximum F1-Score Discriminative Training Criterion for Automatic Mispronunciation Detection.” IEEE/ACM Transactions on Audio, Speech, and Language Processing 23 (4): 787–797. https://doi.org/10.1109/TASLP.2015.2409733.
- Jiang, H. 2021. “Spatial–Temporal Differences of Industrial Land Use Efficiency and Its Influencing Factors for China’s Central Region: Analyzed by SBM Model.” Environmental Technology & Innovation 22:101489. https://doi.org/10.1016/j.eti.2021.101489.
- Lai, Y., E. H. W. Chan, and L. Choy. 2017. “Village-Led Land Development Under State-Led Institutional Arrangements in Urbanising China: The Case of Shenzhen.” Urban Studies 54 (7): 1736–1759. https://doi.org/10.1177/0042098016629325.
- Lai, Y., K. Chen, J. Zhang, and F. Liu. 2020. “Transformation of Industrial Land in Urban Renewal in Shenzhen, China.” The Land 9 (10): 371. Article 10. https://doi.org/10.3390/land9100371.
- Liang, L., M. Chen, X. Luo, and Y. Xian. 2021. “Changes Pattern in the Population and Economic Gravity Centers Since the Reform and Opening Up in China: The Widening Gaps Between the South and North.” Journal of Cleaner Production 310:127379. https://doi.org/10.1016/j.jclepro.2021.127379.
- Li, C., X. Gao, B.-J. He, J. Wu, and K. Wu. 2019. “Coupling Coordination Relationships Between Urban-Industrial Land Use Efficiency and Accessibility of Highway Networks: Evidence from Beijing-Tianjin-Hebei Urban Agglomeration, China.” Sustainability 11 (5): 1446. Article 5. https://doi.org/10.3390/su11051446.
- Liu, J., Z. Cheng, and H. Zhang. 2017. “Does Industrial Agglomeration Promote the Increase of Energy Efficiency in China?” Journal of Cleaner Production 164:30–37. https://doi.org/10.1016/j.jclepro.2017.06.179.
- Liu, X., G. K. Heilig, J. Chen, and M. Heino. 2007. “Interactions Between Economic Growth and Environmental Quality in Shenzhen, China’s First Special Economic Zone.” Ecological Economics 62 (3): 559–570. https://doi.org/10.1016/j.ecolecon.2006.07.020.
- Liu, J., J. Li, W. Li, and J. Wu. 2016. “Rethinking Big Data: A Review on the Data Quality and Usage Issues.” Isprs Journal of Photogrammetry & Remote Sensing 115:134–142. https://doi.org/10.1016/j.isprsjprs.2015.11.006.
- Liu, S., Y. Lin, Y. Ye, and W. Xiao. 2021. “Spatial-Temporal Characteristics of Industrial Land Use Efficiency in Provincial China Based on a Stochastic Frontier Production Function Approach.” Journal of Cleaner Production 295:126432. https://doi.org/10.1016/j.jclepro.2021.126432.
- Liu, X., and Y. Long. 2016. “Automated Identification and Characterization of Parcels with OpenStreetmap and Points of Interest.” Environment & planning B, Planning & design 43 (2): 341–360. https://doi.org/10.1177/0265813515604767.
- Liu, K., L. Yin, F. Lu, and N. Mou. 2020. “Visualizing and Exploring POI Configurations of Urban Regions on POI-Type Semantic Space.” Cities 99:102610. https://doi.org/10.1016/j.cities.2020.102610.
- Liu, Y., X. Zhang, X. Kong, R. Wang, and L. Chen. 2018. “Identifying the Relationship Between Urban Land Expansion and Human Activities in the Yangtze River Economic Belt, China.” Applied Geography 94:163–177. https://doi.org/10.1016/j.apgeog.2018.03.016.
- Li, P., S. Yang, H. Yao, M. Yang, and W. Yong. 2017. “Research on Extraction of Urban Color Steel Shed Based on High Resolution Remote Sensing Image.” Geospatial Information 15 (9): 13–15+18+7.
- Lu, C., F. Wen, Q. Yang, L. Chen, and H. Zong. 2011. “An Evaluation of Urban Land Use Performance Based on the Improved TOPSIS Method and Diagnosis of Its Obstacle Indicators: A Case Study of Chongqing.” Resources Science 33 (3): 535–541.
- Ma, W., G. Jiang, Y. Chen, Y. Qu, T. Zhou, and W. Li. 2020. “How Feasible Is Regional Integration for Reconciling Land Use Conflicts Across the Urban–Rural Interface? Evidence from Beijing–Tianjin–Hebei Metropolitan Region in China.” Land Use Policy 92:104433. https://doi.org/10.1016/j.landusepol.2019.104433.
- Mardani, A., E. K. Zavadskas, D. Streimikiene, A. Jusoh, and M. Khoshnoudi. 2017. “A Comprehensive Review of Data Envelopment Analysis (DEA) Approach in Energy Efficiency.” Renewable and Sustainable Energy Reviews 70:1298–1322. https://doi.org/10.1016/j.rser.2016.12.030.
- Ministry of Housing and Urban-Rural Development of the People’s Republic of China. 2020. China Urban Construction Statistical Yearbook.
- National Assembly of the PRC. 2010, September 6. Forward the Notice of the State Council on the Approval of the Expansion of the Scope of the Shenzhen Special Economic Zone. http://www.gd.gov.cn/gkmlpt/content/0/139/post_139027.html#7.
- National Bureau of Statistics of China. 2022. China Statistical Yearbook. Beijing: China Statistics Press.
- O’Donnell, M. A., W. Wong, and J. Bach. 2017. Learning from Shenzhen: China’s Post-Mao Experiment from Special Zone to Model City. Chicago: University of Chicago Press.
- Otsuka, A., M. Goto, and T. Sueyoshi. 2010. “Industrial Agglomeration Effects in Japan: Productive Efficiency, Market Access, and Public Fiscal Transfer.” Papers in Regional Science 89 (4): 819–840. https://doi.org/10.1111/j.1435-5957.2010.00286.x.
- Pan, W., and J. Du. 2021. “Towards Sustainable Urban Transition: A Critical Review of Strategies and Policies of Urban Village Renewal in Shenzhen, China.” Land Use Policy 111:105744. https://doi.org/10.1016/j.landusepol.2021.105744.
- Pérez-Lombard, L., J. Ortiz, and C. Pout. 2008. “A Review on Buildings Energy Consumption Information.” Energy & Buildings 40 (3): 394–398. https://doi.org/10.1016/j.enbuild.2007.03.007.
- Pui, D. Y. H., S.-C. Chen, and Z. Zuo. 2014. “PM2.5 in China: Measurements, Sources, Visibility and Health Effects, and Mitigation.” Particuology 13:1–26. https://doi.org/10.1016/j.partic.2013.11.001.
- Qian, C. 2022. “A Shenzhen Model for Innovative Global Benchmark City Talent Strategy.” Specoa Zone Economy 399 (4): 7–8.
- Qiao, L., H. Huang, and Y. Tian. 2019. “The Identification and Use Efficiency Evaluation of Urban Industrial Land Based on Multi-Source Data.” Sustainability 11 (21): 6149. https://doi.org/10.3390/su11216149.
- Qin, Y., E. Curmi, G. M. Kopec, J. M. Allwood, and K. S. Richards. 2015. “China’s Energy-Water Nexus – Assessment of the Energy sector’s Compliance with the “3 Red Lines” Industrial Water Policy.” Energy Policy 82:131–143. https://doi.org/10.1016/j.enpol.2015.03.013.
- Tu, F., X. Yu, and J. Ruan. 2014. “Industrial Land Use Efficiency Under Government Intervention: Evidence from Hangzhou, China.” Habitat International 43:1–10. https://doi.org/10.1016/j.habitatint.2014.01.017.
- Wang, Z.-H., H.-L. Zeng, Y.-M. Wei, and Y.-X. Zhang. 2012. “Regional Total Factor Energy Efficiency: An Empirical Analysis of Industrial Sector in China.” Applied Energy 97:115–123. https://doi.org/10.1016/j.apenergy.2011.12.071.
- Wang, Z., J. Zhao, S. Lin, and Y. Liu. 2019. “Identification of Industrial Land Parcels and Its Implications for Environmental Risk Management in the Beijing–Tianjin–Hebei Urban Agglomeration.” Sustainability 12 (1): 174. https://doi.org/10.3390/su12010174.
- Wei, J., Z. Li, A. Lyapustin, L. Sun, Y. Peng, W. Xue, T. Su, and M. Cribb. 2021. “Reconstructing 1-Km-Resolution High-Quality PM2.5 Data Records from 2000 to 2018 in China: Spatiotemporal Variations and Policy Implications.” Remote Sensing of Environment 252:112136. https://doi.org/10.1016/j.rse.2020.112136.
- Woo, C., Y. Chung, D. Chun, H. Seo, and S. Hong. 2015. “The Static and Dynamic Environmental Efficiency of Renewable Energy: A Malmquist Index Analysis of OECD Countries.” Renewable and Sustainable Energy Reviews 47:367–376. https://doi.org/10.1016/j.rser.2015.03.070.
- Wu, Y., X. Zhang, M. Skitmore, Y. Song, and E. C. M. Hui. 2014. “Industrial Land Price and Its Impact on Urban Growth: A Chinese Case Study.” Land Use Policy 36:199–209. https://doi.org/10.1016/j.landusepol.2013.08.015.
- Xia, Y., X. Wang, H. Li, and W. Li. 2020. “China’s Provincial Environmental Efficiency Evaluation and Influencing Factors of the Mining Industry Considering Technology Heterogeneity.” Institute of Electrical and Electronics Engineers Access 8:178924–178937. https://doi.org/10.1109/ACCESS.2020.3027698.
- Xiong, S., X. Ma, and J. Ji. 2019. “The Impact of Industrial Structure Efficiency on Provincial Industrial Energy Efficiency in China.” Journal of Cleaner Production 215:952–962. https://doi.org/10.1016/j.jclepro.2019.01.095.
- Xue, B., X. Xiao, and J. Li. 2020. “Identification Method and Empirical Study of Urban Industrial Spatial Relationship Based on POI Big Data: A Case of Shenyang City, China.” Geography and Sustainability 1 (2): 152–162. https://doi.org/10.1016/j.geosus.2020.06.003.
- Xu, X., J. Liu, S. Zhang, R. Li, C. Yan, and S. Wu. 2020. China Multi-Period Land Use Remote Sensing Monitoring Data Set (CNLUCC).
- Yu, W., T. Ai, and S. Shao. 2015. “The Analysis and Delimitation of Central Business District Using Network Kernel Density Estimation.” Journal of Transport Geography 45:32–47. https://doi.org/10.1016/j.jtrangeo.2015.04.008.
- Zacharias, J., and Y. Tang. 2010. “Restructuring and Repositioning Shenzhen, China’s New Mega City.” Progress in Planning 73 (4): 209–249. https://doi.org/10.1016/j.progress.2010.01.002.
- Zhang, J. 2012. “From Hong Kong’s Capitalist Fundamentals to Singapore’s Authoritarian Governance: The Policy Mobility of Neo-Liberalising Shenzhen, China.” Urban Studies 49 (13): 2853–2871. https://doi.org/10.1177/0042098012452455.
- Zhang, J., Y. Chang, C. Wang, and L. Zhang. 2018. “The Green Efficiency of Industrial Sectors in China: A Comparative Analysis Based on Sectoral and Supply-Chain Quantifications.” Resources, Conservation & Recycling 132:269–277. https://doi.org/10.1016/j.resconrec.2017.02.015.
- Zhang, W., B. Wang, J. Wang, Q. Wu, and Y. D. Wei. 2022. “How Does Industrial Agglomeration Affect Urban Land Use Efficiency? A Spatial Analysis of Chinese Cities.” Land Use Policy 119:106178. https://doi.org/10.1016/j.landusepol.2022.106178.
- Zhang, L., L. Zhao, and Y. Zha. 2021. “Efficiency Evaluation of Chinese Regional Industrial Systems Using a Dynamic Two-Stage DEA Approach.” Socio-Economic Planning Sciences 77:101031. https://doi.org/10.1016/j.seps.2021.101031.
- Zhong, L., and X. Liu. 2019. “Application Potential Analysis of LJ1-01 New Nighttime Light Data.” Bulletin of Surveying & Mapping 7:132–137. https://doi.org/10.13474/j.cnki.11-2246.2019.0235.