
 ?Mathematical formulae have been encoded as MathML and are displayed in this HTML version using MathJax in order to improve their display. Uncheck the box to turn MathJax off. This feature requires Javascript. Click on a formula to zoom.
ABSTRACT
The Blue Nile River is an indispensable source of livelihood for over 90 million people in Ethiopia, Sudan, and Egypt. Recently, Ethiopia has constructed the Grand Ethiopian Renaissance Dam (GERD), the largest in Africa, which could potentially alter the geomorphology of the river regime, and impact downstream countries. This study offers the first comprehensive analysis of the geomorphological alterations and water surface coverage changes of the Blue Nile River due to the construction and operation of the GERD. For this, we use multi-temporal Landsat 5 and Sentinel-2 satellite imagery spanning the period from 2009 to 2022, supplemented with Climate Hazards Group InfraRed Precipitation with Station data (CHIRPS) precipitation products to discern the potential influence of climate variability on the observed changes. The findings are examined using the Before-After-Control-Impact (BACI) model, revealing significant fluctuations in the water surface coverage area across different sections of the river, particularly following the filling stages of the GERD. An analysis at every 10 km is performed to assess the extent of GERD’s influence on the Blue Nile, which indicates no notable alterations in surface area or geomorphology within the first 30 km of downstream river flow. The study also determines that changes from 2011 to 2018 are primarily associated with the upgrade activities of the Roseires Dam, while alterations along the Blue Nile from 2018 to 2019 are linked to climate variability. The observed changes between 2020 and 2022 can largely be attributed to the filling stages of the GERD. Notably, these changes are most pronounced in the water retaining areas upstream of the GERD dam. The results also show that Roseires Dam could play a crucial role as a buffer, mitigating potential impacts imposed by the GERD, and serving as a conduit between the GERD and downstream communities.
1. Introduction
In ancient times, humans found that by building dams, they could exert control over river regimes (Kale and Ataol Citation2021). However, over time, their uses have diversified and spread around the world, representing a total of almost 60,000 dams built on river systems in 2020 with lengths greater than 1,000 km (Bing et al. Citation2022; Chen et al. Citation2022). The impacts of these dams on river dynamics have been documented by many authors (e.g. Awange Citation2021a; Basheer Citation2021; Ibitoye Citation2021; Kale and Ataol Citation2021; Langat, Kumar, and Koech Citation2019; Pizzuto Citation2002; Schmidt and Wilcock Citation2008; Skalak et al. Citation2013; Slowik et al. Citation2018; Woldemichael et al. Citation2012), who have pointed out that dams are directly responsible for the disturbances in the natural flow of rivers (see also Sterk, Sperna-Weiland, and Bierkens Citation2020), and highlighted them as one of the most severe anthropogenic events that influence fluvial processes and morphology. Consequently, the construction of a dam may impact downstream communities (Slowik et al. Citation2018), which is why countries such as Sudan and Egypt are currently showing concerns over the construction of one of the world’s largest dams, the Grand Ethiopian Renaissance Dam (GERD; Awange Citation2021b; Kamara, Ahmed, and Benavides Citation2022). Although construction of the GERD started in 2011, the first stage of filling only began in July 2020 (Kansara et al. Citation2021; Samra and Ali Citation2021). It has been built on the Blue Nile near the border between Ethiopia and Sudan (Basheer Citation2021; El-Rawy, Moghazy, and Eltarabily Citation2021), and is estimated to have an area extension of 1,850 km2 when it reaches its maximum operating level and store approximately 74 billion cubic meters (BCM; Mahmoud, Fahmy, and Garcia Citation2022).
The construction of the GERD on the Blue Nile poses threats to riparian states since reservoirs trap sediment upstream and reduce the amount of sediment in the downstream river channel (Pizzuto Citation2002; Slowik et al. Citation2018), resulting in channel narrowing (Graf Citation2006). The retention of sediments in the reservoir causes the downstream water to have greater potential energy, so that the water can carry sediment with greater force, reducing the width of the channel as the depth of the riverbed increases (Kale and Ataol Citation2021). This statement has been supported by different authors who reported reductions in channel widths between 40% and 60% (e.g. Gierszewski et al. Citation2020; Richard, Julien, and Baird Citation2005; Shin and Julien Citation2011). Changes in river width mean changes of the riverbed, so riverbed degradation is one of the most significant geomorphologic characteristics of a river system (Kale and Ataol Citation2021). The accumulation of sediment in reservoirs created by dams may have several environmental effects, including impacts on aquatic ecosystems, reduced sediment transport to the ocean, and notable erosion of deltas (Wang et al. Citation2017). In order to mitigate such possible effects, dams may release stored sediments through controlled releases known as sediment flushing. This process helps to maintain downstream sediment continuity and mitigate some of the impacts associated with sediment trapping (Antoine et al. Citation2020). However, with fewer high-discharge events, sediment can settle and accumulate, raising the riverbed and leading to sedimentation downstream (El Aoula et al. Citation2021). For instance, Brandt and Swenning (Citation1999) pointed out that the deposition of fine sediments downstream of the Cachi dam in Costa Rica caused an average bed elevation increase of 250,000 tonnes over a 30-kilometer stretch. That is, anthropogenic actions in fluvial systems can lead to changes in geomorphological landscapes (Kale and Ataol Citation2021), since sediment dynamics are disrupted and geomorphological conditions are modified (Bing et al. Citation2022). Studying geomorphological changes over river systems resulting from dam operations is thus necessary to identify channel morphology and flow disturbances in downstream systems, as well as to assess the level of impact that a dam can exert on a fluvial system, which is crucial for prevention and/or management of river resources (Schmidt and Wilcock Citation2008).
Global and regional studies on geomorphological effects of dam operation on fluvial systems are vast (e.g. Graf Citation2006; Ibitoye Citation2021; Kale and Ataol Citation2021; Langat, Kumar, and Koech Citation2019; Schmidt and Wilcock Citation2008; Skalak et al. Citation2013; Slowik et al. Citation2018). For instance, Kale and Ataol (Citation2021) used satellite imagery to determine changes in the river channel before and after the construction of dams along the Yesilırmak river in northern Turkey, where the results showed an increase in degradation and aggradation of the river after the construction of the dams. Likewise, Ibitoye (Citation2021) determined the morphological changes of the lower Niger River channel by using satellite images over 27 years by calculating river centrelines for each year. Their results showed variations in channel width and movement of the centreline throughout the years. Similarly, different studies have been undertaken over the Nile River to assess morphological changes (e.g. Negm, Abdel-Aziz, et al. Citation2017; Negm, Elsahabi, et al. Citation2017; Raslan Citation2010; Raslan and Salama Citation2015; Sadek Citation2013). Negm et al. (Citation2017) conducted simulations of morphological changes in one of the two branches of the Nile River (Damietta branch) using the two-dimensional hydrodynamic mathematical model CCHE2D. These simulations aimed to showcase potential geomorphological alterations and predict the impacts of high-water flows on velocity. The findings confirmed the occurrence of scouring, deposition, and bank erosion along the branch’s course. Similarly, Sadek (Citation2013) assessed the impacts of island development on the Nile River morphology using a numerical model to simulate sediment transportation and water flow to predict morphological changes. This simulation allowed the generation of multiple scenarios for island development and the selection of the scenario with minimum morphological changes. Furthermore, Ahmed and Fawzi (Citation2011) examined the meandering and bank erosion of the Nile River in Egypt, specifically between Sohag and El-Minia. Their analysis using Landsat imagery revealed that the course of the river had migrated over time and space, with some islands disappearing entirely, and new ones emerging at different locations. One major consequence that they highlighted was the negative impact of lateral riverbank, leading to a loss in surrounding agricultural land and a reduction in the size of river islands, consequently decreasing agricultural productivity. Their findings also implicated human activities as a factor accelerating these processes, causing further environmental impact.
Numerous studies have incorporated the analysis of water bodies’ surface development into their methodologies for studying river morphology, often combining it with an examination of river bank erosion and depositional changes to identify major spatio-temporal alterations. For instance, Dewan et al. (Citation2017) used Landsat images to digitize river boundaries and calculate the total channel surface area. They combined this technique with other approaches, such as evaluating positional changes, curvature of the left and right bank, mean channel width, and sinuosity and braiding indices, to investigate the dynamics of the Ganges-Padma river system in Bangladesh. Langat et al. (Citation2019) applied the Modified Normalised Difference Water Index (MNDWI) technique to Landsat images and aerial photographs to extract the water surface of the Tana River, Kenya. This process yielded polygons of water bodies, enabling further processing and inclusion of erosion, accretion, and stable areas in their analysis. Closer to the study area in this paper, Negm et al. (Citation2017) used the NDWI technique to determine morphological changes in water surface coverage area in two sections of the Nile River over the southern part of Egypt. They reported a loss of approximately 2.3% of water surface area in the first section from Aswan City to Esna Barrages, and about 13% in the second section from Esna Barrages to Nagaa Hammady Barrages, over a 26-year period.
While studies focusing on morphological changes along the Blue Nile are limited, surface water analysis has been a prevalent approach for assessing the expansion of the GERD. Samra and Ali (Citation2021) utilized multiple Sentinel-1 images and the Advanced Land Observing Satellite (ALOS) global Digital Elevation Model (DEM) to analyze the first two filling stages of the GERD. The results revealed the dam’s reservoir surface area and water volume of 173.5 km2 and 4.4 billion m3 after the first filling stage, which increased to 314.8 km2 and 8.66 billion m3 after the second filling stage. Similarly, Salama et al. (Citation2022) utilized Landsat, Sentinel-1, Sentinel-2 images, and Shuttle Radar Topography Mission (SRTM) data, to track water surface coverage and volume changes during the first three filling phases of the dam. Their findings indicated that the GERD’s surface area expanded to 250.16 km2 and 316.54 km2 after the first and second filling phases respectively, while the average volume was around 4.2, 3.75, and 9.25 billion m3 after the first, second, and third filling phases respectively. In addition to studying the surface area of the Blue Nile’s waters, other researchers have conducted studies on the changes in its stored water and investigated their relationship to climate variability. These studies go beyond estimating surface water and also encompass the evaluation of soil moisture and groundwater dynamics (e.g. Awange, Forootan, et al. Citation2014; Awange, Gebremichael, et al. Citation2014; Khaki and Awange Citation2020, Citation2021).
Although several studies have been carried out over the Nile River as mentioned above, there remains an unexplored research gap focusing on the specific geomorphological and water surface coverage area changes of the Blue Nile associated with dams, including the GERD. Undoubtedly, many studies have been conducted on the GERD, but most of these focused on the effects and risks that the dam may cause (e.g. Kamara, Ahmed, and Benavides Citation2022; Mahmoud, Fahmy, and Garcia Citation2022; Morsy, Abdelatif, and Mostafa Citation2021), and on proposing filling strategies to mitigate the impacts on downstream countries (e.g. El-Askary et al. Citation2021; Kansara et al. Citation2021; Wheeler et al. Citation2016). Thus, this study introduces a novel perspective by filling this critical research gap. The aim is to provide a comprehensive understanding of how the GERD has influenced the geomorphological changes and water surface area of the Blue Nile since the dam’s inception.
This study, therefore, aims to assess two key aspects: i) water surface coverage changes, and ii), geomorphological changes of the Blue Nile associated with the construction of the GERD. To achieve these objectives, a multi-temporal analysis of Landsat imagery at a 30-m spatial resolution and Sentinel-2 imagery at a 10-m spatial resolution from 2009 to 2022 is undertaken. The use of satellite imagery with such different spatial resolutions allows for the extraction of water bodies, enabling the identification of water surface coverage and geomorphological changes. The selection of these two sensors is based on their spatial resolution, which provides detailed information for an accurate analysis. The methods include the use of the NDWI and the overlay of polygons to identify changes. Furthermore, Climate Hazards Group InfraRed Precipitation with Station (CHIRPS) data are employed to explore potential relationships between climate variability and geomorphological changes in the study area.
2. Study area, data and methods
2.1. The Blue Nile river and the GERD
The Blue Nile, the river of main interest in this work, flows from the south-east to north-west direction (34°33’–39°45’E and 7°49’–12°42’N; ). It is 1,450 km long, and, together with the White Nile, forms the Nile River with a length of 6,670 km (Awange Citation2021a, Citation2021b; Wheeler et al. Citation2016). The source of the Blue Nile is found in Lake Tana, which is located in the NorthWestern Ethiopian Highlands and contributes less than 10% to the total flow of the river (Mulat and Moges Citation2014). Other rivers Dinder and Rahad contribute around 7% of the annual flow (Hassaballah et al. Citation2017), a substantial but still a minor portion. On the other hand, rainfall and runoff during Ethiopia’s rainy season play a fundamental role in the annual flow of the Blue Nile’s basin (Conway Citation2005). The Blue Nile, with its water supply of more than 60%, is the main contributor to the Nile River (Morsy, Abdelatif, and Mostafa Citation2021). Additionally, the Blue Nile River is an indispensable source of livelihood for over 90 million people in Ethiopia, Sudan, and Egypt. Its contribution is seasonal since the highest flow of the Blue Nile occurs between June and September, which is known as the “Kiremt” (rainy) season (Basheer Citation2021; Liou and Mulualem Citation2019), in which approximately 80% of the annual flow is recorded (Basheer Citation2021).
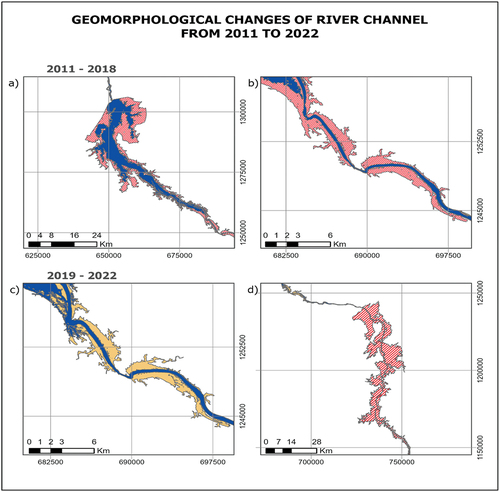
Figure 1. (a) Geographical location of the Blue Nile and the Grand Ethiopian Renaissance Dam (GERD). The “control area” refers to regions located upstream of the GERD’s lake endpoint (shown in purple), and “impacted areas” denote the locations that could potentially be affected by the operation of the GERD (from the control area downstream). (b) Timeline of the GERD project, which is divided into three stages, “Before Dam,” “Dam construction” (including the starting year), and “Dam Filling”.
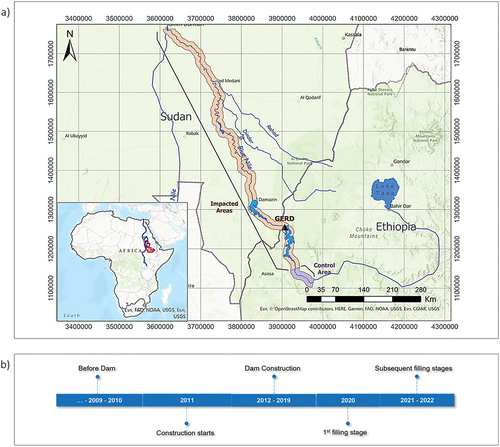
Different hydropower projects have been developed along the Blue Nile, with none of them having the dimensions approaching the GERD. The megaproject GERD is located at 15 km from the border of Sudan (see ; Basheer Citation2021; El-Rawy, Moghazy, and Eltarabily Citation2021). The length and height of the GERD is 1,780 m and 145 m, respectively, which will store a volume of 74 BCM and will have an areal extension of 1,850 km2 when it reaches its maximum operating level (Mahmoud, Fahmy, and Garcia Citation2022). With these dimensions, the GERD is expected to produce approximately 6,000 megawatts (MW) electricity and will undoubtedly be the largest dam in Africa, and one of the 10 largest in the world (Awange Citation2021b; Bleischwitz, Kirschke, and Adam Citation2021).
2.2. Data
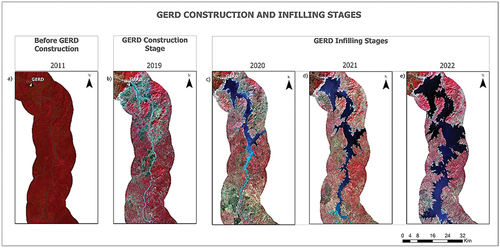
Potential geomorphological changes in the Blue Nile caused by the GERD’s construction are assessed in this study using multi-spectral satellite imagery. Due to the extensive study area, multiple scenes are required for complete coverage (see and ). Considering that the first construction stage of the GERD began in 2011 and that the third infilling stage was in 2022 (at the moment of undertaking this research), this study should span from 2011–2022. However, to secure a comprehensive understanding of the river’s behavior before any disruption caused by the GERD construction, the period 2009–2011 is included in the analysis. Therefore, the timeline of the study is set from 2009 to 2022, rather than 2011–2022 (see ). Since the Sentinel-2 data are only available from 2015 onward, changes between 2009 and 2011 are analyzed using Landsat 5 imagery. Sentinel-2 imagery, on the other hand, are utilized to investigate changes from 2018 to 2022. Three stages are defined to analyze dynamic changes along the Blue Nile: Before GERD construction (2009–2011), GERD construction (2011–2019), and GERD infilling (2020–2022) (see ). In order to assess the influence of external factors, such as climate variability, CHIRPS rainfall data at a monthly temporal resolution are also included. A summary of these data is presented in .
Table 1. Summary of the data used in this study. The Landsat 5 images at a 30-m spatial resolution are employed to analyze changes prior to the construction of the GERD, from 2009 to 2011. The sentinel-2 images at a 10-m spatial resolution are used to analyze changes during GERD construction (2018–2019) and infilling stages (2020–2022). The CHIRPS data are used to analyze climate variability from 2009 to 2022.
2.2.1. Landsat 5 imagery
This study uses Landsat Collection 2 Level-2 images at a 30-m spatial resolution. Seven Landsat 5 Thematic Mapper (TM) images for each year of interest are downloaded from the United States Geological Survey (USGS) website (https://earthexplorer.usgs.gov/). They correspond to the dry season (November – December) when the area of interest is free of floods, which is the ideal scenario to obtain riverbank information from remotely sensed data (Gurnell, Downward, and Jones Citation1994). Additionally, to ensure integrity, consistency, and accuracy in the results, the Landsat 5 data are selected based on a maximum 5% cloud coverage (see ) and images taken in a close date range (approximately one month apart). In total, 14 Landsat 5 images are downloaded corresponding to the years 2009 and 2011.
2.2.2. Sentinel-2 imagery
The Sentinel-2 satellite images used in this study are from 2018 to 2022, which were downloaded from the Copernicus Data Space Environment website (https://dataspace.copernicus.eu/). The Sentinel-2 satellites were launched on 23 June 2015 by the European Space Agency (ESA) to monitor aspects, such as environment, natural disasters, vegetation, and land cover. For this purpose, this mission incorporates images at high spatial resolutions (10, 20, and 60 m) with a larger number of multi-spectral bands (13 in total), captured at a short revisit time of 5 days. Despite the presence of the 13 multi-spectral bands, this study only uses the Blue, Green, Red, and Near-Infrared (NIR) bands (bands with a 10-m spatial resolution), as these are the bands that allow the monitoring of water bodies to be conducted (Du et al. Citation2016).
Since these Sentinel-2 imagery have a higher spatial resolution, at 10 m, than the Landsat imagery, at 30 m, the Sentinel-2 dataset is used to assess in detail water surface coverage and geomorphological changes along the Blue Nile associated with the operation of the GERD. Due to the large extent of the study area, 12 Sentinel-2 MultiSpectral Instrument (MSI) scenes at Level 1C (the level that includes radiometric and geometric correction) are downloaded per each considered year, resulting in a total of 60 images. The summary of Sentinel-2 scenes used in this study is provided in . The Sentinel-2 data are employed to analyze changes during GERD construction (2018–2019) and infilling stages (2020–2022).
2.2.3. CHIRPS precipitation data
The CHIRPS precipitation data are used in this study to explore possible influences of climate variability on geomorphological changes over the study area, to identify whether changes are attributed to natural factors like climate change or human-induced factors such as dam construction. CHIRPS is a satellite-based precipitation product with station data developed by the USGS and the University of California, Santa Barbara (UCSB). This product has a spatial resolution of 0.05o × 0.05o and a monthly temporal resolution. It is developed to monitor climate and environmental changes and has been available since 1981 (Hsu et al. Citation2021). The CHIRPS data were downloaded from the Climate Hazards Center-UCSB website (https://www.chc.ucsb.edu/data/chirps), covering the 14-year period from 2009 to 2022.
2.2.4. Image pre-processing and subsets
With the data Landsat 5 Collection 2 Level 2 and Sentinel-2 Level 1C used in this study, no radiometric, atmospheric corrections, or positional adjustment is needed. Furthermore, because there was no cloud cover over the Blue Nile during the selected months (), no further pre-processing was required. However, pre-processing for band combinations, mosaics, and masking of images are carried out to create a smaller subset of data, thereby reducing the processing time. To this end, a buffer of 10 km is created using a manually digitized polyline of the Blue Nile River in 2009.
2.3. Methods
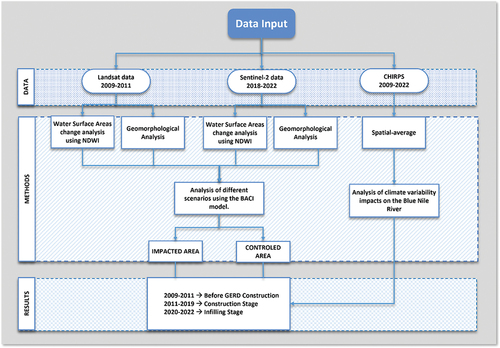
The methodology used in this study is illustrated in . The three stages: before construction (2009–2011), during construction (2018–2019), and infilling (2020–2022) are considered to identify any alterations on the Blue Nile due to the GERD dam construction and operations.
Figure 2. Schematic flowchart summarising the analyses undertaken in this study. The Landsat 5 (2009–2011) and sentinel-2 (2018–2022) data are used to identify changes along the Blue Nile, and the CHIRPS data are used to identify changes associated with climate variability. The main methods used are Normalised Difference Water Index (NDWI) to extract water bodies and spatial-average analysis to analyse CHIRPS precipitation temporal variation and change. The investigated results are presented and described based on three distinct stages: before GERD construction (2009–2011), during construction (2018–2019), and infilling (2020–2022).
2.3.1. Before-after control impact model
In this study, the Before-After Control Impact (BACI) model (Awange, Hu, and Khaki Citation2019) is used to assess whether changes in the Blue Nile are due to natural events or the construction of the GERD. To this end, the upstream and downstream areas of the GERD location are termed as control areas and impacted areas, respectively (see ). Changes found in both areas are assumed to relate to natural events (e.g. climate changes), while changes that only occur in the impacted areas are assumed to be caused by the construction of the GERD. The control area has a length of about 70 km and is established to end at 10 km upstream of the GERD lake to ensure that elevation and environmental factors are similar. This delimitation has been selected to guarantee sufficient distance to the end of the GERD lake, so that the control area is not affected by its presence. The remainder of the Blue Nile is considered as the impacted areas, which have a length of approximately 940 km (until the Blue Nile reaches Khartoum where it meets the White Nile, ).
The analysis of the Blue Nile River in this study is divided into three stages as stated in Section 2.2, which correspond to the timeline of the GERD construction and operation (See ).
The first stage is termed as “Before GERD Construction” which covers the years before the dam construction; however, we use a baseline in 2011 which was the year in which the river flow has not been disrupted due to the GERD dam. The 2009–2011 period is therefore used to identify previous dynamics of the river course. The second stage is termed as “GERD Construction Stage” which covers the period from 2011 to 2019. It is set to 2019 as the constructions actually took place until almost mid-2020. However, as the dataset corresponds to the dry season, by December 2020 the first stage of filling had already been carried out. Changes in water surface coverage area and geomorphology are expected in the study area during this period; however, those changes are not expected to be relevant. Consequently, the analysis for this period is not conducted using yearly data (e.g. 2012, 2013… 2017), instead the analysis is divided into two periods: 2011–2018 and 2018–2019. The first period helps to assess overall changes during the “Construction Stage,” while the second period allows to examine and reinforce the behavior of the Nile River in the year before to the “Infilling Stage.” The third stage, termed as the “GERD Infilling Stage,” begins with the first filling of the GERD in 2020 and extends through 2022. The three filling stages covered by this phase are analyzed independently in 2020, 2021, and 2022.
The main interest factors in this study are the extraction of water bodies and geomorphological changes. To extract water bodies, the most relevant method, NDWI, is used, which is able to distinguish water features from land features. When obtaining the NDWI, a reclassification is necessary to generate binary images. This new raster image is vectorized to identify erosion and deposition areas, and, therefore, allowing the identification of alterations over the study area and the impacts on downstream communities. The spatial-mean CHIRPS precipitation time series is used to analyze the influence of rainfall in the study area and its relationship with water surface coverage and geomorphological changes. All analyses were performed using the ArcGIS Pro 2.8 Patch 2 (2.8.2) software package.
2.3.2. Normalised Difference Water Index (NDWI)
The NDWI is a widely used method for delineating water bodies. This method was introduced by McFeeters (Citation1996), who pointed out that the combination of the Green (approximately 560 nm) and NIR (Near-Infrared, approximately 842 nm) bands enhances the difference between water bodies and land. The NDWI is calculated based on the Green and Near-Infrared (NIR) channels as:
The NDWI values range between −1 and 1, with a zero or negative value indicating soil and terrestrial characteristics and a positive value indicating water (McFeeters Citation1996). To extract water bodies from other features, it is necessary to reclassify NDWI images to binary images with values of 0 and 1, where 0 and 1 correspond to non-water and water pixels.
2.3.3. River dynamics
Two methods are used to analyze river dynamics:
Water surface coverage analysis: Binary images generated by the NDWI method are converted into vector data, representing river polygons. However, to ensure accurate results, it is necessary to address potential limitations. The NDWI method, although effective, may face challenges in providing highly precise outputs due to various factors. Atmospheric conditions, such as cloud cover, haze, or other atmospheric phenomena, can introduce noise or distortions in the estimated NDWI. Another factor impacting accuracy is the presence of mixed pixels which incorporate both land and water. To enhance accuracy, manual adjustments are conducted to mitigate these effects and improve the precision of the water polygons. Subsequently, the surface area of these polygons is calculated using ArcGIS Pro to assess quantitative differences. This procedure allows for further image processing (e.g. overlaid polygons) and analysis to be conducted, enhancing the overall understanding of the water surface dynamics.
Geomorphological Analysis: To identify the most affected areas of the Blue Nile, river polygons are overlaid in pairs, e.g. the 2009 river polygon is overlaid with the 2011 river polygon, and areas where water bodies intersect are denoted as stable or unchanged (Dewan et al. Citation2017). Similarly, erosion and deposition areas are calculated, where erosion refers to eroded land (e.g. riverbank erosion) and deposition refers to areas where sediments are being accumulated. Eroded areas are retrieved by comparing, e.g. 2011 against 2009 river polygons. To be able to retrieve deposited areas, one needs to compare, e.g. the 2009 against the 2011 river polygon, therefore, the output highlights areas of deposition. Considering that this study is developed over an approximate distance of 1,010 km, it is practical to easily identify the most affected areas. Therefore, all polygons corresponding to erosion and deposition are converted into single features so that it is possible to calculate individual areas. This allows for easy filtering of a specific number of affected areas along the Blue Nile.
2.3.4. Spatial averaging
The spatial averaging (SA) method is adopted in this study to calculate CHIRPS-based yearly spatial-average precipitation in the study area. To calculate the average amount of precipitation in mm across the study area, the original monthly CHIRPS data are transformed to the yearly interval by summing up the monthly values for each pixel over each calendar year. Subsequently, the spatial-average precipitation is computed from all the pixels located within the study area. In climate science, global or regional temperatures and precipitation are often estimated by spatially averaging point observations (see e.g. Seshadri Citation2017). Likewise, SA is employed in engineering contexts that involve the consideration of physically varying quantities, such as material properties in large structures or soil properties in geotechnical sites (Geyer et al. Citation2022). To effectively model these spatially variable properties, random fields (RFs) are utilized, which consist of an infinite number of random variables (Geyer et al. Citation2022).
The SA method provides a means to express random fields through a set of random variables representing local averages of the field across predefined elements. Originally proposed by Vanmarcke and Grigoriu (Citation1983), the SA method has been applied to homogeneous RFs in various applications. It is particularly useful in geotechnical analyses for approximating soil properties that exhibit spatial variability (Geyer et al. Citation2022).
3. Results and discussions
3.1. Water surface coverage changes along the Blue Nile
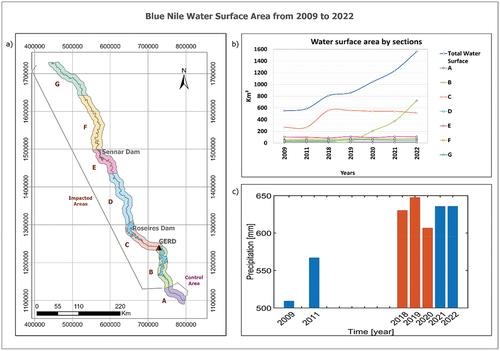
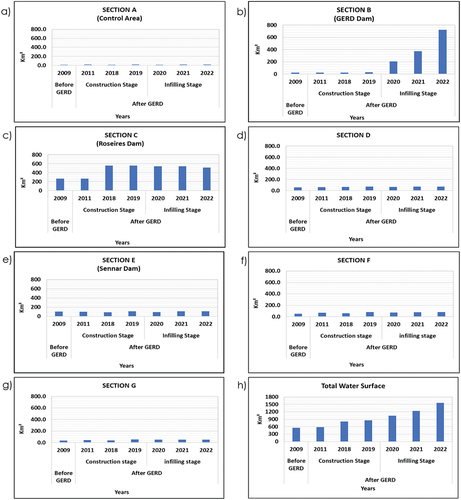
For analyzing water surface coverage and geomorphological changes along the Blue Nile due to the GERD’s construction, the BACI model is used (Awange, Hu, and Khaki Citation2019). This model aids in understanding variations in water surface coverage areas in both control and impacted areas (see ) before and after the construction of the dam. We first apply the BACI model to identify changes along the entire study area over the period covered in this work. Subsequently, in order to better understand the spatial distribution of water surface changes along the Blue Nile, the impacted areas are divided into six sections labeled as Section B to Section G, with the GERD Dam located in Section B, the Roseires Dam in Section C, and the Sennar Dam in Section E. Control area is labeled as Section A (). This division allows us to investigate whether changes were uniformly distributed across the entire study area or if certain sections exhibited more pronounced variations. Overall, before the GERD’s construction, in 2009, the water surface coverage area was 549.6 km2, which increased slightly to 582.0 km2 in 2011 (an increase of 5.7%). During the GERD’s construction, however, the water surface coverage area substantially increased from 582.0 km2 in 2011 to 915.4 km2 in 2019 (). Yet, the most rapid changes are observed in the infilling stage of the dam; in 2020, the water surface coverage area reached 1044.0 km2, which jumped to 1233.2 km2 in 2021, and expanded significantly to 1559.5 km2 in 2022 (). depicts a rise of more than 10% of precipitation according to CHIRPS data. However, it appears that despite this rise in precipitation, the study area did not show significant changes from 2009 to 2011 (). The BACI analyses results for each of the divided sections in are detailed in the sections below.
Figure 3. Blue Nile water surface coverage area changes. a) subdivisions of the study area where section a represents the control area and sections B to G represent the impacted areas, b) changes in water surface coverage area of each section over time (the dark blue line illustrates the total water surface coverage area of the Blue Nile), and c), spatially-average precipitation amounts over the study area for the selected years (2009–2022). CHIRPS precipitation for the years 2012–2017 is not shown in panel c to match with data in panel b.
3.1.1. Before GERD construction (2009 − 2011)
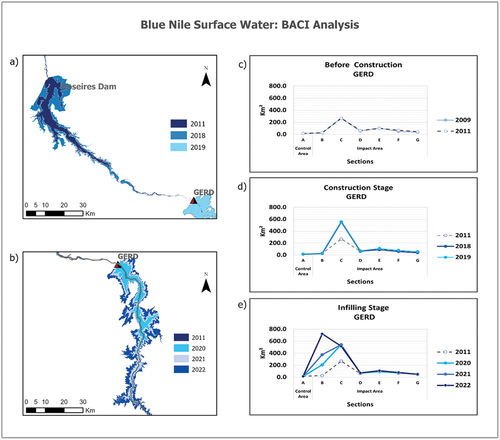
shows the results of BACI analysis for each section over time. Changes in water surface coverage area in Section C, where the Roseires Dam is located, and Section B, where the GERD dam is located, are illustrated in . shows water surface changes over the seven divided Sections A to G before and during the GERD construction, and in the infilling stage. Before GERD construction, the control area exhibited a slight increase in water surface coverage area from 14.2 km2 in 2009 to 15.2 km2 in 2011, corresponding to an increase of approximately 7%. During the same period, the impacted areas also experienced an increase in water surface coverage area from 535.4 km2 to 566.7 km2, corresponding to an increase of about 5.8% indicating a similar change in water surface coverage area along the river in both control (Section A) and impacted areas (Sections B to G) (). The increase in water surface coverage areas in 2011 corresponds to a rise in rainfall in that year during a strong La Niña event (Liou and Mulualem Citation2019).
Figure 4. BACI analysis for each section over time; (a) roseires Dam’s water surface changes in 2011, 2018 and 2019, (b) GERD Dam’s water surface changes after each filling stage (2020, 2021, 2022), the behaviour of the Blue Nile before GERD construction (2009–2011) (c), during GERD construction (d), and after GERD construction (e).
shows water surface coverage area changes in Sections A to G () and the total water surface coverage () for the entire study area in different years. The description of the impacted areas is generalized since all sections along the river show the same trend. The only section that had a significant increase in water surface coverage area was Section F, which expanded from 49.6 km2 to 67.5 km2 corresponding to a 36% increase from 2009 to 2011 (). One possible reason for this section to show such a different increase in water compared to the rest of the study area is that in this section, the tributaries of the Rahad and Dinder rivers converge, and these two rivers contribute approximately 7% to the flow of the Blue Nile River (Hassaballah et al. Citation2017). This suggests that the significant increase in annual rainfall was substantial enough to augment the flow of both the Rahad and Dinder rivers, resulting in a greater contribution to the Blue Nile in 2011. It is worth noting that Sections F and G may exhibit a fluctuating behavior across the years due to the influences of the Rahad and Dinder tributaries. Despite this rainfall event, shows that the water surface coverage area in 2009 and 2011 remained relatively stable along the Blue Nile, with a slight increase in Section F.
Figure 5. Water surface coverage area changes in sections a to G (a–g) and the total water surface coverage for the entire study area (h) in different years. The total water surface coverage depicts the cumulative water surface coverage area of the Blue Nile, encompassing all sections a to G, providing a comprehensive perspective on the study area’s changes over time. Sections B and C exhibited notable and substantial changes.
3.1.2. After GERD construction (2011–2022)
A) construction stage
This study considers the Construction Stage from 2011 to 2019; the inclusion of 2018 in the analysis allows us to examine the behavior of the Blue Nile River one year prior to the commencement of the first filling stage of the GERD (2018–2019). Additionally, notable changes occurred in 2019 (i.e. rainfall anomalies), which reinforces the need to separately analyze the period 2018–2019 from the overall study period of 2011–2019. Therefore, it is convenient to subdivide the Construction Stage into Stage A (2011–2018) and Stage B (2018–2019) to enable a more detailed examination of the changes during each substage.
i) Stage A (2011 − 2018)
During this Stage A period, the water surface coverage area in the control area exhibited a slight contraction from 15.2 km2 in 2011 to 13.9 km2 in 2018, representing an approximate decrease of 8.5%. On the contrary, the impacted areas experienced a substantial increase in the water surface coverage area, from 566.8 km2 in 2011 to 833.0 km2 in 2018, representing an increase of approximately 47%. However, this trend is not observed uniformly across all sections, in which Section B exhibits a decrease of approximately 5%, and Sections E to G experience an average decrease of 11.9% (). The fact that both Section A and Section B exhibited the same decreasing trend in streamflow, which suggests that the decline in most sections is unrelated to the activities associated with the construction of the GERD. Instead, this decrease could be attributed to climate variability as the region experienced a period of severe drought from 2014 to 2017 (Asfaw et al. Citation2018; Taye et al. Citation2020), with a standardized precipitation index (SPI) of −3.0 in July 2015 in the highland region (central part of Ethiopia) and −3.03 in June 2015 in the lowland region (near the Ethio – Sudan border), impacting agriculture as reported by Taye et al. (Citation2020).
The increase in water surface coverage area mentioned above in the impacted areas in the same period is due to the change in Section C where the Roseires Dam is located, which experienced a sharp increase in water surface coverage area, expanding from 268.1 km2 in 2011 to 556.7 km2 in 2018, representing a two-fold increase ( and ). This significant increase could be primarily attributed to operational changes and improvements made to the Roseires Reservoir. In January 2013, the dam underwent substantial modifications, increasing the height of the dam wall by 10 m (Ali Citation2014; Ali et al. Citation2018; Muala et al. Citation2014). This adjustment expanded the reservoir’s storage capacity to 7.4 BCM, a necessary enhancement considering the reservoir’s capacity had decreased by 40% due to sedimentation (Muala et al. Citation2014). illustrates the profound impact of these modifications on the water surface coverage area of the Blue Nile in this period. It can be observed that the increase in the water surface coverage area of Section C accounted for the changes in the total surface coverage area of the Blue Nile River during 2011–2018 ().
Although Sections A, B, E, F, and G experience a slight decrease in water surface coverage area (), Section D, on the contrary, shows an approximate increase in water surface coverage area of 6%. One possible explanation for this rise in surface area could be related to the active management of the Roseires dam’s water levels, releasing greater volume downstream. However, the released water was not sufficient enough to compensate for the deficit (11.4%) of water downstream after Section D. Additionally, other factors such as evaporation (Ali Citation2014; Woldemichael et al. Citation2012) and the implications of the severe droughts could have contributed to the reduction of water surface coverage in the Sennar Dam and downstream flow.
ii) Stage B (2018–2019)
This analysis revealed a significant increase of ∼ 70 km2 in the water surface coverage area along the study area from 2018 to 2019. This increase was evident in both the control and nearly all the impacted areas except Section C, which remained relatively stable. The water surface coverage area in the control area increased by 11.4%. Sections B to D also showed a similar average increase of around 10%. Notably, the lower part of the study area experienced the highest expansion in surface coverage area during this year: Sections E, F, and G expanded by 23.6%, 35.9%, and 38.4%, respectively (). The fact that Section B, where the GERD was constructed, shows the same general trend as the other sections along the study area, which suggests that any changes in the downstream flow cannot be attributed to the construction stage of the GERD.
depicts the increase in water surface coverage along the Blue Nile River, where a moderate increase for Sections E to G is detected. However, the slight 10% increase in Sections A to D may not be clearly visible due to the larger surface area represented by Section C. The increases described above correspond to the increase in the average amount of precipitation across the study area shown in , which demonstrates a significant increase in rainfall in 2019 with an average of 650 mm. This is the year in which the entire study area showed an increase in water surface coverage area, suggesting that the peaks shown in may be related to this event (i.e. ).
These findings support the reported unusual heavy rainfall that took place in Sudan and other places of Africa (e.g. Khaki and Awange Citation2021; Wainwright et al. Citation2020) in August 2019, which resulted in a substantial portion of Sudan being inundated, contributing to a large widespread of fluvial flooding, specifically in August and September. This event was marked by increased water levels in all Sudanese dam reservoirs and some tributaries of the Nile River even exceeding their banks (Elagib et al. Citation2021).
B) infilling stage (2020–2022)
In general, the control area remained relatively stable, which slightly increased from 15.5 km2 in 2020 to 15.7 km2 in 2022. In contrast, the impacted areas show a dramatic expansion in water surface coverage area from 900 km2 in 2019 to 1543.8 km2 in 2022, corresponding to a substantial growth of about 71% (). However, in 2020, almost the entire study area, with an exception of Section B, experienced a slight decrease in the water surface coverage area. This decrease represents a contraction of approximately 6.3% in Section A, which is similar to an average reduction of 7.7% in Sections C to G, in which the highest reduction of around 16.2% and 11.3% is found in Sections E and F, respectively.
On the other hand, in Section B where the GERD is located, the water surface coverage area expanded from 30 km2 in 2019 to 206.1 km2 in 2020 (). This nearly 7-fold expansion (see ) aligns with the first filling phase which started on 8 July 2020 (Samra and Ali Citation2021). There are two possible explanations for the decrease in water surface coverage area in 2020 in Sections C to G. The first could be attributed to the intertwined relationship between rainfall and the first filling phase, which results in upstream water retention leading to a reduction in downstream water from Sections C to G. According to Salama et al. (Citation2022), the first filling of the GERD posed significant concerns to the Roseires and Sennar Dams. The lack of knowledge about how the GERD would be managed could have led to suboptimal management of the Roseires and Sennar Dams (Salama et al. Citation2022). This could have resulted in a decrease in the surface areas of the reservoirs and downstream flow.
Figure 6. Blue Nile water surface coverage area in section B; a) before GERD construction, b) finalising the construction stage (2019), c) after the first filling stage (2020) where the surface area reached 206.1 km2, d) after the second filling stage (2021) with an expansion of 374.5 km2, and e), after third filling stage (2022) representing a total of 721.6 km2 of water surface coverage area.
The second possible explanation could be that all changes in Sections C to G resulted from the drop in the total amount of precipitation: compared to 2019, the precipitation in 2020 showed a drop of around 40 mm (see ), with the operation of the GERD causing lesser or no impacts at all. This scenario is supported by the fact that the control area also experienced a decline in water surface coverage area, indicating that the overall reduction along the Blue Nile is unlikely to be directly related to the GERD filling stage. The impacted areas, on average, represented an expansion of around 4 km2 (approximately 4%) in 2021, except for Section B. A similar trend was observed in 2022, where, on average, impacted areas showed a 2% increase in water surface coverage area (excluding Sections B and C).
As described above, most of the sections of the impacted areas experience slight increases except for Section B which demonstrates a sharp rise in 2021 and 2022 ().
This expansion of the Blue Nile’s surface area corresponds to the second filling phase completed on 19 July 2021 (Samra and Ali Citation2021), while the third filling phase completed in 12 August 2022 was responsible for the expansion of Section B in 2022 (see ). This remarkable surge in water surface coverage area significantly alters the overall water surface coverage area of the Blue Nile (). Notably, Section B experiences an impressive increase of over 27 times from 2011 to 2022. This clearly shows the impact of GERD construction and its substantial water retention capabilities, leading to a dramatic expansion of the reservoir. This section stretches over 131 km, and the increase in its water surface coverage area (nearly 700 km2 from 2011 to 2022) signifies that the widespread flooding may have submerged vast stretches of riverside forests or riverine vegetation, which could result in severe ecological consequences. This inundation is highly likely to lead to significant loss of terrestrial wildlife, as reported e.g. by Morsy et al. (Citation2021).
Section C provides some insights into the river’s streamflow behavior directly downstream of the GERD site. It is expected that this section offers most information on GERD’s impacts on river flow. Spanning approximately 121 km, Section C houses the Roseires Dam. While most of the sections in the impacted areas show a slight expansion, Section C experiences a 4.9% decline in water surface coverage area from 540.5 km2 in 2021 to 514.1 km2 in 2022 (). This decrease could be partly explained by water retention upstream to fill the GERD Dam. When analyzing the river’s behavior downstream (in Section D), it becomes evident that while Section C witnesses a reduction in water surface coverage area, Section D experiences a gradual increase in water surface coverage area from 2020 to 2022 (). This pattern may suggest active water management at the Roseires Dam, releasing larger volumes to downstream communities. However, to fully understand the events taking place in Section C, additional analysis is included.
The findings in Section C raise the expectation that the most significant changes may occur immediately downstream of the dams. Therefore, a study area spanning 50 km downstream from each dam has been established for a more in-depth analysis (cf. ). This distance range is based on the observation that the range from the GERD to the end of the Roseires Dam is approximately 30 km, but as this limit is not clear, we decide to include an additional 20 km for further observations. Thus, to maintain consistency in data analysis and results, we considered a 50 km section immediately downstream of each of the three dams: the GERD, the Roseires, and the Sennar Dams. This approach ensures that the impacts are examined in comparable contexts across all three dams.
Figure 7. Detailed analyses downstream of the three dams. a) study area represented by sections a to G with the red rectangles indicating the 50-km sections selected for downstream analysis of the three dams. Water surface coverage area within 50 km downstream of the GERD dam (b, e), 50 km and 180 km downstream of the roseires dam (c, f), and 50 km downstream of the sennar dam (d).
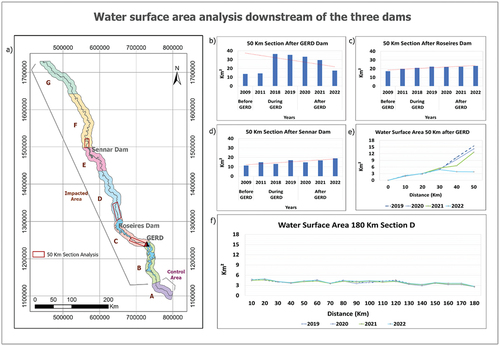
The results highlight different trends in water surface coverage areas downstream from the three dams from 2020 to 2022. A significant reduction of about 47% is observed at 50-km downstream of the GERD (), while a 3–4% fluctuating increase is noted in the area 50 km downstream from the Roseires Dam (). Finally, a continuous rise reaching a 28% increase is found in the region at 50-km downstream of the Sennar Dam (). The significant decrease in the water surface coverage area downstream of the GERD contrasts with the overall increase in the Blue Nile’s water surface coverage area from 2020 to 2022, in the 50 km impact analysis. However, when analyzing the area at every 10 km, almost no changes are observed in the first 30-km downstream of the GERD (), indicating a minimal visible impact of the GERD on its immediate surroundings. This 10-km analysis is also extended along Section D ().
The remaining 20 km, on the other hand, demonstrates different changes experiencing a progressive reduction of the water surface coverage area (). The cause of this reduction is not yet clear. One possible explanation is that this 20-km area may belong to the upper end of the Roseires reservoir, suggesting that the reduction in water surface coverage may be related to dam management. This could support the previous statement that the Roseires Dam released more water. This inference is made under the assumption that the Roseires Dam management may not yet fully understand the operational characteristics of the GERD. They may be attempting to strike a delicate balance between preserving reservoir levels and ensuring downstream regions have adequate water supply. Under this premise, it could also be said that should the GERD dam impact the Blue Nile waters, the Roseires Dam could play a critical role in this system, acting as a buffer in mitigating possible impacts imposed by the GERD and serving as a conduit between the GERD and downstream communities. Consequently, the situation emphasizes the importance of communication and cooperation between Ethiopia and Sudan to optimize river flow management, which could help mitigate potential downstream impacts. By managing their dams effectively, particularly in controlling water releases to ensure minimal downstream flow and potential floodwaters, while maintaining as much storage volume as possible, Roseires and Sennar Dams could reduce potential impacts (Wheeler et al. Citation2016).
Another possible explanation for the decrease in water surface coverage in the 20-km section upstream of the Roseires lake is that the terrain in this area is flatter, which allows for the accumulated sediments creating vast areas of deposition. This inference could be supported by including a DEM of the area or a bathymetric model to show changes of the river/lake surface, but this is beyond the scope of this study. The third possible explanation may also lack clarity. This considers evaporation as a possible cause, as the lake may be shallow in this 20-km area, allowing for higher rates of evaporation. This scenario would also link to GERD management, as dam reservoirs tend to increase the surface area of river water exposed to the atmosphere due to the expanded water surface coverage and longer retention time. This exposure could alter the thermal dynamics of the river water downstream, raising both the highest and lowest daily water temperatures, with implications extending over tens of kilometers (Elagib and Basheer Citation2021).
From the above scenarios, it is more likely that the cause of contraction in the 20-km area may be due to Roseires Dam management, with the GERD not causing major impacts at this third filling stage, likely lessens any impacts. This observation aligns with a study conducted by Li et al. (Citation2022), who stated that the GERD will maintain normal water flow, except during extended periods of drought. However, new dams generally cause impacts after the first decade of their operation (Fukuoka et al. Citation2013). Considering the size of the GERD, it is anticipated that its effects will be felt earlier, with significant issues possibly arising approximately seven years after it becomes operational (Kamara, Ahmed, and Benavides Citation2022). One of the factors that might contribute most to these impacts is evaporation. As the GERD reservoir’s surface area expands, the evaporation volume is projected to be between 826 and 1960 mm3 (Elagib and Basheer Citation2021). Furthermore, the GERD’s anticipated role in regulating water flow would necessitate that the Roseires and Sennar situated downstream of the GERD maintain higher and consistent water levels (Wheeler et al. Citation2016). This change in the operation of these three dams could subsequently elevate their levels of water evaporation.
The minor changes observed in the sections downstream of the Roseires and Sennar Dams suggest that these areas are potentially less or not influenced by the operation of the GERD (). These findings align with a simulation study conducted by Mulat and Moges (Citation2014), which pointed to the fact that the filling of the GERD does not affect other reservoirs in Sudan and could even lead to enhanced energy production. By separating the results from Sections, A and B, the impact of the GERD on the water dynamics of the Blue Nile can be identified.
This approach identified an increase in water levels by 1.93% in 2020 and 1.78% in 2022 compared to the baseline year of 2018. These changes are attributed to the river flow from the GERD site until it reaches Khartoum (around 810 km downstream). To perform this analysis, the reference year selected is 2018 instead of 2019 due to the exceptional amount of rainfall received in 2019 (Elagib et al. Citation2021).
3.2. Geomorphological changes along the Blue Nile
Different geomorphological patterns are observed along the Blue Nile during the study period signifying a dynamic and evolving river system. Key changes noted are related to riverbank and riverine vegetation, which face considerable erosion, likely due to changes in the water flow. Furthermore, a distinct shift in sediment load and bank accumulation is noticed. These fluctuations in sediment load and bank accumulation affect the river morphology, possibly leading to alterations in the river’s course over time (Ahmed and Fawzi Citation2011; Negm, Abdel-Aziz, et al. Citation2017).
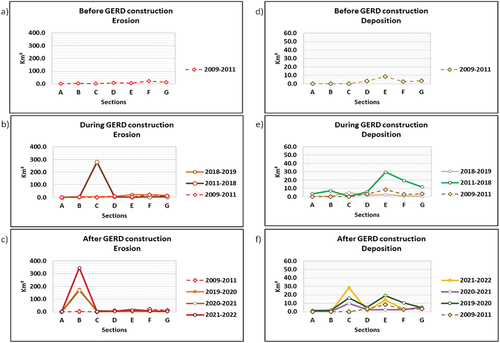
Analysis of the geomorphology of the Blue Nile region showed that in the control area erosion values varied between 0.2 km2 and 1.8 km2, while deposition values ranged from 0.01 km2 to 3.4 km2. These findings suggest that the control area experiences a relatively stable geomorphological environment during the studied years. In contrast, the impacted areas experience substantial geomorphological changes. Erosion increased significantly from 49.4 km2 before the GERD construction to a peak at 376.5 km2 in the 2021–2022 period. Deposition also increased from 18.0 km2 in the period before the GERD construction (2009–2011) to a peak at 74.0 km2 during 2011–2018 (). The contrasting rates of geomorphological change between the control and impacted areas suggest a significant influence of the GERD. The dam’s construction and operation appear to have greatly increased erosion and deposition rates in the areas that are directly impacted (Sections B and C), demonstrating the dam’s substantial effect on the region’s geomorphology.
Figure 8. Changes of erosion (left panel) and deposition (right panel) along the Blue Nile before (a, d), during (b, e), and after (c, f) GERD construction.
3.2.1. Before GERD construction (2009–2011)
During this period, the control area experienced minor changes (), with an erosion of 1.0 km2 and a deposition of 0.01 km2. In contrast, the areas downstream from the control area had a significant increase in erosion between 2009 and 2011, with an approximate total of 48.3 km2 of land eroded (). This erosion process likely contributed to an increase in deposition downstream, with an estimated rise of around 18 km2. The moderate erosion may be a response to the increase of rainfall in 2011. Increasing precipitation leads to an increase in river discharge and velocity (Ali Citation2014). This can result in greater erosion along the riverbanks and riverbed (Saber Citation2013). The primary erosion process in a fluvial environment is arguable lateral migration of the river channel (Bhuiyan, Kumamoto, and Suzuki Citation2015). Fluvial erosion occurs when water carries and transports sediments along the river, particularly during periods of heavy rainfall. This can lead to the wearing away of riverbanks, changes in the riverbed, and sediment removal (Ahmed and Fawzi Citation2011). Particularly, Section F within the study area exhibited the highest increase in erosion (20.5 km2), which is expected as it receives additional contributions from the Dinder and Rahad Rivers. Conversely, Section E has experienced the most significant sediment deposition, indicating a high sediment load in that area ().
3.2.2. After GERD construction (2011–2022)
a. Construction stage
i. Stage A (2011–2018)
During this period, the control area had minimal erosion and a maximum deposition of 3.4 km2, indicating relatively stable conditions. In contrast, the impacted areas showed significant increases in both erosion and deposition between 2011 and 2018. The area affected by erosion expanded to 301.7 km2, while deposition areas increased to 41.6 km2 (). Notably, Section C had the most substantial changes in erosion, with an increase from 0.2 km2 in 2011 to 280.4 km2 by 2018. This significant increase in eroded areas can be directly attributed to the enhancement of the Roseires Dam in 2013 (Ali Citation2014; Ali et al. Citation2018; Muala et al. Citation2014), which led to the expansion of the reservoir, resulting in a larger surface area being inundated. ().
Figure 9. Geomorphological changes of the river channel. The erosion of the river channel in 2018 compared to 2011 in section C is represented in hatched red (a and b). Deposition areas are illustrated in yellow color and represent contraction of river channel in 2022 compared to 2019 (c). The erosion of the river channel in 2022 (compared to 2019) in section B is represented in (d).
Additionally, Sections E, F, and G recorded the highest sediment deposition during this period, likely due to the upstream erosion. The average sediment deposition for these three sections increased from 4.9 km2 to 20.2 km2 ().
ii. Stage B (2018–2019)
The erosion in the control area showed a slight rise, expanding from 0.2 km2 to 1.6 km2, while deposition was minimal. This increase in erosion can be linked to elevated precipitation levels experienced in the region during that particular year (Khaki and Awange Citation2021; Wainwright et al. Citation2020). Similarly, the impacted areas had a considerable increase in river channel erosion, particularly in Sections E to G, showing an average erosion of approximately 20.3 km2. This may be attributed primarily to the Dinder and Rahad Rivers, contributing a substantial amount of sediment to the Blue Nile, along with the presence of meandering channels, particularly in Sections F and G, which amplifies the erosion and deposition processes (Ahmed and Fawzi Citation2011), further contributing to the observed changes in erosion dynamics. Considering that the upstream areas also display a proportional increase in eroded areas, including Section B, it can be inferred that these changes are not caused by dam construction activities ().
b. Infilling stage (2019–2022)
After the completion of the dam, the control area did not experience significant geomorphological changes, with erosion and deposition values remaining below 1.6 km2 and 1.4 km2 respectively. In contrast, the impacted areas had substantial geomorphological transformations.
Erosion rates increased significantly during the first, second, and third filling stages, reaching 186.9 km2/year, 211.1 km2/year, and 375.9 km2/year, respectively (). Deposition areas covered 56.3 km2, 22.9 km2, and 50 km2 during each filling stage. However, most of these changes happened in Section B for erosion (90%), and in Section C for deposition, while the other sections experienced minor alterations in the river channel (). The total eroded area in Section B during the three filling stages was 693.8 km2 (). In general, geomorphological changes in this area are due to the rapid rise in water surface coverage area. This accelerated expansion in water area from 2019 to 2022 led to considerable erosion and submerged areas around Section B (Morsy, Abdelatif, and Mostafa Citation2021).
On the other hand, Section C represents the highest deposition rate, with an average rate of 18.1 km2/year during the three filling stages, resulting in a total of 54.4 km2 of deposited areas (). The 50-km analysis highlights that minor geomorphological changes occur downstream of the Roseires and Sennar Dams (). However, an exception is observed in the section located at 50 km downstream of the GERD Dam, where a significant increase in deposited areas stands out, while erosion does not appear to be prevalent ().
Figure 10. 50-km section analysis of long-term geomorphological changes downstream of the GERD dam (a), Roseires dam (b), and sennar dam (c). 10-km section analyses up to 50 km downstream of the GERD dam assessing geomorphological changes (d, e and f), and up to 180 km downstream of the Roseires dam covering the entire section D (g, h, and i).
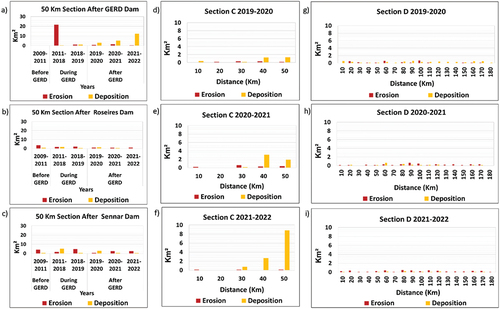
A closer examination of the 50-km analysis shows that, within the first 30 km downstream of the GERD location, no significant changes are observed. However, between 30 km and 50 km, a remarkable deposition process is revealed, which appears to gradually increase from 2020 to 2022 (). In typical circumstances, water/sediment retention in upstream reservoirs lead to channel narrowing, increased riverbed depth, channel erosion in some areas and sediment deposition in others (Graf Citation2006; Kale and Ataol Citation2021; Schmidt and Wilcock Citation2008). However, this pattern appears different here. The rate of erosion seems minimal compared to the deposited material, and the river channel width in the first 30-km remains mostly unchanged, contrary to the expected channel width reduction. Therefore, the increasing deposition trend likely links to the management of the Roseires Dam.
The 10-km analysis in Section D indicates that water release from the Roseires Dam exposes previously submerged areas, suggesting a connection with land exposure (). Another possible explanation for the increment in sediments in the 30-km to 50-km section upstream of the Roseires reservoir is the relatively flat surface, which allows accumulated sediments to create extensive deposition areas. While this inference could be corroborated with the use of a DEM or a bathymetric model, such an approach falls beyond the scope of this study, as mentioned in Section 3.1.2, Sub-Section b (Infilling Stage: 2020–2022).
While the results may not reveal significant changes attributed to the GERD dam on the Blue Nile, in Section B, noticeable alterations have become evident. It is important to recognize that other factors may play a significant role here, especially since the reservoir is positioned immediately downstream from Ethiopia’s highlands. Consequently, it is plausible that substantial sediment deposits are accumulating in the reservoir. Different authors have studied this phenomenon (e.g. El Bastawesy, Gabr, and Mohamed Citation2015; Li et al. Citation2022), emphasizing that sediment accumulation within the GERD’s reservoir could potentially shorten its lifespan, leading to water scarcity and diminished energy production (Kale and Ataol Citation2021). Hence, one of the proposed research avenues for comprehending GERD dam dynamics is a study focused on sedimentation. Additionally, given that a significant portion of the sediments is likely to be trapped in the reservoir, it is reasonable to assume that water flow patterns may also undergo changes, possibly resulting in the formation of islands or sandbars. Consequently, a study investigating sandbar or island formation may provide a better understanding on river morphological processes (Raslan and Salama Citation2015).
4. Conclusions
This study has analyzed water surface coverage changes and geomorphological changes of the Blue Nile associated with the construction and operation of the GERD using Landsat 5, Sentinel-2 imagery, and CHIRPS precipitation data. The analyses have been conducted with the control and impacted areas, with different sections and time periods before (2009–2011), during (2011–2019), and after (2020–2022) GERD construction.
The most significant change in water surface coverage area, as expected, was observed at the construction site of the GERD (Section B), which expanded substantially from 30 km2 in 2019 to 721 km2 in 2022. On the other hand, the river flow from the GERD site to Khartoum exhibited a modest rise in water levels, with a 1.93% increase in 2020 and a 1.78% increase in 2022 compared to 2018. However, no significant changes in water surface coverage area were observed within the first 30 km downstream of the GERD Dam or the subsequent 180 km downstream of the Roseires Dam.
The geomorphological changes observed in the Blue Nile between 2011 and 2019 were primarily attributed to two factors, the enhancement of the Roseires Dam wall and climate variability. Notably, the construction of the GERD did not appear to exert a major influence on the river flow during this period. However, a significant expansion in water surface coverage area at the GERD Dam between 2020 and 2022 resulted in heightened erosion rates within Section B. Additionally, the increased deposition rates observed around 30 km downstream of the GERD site may be attributed to the management of the Roseires Dam rather than the direct influence of the GERD on the river system.
In the event that the GERD has an impact on the Blue Nile water, the Roseires Dam could serve as a vital intermediary, minimizing potential effects caused by the GERD and acting as a link between the GERD and the downstream communities.
While this study did not identify significant impacts of the GERD dam on the Blue Nile, except for those reported in Section B, it is worth considering that the effects of the GERD may become more pronounced in the near future. Therefore, future research of a similar nature may be necessary to monitor any emerging impacts on the Blue Nile. Additionally, further studies could be considered to enhance the understanding of the GERD dam’s dynamics and its potential interactions with the Blue Nile River system. These studies might encompass thermal dynamics downstream the GERD dam, sandbars dynamics along the river channel to investigate water energy and sediments behavior, bathymetric models or LiDAR data to analyzed topography of the riverbed and measurements of channel incision, or the study of thalweg line shifting over time to assess alterations in the river’s deepest channel and their influence on sediment transport and riverbed morphology.
Given the interconnected nature of the Blue Nile, the study highlights the importance of adopting a comprehensive and cooperative approach to river management, which is crucial for promoting environmental conservation and ensuring the sustainable utilization of water resources (El-Rawy).
Disclosure statement
No potential conflict of interest was reported by the author(s).
Data availability statement
The data that support the findings of this study are available from the corresponding author, Yongze Song, upon reasonable request.
References
- Ahmed, A. A., and A. Fawzi. 2011. “Meandering and bank erosion of the River Nile and its environmental impact on the area between Sohag and El-Minia.” Arabian Journal of Geosciences 4 (1–2): 1–24. https://doi.org/10.1007/s12517-009-0048-y.
- Ali, Y. S. A. 2014. “The Impact of Soil Erosion in the Upper Blue Nile on Downstream Reservoir Sedimentation.” Phd thesis, Delft University.
- Ali, Y. S. A., P. Paron, A. Crosato, and Y. A. Mohamed. 2018. “Transboundary Sediment Transfer from Source to Sink Using a Mineralogical Analysis. Case Study: Roseires Reservoir, Blue Nile, Sudan.” International Journal of River Basin Management 16 (4): 477–491. https://doi.org/10.1080/15715124.2017.1411919.
- Antoine, G., B. Camenen, M. Jodeau, J. N´emery, and M. Esteves. 2020. “Downstream Erosion and Deposition Dynamics of Fine Suspended Sediments Due to Dam Flushing.” Journal of Hydrology 585 (124): 763. https://doi.org/10.1016/j.jhydrol.2020.124763.
- Asfaw, A., B. Simane, A. Hassen, and A. Bantider. 2018. “Variability and Time Series Trend Analysis of Rainfall and Temperature in Northcentral Ethiopia: A Case Study in Woleka Subbasin.” Weather and Climate Extremes 19:29–41. https://doi.org/10.1016/j.wace.2017.12.002.
- Awange, J. L. 2021a. Lake Victoria Monitored from Space, 1–321. Springer. https://doi.org/10.1007/978-3-030-60551-3.
- Awange, J. L. 2021b. The Nile Waters, Weighed from Space, 1–267. Springer. https://doi.org/10.1007/978-3-030-64756-8.
- Awange, J. L., E. Forootan, M. Kuhn, J. Kusche, and B. Heck. 2014. “Water Storage Changes and Climate Variability within the Nile Basin Between 2002 and 2011.” Advances in Water Resources 73:1–15. https://doi.org/10.1016/j.advwatres.2014.06.010.
- Awange, J. L., M. Gebremichael, E. Forootan, G. Wakbulcho, R. Anyah, V. G. Ferreira, and T. Alemayehu. 2014. “Characterization of Ethiopian Mega Hydrogeological Regimes Using GRACE, TRMM and GLDAS Datasets.” Advances in Water Resources 74:1–46. https://doi.org/10.1016/j.advwatres.2014.06.010.
- Awange, J. L., K. X. Hu, and M. Khaki. 2019. “The Newly Merged Satellite Remotely Sensed, Gauge and Reanalysis-Based Multi-Source Weighted-Ensemble Precipitation: Evaluation Over Australia and Africa (1981–2016).” Science of the Total Environment 670:448–465. https://doi.org/10.1016/j.scitotenv.2019.03.148.
- Basheer, M.2021. Cooperative Operation of the Grand Ethiopian Renaissance Dam Reduces Nile Riverine Floods, Vol. 37, 805–814. https://doi.org/10.1002/rra.3799.
- Bhuiyan, M. A., T. Kumamoto, and S. Suzuki. 2015. “Application of Remote Sensing and GIS for Evaluation of the Recent Morphological Characteristics of the Lower Brahmaputra-Jamuna River, Bangladesh.” Earth Science Informatics 8 (3): 551–568. https://doi.org/10.1007/s12145-014-0180-4.
- Bing, H., Y. Liu, J. Huang, X. Tian, H. Zhu, and Y. Wu. 2022. “Dam Construction Attenuates Trace Metal Contamination in Water Through Increased Sedimentation in the Three Gorges Reservoir.” Water Research 217:1–13. https://doi.org/10.1016/j.watres.2022.118419.
- Bleischwitz, R., S. Kirschke, and N. Adam. 2021. “Implications of the Resource Nexus on International Relations: The Case of the Grand Ethiopian Renaissance Dam.” Zeitschrift fu¨r Außen- und Sicherheitspolitik 14:1–14. https://doi.org/10.1007/s12399-021-00878-1.
- Brandt, S. A., and J. Swenning. 1999. “Sedimentological and Geomorphological Effects of Reservoir Flushing: The cach´ı Reservoir, Costa Rica, 1996.” Geografiska Annaler, Series A: Physical Geography 81 (3): 391–407. https://doi.org/10.1111/j.0435-3676.1999.00069.x.
- Chen, J., P. Wang, C. Wang, X. Wang, H. Gao, G. Cui, S. Liu, and Q. Yuan. 2022. “How Dam Construction Affects the Activity of Alkaline Phosphatases in Reservoir Sediments: A Study of Two Highly Regulated Rivers.” Environmental Research 207:1–11. https://doi.org/10.1016/j.envres.2021.112236.
- Conway, D. 2005. “From Headwater Tributaries to International River: Observing and Adapting to Climate Variability and Change in the Nile Basin.” Global Environmental Change 15 (2): 99–114. https://doi.org/10.1016/j.gloenvcha.2005.01.003.
- Dewan, A., R. Corner, A. Saleem, M. M. Rahman, M. R. Haider, M. M. Rahman, and M. H. Sarker. 2017. “Assessing Channel Changes of the Ganges-Padma River System in Bangladesh Using Landsat and Hydrological Data.” Geomorphology 276:257–279. https://doi.org/10.1016/j.geomorph.2016.10.017.
- Du, Y., Y. Zhang, F. Ling, Q. Wang, W. Li, and X. Li. 2016. “Water Bodies’ Mapping from Sentinel-2 Imagery with Modified Normalized Difference Water Index at 10-M Spatial Resolution Produced by Sharpening the SWIR Band.” Remote Sensing 8 (4): 1–19. https://doi.org/10.3390/rs8040354.
- Elagib, N. A., and M. Basheer. 2021. “Would Africa’s Largest Hydropower Dam Have Profound Environmental Impacts?” Environmental Science and Pollution Research 28 (7): 8936–8944. https://doi.org/10.1007/s11356-020-11746-4.
- Elagib, N. A., I. S. A. Zayed, S. A. Saad, M. I. Mahmood, M. Basheer, and A. H. Fink. 2021. “Debilitating Floods in the Sahel Are Becoming Frequent.” Journal of Hydrology 599:126362. https://doi.org/10.1016/j.jhydrol.2021.126362.
- El Aoula, R., N. Mhammdi, L. Dezileau, G. Mahe, and A. S. Kolker. 2021. “Fluvial Sediment Transport Degradation After Dam Construction in North Africa.” Journal of African Earth Sciences 182 (104): 255. https://doi.org/10.1016/j.jafrearsci.2021.104255.
- El-Askary, H., A. Fawzy, R. Thomas, W. Li, N. Lahaye, E. Linstead, T. Piechota, D. Struppa, and M. A. Sayed. 2021. “Assessing the Vertical Displacement of the Grand Ethiopian Renaissance Dam During Its Filling Using DInSAR Technology and Its Potential Acute Consequences on the Downstream Countries.” Remote Sensing 13 (21): 1–25. https://doi.org/10.3390/rs13214287.
- El Bastawesy, M., S. Gabr, and I. Mohamed. 2015. “Assessment of Hydrological Changes in the Nile River Due to the Construction of Renaissance Dam in Ethiopia.” The Egyptian Journal of Remote Sensing & Space Science 18 (1): 65–75. https://doi.org/10.1016/j.ejrs.2014.11.001.
- El-Rawy, M., H. E. Moghazy, and M. G. Eltarabily. 2021. “Impacts of Decreasing Nile Flow on the Nile Valley Aquifer in El-Minia Governorate, Egypt.” Alexandria Engineering Journal 60:2179–2192. https://doi.org/10.1016/j.aej.2020.12.037.
- Fukuoka, S., H. Nakagawa, T. Sumi, and H. Zhang. 2013. Advances in River Sediment Research: proceedings of the 12th International Symposium on River Sedimentation, ISRS 2013, Kyoto, Japan, 2-5 September 2013, 203.
- Geyer, S., I. Papaioannou, L. Graham-Brady, and D. Straub. 2022. “The Spatial Averaging Method for Non-Homogeneous Random Fields with Application to Reliability Analysis.” Engineering Structures 253:1–33. https://doi.org/10.1016/j.engstruct.2021.113761.
- Gierszewski, P. J., M. Habel, J. Szman´da, and M. Luc. 2020. “Evaluating Effects of Dam Operation on Flow Regimes and Riverbed Adaptation to Those Changes.” Science of the Total Environment 710:1–14. https://doi.org/10.1016/j.scitotenv.2019.136202.
- Graf, W. L. 2006. “Downstream Hydrologic and Geomorphic Effects of Large Dams on American Rivers.” Geomorphology 79 (3–4): 336–360. https://doi.org/10.1016/j.geomorph.2006.06.022.
- Gurnell, A. M., S. R. Downward, and R. Jones. 1994. “Channel Planform Change on the River Dee Meanders, 1876–1992.” Regulated Rivers: Research & Management 9 (4): 187–204. https://doi.org/10.1002/rrr.3450090402.
- Hassaballah, K., Y. Mohamed, S. Uhlenbrook, and K. Biro. 2017. “Analysis of Streamflow Response to Land Use and Land Cover Changes Using Satellite Data and Hydrological Modelling: Case Study of Dinder and Rahad Tributaries of the Blue Nile (Ethiopia–Sudan).” Hydrology and Earth System Sciences 21 (10): 5217–5242. https://doi.org/10.5194/hess-21-5217-2017.
- Hsu, J., W. R. Huang, P. Y. Liu, and X. Li. 2021. “Validation of CHIRPS Precipitation Estimates Over Taiwan at Multiple Timescales.” Remote Sensing 13 (2): 1–18. https://doi.org/10.3390/rs13020254.
- Ibitoye, M. O. 2021. “A Remote Sensing-Based Evaluation of Channel Morphological Characteristics of Part of Lower River Niger, Nigeria.” SN Applied Sciences 3 (3): 1–12. https://doi.org/10.1007/s42452-021-04215-1.
- Kale, M. M., and M. Ataol. 2021. “The Effects of Dams on River Channel Morphology: A Case Study at the Historical Çarşamba Bridge on the Yeşilırmak River in Northern Turkey.” Environmental Earth Sciences 80 (18): 1–15. https://doi.org/10.1007/s12665-021-09935-6.
- Kamara, A., M. Ahmed, and A. Benavides. 2022. “Environmental and Economic Impacts of the Grand Ethiopian Renaissance Dam in Africa.” Water (Switzerland) 14 (3): 312–318. https://doi.org/10.3390/w14030312.
- Kansara, P., W. Li, H. El-Askary, V. Lakshmi, T. Piechota, D. Struppa, and M. A. Sayed. 2021. “An Assessment of the Filling Process of the Grand Ethiopian Renaissance Dam and Its Impact on the Downstream Countries.” Remote Sensing 13 (4): 711–715. https://doi.org/10.3390/rs13040711.
- Khaki, M., and J. Awange. 2020. “Altimetry-Derived Surface Water Data Assimilation Over the Nile Basin.” Science of the Total Environment 735:1–10. https://doi.org/10.1016/j.scitotenv.2020.139008.
- Khaki, M., and J. Awange. 2021. “The 2019–2020 Rise in Lake Victoria Monitored from Space: Exploiting the State-Of-The-Art GRACE-FO and the Newly Released ERA-5 Reanalysis Products.” Sensors 21 (13): 4304–4319. https://doi.org/10.3390/s21134304.
- Langat, P. K., L. Kumar, and R. Koech. 2019. “Monitoring River Channel Dynamics Using Remote Sensing and GIS Techniques.” Geomorphology 325:92–102. 007. https://doi.org/10.1016/j.geomorph.2018.10.007.
- Li, P., Z. He, J. Cai, J. Zhang, M. Belete, J. Deng, and S. Wang. 2022. “Identify the Impacts of the Grand Ethiopian Renaissance Dam on Watershed Sediment and Water Yields Dynamics.” Sustainability 14 (13): 7590. https://doi.org/10.3390/su14137590.
- Liou, Y. A., and G. M. Mulualem. 2019. “Spatio–Temporal Assessment of Drought in Ethiopia and the Impact of Recent Intense Droughts.” Remote Sensing 11 (15): 1–19. https://doi.org/10.3390/rs11151828.
- Mahmoud, M. R., H. Fahmy, and L. A. Garcia. 2022. “Potential Impacts of Failure of the Grand Ethiopian Renaissance Dam on Downstream Countries.” Journal of Flood Risk Management 15:1–16. https://doi.org/10.1111/jfr3.12793.
- McFeeters, S. K. 1996. “The Use of the Normalized Difference Water Index (NDWI) in the Delineation of Open Water Features.” International Journal of Remote Sensing 17:1425–1432. https://doi.org/10.1080/01431169608948714.
- Morsy, K. M., G. Abdelatif, and M. K. Mostafa. 2021. “Comprehensive Assessment for the Potential Environmental Impacts of the Grand Ethiopian Renaissance Dam on the Downstream Countries: Itaipu Dam in the Rearview Mirror.” Air, Soil and Water Research 14:1–12. https://doi.org/10.1177/11786221211041964.
- Muala, E., Y. A. Mohamed, Z. Duan, and P. van der Zaag. 2014. “Estimation of Reservoir Discharges from Lake Nasser and Roseires Reservoir in the Nile Basin Using Satellite Altimetry and Imagery Data.” Remote Sensing 6 (8): 7522–7545. https://doi.org/10.3390/rs6087522.
- Mulat, A. G., and S. A. Moges. 2014. “Assessment of the Impact of the Grand Ethiopian Renaissance Dam on the Performance of the High Aswan Dam.” Journal of Water Resource and Protection 6 (06): 583–598. https://doi.org/10.4236/jwarp.2014.66057.
- Negm, A., T. M. Abdel-Aziz, M. N. Salem, and W. Yousef. 2017. Morphology of the Nile River Due to a Flow Rate Over the Maximum Current: Case Study Damietta Branch. Vol. 56, 239–258. Springer. https://doi.org/10.1007/698.2017.3.
- Negm, A., M. Elsahabi, R. El-Sayed, N. A. El-Basset, S. Ghaly, and K. Ali. 2017. Morphological Variation of the Nile River First and Second Reaches Using RS/GIS Techniques. Vol. 56, 147–170. Springer. https://doi.org/10.1007/698.2016.126.
- Pizzuto, J. 2002. “Effects of Dam Removal on River Form and Process.” BioScience 52 (8): 683–691. https://doi.org/10.1641/0006-3568(2002)052[0683:EODROR]2.0.CO;2.
- Raslan, Y. 2010. “Human Impacts on Nile River Morphology.” Fourteenth International Water Technology Conference, Cairo, Egypt, 221–236.
- Raslan, Y., and R. Salama. 2015. “Development of Nile River Islands Between Old Aswan Dam and New Esna Barrages.” Water Science 29 (1): 77–92. https://doi.org/10.1016/j.wsj.2015.03.003.
- Richard, G. A., P. Y. Julien, and D. C. Baird. 2005. “Statistical Analysis of Lateral Migration of the Rio Grande, New Mexico.” Geomorphology 71 (1–2): 139–155. https://doi.org/10.1016/j.geomorph.2004.07.013.
- Saber, M. E. E. 2013. Role of the Grand Ethiopian Renaissance Dam on Morphological Changes, Environmental and Hydro-Political Situation in the Nile Valley, Ph.D. thesis, MSc thesis, Politecnico di Milano, Milan.
- Sadek, N. 2013. “Island Development Impacts on the Nile River Morphology.” Ain Shams Engineering Journal 4 (1): 25–41. https://doi.org/10.1016/j.asej.2012.06.006.
- Salama, A., M. ElGabry, G. El-Qady, and H. H. Moussa. 2022. “Evaluation of Grand Ethiopian Renaissance Dam Lake Using Remote Sensing Data and GIS.” Water (Switzerland) 14 (19): 1–11. https://doi.org/10.3390/w14193033.
- Samra, R. M. A., and R. R. Ali. 2021. “Detection of the Filling Phases of the Grand Ethiopian Renaissance Dam Using Sentinel-1 SAR Data.” Egyptian Journal of Remote Sensing and Space Science 24 (3): 991–997. https://doi.org/10.1016/j.ejrs.2021.11.006.
- Schmidt, J. C., and P. R. Wilcock. 2008. “Metrics for Assessing the Downstream Effects of Dams.” Water Resources Research 44 (4). https://doi.org/10.1029/2006WR005092.
- Seshadri, A. K. 2017. “Statistics of Spatial Averages and Optimal Averaging in the Presence of Missing Data.” Spatial Statistics 25:1–33. https://doi.org/10.1016/j.spasta.2018.04.002.
- Shin, Y. H., and P. Y. Julien. 2011. “Effect of Flow Pulses on Degradation Downstream of Hapcheon Dam, South Korea.” Journal of Hydraulic Engineering 137 (1): 100–111. https://doi.org/10.1061/(asce)hy.1943-7900.0000287.
- Skalak, K. J., A. J. Benthem, E. R. Schenk, C. R. Hupp, J. M. Galloway, R. A. Nustad, and G. J. Wiche. 2013. “Large Dams and Alluvial Rivers in the Anthropocene: The Impacts of the Garrison and Oahe Dams on the Upper Missouri River.” Anthropocene 2:51–64. https://doi.org/10.1016/j.ancene.2013.10.002.
- Slowik, M., J. Dezs˝o, A. Marciniak, G. T´oth, and J. Kov´acs. 2018. “Evolution of River Planforms Downstream of Dams: Effect of Dam Construction or Earlier Human-Induced Changes?” Earth Surface Processes and Landforms 43 (10): 2045–2063. https://doi.org/10.1002/esp.4371.
- Sterk, G., F. Sperna-Weiland, and M. Bierkens. 2020. “Guest Editorial: Special Issue on Global Hydrological Datasets for Local Water Management Applications.” Water Resources Management 34 (7): 2111–2116. https://doi.org/10.1007/s11269-020-02550-3.
- Taye, M., D. Sahlu, B. F. Zaitchik, and M. Neka. 2020. “Evaluation of Satellite Rainfall Estimates for Meteorological Drought Analysis Over the Upper Blue Nile Basin, Ethiopia.” Geosciences (Switzerland) 10 (9): 1–22. https://doi.org/10.3390/geosciences10090352.
- Vanmarcke, E., and M. Grigoriu. 1983. “Stochastic Finite Element Analysis of Simple Beams.” Journal of Engineering Mechanics 109 (5): 1203–1214. https://doi.org/10.1061/(ASCE)0733-9399(1983)109:5(1203).
- Wainwright, C. M., D. L. Finney, M. Kilavi, E. Black, and J. H. Marsham. 2020. “Extreme Rainfall in East Africa, October 2019–January 2020 and Context Under Future Climate Change.” Weather 76 (1): 26–31. https://doi.org/10.1002/wea.3824.
- Wang, H., X. Wu, N. Bi, S. Li, P. Yuan, A. Wang, J. P. Syvitski, et al. 2017. “Impacts of the Dam-Orientated Water-Sediment Regulation Scheme on the Lower Reaches and Delta of the Yellow River (Huanghe): A Review.” Global and Planetary Change 157:93–113. https://doi.org/10.1016/j.gloplacha.2017.08.005.
- Wheeler, K. G., M. Basheer, Z. T. Mekonnen, S. O. Eltoum, A. Mersha, G. M. Abdo, E. A. Zagona, J. W. Hall, and S. J. Dadson. 2016. “Cooperative Filling Approaches for the Grand Ethiopian Renaissance Dam.” Water International 41 (4): 611–634. https://doi.org/10.1080/02508060.2016.1177698.
- Woldemichael, A. T., F. Hossain, R. Pielke, and A. Beltr´an-Przekurat. 2012. “Understanding the Impact of Dam-Triggered Land Use/Land Cover Change on the Modification of Extreme Precipitation.” Water Resources Research 48 (9): 1–16. https://doi.org/10.1029/2011WR011684.