
 ?Mathematical formulae have been encoded as MathML and are displayed in this HTML version using MathJax in order to improve their display. Uncheck the box to turn MathJax off. This feature requires Javascript. Click on a formula to zoom.
ABSTRACT
The cellular automata (CA) model is the predominant method for predicting land use and land cover (LULC) changes. The accuracy of this model critically depends on well-defined transition rules, which encapsulate the local dynamics of complex systems and facilitate the manifestation of organized global patterns. While current studies largely concentrate on land use transition matrices as core elements of these rules, exclusive reliance on these matrices is insufficient for capturing the full spectrum of land use change potential. Addressing this gap, our research introduces the adaptive transition probability matrix with quality seeds (ATPMS) model, which incorporates both the Markov model and the genetic algorithm (GA) into the traditional CA framework. Furthermore, an artificial neural network (ANN) is utilized to determine land suitability. Implemented in Beijing, Wuhan, and the Pearl River Delta (PRD), our results indicate that the ATPMS-ANN-CA model surpasses the standard Markov-ANN-CA model in various validation metrics, displaying improvements in overall accuracy (OA) by 0.03% to 0.74% and figure of merit (FoM) by 3.67% to 63.14%. Additionally, the ATPMS-ANN-CA model excels in providing detailed landscape analysis.
1. Introduction
Land use and land cover (LULC) patterns are crucial in determining the availability and distribution of natural resources, as well as the socio-economic conditions of a region (Bryan et al. Citation2018; Song et al. Citation2018). LULC change is among the most profound human impacts on ecosystems, and has been extensively studied across many disciplines, including meteorology (Gagne et al. Citation2015; Lu et al. Citation2023) and oceanography (Islam, Crawford, and Shao Citation2023). With technological advancements and increasing populations, the Earth’s ecosystems are facing unprecedented changes in LULC at regional and global scales, with major potential implications for ecosystem services (Li et al. Citation2013; Mumtaz, Li, Liu, Arshad, et al. Citation2023), agriculture (Bey et al. Citation2016; Diehl et al. Citation2020), plant (Neff et al. Citation2023), animal diversity (Harding et al. Citation1998), climatic (Halder et al. Citation2022; Karimi et al. Citation2022, Citation2023), and carbon emissions (Mumtaz, Li, Liu, Tariq, et al. Citation2023; Selmants et al. Citation2021).
The advent of remote sensing (RS) and geographic information systems (GIS) technologies has enabled the creation of numerous LULC prediction models, which can facilitate decision-making and inform sustainable natural resource management (Liang et al. Citation2018, Citation2021; Xu et al. Citation2020; Zeng, Zhang, and Wang Citation2023; Zhang and Wang Citation2022). The more commonly used land use simulation models are Future Land Use Simulation (FLUS) (Liu et al. Citation2017), Patch-Generating Land Use Simulation (PLUS) (Liang et al. Citation2021), and CA-Markov (Pontius and Malanson Citation2005). These models seamlessly integrate various modeling techniques to elucidate the complex patterns of spatial land use distribution. The cellular automata (CA) model is particularly notable as the foundational framework central to the spatial pattern manipulation within these models. This preference is attributed to the CA model’s exceptional ability in spatial analysis and its predictive proficiency, as delineated by Zhang and Wang (Citation2021). Characterized by discrete temporal, spatial, and state variables, the CA model operates on the principles of raster-based neighborhood interactions. It consists of five critical components: the representation of the cell in space, the state of the cell, its neighborhood, the progression of discrete time steps, and the transition rules (Arora et al. Citation2021; Garcia et al. Citation2011; Kamusoko et al. Citation2009; Lagarias Citation2015; Li et al. Citation2017).
Transition suitability refers to the level of difficulty in transitioning between different land use types. It serves as a critical factor in determining the transfer patterns of various land use types, thus playing a pivotal role in establishing the transition rules that govern the behavior of the CA model. Previous research on the determination of transition suitability has focused on methods such as the Markov chain (Shikary and Rudra Citation2022; Wang and Zheng Citation2023; Yadav and Ghosh Citation2021; Yang et al. Citation2023), support vector machine (Jalayer et al. Citation2022), linear transition optimization the Markov model (Liu et al. Citation2023). The determination of transition suitability using the Markov model is founded on the computation of land use transfer matrices obtained from 2 or 3 periods of land use data. This approach can effectively improve the accuracy of land use modeling (Berberoglu, Akin, and Clarke Citation2016; Halmy et al. Citation2015). However, it is important to acknowledge the limitations of the Markov model in accurately discerning minor spatial errors and effectively simulating complex land use changes (Ahmed, Ahmed, and Zhu Citation2013). Moreover, given that machine learning algorithms such as Support Vector Machines require extensive databases for learning, this class of models is not within the scope of this study.
Thus, it becomes imperative to introduce optimization algorithms to facilitate the selection of parameters. Optimization algorithms emulate natural processes to tackle complex problems, exhibiting adaptability in intricate, uncertain, and dynamic environments. Prominent optimization algorithms encompass a variety of approaches, including Exact Algorithm (Guo et al. Citation2021), machine learning methods (ZiaeeVafaeyan, Moattar, and Forghani Citation2018), and genetic algorithms (GA) (Chen, Panahi, and Pourghasemi Citation2017; Naghibi, Ahmadi, and Daneshi Citation2017). When tackling complex land use simulation problems, Exact Algorithm have the capability to yield optimal solutions. Nonetheless, it is worth noting that the computational time necessary for executing Exact Algorithm experiences an exponential increase as the problem size expands (Guo et al. Citation2021). On the other hand, machine learning methods necessitate substantial costs for generating training sets, which may pose practical limitations in certain scenarios (ZiaeeVafaeyan, Moattar, and Forghani Citation2018). In contrast, GA offer a distinct approach by encoding the task allocation scheme within individuals, assessing their competitiveness through a fitness function, and subsequently searching for optimal individuals by emulating the process of natural evolution (Katoch, Chauhan, and Kumar Citation2021). GA initially proposed by the esteemed American scholar Holland (Citation1992), represent a form of collective intelligence optimization algorithm that operates on the principle of continuous adaptation and evolution of organisms through natural selection. In comparison to other algorithms, GA possess the ability to explore the global scope effectively. This is achieved through mechanisms such as crossover, mutation, and selection probabilities, enabling the algorithm to regenerate and exhibit improved resistance to local optima. Moreover, GA offer a high degree of generality, rendering them applicable across a wide range of domains (Katoch, Chauhan, and Kumar Citation2021). Premature convergence poses a significant challenge for the GA, particularly when dealing with complex multidimensional problems. Traditional methods used to address the issue of local optima include increasing the mutation probability (Hong, Wang, and Chen Citation2000), implementing an elitism preserving strategy (Shi et al. Citation2010), and incorporating quality seed implantation (Kabir et al. Citation2017). Therefore, the present study aims to introduce both the elitism preserving strategy and quality gene implantation into the GA framework. By incorporating these strategies, the study seeks to enhance the GA’s ability to overcome premature convergence and facilitate the exploration of a wider solution space. This endeavor involves leveraging the GA that integrates both the elitism preserving strategy and quality gene implantation, thereby offering a promising approach to mitigate premature convergence and improve the overall performance of the GA.
Based on the preceding analysis, we have developed the adaptive transition probability matrix with quality seeds (ATPMS), a pioneering method that harmonizes the strengths of genetic algorithms (GA) and Markov models within the cellular automata (CA) transition probability matrices. The central aim of this research is to design land use simulation models capable of adjusting to intricate and ever-changing land use scenarios, concurrently increasing simulation precision. The GA is utilized as an integral instrument in our study for deducing optimal parameter configurations, capitalizing on its prowess in global optimization. Additionally, this study used artificial neural networks (ANN) as a computational tool to determine transfer suitability metrics within the CA model. To substantiate and appraise our proposed approach, we concentrate our empirical analysis on three significant regions: Beijing, Wuhan, and the Pearl River Delta (PRD). Forecasting future land utilization patterns is a fundamental element of land use simulation models and a pivotal goal of this academic field (Liang et al. Citation2018; Liu et al. Citation2017). Nevertheless, accurately identifying the determinants of future land use patterns is fraught with difficulties. Thus, researchers typically employ the latest available data on these determinants to decipher the patterns of land use evolution (Zeng, Zhang, and Wang Citation2023; Zhang and Wang Citation2022). In this study, the calibration and validation phases are delineated by scrutinizing land use and driving factor data from 2000–2010, with 2010 as the anchor year. The decade following 2010 is then engaged as the validation phase, scrutinizing the model’s precision and consistency. Ultimately, the ATPMS-ANN-CA’s validity and accuracy are gauged against the ANN-CA and Markov-ANN-CA through comparative analysis.
2. Material and data sources
2.1. Study area
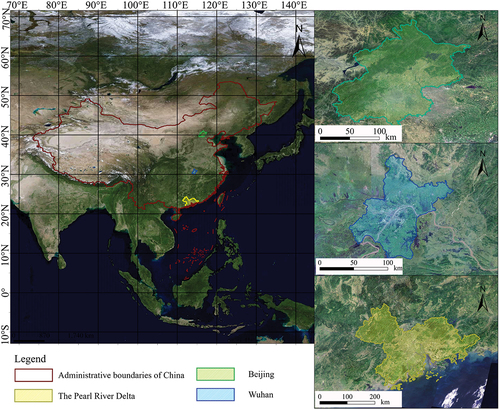
Beijing, the capital city of China, possesses immense political and economic significance. Spanning 16,385.80 km2, it functions as a critical cultural and administrative hub, making it an exemplary case study for analyzing urban land use complexities. From 2000–2020, Beijing experienced a significant urban expansion, with its urbanization rate climbing from 77.6%–92.8%, indicative of substantial land use transformations (Wu and Liu Citation2022).
Wuhan, located in central China, encompasses 8,506.23 km2 and is positioned at 113°53′ E longitude and 29°58′ N latitude. The city has risen as a pivotal urban center in the region, marked by a 4.2-fold increase in construction land from 2000–2020. Wuhan’s land use pattern, with its notable water bodies and extensive cropland, presents a fascinating case for examining the transitions among water bodies, cropland, and forests (Xiong et al. Citation2022).
The Pearl River Delta (PRD) covers 53,860.50 km2 and is strategically situated between latitudes 21° and 25° N and longitudes 110° and 116° E. It is one of China’s fastest-growing areas, with its population soaring from 42,897,800 in 2000 to 78,017,700 in 2020, accounting for 61.9% of the province’s total population. The PRD’s land use is distinguished by a heterogeneous composition of construction areas, water bodies, cropland, and varied topography. The region has undergone significant spatial and socio-economic transformations, making it a prime example for detailed examination of land use patterns in a highly urbanized and economically dynamic setting (Song et al. Citation2023).
In conclusion, these three regions provide a comprehensive framework for investigating varied land use profiles, scales, and urban development challenges across China. The thorough analysis and comparison of land use dynamics across these areas yield critical insights for urban planning and the promotion of sustainable development strategies ().
Figure 1. Geographic location of Beijing, Wuhan, and the Pearl River Delta in 2000.
2.2. Data resources
The land use data for the years 2000, 2010, and 2020 exhibit a classification accuracy surpassing 95% across all land use types (Kuang et al. Citation2022). Each simulation unit measured 30 m and underwent reclassification into one of six potential land use categories, including cropland, forest, grassland, water area, built-up land, and unused land. The driving factors encompass natural factors, accessibility factors, and socio-economic factors, which have been employed to assess the potential for land use change (Wang et al. Citation2010; Yang et al. Citation2019). Natural factors include indices such as the normalized difference vegetation index (NDVI), slope, and elevation (DEM) (Liang et al. Citation2021). Accessibility factors, as highlighted in previous research (He et al. Citation2022), encompass parameters like the distance to roads and railroads. Socio-economic factors, as explored by Wang et al. (Citation2010), encompass variables such as population and gross domestic product (GDP). Low-resolution data underwent a conversion process to achieve a 30 m resolution through raster resampling and kriging interpolation techniques. The land use dataset and spatial drivers utilized in this study were sourced from the RESDC of the Chinese Academy of Sciences (http://www.resdc.cn) and Open Street Map (https://www.openstreetmap.org) ().
Table 1. Details and generalization of each spatial variable.
3. Methodology
3.1. Workflow
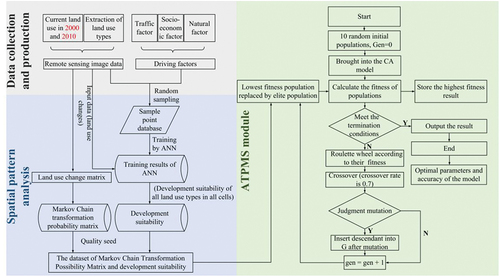
In this study, we introduced the research framework of the ATPMS-ANN-CA model, as illustrated in . This framework is composed of three primary components. The first component entails data collection and production. It involves extracting and pre-processing land use data and driving factors, as well as transforming all the data into raster data of consistent size. The second component focuses on spatial pattern analysis. Within this phase, spatial analysis and other techniques were used to extract the land use change matrix and development suitability data based on ANN. Lastly, the third component involves the ATPMS module. This module constructs the ATPMS-ANN-CA model by utilizing a Markov transition probability matrix alongside development suitability data obtained from the previous processing methods. To enhance the model, an optimized transition probability matrix is obtained through an improved GA and integrated into the model.
Figure 2. Methodological framework.
3.2. Cellular automata model and validation index
3.2.1. Cellular automata model
The focal point of the CA model lies in the definition of transition rules. These rules encompass an array of influences, employed to discern the ever-changing states of cellular entities as time progresses (Eq. 1).
Where IT is the total number of iterations, which is contingent upon the time nodes allocated to the terminus T2 and the initial stage T1 of the CA model. TS is the duration of each iteration. The simulation itself encompasses the time period from 2000–2010 and then further extends from 2010–2020, resulting in a grand total of 10 iterations for each temporal bracket (Eq. 2).
where Pij is transition probability, Ωij is neighborhood effects, Tij is transition probability matrix, PSij is suitability, which is derived through the utilization of ANN.
Moreover, it is imperative to emphasize the significance of clarifying transition rules in CA models that encompass multiple land use types. The CA model developed in this study holds the key to accurately predicting land use change through an iterative simulation process. In our research, the initial iteration involved a comprehensive analysis of the quantitative relationship between the initial and final areas of each land use type. Notably, this initial iteration focused on land use types that exhibited an increase in area. The number of iterations for all land use types within each cycle was contingent upon the time span and timestep. To illustrate, in this particular experiment, the calibration period spanned 10 years, with a timestep of 1 year, resulting in 10 iterations. In subsequent cycles, each land use type underwent calculation and simulation until the convergence condition was met. This condition was defined as the stabilization of cellular number or reaching a maximum of 5 simulations.
3.2.2. Validation coefficients
In this study, the evaluation of the CA model’s efficacy was carried out through the implementation of various metrics, namely the figure of merit (FoM), and overall accuracy (OA) coefficient. The FoM is computed as the proportion between the successfully altered cells and the total number of changes observed between the actual and simulation outcomes (Eq. 3) (Pontius et al. Citation2008).
where A is the actual land use type changes but remains unaltered in the simulation map; B is the number of cells that change correctly; C encompassing instances where both the actual and simulated land use types undergo alteration, yet the outcomes diverge; and D, reflecting cases where the actual land use type remains unchanged, while the simulation yields a different outcome.
The evaluation of differences between real and simulation results is conducted through the utilization of OA (Eq. 4) (Zhang et al. Citation2023).
where OA is overall accuracy, n is the sum of cells, and s is the number of cells that are the same for actual and simulation land use status.
3.3. Artificial neural networks model
ANN has been a focus of research since it was developed in the 1980s (Liu et al. Citation2017). And ANN is a large number of systems that deal with complex nonlinear relationships through adaptive information processing systems. Given the intricate nature and non-linear dynamics inherent in land use conversion (Xu et al. Citation2020; Yang et al. Citation2019), ANN was identified for constructing CA models. This choice reflects an understanding of the need to capture and incorporate the complex relationships and interactions involved in land use changes.
Conversion of land use is a multifaceted and multifarious process, with distinct land use types exhibiting diverse spatial distribution suitability. As a result, it becomes imperative to explore and ascertain the corresponding suitability for each of the six land use types. The construction of an ANN model includes a combination of input, hidden and output layers. In this study, both Beijing, Wuhan, and the PRD region driving factors are 14, so the input layer is 14 neurons. As the core of the ANN model, fewer layers will lead to failure to reflect the nonlinearity of the model, and higher layers will lead to overfitting of the model, etc. Therefore, three hidden layers were chosen, each representing twenty neurons. The output layer consists of one neuron, representing probability of land use change ().
Figure 3. The architecture of the artificial neural network.
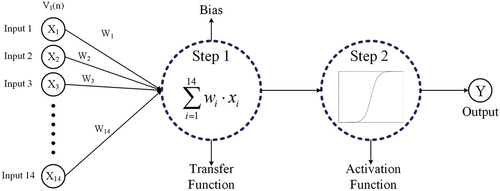
where xi denotes the information input from neuron i received by neuron j at time t; Oj(t) denotes the information output of neuron j at time t; uij denotes the synaptic delay between input and output; Tj denotes the threshold of neuron j; wij denotes the weight from neuron i to j; f denotes the transfer function of neuron.
3.4. Markov chain model for transition probability matrix
The Markov model, as a branch of stochastic processes, is characterized by its fundamental property of “no posteriority,” making it well-suited for studying the land use prediction. In the prediction of land use, the crucial aspect lies in establishing the initial transfer probability matrix (Eq. 6) for the transitions between different land use types. By adhering to the principles of the Markov model, one can ascertain the state probability vector of the system’s focal object at any given juncture. This determination hinges upon the vector of initial status probabilities and the transfer of probability matrix (Eq. 6).
Where n is the number of land use types, Pij is the probability of transition from land use i to j, and Pij satisfies two conditions: (1) 0 ≤ Pij ≤1; (2) .
3.5. Genetic algorithm for ATPMS
The GA is an optimization algorithm that emulates the genetic and selection mechanisms observed in nature to pursue excellence (Katoch, Chauhan, and Kumar Citation2021). In our study, we commenced by generating 10 initial populations at random and evaluated the merit of each population based on FoM values. To pursue merit, we employed crossover and mutation operations between individuals within the populations. During the iterative process, we initiated by randomly creating a sequence of binary codes consisting of 0s and 1s. Considering the transition probabilities among the six land use types, each land use type had to consider the potential for transitioning to the other five types. Thus, we established 10 populations, each containing a 30 × 10 code matrix. Subsequently, we introduced the populations into the CA model and computed the FoM values for the model. Based on these FoM values, we assessed the fitness of each population and employed a roulette wheel selection to determine which populations would be selected for the next generation. We then converted the populations back to binary codes and applied crossover and mutation operations. Crossover serves as a means of preserving valuable genetic material, while mutation operations prevent getting stuck in local optimal solutions. In this study, the crossover rate is 0.7, the mutation probability is 0.05, and the termination condition is the change of FoM less than 1e-5 in the last 10 generations. Additionally, during the iteration process, we adopted an elitism preserving strategy. In the first generation, we substituted the population with the lowest suitability with the parameters derived from the Markov-CA. Subsequently, we replaced the population with the lowest fitness in each generation with the population exhibiting the highest fitness in the previous generation to ensure that the optimal fitness does not decrease (Algorithm 1).
4. Results
4.1. The analysis of land use change
The characterization of land use change patterns has a direct impact on the accuracy of land use modeling. Complex areas with diverse land use changes provide an effective means to test the robustness of the model (He et al. Citation2022). Therefore, it is crucial to evaluate the model’s performance considering different land use change patterns. illustrates the spatial distribution of land use transfers in the three study areas during the calibration and validation periods.
Figure 4. Spatial distribution of land transfer in the three study areas during the calibration and validation periods. Numbers 1–6 represent cropland, forest, grassland, water area, built-up land and unused land. Code “12” represents the transfer of cropland to forest, et cetera.
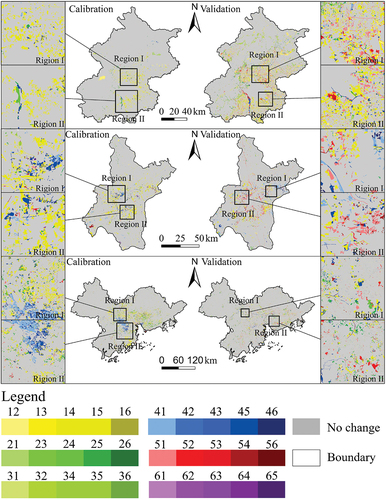
During the calibration period, land use changes in Beijing exhibit relatively straightforward patterns compared to the other study areas. In Region I, the dominant transformation involves the conversion from cropland to built-up land, while in Region II, the primary change is from forest and water area to built-up land. These patterns have been extensively studied in various urban expansion CA models and can be relatively accurately modeled (Zhang and Wang Citation2021). In the validation period, within the central region of Beijing, the predominant type of transformation remains the conversion of cropland into built-up land. However, there are also cases where built-up land is converted back into cropland, leading to a slight decline in simulation accuracy ().
Wuhan exhibits complex land use transfers in both the calibration and validation periods. During the calibration period, two regions around the main urban area were selected for detailed observation. In Region I, a substantial number of water area were transformed into cropland and built-up land, while in Region II, water area shifted to other land use types. These patterns pose significant challenges to model prediction. In the validation period, both Region I and Region II experienced interchanges between built-up land, water area, and cropland. These complex land use shifts between multiple land types further complicate accurate model predictions ().
In the PRD, during the calibration period, notable transformations from water area to forest, grassland, and built-up land were observed in Regions I and II, which differ from the land use changes observed in the other two study areas. Therefore, correctly simulating the encroachment of other land classes into water area is crucial for ensuring model accuracy. During the validation period, land use changes in the PRD demonstrate greater fragmentation compared to the other study areas. This indicates a slowdown in the expansion of built-up land in the region, but complex shifts between other land types persist ().
In summary, Beijing represents the simplest and most stable area among the three study areas in terms of land use change, primarily characterized by the encroachment of built-up land on other land use types, particularly cropland. This characteristic lends itself to more accurate modeling using the Markov model, as mentioned earlier. On the other hand, Wuhan and the PRD exhibit complex and diverse land use changes. Wuhan displays intricate shifts between multiple land use types and a minor contraction of built-up land. In contrast, the PRD experiences substantial encroachment of water area by various land use types, as well as fragmented land use changes. Both Wuhan and the PRD pose challenges to achieving high model accuracy and contribute to testing the model’s robustness ().
4.2. Quality seeds of the Markov model
To generate the land use transfer matrices, the land use data from both 2000 and 2010 were employed. Through analysis and examination of the land use transfer matrix, a Markov transition probability matrix was constructed. It is noticed that the land use transfer for certain land categories, particularly unused land in Beijing, exhibited minimal changes. This could result in a Markov land transition probability of 0 for this land class, which will potentially result in the erroneous complete encroachment of unused land. Consequently, the conversion probability for these categories was assigned a value of 0.01% to ensure the proper functioning of the model ( and ).
Table 2. Transition matrix for land use type transition (km2) in Beijing, Wuhan, and the Pearl Delta River, 2000–2010.
Table 3. Transition probability matrix (%) in Beijing, Wuhan, and the Pearl Delta River, 2000–2010.
The land use transfer matrices for the three study areas of Beijing, Wuhan, and the PRD exhibit a simultaneous substantial increase in built-up land. The observed outcomes of this phenomenon have led to substantial alterations in the distribution of land use activities across the respective regions, thus affirming the credibility of our theoretical framework. However, it is noteworthy that the modifications in land use patterns among the three examined areas do not exhibit uniformity.
In the first instance, the city of Beijing demonstrates the most modest upsurge in developed land, with a marginal growth rate of merely 25.34%. This expansion predominantly encroaches upon cropland, while the alterations witnessed in forest, grasslands, water area, and unused land exhibit relatively minimal deviations across the three examined areas. As a result, simulating the shifts between cultivated land and urbanized areas plays a pivotal role in safeguarding the model’s overall accuracy.
Turning to the second point, Wuhan takes center stage as the lone study area where water area demonstrates an expansion. Remarkably, a substantial portion of encroached land corresponds to cropland. This mutual occupation between diverse land use categories poses a more demanding challenge for our model to accurately capture and simulate.
Lastly, when we consider the PRD, it emerges as the study area undergoing the most conspicuous transitions in land use type areas among the three examined regions. Notably, the extent of developed land experiences a staggering increase of 65.77%, surpassing the rates observed in the other study areas. In contrast, cropland endures a marked decrease of 14.38%. Both of these values represent the most notable magnitudes witnessed across the three study areas.
4.3. The analysis of accuracy and ATPMS-ANN-CA
The ATPMS-ANN-CA model implemented an elitism preserving strategy. Firstly, this strategy guarantees the continuous increase or stability of the model’s fitness, effectively avoiding fluctuations in the FoM values caused by operations like crossover or mutation. Secondly, due to the large number of parameters optimized in this study, a higher mutation probability was adopted (Katoch, Chauhan, and Kumar Citation2021). Previous studies have demonstrated the effectiveness of higher mutation probabilities in optimizing parameters toward globally optimal solutions (Beasley and Chu Citation1996; Myers and Hancock Citation1997). Furthermore, the strict convergence criteria imposed in this study significantly increase the challenge of model convergence. However, such difficulties can be circumvented by utilizing the elitism preserving strategy.
illustrates the optimization process of the ATPMS-CA model for the study areas of Beijing, Wuhan, and the PRD. Convergence of the model is determined when the difference between the best FoM values in each generation is less than 1e-5 for 10 consecutive iterations. Notably, the least number of iterations was required for optimizing the transition probability matrix for Beijing, with convergence achieved in the 17th generation. Further analysis comparing the transition probability matrices obtained from the Markov chain () with the optimized transition probability matrix () shed light on the reasons behind this outcome. The predominant transition type in Beijing involves the encroachment of built-up land onto cropland. Thus, the core focus of enhancing the accuracy of the CA model lies in augmenting the probability of transition from cropland to built-up land. The Markov model successfully captured this feature, resulting in the model maintaining a high level of accuracy from the initial generation onwards. Consequently, the model only required minor adjustments to other land use conversion probabilities to attain optimal parameters.
Figure 5. Accurate modeling results of the adaptive transition probability matrix with quality seeds for transition probability optimization are presented for Beijing (a), Wuhan (b), and the Pearl River Delta (c) during the period 2000–2010.
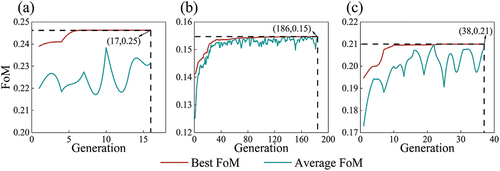
Table 4. Optimized transition probability matrix (%) in Beijing, Wuhan, and the PRD, 2000–2010.
In contrast, the parameter optimization for the transition probability matrix in Wuhan necessitated the highest number of iterations, reaching 186 before convergence. The FoM value of ATPMS-ANN-CA illustrated a significant improvement of 63.14% compared to the Markov-ANN-CA model, representing the most substantial enhancement among the three study areas (). This disparity highlights the considerable gap between the transition probability matrix derived from the Markov model and the optimal transition probability matrix. Further examination of the parameter pairs reveals notable differences in the transition probabilities of the three primary change types in Wuhan: cropland, built-up land, and water area, which are critical for accurate modeling. In specific terms, there exist significant disparities in the potential for transition between water area and built-up land, and also between cropland and built-up land. This discrepancy arises from the spatial clustering of built-up land in close proximity to both cropland and water area in the region of Wuhan. Consequently, a more pronounced transition probability is observed when transitioning these land use categories into built-up areas. Therefore, excessive values assigned to the transition probability parameters can lead to erroneous conversions of cropland and water area into built-up land. As a result, the land use transition probability matrix derived from the Markov chain framework exhibits certain limitations within this particular context.
Table 5. Validation coefficients for three different the cellular automata models in Beijing, Wuhan, and the PRD in calibration period.
Among the three study areas, it is worth noting that the PRD was the only region where the individual the Markov-ANN-CA model had smaller FoM values compared to the ANN-CA models. However, the ATPMS-ANN-CA model achieved a 9.68% increase in FoM value compared to the Markov-ANN-CA model, representing the second-highest improvement across the study areas (). In the PRD, the most notable changes occur in cropland, built-up land, and water area, but the transition of forest should not be disregarded when compared to the other two study areas. As a result, the transition probability matrix component for forest land in the PRD is also a key consideration. Upon conducting a comprehensive comparison between the optimized transition probability matrix and the Markov chain transition probability matrix, it is revealed that there is a similarity observed for cropland and built-up land before and after optimization. Therefore, the primary optimized components within the ATPMS model pertain to forest and water area. In contrast to the other study areas, the PRD possesses a forest land proportion that exceeds 50% of the total area, with a significant amount of forest distributed surrounding the built-up land. As a prominent economic center in southern China, the rapid spreading of built-up land in the PRD has resulted in substantial encroachment on forest land, as clearly depicted in the optimized transition probability matrix. Thus, the PRD reached the best value of FoM in the 38th generation, which is 0.20996 ().
In this study, we incorporated OA as additional evaluation metrics for the model. These indicators assess the global accuracy of the simulation results by comparing them with the real land use situation. The FoM focuses on accurately capturing areas where changes have occurred between the simulation results and land use status at end period. By combining these two evaluation indicators, we can obtain a more comprehensive and specific evaluation of the model’s performance.
Comparing the ANN-CA model with the Markov-ANN-CA model, it is evident that OA demonstrates superiority in all three study areas. The improvements range from 0.14%–0.31% for OA. These results indicate that the simulation accuracy considering the Markov land use transition matrix surpasses that of the ANN-CA model in terms of global accuracy. However, when comparing the FoM values, we observed that although the Markov-ANN-CA model exhibits improvements of 4.25% and 4.76% in Beijing and Wuhan, respectively, it experiences a decrease of 2.34% in the PRD (). Summing up the findings, the limitation of relying solely on the land use transition matrix for land use simulation in regions with complex land use changes plays a significant role in this phenomenon.
Finally, we compared the model accuracies of the Markov-ANN-CA and ATPMS-ANN-CA. The ATPMS-ANN-CA model outperforms the Markov-ANN-CA in terms of OA and FoM in all three study areas. The improvements range from 0.03%–0.74% for OA, and enhancement ranging from 3.67%–63.14% for FoM. Notably, Wuhan experiences the most substantial FoM improvement of 63.14%. As mentioned earlier, Wuhan is also the region with the most drastic changes in the transition probability matrix. Specifically, the changes in the transition probabilities of the two land use types that undergo the most significant alterations, cropland and built-up land, create a substantial gap in the model’s accuracy.
Despite a slight decrease in accuracy during the validation period, the ATPMS-ANN-CA model exhibits higher accuracy and stability compared to both the ANN-CA and Markov-ANN-CA models. This superiority is evident in terms of OA and FoM across all three study areas (). This phenomenon can be attributed to the fact that land use changes exhibit a certain level of stability. Consequently, the spatial change rules derived during the calibration period remain applicable to land use changes in the subsequent validation period. Additionally, it is worth noting that the FoM value of the Markov-ANN-CA model experiences a more significant decline during the validation period compared to the ANN-CA model. This finding further underscores the limitations of relying solely on the land use transfer matrix in the Markov model when simulating complex land use changes in an area.
Table 6. Validation coefficients for three different the cellular automata models in Beijing, Wuhan, and the PRD in validation period.
The comparative analysis demonstrates that the evaluation indices of the ATPMS-ANN-CA model surpass those of the other two models during both the calibration and validation periods. Consequently, the ATPMS-ANN-CA model exhibits superior accuracy and stability compared to the alternative models.
The validation coefficients are crucial components for accurately assessing model performance. Additionally, the depiction of landscape patches representing land use changes should not be neglected. In , we present comprehensive maps that illustrate the actual land use status and simulation details for Beijing, Wuhan, and the PRD in both the years 2010 and 2020. These detailed maps primarily focus on the most significant land use changes within the respective study areas.
Figure 6. Comparative results of landscape details of current land use status in Beijing, Wuhan and the Pearl River Delta using artificial neural networks-cellular automata, Markov-artificial neural networks-cellular automata and adaptive transfer probability matrix-artificial neural networks-cellular automata models with quality seeds during the period of calibration (2000 to 2010) and validation (2010 to 2020).
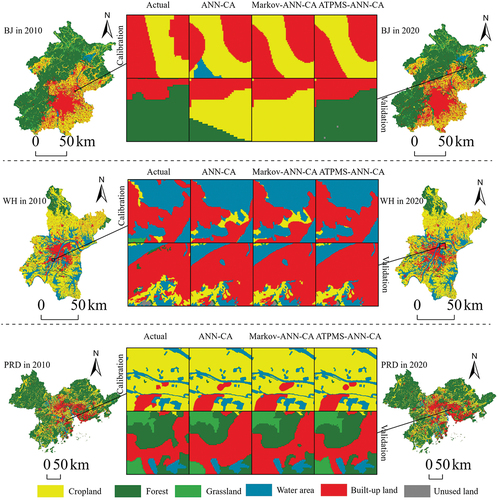
Beginning with Beijing, the transition of cropland to built-up land stands out as one of the dominant land use transitions. During the calibration period, the observation area for the detailed map was selected to the east of the main city. This region experienced significant encroachment of cropland adjacent to the built-up areas. Therefore, precisely simulating the expansion pattern of built-up land is of utmost importance. Notably, the ATPMS-ANN-CA model outperforms the other two models in accurately portraying this land use change in detail. For the detailed map of Beijing during the validation period, a complex area in the northeast with multiple land classes interacting was selected. Compared to the ANN-CA and Markov-ANN-CA models, it is clear that the ATPMS-ANN-CA model demonstrates a superior capability in accurately representing forested and built-up areas. Furthermore, the ATPMS-ANN-CA model demonstrates better performance than the Markov-ANN-CA model in describing landscapes at the edges of the built-up area ().
Turning to Wuhan, an area with a wide distribution of water, the detailed descriptive maps are primarily selected in regions featuring cropland, built-up land, and water area. In the calibration period, ATPMS-ANN-CA significantly outperforms the other two models in simulating the extension of built-up land. When it comes to the validation period, ATPMS-ANN-CA more accurately portrays the infill expansion of built-up land, particularly in the water area. This improvement can be attributed to the optimized transition probability matrix, indicating a higher suitability for transforming the water area into built-up land following the optimization process ().
Lastly, detail maps in the PRD were chosen in areas where multiple land use types coexist. One limitation of both the ANN-CA and Markov-ANN-CA models is the incorrect simulating of built-up land encroachment into other land types during the correction period. The accuracy of landscape detail portrayal serves as additional evidence that the ATPMS-ANN-CA model outperforms the other two models in terms of accuracy ().
5. Discussion
The utilization of Markov transition probability matrices in CA modeling is widely acknowledged for enhancing the precision of models, as confirmed by substantial research (Lan et al. Citation2022; Rana and Sarkar Citation2021; Sankarrao, Ghose, and Rathinsamy Citation2021). In this study, Markov models demonstrated significant compatibility in regions with simple and consistent patterns of land use change, which led to marked improvements in the models’ precision. Conversely, in areas with complex land use dynamics, such as Wuhan and the PRD, the models’ effectiveness diminishes, and the extent to which they enhance accuracy is reduced. In some cases, model accuracy may even decline. This variation can be traced to the Markov model’s sole reliance on land use transition matrices for determining transition probabilities, neglecting the inherent complexity of land use changes.
Consequently, we have developed a strategy to augment the accuracy and scientific integrity of the model by integrating GAs, Markov, and CA models. Traditional GAs often encounter difficulties with complex multi-faceted problems, such as convergence issues or the development of suboptimal solutions (Beasley and Chu Citation1996; Katoch, Chauhan, and Kumar Citation2021). We have made several enhancements to the classical GA. Firstly, we incorporate the transition probability matrix from the Markov model into the GA to serve as a quality seed, thus decreasing convergence time and computational expenses. Secondly, we set a high mutation rate and strict convergence criteria, which effectively prevent the occurrence of local optima. Lastly, we employ an elitism preservation strategy to ensure the model converges, maintaining or improving the quality of the optimal solution and averting a decrease in its accuracy.
Building on this foundation, the ATPMS-ANN-CA model was constructed to simulate land use changes in Beijing, Wuhan, and the PRD from 2000–2020. To ascertain the model’s robustness and reliability, a two-phased methodology was adopted: the initial phase from 2000 to 2010 served as the calibration period, followed by a validation period from 2010 to 2020. The model’s performance was rigorously assessed by comparing the simulated land use patterns with the actual observed patterns during these intervals. A comparative analysis between the proposed ATPMS-ANN-CA model, the ANN-CA model, and the Markov-ANN-CA model was performed, which revealed the ATPMS-ANN-CA model’s superior accuracy and detail depiction in landscape during both intervals.
Numerous studies have focused on refining land use transition matrices to enhance the accuracy of models (Rana and Sarkar Citation2021; Sankarrao, Ghose, and Rathinsamy Citation2021). For example, Liu et al. (Citation2023) developed a linear transformation optimization Markov model based on CA to simulate land use change, converting the nonlinear transition matrix from Markov chains into a linear format. However, this method oversimplified the process by only considering three land types, which is insufficient for complex changes across multiple land types. In a similar vein, Wang and Zheng (Citation2023) proposed a Markov model that integrates dominant transition probabilities to address the biases of traditional Markov models, which typically consider only two time periods by including historical data. Nonetheless, these studies primarily target the simulation of land use change in typical areas, with a limited focus on enhancing model accuracy in regions characterized by intricate land use dynamics. Consequently, the development of the ATPMS-ANN-CA model addresses the inadequacies of the Markov model in accurately simulating land use changes in areas with complex dynamics.
Nevertheless, land use change models often underrepresent policy as a critical determinant of land use change (Szantoi et al. Citation2012). In this study, the ATPMS-ANN-CA model insufficiently accounted for policy factors. Hence, incorporating various policy scenarios is crucial for simulating future land use changes accurately.
6. Conclusion
The ATPMS-ANN-CA model was developed to enhance simulation accuracy in areas characterized by complex land use changes. Its efficacy was validated through applications in diverse urban settings, including Beijing, Wuhan, and the PRD. Traditional CA modeling techniques, which predominantly rely on transition probability matrices derived from Markov chains, often fall short in achieving desired levels of accuracy and adherence to scientific standards. Additionally, the reliance on transition probability matrices based solely on a modeler’s experiential judgment can be unduly limiting. As the cornerstone of CA modeling, the land use transition rule and by extension, the transition probability matrix, which plays a pivotal role in determining the model’s accuracy and scientific integrity. Therefore, it is imperative to design a research framework for the transition probability matrix that balances practical applicability, precision, and scientific rigor.
Data and codes availability statement
The data and codes that support this study are available at https://figshare.com/s/ed1dc2216c499bb76d02.
Acknowledgment
We thank the anonymous reviewers and journal editors for their constructive comments and suggestions that greatly improved the article.
Disclosure statement
No potential conflict of interest was reported by the authors.
Additional information
Funding
References
- Ahmed, B., R. Ahmed, and X. Zhu. 2013. “Evaluation of Model Validation Techniques in Land Cover Dynamics.” ISPRS International Journal of Geo-Information 2:577–19. https://doi.org/10.3390/ijgi2030577.
- Arora, A., M. Pandey, V. N. Mishra, R. Kumar, P. K. Rai, R. Costache, M. Punia, and L. P. Di. 2021. “Comparative Evaluation of Geospatial Scenario-Based Land Change Simulation Models Using Landscape Metrics.” Ecological Indicators 128. https://doi.org/10.1016/j.ecolind.2021.107810.
- Beasley, J. E., and P. C. Chu. 1996. “A Genetic Algorithm for the Set Covering Problem.” European Journal of Operational Research 94:392–404. https://doi.org/10.1016/0377-2217(95)00159-x.
- Berberoglu, S., A. Akin, and K. C. Clarke. 2016. “Cellular Automata Modeling Approaches to Forecast Urban Growth for Adana, Turkey: A Comparative Approach.” Landscape and Urban Planning 153:11–27. https://doi.org/10.1016/j.landurbplan.2016.04.017.
- Bey, A., A. S. P. Diaz, D. Maniatis, G. Marchi, D. Mollicone, S. Ricci, J. F. Bastin, et al. 2016. “Collect Earth: Land Use and Land Cover Assessment Through Augmented Visual Interpretation.” Remote Sensing 8. https://doi.org/10.3390/rs8100807.
- Bryan, B. A., L. Gao, Y. Q. Ye, X. F. Sun, J. D. Connor, N. D. Crossman, M. Stafford-Smith, et al. 2018. “China’s Response to a National Land-System Sustainability Emergency.” Nature 559:193–204. https://doi.org/10.1038/s41586-018-0280-2.
- Chen, W., M. Panahi, and H. R. Pourghasemi. 2017. “Performance Evaluation of GIS-Based New Ensemble Data Mining Techniques of Adaptive Neuro-Fuzzy Inference System (ANFIS) with Genetic Algorithm (GA), Differential Evolution (DE), and Particle Swarm Optimization (PSO) for Landslide Spatial Modelling.” Catena 157:310–324. https://doi.org/10.1016/j.catena.2017.05.034.
- Diehl, J. A., E. Sweeney, B. Wong, C. S. Sia, H. M. Yao, and M. Prabhudesai. 2020. “Feeding Cities: Singapore’s Approach to Land Use Planning for Urban Agriculture.” Global Food Security-Agriculture Policy Economics and Environment 26. https://doi.org/10.1016/j.gfs.2020.100377.
- Gagne, S. A., F. Eigenbrod, D. G. Bert, G. M. Cunnington, L. T. Olson, A. C. Smith, and L. Fahrig. 2015. “A Simple Landscape Design Framework for Biodiversity Conservation.” Landscape and Urban Planning 136:13–27. https://doi.org/10.1016/j.landurbplan.2014.11.006.
- Garcia, A. M., I. Sante, R. Crecente, and D. Miranda. 2011. “An Analysis of the Effect of the Stochastic Component of Urban Cellular Automata Models.” Computers, Environment and Urban Systems 35:289–296. https://doi.org/10.1016/j.compenvurbsys.2010.11.001.
- Guo, X. Y., J. J. Hu, J. F. Chen, F. Q. Deng, and T. L. Lam. 2021. “Semantic Histogram Based Graph Matching for Real-Time Multi-Robot Global Localization in Large Scale Environment.” IEEE Robotics and Automation Letters 6:8349–8356. https://doi.org/10.1109/lra.2021.3058935.
- Halder, B., A. Karimi, P. Mohammad, J. Bandyopadhyay, R. D. Brown, and Z. M. Yaseen. 2022. “Investigating the Relationship Between Land Alteration and the Urban Heat Island of Seville City Using Multi-Temporal Landsat Data.” Theoretical and Applied Climatology 150:613–635. https://doi.org/10.1007/s00704-022-04180-8.
- Halmy, M. W. A., P. E. Gessler, J. A. Hicke, and B. B. Salem. 2015. “Land Use/Land Cover Change Detection and Prediction in the North-Western Coastal Desert of Egypt Using Markov-CA.” Applied Geography 63:101–112. https://doi.org/10.1016/j.apgeog.2015.06.015.
- Harding, J. S., E. F. Benfield, P. V. Bolstad, G. S. Helfman, and E. B. D. Jones. 1998. “Stream Biodiversity: The Ghost of Land Use Past.” Proceedings of the National Academy of Sciences of the United States of America 95:14843–14847. https://doi.org/10.1073/pnas.95.25.14843.
- He, F., J. Yang, Y. Q. Zhang, D. Q. Sun, L. Wang, X. M. Xiao, and J. Xia. 2022. “Offshore Island Connection Line: A New Perspective of Coastal Urban Development Boundary Simulation and Multi-Scenario Prediction.” GIScience & Remote Sensing 59:801–821. https://doi.org/10.1080/15481603.2022.2071056.
- Holland, J. H. 1992. “Genetic Algorithms.” Scientific American 267: 66–72. https://doi.org/10.1038/scientificamerican0792-66.
- Hong, T. P., H. S. Wang, and W. C. Chen. 2000. “Simultaneously Applying Multiple Mutation Operators in Genetic Algorithms.” Journal of Heuristics 6:439–455. https://doi.org/10.1023/a:1009642825198.
- Islam, M. S., T. W. Crawford, and Y. Shao. 2023. “Evaluation of Predicted Loss of Different Land Use and Land Cover (LULC) Due to Coastal Erosion in Bangladesh.” Frontiers in Environmental Science 11. https://doi.org/10.3389/fenvs.2023.1144686.
- Jalayer, S., A. Sharifi, D. Abbasi-Moghadam, A. Tariq, and S. J. Qin. 2022. “Modeling and Predicting Land Use Land Cover Spatiotemporal Changes: A Case Study in Chalus Watershed, Iran.” IEEE Journal of Selected Topics in Applied Earth Observations & Remote Sensing 15:5496–5513. https://doi.org/10.1109/jstars.2022.3189528.
- Kabir, M. M. J., S. X. Xu, B. H. Kang, and Z. Y. Zhao. 2017. “A New Multiple Seeds Based Genetic Algorithm for Discovering a Set of Interesting Boolean Association Rules.” Expert Systems with Applications 74:55–69. https://doi.org/10.1016/j.eswa.2017.01.001.
- Kamusoko, C., M. Aniya, B. Adi, and M. Manjoro. 2009. “Rural Sustainability Under Threat in Zimbabwe – Simulation of Future Land Use/Cover Changes in the Bindura District Based on the Markov-Cellular Automata Model.” Applied Geography 29:435–447. https://doi.org/10.1016/j.apgeog.2008.10.002.
- Karimi, A., A. Bayat, N. Mohammadzadeh, M. Mohajerani, and M. Yeganeh. 2023. “Microclimatic Analysis of Outdoor Thermal Comfort of High-Rise Buildings with Different Configurations in Tehran: Insights from Field Surveys and Thermal Comfort Indices.” Building & Environment 240. https://doi.org/10.1016/j.buildenv.2023.110445.
- Karimi, A., Y. J. Kim, N. M. Zadeh, A. García-Martínez, S. Delfani, R. D. Brown, D. Moreno-Rangel, and P. Mohammad. 2022. “Assessment of Outdoor Design Conditions on the Energy Performance of Cooling Systems in Future Climate Scenarios-A Case Study Over Three Cities of Texas, Unites States.” Sustainability 14. https://doi.org/10.3390/su142214848.
- Katoch, S., S. S. Chauhan, and V. Kumar. 2021. “A Review on Genetic Algorithm: Past, Present, and Future.” Multimedia Tools & Applications 80:8091–8126. https://doi.org/10.1007/s11042-020-10139-6.
- Kuang, W. H., S. W. Zhang, G. M. Du, C. Z. Yan, S. X. Wu, R. D. Li, D. S. Lu, et al. 2022. “Monitoring Periodically National Land Use Changes and Analyzing Their Spatiotemporal Patterns in China During 2015–2020.” Journal of Geographical Sciences 32:1705–1723. https://doi.org/10.1007/s11442-022-2019-0.
- Lagarias, A. 2015. “Exploring Land Use Policy Scenarios with the Use of a Cellular Automata-Based Model: Urban Sprawl Containment and Sustainable Development in Thessaloniki.” Geocarto International 30:1033–1051. https://doi.org/10.1080/10106049.2015.1013066.
- Lan, H., K. Stewart, Z. Y. Sha, Y. C. Xie, and S. J. Chang. 2022. “Data Gap Filling Using Cloud-Based Distributed Markov Chain Cellular Automata Framework for Land Use and Land Cover Change Analysis: Inner Mongolia As a Case Study.” Remote Sensing 14. https://doi.org/10.3390/rs14030445.
- Li, X., Y. M. Chen, X. P. Liu, X. C. Xu, and G. L. Chen. 2017. “Experiences and Issues of Using Cellular Automata for Assisting Urban and Regional Planning in China.” International Journal of Geographical Information Science 31:1606–1629. https://doi.org/10.1080/13658816.2017.1301457.
- Li, Y., L. J. Zhu, X. Y. Zhao, S. C. Li, and Y. Yan. 2013. “Urbanization Impact on Temperature Change in China with Emphasis on Land Cover Change and Human Activity.” Journal of Climate 26:8765–8780. https://doi.org/10.1175/jcli-d-12-00698.1.
- Liang, X., Q. F. Guan, K. C. Clarke, S. S. Liu, B. Y. Wang, and Y. Yao. 2021. “Understanding the Drivers of Sustainable Land Expansion Using a Patch-Generating Land Use Simulation (PLUS) Model: A Case Study in Wuhan, China.” Computers, Environment and Urban Systems 85. https://doi.org/10.1016/j.compenvurbsys.2020.101569.
- Liang, X., X. P. Liu, X. Li, Y. M. Chen, H. Tian, and Y. Yao. 2018. “Delineating Multi-Scenario Urban Growth Boundaries with a CA-Based FLUS Model and Morphological Method.” Landscape and Urban Planning 177:47–63. https://doi.org/10.1016/j.landurbplan.2018.04.016.
- Liu, J., C. C. Hu, X. H. Kang, and F. Chen. 2023. “A Loosely Coupled Model for Simulating and Predicting Land Use Changes.” The Land 12. https://doi.org/10.3390/land12010189.
- Liu, X. P., X. Liang, X. Li, X. C. Xu, J. P. Ou, Y. M. Chen, S. Y. Li, S. J. Wang, and F. S. Pei. 2017. “A Future Land Use Simulation Model (FLUS) for Simulating Multiple Land Use Scenarios by Coupling Human and Natural Effects.” Landscape and Urban Planning 168:94–116. https://doi.org/10.1016/j.landurbplan.2017.09.019.
- Lu, Y. Q., X. Y. Yang, H. F. Wang, M. J. Jiang, X. H. Wen, X. L. Zhang, and L. X. Meng. 2023. “Exploring the Effects of Land Use and Land Cover Changes on Meteorology and Air Quality Over Sichuan Basin, Southwestern China.” Frontiers in Ecology and Evolution 11. https://doi.org/10.3389/fevo.2023.1131389.
- Mumtaz, F., J. Li, Q. H. Liu, A. Arshad, Y. D. Dong, C. Liu, J. Zhao, et al. 2023. “Spatio-Temporal Dynamics of Land Use Transitions Associated with Human Activities Over Eurasian Steppe: Evidence from Improved Residual Analysis.” Science of the Total Environment 905. https://doi.org/10.1016/j.scitotenv.2023.166940.
- Mumtaz, F., J. Li, Q. H. Liu, A. Tariq, A. Arshad, Y. D. Dong, J. Zhao, et al. 2023. “Impacts of Green Fraction Changes on Surface Temperature and Carbon Emissions: Comparison Under Forestation and Urbanization Reshaping Scenarios.” Remote Sensing 15. https://doi.org/10.3390/rs15030859.
- Myers, R., and E. R. Hancock. 1997. “Genetic Algorithm Parameter Sets for Line Labelling.” Pattern Recognition Letters 18:1363–1371. https://doi.org/10.1016/s0167-8655(97)00111-6.
- Naghibi, S. A., K. Ahmadi, and A. Daneshi. 2017. “Application of Support Vector Machine, Random Forest, and Genetic Algorithm Optimized Random Forest Models in Groundwater Potential Mapping.” Water Resources Management 31:2761–2775. https://doi.org/10.1007/s11269-017-1660-3.
- Neff, F., D. Prati, R. Achury, D. Ambarli, R. Bolliger, M. Brandle, M. Freitag, et al. 2023. “Reduction of Invertebrate Herbivory by Land Use Is Only Partly Explained by Changes in Plant and Insect Characteristics.” Ecological Monographs 93. https://doi.org/10.1002/ecm.1571.
- Pontius, G. R., and J. Malanson. 2005. “Comparison of the Structure and Accuracy of Two Land Change Models.” International Journal of Geographical Information Science 19:243–265. https://doi.org/10.1080/13658810410001713434.
- Pontius, R. G., W. Boersma, J. C. Castella, K. Clarke, T. de Nijs, C. Dietzel, Z. Duan, et al. 2008. “Comparing the Input, Output, and Validation Maps for Several Models of Land Change.” The Annals of Regional Science 42:11–37. https://doi.org/10.1007/s00168-007-0138-2.
- Rana, M. S., and S. Sarkar. 2021. “Prediction of Urban Expansion by Using Land Cover Change Detection Approach.” Heliyon 7. https://doi.org/10.1016/j.heliyon.2021.e08437.
- Sankarrao, L., D. K. Ghose, and M. Rathinsamy. 2021. “Predicting Land-Use Change: Intercomparison of Different Hybrid Machine Learning Models.” Environmental Modelling & Software 145. https://doi.org/10.1016/j.envsoft.2021.105207.
- Selmants, P. C., B. M. Sleeter, J. N. Liu, T. S. Wilson, C. Trauernicht, A. G. Frazier, and G. P. Asner. 2021. “Ecosystem Carbon Balance in the Hawaiian Islands Under Different Scenarios of Future Climate and Land Use Change.” Environmental Research Letters 16. https://doi.org/10.1088/1748-9326/ac2347.
- Shi, C., Z. Y. Yan, Z. Z. Shi, and L. Zhang. 2010. “A Fast Multi-Objective Evolutionary Algorithm Based on a Tree Structure.” Applied Soft Computing 10:468–480. https://doi.org/10.1016/j.asoc.2009.08.018.
- Shikary, C., and S. Rudra. 2022. “Urban Growth Prediction for Sustainable Urban Management Using Markov Chain Model: A Study on Purulia Municipality, West Bengal, India.” The Journal of the Indian Society of Remote Sensing 50:2229–2244. https://doi.org/10.1007/s12524-022-01596-7.
- Song, X. P., M. C. Hansen, S. V. Stehman, P. V. Potapov, A. Tyukavina, E. F. Vermote, and J. R. Townshend. 2018. “Global Land Change from 1982 to 2016.” Nature 560:639±. https://doi.org/10.1038/s41586-018-0411-9.
- Song, Y. C., H. J. Wang, X. T. Peng, D. Sun, and R. Chen. 2023. “Modeling Land Use Change Prediction Using Multi-Model Fusion Techniques: A Case Study in the Pearl River Delta, China.” Ecological Modelling 486. https://doi.org/10.1016/j.ecolmodel.2023.110545.
- Szantoi, Z., F. Escobedo, J. Wagner, J. M. Rodriguez, and S. Smith. 2012. “Socioeconomic Factors and Urban Tree Cover Policies in a Subtropical Urban Forest.” GIScience & Remote Sensing 49:428–449. https://doi.org/10.2747/1548-1603.49.3.428.
- Wang, J. F., X. H. Li, G. Christakos, Y. L. Liao, T. Zhang, X. Gu, and X. Y. Zheng. 2010. “Geographical Detectors-Based Health Risk Assessment and Its Application in the Neural Tube Defects Study of the Heshun Region, China.” International Journal of Geographical Information Science 24:107–127. https://doi.org/10.1080/13658810802443457.
- Wang, S. Q., and X. Q. Zheng. 2023. “Dominant Transition Probability: Combining CA-Markov Model to Simulate Land Use Change.” Environment Development and Sustainability 25:6829–6847. https://doi.org/10.1007/s10668-022-02337-z.
- Wu, D., and M. Y. Liu. 2022. “Assessing Adaptability of the Water Resource System to Social-Ecological Systems in the Beijing-Tianjin-Hebei Region: Based on the DPSIR-TOPSIS Framework.” Chinese Journal of Population Resources and Environment 20:261–269. https://doi.org/10.1016/j.cjpre.2022.09.007.
- Xiong, X. X., T. T. Zhou, T. Cai, W. Huang, J. Li, X. F. Cui, and F. Li. 2022. “Land Use Transition and Effects on Ecosystem Services in Water-Rich Cities Under Rapid Urbanization: A Case Study of Wuhan City, China.” The Land 11. https://doi.org/10.3390/land11081153.
- Xu, T. T., J. Gao, G. Coco, and S. L. Wang. 2020. “Urban Expansion in Auckland, New Zealand: A GIS Simulation via an Intelligent Self-Adapting Multiscale Agent-Based Model.” International Journal of Geographical Information Science 34:2136–2159. https://doi.org/10.1080/13658816.2020.1748192.
- Yadav, V., and S. K. Ghosh. 2021. “Assessment and Prediction of Urban Growth for a Mega-City Using CA-Markov Model.” Geocarto International 36:1960–1992. https://doi.org/10.1080/10106049.2019.1690054.
- Yang, D., W. X. Luan, Y. Li, Z. C. Zhang, and C. Tian. 2023. “Multi-Scenario Simulation of Land Use and Land Cover Based on Shared Socioeconomic Pathways: The Case of Coastal Special Economic Zones in China.” Journal of Environmental Management 335. https://doi.org/10.1016/j.jenvman.2023.117536.
- Yang, J., A. D. Guo, Y. H. Li, Y. Q. Zhang, and X. M. Li. 2019. “Simulation of Landscape Spatial Layout Evolution in Rural-Urban Fringe Areas: A Case Study of Ganjingzi District.” GIScience & Remote Sensing 56:388–405. https://doi.org/10.1080/15481603.2018.1533680.
- Zeng, H. R., B. Zhang, and H. J. Wang. 2023. “A Hybrid Modeling Approach Considering Spatial Heterogeneity and Nonlinearity to Discover the Transition Rules of Urban Cellular Automata Models.” Environment and Planning B-Urban Analytics and City Science. https://doi.org/10.1177/23998083221149018.
- Zhang, B., S. G. Hu, H. J. Wang, and H. R. Zeng. 2023. “A Size-Adaptive Strategy to Characterize Spatially Heterogeneous Neighborhood Effects in Cellular Automata Simulation of Urban Growth.” Landscape and Urban Planning 229. https://doi.org/10.1016/j.landurbplan.2022.104604.
- Zhang, B., and H. J. Wang. 2021. “A New Type of Dual-Scale Neighborhood Based on Vectorization for Cellular Automata Models.” GIScience & Remote Sensing 58:386–404. https://doi.org/10.1080/15481603.2021.1883946.
- Zhang, B., and H. J. Wang. 2022. “Exploring the Advantages of the Maximum Entropy Model in Calibrating Cellular Automata for Urban Growth Simulation: A Comparative Study of Four Methods.” GIScience & Remote Sensing 59:71–95. https://doi.org/10.1080/15481603.2021.2016240.
- ZiaeeVafaeyan, H., M. H. Moattar, and Y. Forghani. 2018. “Land Use Change Model Based on Bee Colony Optimization, Markov Chain and a Neighborhood Decay Cellular Automata.” Natural Resource Modeling 31. https://doi.org/10.1111/nrm.12151.