
 ?Mathematical formulae have been encoded as MathML and are displayed in this HTML version using MathJax in order to improve their display. Uncheck the box to turn MathJax off. This feature requires Javascript. Click on a formula to zoom.
ABSTRACT
Desertification is a form of land degradation observed in arid, semiarid, and dry subhumid ecosystems. Assessing the global trends and drivers of desertification in arid land is crucial for developing effective land restoration policies and mitigating desertification. We aimed to evaluate global segmental trends in desertification in arid land using Moderate Resolution Imaging Spectroradiometer images from 2000 to 2022. By constructing a robust MSAVI-Albedo Desertification Distance Index (DDI), we assessed the segmented development characteristics of desertification on Google Earth Engine. Additionally, we employed the SHapley Additive exPlanations (SHAP) model and machine learning methods to analyze the individual and interactive driving mechanisms of desertification. The results indicated an overall reduction in desertification, with approximately 23.21 million km2 (39% of the global arid region area) exhibiting negative trends in DDI. Approximately 31% of the land area showed a DDI of −0.002/y. Precipitation was consistently the primary factor influencing desertification, with an average SHAP value of 11.42. Secondary influencing factors included potential evapotranspiration, soil moisture, and vapor pressure differences. Notably, the coupling between precipitation and soil moisture exhibited the most significant impact on the desertification process, with SHAP coupling values of approximately 3.28 and 5.06 before and after the DDI turning point, respectively. These findings provide new insights into desertification on a global scale and offer valuable scientific support for promoting effective prevention and control measures.
1. Introduction
Desertification is an intricate process of land degradation triggered by the interplay between climate change and human activity in arid lands. The influence of desertification on the sustainable development of human society is profound and represents one of the most pressing social, economic, and ecological predicaments confronting contemporary society (D’Odorico et al. Citation2013; Huang et al. Citation2020). Desertification has caused substantial environmental deterioration and economic damage worldwide. Desertification affects approximately one-fifth of the world’s population, with arid lands experiencing particularly pronounced effects (Meng et al. Citation2021). Intensified climate change and increasingly frequent human activities have amplified the global trajectory of desertification in arid land (Ma et al. Citation2021), posing imminent threats to human existence, productivity, and livelihoods. Ascertaining the global distribution characteristics and development laws of desertification is the foundation for scientifically formulating desertification control policies and promoting desertification control methods. However, the understanding of the global spatiotemporal evolutionary characteristics and underlying driving mechanisms of desertification in arid land are not comprehensive, impeding the effective advancement of desertification control measures.
Accurate identification of the precise location and extent of desertification and a systematic assessment of its driving mechanisms are prerequisites for effective desertification control. Regardless of the influence of technological conditions or the urgency of research, most of the literature has explored areas prone to desertification and those severely affected, for example, Western Asia (Akbari, Modarres, and Alizadeh Noughani Citation2020), Central Asia (Hu, Han, and Zhang Citation2020), North Africa (Yang et al. Citation2022), and the northern regions of East Asia (Meng et al. Citation2020). Global-scale assessments of desertification are crucial for understanding the global development process of desertification and formulating international policies and cooperation strategies for desertification prevention but few have been conducted. Huang et al. (Citation2020) proposed a global desertification vulnerability index that combined climate change and human activities, providing a new perspective for the study of global desertification vulnerability. Despite Huang et al. (Citation2020) offering a global perspective to assess the vulnerability to desertification, global assessments of desertification based on remote sensing image data remain limited. Remote sensing technology can reflect the status of surface desertification accurately and in real time, with minimal impact from desertification assessment models, which is especially critical for monitoring and assessing the global desertification process. Additionally, these desertification monitoring studies significantly enriched the field of global desertification monitoring by introducing various methodologies. Their insights have provided solid scientific groundwork essential for efforts to prevent and control desertification. The occurrence and development of land desertification typically follow a complex, non-monotonic pattern. Simply using linear trend methods to assess the evolution of desertification over a study period makes uncovering detailed changes difficult. Therefore, for subjects with long time series, inflection point detection methods must be used to determine the sudden change times of desertification and to conduct segmental linear trend analyses. However, some of these desertification monitoring studies had limited monitoring periods or primarily relied on linear analysis for trend assessment without accounting for segmental characteristics. Despite several studies on the analysis of the interactive effects of desertification driving factors (Lamqadem et al. Citation2018, Citation2018b; Sepehr et al. Citation2007), the interpretation of factor interactions has rarely been quantitatively described, which limits a comprehensive understanding of the driving mechanisms of desertification.
Data-driven machine learning models have been widely used to explore and construct nonlinear relationships between environmental variables and target variables (Huang, Duan, and Chen Citation2022; Meng et al. Citation2021). Among these models, eXtreme Gradient Boosting (XGBoost), LightGBM (LGBM), Random Forest (RF), and Multi-Layer Perceptron (MLP) are commonly used due to their efficiency and scalability in classification and regression tasks. Using these models to establish relationships between desertification indicators and environmental factors can successfully quantify the driving forces of desertification and predict future trends. However, machine learning models often act as “black boxes;” thus, understanding the connection between input variables and prediction outcomes is complex and difficult (Meng et al. Citation2021). SHapley Additive exPlanations (SHAP) uses the principles of game theory to calculate the independent contribution of each feature in machine learning model predictions and assign corresponding importance scores. Owing to its strong theoretical foundation and rich visualization tools, SHAP has been widely applied in the field of remote sensing. Hosseiny et al. (Citation2022) provided crucial insights into the potential of nuanced importance metrics through explainable machine learning for urban land use and land cover classification. Descals et al. (Citation2023) used SHAP to study the global climate’s limitation on photosynthesis phenology. Batunacun et al. (Citation2021) employed SHAP to investigate severe grassland degradation in the Xilingol League, China, and its driving factors. These studies have demonstrated that SHAP not only increases the transparency of models in the field of remote sensing but also enhances the interpretability of the results, enabling researchers to improve the understanding of and trust in their models.
This study aimed to identify key areas and strategies for desertification prevention by revealing the spatiotemporal dynamics of global land desertification and its internal driving factors from 2000 to 2022, providing support for achieving the goal of zero growth in land degradation within the Sustainable Development Goals. The specific objectives were as follows: (1) achieve systematic monitoring of the global dynamic changes in desertification across arid land by using the GEE platform; (2) elucidate the long-term, change characteristics of desertification in arid lands and discern the segmental characteristics and rules of pixel-level desertification changes; and (3) uncover the mechanisms underlying pixel-scale transitions of desertification in arid land from 2000 to 2022. The analysis of the findings provides insights into the underlying causes of desertification dynamics.
2. Materials and methods
2.1. Remote sensing data
We used Moderate Resolution Imaging Spectroradiometer (MODIS) land products to comprehensively monitor global desertification in arid land. The data employed comprised two pivotal products: the MCD43A4 V6.1 Nadir Bidirectional Reflectance Distribution Function Adjusted Reflectance (NBAR) product (Zhen et al. Citation2023) and the MCD43A3 V6.1 Albedo Model dataset (T. He et al. Citation2019). The NBAR product facilitates the acquisition of 500 m reflectivity measurements for MODIS bands, which are subsequently refined through bidirectional reflectance distribution function adjustments. By amalgamating data from the Terra and Aqua spacecraft, this product effectively selects representative pixels over a 16 d period, ensuring optimal data quality and reliability.
The albedo data provides directional hemispherical reflectance (i.e. black-sky albedo) and bi-hemispherical reflectance (i.e. white-sky albedo) for each MODIS band. The spatial resolution and the synthesis method of the albedo data were consistent with those of the NBAR data.
The MODIS MCD43A4 version 6.1 NBAR dataset is generated daily using 16 days of Terra and Aqua MODIS data at a resolution of 500 meters (Huang et al. Citation2017). Nadir reflectance removes the influence of viewing angles, producing stable and consistent NBAR products (Geng et al. Citation2021). These data have undergone radiometric and geometric corrections, enabling them to provide high-quality, time series surface reflectance information. In the annual synthesis of the desertification monitoring index, clouds are detected and masked according to the “internal cloud algorithm flag” of the MODIS Quality band (Tian et al. Citation2018).
2.2. Environmental factors
The spatiotemporal variation and distribution of desertification are attributed to the combined influence of climate change and human activity. Through an extensive literature review and considering data availability, this study identified meteorological factors, topographic factors, and socioeconomic factors closely related to desertification or vegetation growth. Meteorological factors, namely, precipitation (Lamqadem et al. Citation2018), air temperature (Badreldin, Frankl, and Goossens Citation2014), vapor pressure difference (Li, Guan, and Zheng Citation2022), potential evapotranspiration (Meng et al. Citation2021), snow water equivalent (Liu et al. Citation2023), wind speed (Han et al. Citation2020; Sepehr et al. Citation2007), and soil moisture (Becerril and Mastachi Citation2021) directly affect the water cycle and energy balance in desertification areas. Topographic factors, namely, slope (Guo et al. Citation2023), aspect (Meng et al. Citation2020), and elevation (Yang et al. Citation2022), influence surface runoff, soil erosion, and microclimatic conditions, affecting the desertification process. Socioeconomic factors, namely, livestock quantity (Feng et al. Citation2015; Xie et al. Citation2023) and atmospheric carbon dioxide concentration (Piao et al. Citation2020), indirectly promote desertification by altering land cover and increasing greenhouse gas emissions.
Meteorological data were obtained primarily from TerraClimate (Abatzoglou et al. Citation2018), a global terrestrial monthly climate dataset with a spatial resolution of 0.04°. This dataset combines the high spatial resolution of the WorldClim dataset with a coarser temporal resolution through interpolation. TerraClimate provides monthly precipitation, temperature, Vapor pressure difference, wind speed, and potential evapotranspiration data and has been widely used in various research fields (Heinrich et al. Citation2023; Tiwari et al. Citation2023; Wu et al. Citation2023). The slope, aspect, and elevation were directly derived from the SRTM digital elevation model dataset (30 m spatial resolution) (Farr et al. Citation2007; Nasa Citation2013). The livestock quantity data were sourced from the Food and Agriculture Organization because this dataset provides comprehensive information and is widely recognized as a reliable source for livestock-related analyses. Additionally, the effects of elevated carbon dioxide concentration on vegetation recovery were considered (Park, Jeong, and Peñuelas Citation2020). Carbon dioxide concentration data were obtained from the National Oceanic and Atmospheric Administration. CarbonTracker data were obtained from the Atmospheric Administration’s Global Monitoring Laboratory . These datasets have been widely used to investigate the influence of carbon dioxide concentration on various ecological processes, including vegetation recovery (He et al. Citation2022; van der Laan-Luijkx et al. Citation2015).
Table 1. Environmental factors selected for modeling.
3. Methods
3.1. Arid land demarcation
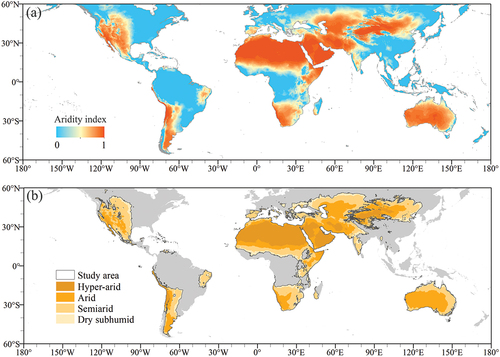
Accurate identification and demarcation of arid land on a global scale form the fundamental basis for a comprehensive assessment of the dynamic trends of desertification (Liu et al. Citation2020). The aridity index (AI), introduced by the United Nations Environment Program, is a widely used measure for defining arid land (Ullah et al. Citation2022; Zarei and Mahmoudi Citation2021). The AI is the most rational and reliable indicator of climate change in such regions. AI = P/PET, where P denotes precipitation and PET represents potential evapotranspiration. Arid land can be divided into four categories based on the specific threshold values of AI: hyperarid (AI < 0.05), arid (0.05 ≤ AI < 0.20), semiarid (0.20 ≤ AI < 0.50), and dry subhumid (0.50 ≤ AI < 0.65) (Lian et al. Citation2021). This study encompassed all regions with an AI value below 0.65 ().
Figure 1. Global arid index and arid land distribution map; (a) global arid index (b) arid land categories.
3.2. Developing an index for measuring desertification
Cloud cover in remote sensing images hampers the timely characterization of ground objects. displays the spatial distribution of the minimum number of effective observation times derived from MODIS satellite images between 1 January 2000, and 31 December 2022, elucidating the extent of cloud pollution in arid areas. also reveals that more than 100 effective observations are available from most areas, with West Asia, North Africa, and central and western Australia having over 250 high-quality observations. Hence, MODIS data are feasible for long-term land desertification monitoring.
Figure 2. Number of high-quality observations and desertification indicators in arid areas globally; (a) minimum number of yearly cloud-free observations during 2000–2022; (b) average annual MSAVI; (c) average annual albedo; (d) average annual DDI; (e) correlation MSAVI and albedo time series coefficient; and (f) annual average scatter plot of MSAVI and albedo.
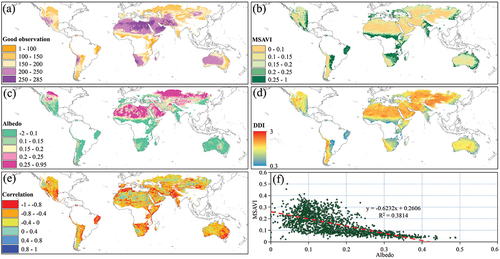
The quantity of vegetation plays a crucial role in assessing the extent of desertification (Eskandari Dameneh et al. Citation2021). The vegetation index is widely used as a dependable measure to assess the conditions of vegetation growth. The MSAVI has demonstrated efficacy in desertification studies of arid land (Eskandari Dameneh et al. Citation2021; Meng et al. Citation2021; Wen et al. Citation2020). By leveraging the NBAR product data, the MSAVI was calculated using the following formula:
where NIR represents the reflectivity of the near-infrared band, and RED corresponds to the reflectivity of the red band in the MODIS images. The global spatial distribution of the average MSAVI in arid land from 2000 to 2022 is characterized by predominantly high values in dry subhumid regions and low values mainly in hyperarid regions ().
Albedo is the ratio of the reflected surface flux to the incident solar radiation flux, which determines the extent of radiation energy absorption by the underlying surface (Guo and Wen Citation2020). Consequently, albedo is a significant parameter in the investigation of surface energy balance. With the exacerbation of desertification, there has been a simultaneous decline in surface water and surface roughness, increasing albedo. Thus, albedo is a crucial indicator for monitoring desertification (Lamaamri et al. Citation2023; Z. Wu et al. Citation2019). This study employed the MODIS surface albedo product MCD43A3 White-sky Albedo for the visible broadband spectrum to retrieve the albedo values. illustrates the spatial distribution characteristics of the average albedo from 2000 to 2022 within the global arid region. Notably, the hyperarid and arid regions of South America and Oceania exhibited the lowest albedo values, ranging from −2 to 0.15. The hyperarid land of North Africa and the arid and dry subhumid regions of northern Asia and North America displayed the highest albedo values.
The Desertification Distance Index (DDI) was calculated using a two-dimensional spatial feature model constructed by integrating the MSAVI and albedo (Guo et al. Citation2020). Different from the NDVI-albedo parameter estimation model (Lamaamri et al. Citation2023), the (1,0) non-desertification point serves as the reference point from which the distance to each point in all regions is evaluated, facilitating the characterization of the degree of desertification. This approach ensures that the independent evaluation results across regions remain comparable while maintaining the consistency of DDI, irrespective of the extent of the study area. Moreover, owing to DDI’s representation of continuous numerical data, it captures intricate details of land desertification, surpassing the capabilities of discrete data in denoting the degree of desertification. We employed DDI as the principal indicator for evaluating desertification in Mongolia. DDI was calculated using the following formula:
illustrates the spatial distribution of DDI for arid areas. Regions such as North Africa, North Asia, Central Asia, and West Asia exhibited elevated DDI values. This phenomenon is particularly evident in North Africa and North Asia, where DDI reached a maximum of approximately 1. DDI was lowest near the 20° north and south latitudes, ranging from 0.3 to 0.65.
displays the correlation coefficient graph between MSAVI and albedo from 2000 to 2022, showing a negative correlation (correlation coefficient less than 0) within 90% of the areas, with 16% of the areas having a correlation coefficient less than −0.8. This result indicates that an increase in surface vegetation is often accompanied by a significant decrease in albedo. This strong negative correlation may be related to specific environmental conditions or vegetation types. The scatter plot in further supports this negative correlation, where the annual average correlation coefficient is approximately −0.6, indicating a moderate to strong negative correlation. This decrease suggests that on a spatial scale, as the vegetation index MSAVI increases, albedo decreases; the specific relationship between them is a notable foundation for constructing DDI.
3.3. Segmental trend analysis
Changes in the land desertification process are typically non-monotonous and exhibit significant spatial heterogeneity (Browning et al. Citation2017; Jiang et al. Citation2019; Yang et al. Citation2022). Therefore, conducting a segmental trend analysis of desertification at the pixel scale is necessary. Additionally, the development of desertification is a relatively stable long-term process. Although a reasonable assumption is the presence of multiple effective inflection points within a single pixel, DDI was calculated from annual MODIS image data and considered the length of the time series. Consequently, we adopted a binary linear regression method to detect changes in desertification trends (Meng et al. Citation2021). This method allows the identification of significant shifts in the desertification process.
where y is the DDI trend, t is the year, α is the year at the turning point, β is the fitting parameter, and ε is the residual error. Because the slope obtained by linear regression is easily affected by outliers, this study used Sen’s slope analysis method (Gocic and Trajkovic Citation2013; Sen Citation1968) to calculate the DDI change trend before and after the mutation time and the Mann-Kendall method to test its significance (Silva et al. Citation2015).
3.4. Machine learning methods
We selected four commonly used machine learning models: Extreme Gradient Boosting (XGBoost), LightGBM (LGBM), Random Forest (RF), and Multi-Layer Perceptron (MLP). Each of these models has unique characteristics and can effectively handle both classification and regression tasks. The selection of these models was based on their outstanding performance and wide applicability in various fields such as finance, healthcare, and natural language processing. The following is a detailed introduction to each model.
XGBoost is a commonly used machine learning algorithm. It was developed by Chen and Guestrin (Citation2016) and is commonly used owing to its effectiveness and efficiency in solving various machine learning problems. The primary use of XGBoost is for supervised learning tasks, such as classification and regression problems (Ma et al. Citation2021). It can manage numerical and categorical input features and be applied to various domains, including finance, health care, and natural language processing.
LGBM is a highly efficient gradient boosting framework developed by Ke et al. (Citation2017). It was designed to be faster and more memory-efficient than traditional gradient boosting methods, making it suitable for large datasets with high-dimensional features. LightGBM supports both classification and regression tasks and can handle numerical and categorical features. It is widely used in various fields, including finance, healthcare, and recommendation systems, due to its high accuracy and scalability (Ke et al. Citation2017).
RF is an ensemble learning method introduced by Breiman (Citation2001). It operates by constructing a multitude of decision trees during training and outputting the mode of the classes for classification tasks or the mean prediction for regression tasks. The method improves predictive accuracy and controls overfitting by averaging multiple deep decision trees. RF can handle a mix of numerical and categorical features and are robust to noise and overfitting, making them popular in various applications, including finance, biology, and engineering (Breiman Citation2001).
MLP is a type of artificial neural network that consists of multiple layers of nodes, each layer fully connected to the next. It was first conceptualized by Rumelhart et al. (Citation1986). MLPs are used for both classification and regression tasks and can model complex relationships between inputs and outputs. They are particularly effective for problems where the relationship between inputs and outputs is nonlinear. MLPs have found applications in image recognition, speech recognition, and natural language processing (Rumelhart, Hinton, and Williams Citation1986).
We used the four machine learning models to construct nonlinear relationship models between environmental factors and the rate of change in DDI. Although machine learning models are widely popular for their excellent predictive performance, their decision-making processes are often not easy to understand due to their complexity. Thus, we used SHAP to provide detailed explanations for each prediction of the machine models, showing the specific contribution of each feature to the prediction outcome, increasing the transparency and credibility of the models.
3.5. Model interpretation
SHAP is a unified framework for interpreting the predictions of machine learning models (Lundberg and Lee Citation2017). It is based on the concept of Shapley values from cooperative game theory, which assigns each feature in a prediction model a unique contribution to the prediction outcome. The main goal of SHAP is to explain the output of a black-box model by attributing the prediction to different input features. This goal provides a means to understand the importance and impact of individual features on a model’s predictions (Zhang et al. Citation2023). SHAP has gained substantial attention in the field of interpretability and has been widely adopted in research and industrial applications (Feng et al. Citation2021; Mangalathu, Hwang, and Jeon Citation2020; Nazar et al. Citation2023). It provides a principled approach to understanding complex models and helps build trust and transparency in machine learning systems by explaining the reasoning behind their predictions. In cooperative game theory, Shapley values represent the average marginal contribution of each feature when considering all possible feature coalitions. In the context of machine learning, SHAP adapts Shapley values to compute the contribution of each feature in predicting a specific outcome. Shapely values can be calculated as follows:
where M is input features’ quantities and is the constant value when all
features are missing.
is defined as follows:
where is non-zero quantities in
.
is Shapely values (Lundberg and Lee Citation2017). SHAP facilitates the interpretation of feature contributions in model predictions on a local scale (local explanations) while enabling the computation of feature importance across the dataset (global explanations), offering insights into the relative significance of features for the overall model predictions. We applied the SHAP model to conduct an interpretability analysis of the results of the XGBoost model, quantifying the contribution rate of individual environmental factors and their interactions with the rate of change in DDI.
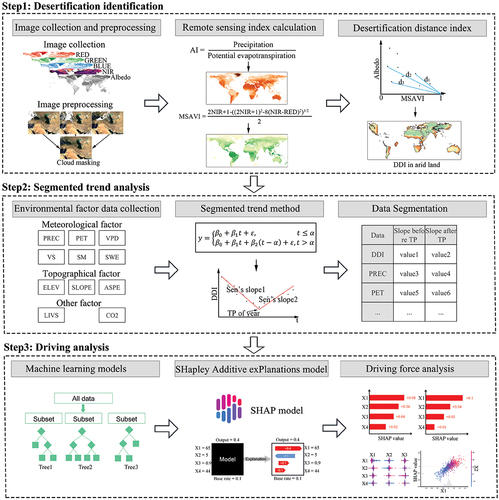
The technical flowchart in depicts the steps of this study. There are three main components: identification of desertification indicators, analysis of the segmental trend characteristics of desertification, and investigation of the driving mechanisms of desertification influenced by climate change and human activities.
Figure 3. Technical flow chart of the study.
4. Results
4.1. Fractional change characteristics of global desertification
presents a comprehensive analysis of DDI in arid regions, detailing segmental trends, change patterns, and turning points of time, as derived from the methodology outlined in EquationEquation (3)(3)
(3) . Before the turning point of DDI (denoted as T1 in ), there was a predominant trend of decreasing DDI values, indicating a gradual reduction in desertification. The rate of DDI change was primarily within the range of −0.002/y and 0/y, constituting approximately 33% of total arid land. Conversely, the area exhibiting a DDI decrease rate surpassing −0.004/y, representing the most substantial reduction in desertification, accounted for 11% of total arid land. After the turning point (T2 in ), the decreasing trend of DDI continued, indicating a further reduction in desertification. The rate of decrease after the turning point was higher than that during T1. The rate of decrease in DDI remained between −0.002/y and 0/y at T2, accounting for approximately 29%.
Figure 4. Comparison chart before and after DDI transition; (a) change trend of DDI before turning; (b) change trend of DDI after turning; (c) change type of DDI; and (d) time of DDI turning. Bar charts on the right show the proportion of each type on global arid land.
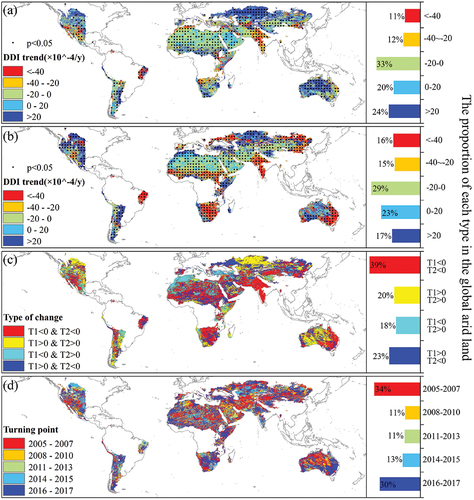
displays four main types of transitions in DDI: (1) decreases in the first and second stages (T1 < 0 and T2 < 0), (2) increases in the first and second stages (T1 > 0 and T2 > 0), (3) decreases in the first stage and increases in the second stage (T1 < 0 and T2 > 0), and (4) increases in the first stage and decreases in the second stage (T1 > 0 and T2 < 0). The most prevalent DDI transition types were T1 < 0 and T2 < 0, accounting for approximately 39%. TheT1 < 0 and T2 > 0 types accounted for 18%. Thus, the primary pattern of desertification was a decreasing trend that further decreased. provides insights into the distribution of the turning points in DDI. The majority of turning points were concentrated in 2005–2007, followed by 2016–2017, with a few occurrences in other years.
From a spatial perspective on trends, the majority of regions in Eurasia and North America exhibit consistent two-phase desertification development trends. However, this study observed a significant turning point in desertification in South America and Africa, potentially related to climate change and changes in land management practices. Such changes include fluctuations in precipitation, alterations in grazing management methods, and the implementation of ecological restoration projects (Meng et al. Citation2021). Additionally, with the demands of socioeconomic development, grazing pressure significantly increased in the later stages, elevating the risk of land desertification (Feng et al. Citation2015; Xie et al. Citation2023). Climate change also plays a substantial role in land degradation in these regions, and the turning phenomena of land desertification in Africa and South America could also be influenced by fluctuations in precipitation.
presents the statistical information regarding the trend of DDI across the arid land and the continents. In the first stage (before the turning point of DDI ), the semiarid area exhibited the widest range of DDI values. The area of intensified desertification spanned approximately 1035.63 × 104 km2, the highest proportion of the total arid land (approximately 17.04%). The semiarid area had the greatest extent of desertification mitigation, approximately 997.71 × 10⁴ km2 (16.76%). In dry, subhumid areas, the proportions of intensified desertification and desertification mitigation were relatively small, approximately 7%. In the second stage (T2, ), the DDI trends occurred within the range from −0.002/y to 0/y. Notably, the semiarid area was the largest desertification area, approximately 13.67% of the total arid land area. Similarly, the semiarid area accounted for the largest proportion of the area experiencing desertification reduction, approximately 20.5% (1219.9 × 104 km2). Dry subhumid areas exhibited the smallest extent of desertification aggravation or reduction among the four types.
Figure 5. Violin plot of DDI trends in arid areas and continents; (a) T1 DDI variation in arid areas; (b) T2 DDI variation in arid areas; (c) T1 DDI variation in continents; and (d) T2 DDI variation in continents.
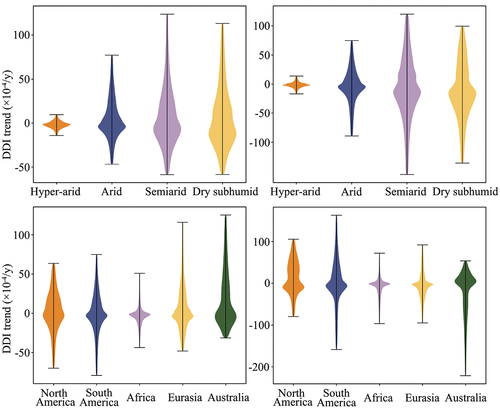
shows an overview of the changing trends in DDI across all continents within arid land. Spatial variations in the degree of desertification were significant. Before DDI transition (), the Eurasian continent exhibited the largest area of DDI increase, approximately 1069.22 × 104 km2, 17.99% of the global arid area. Conversely, the smallest increase in DDI occurred in South America, 3.32% of the global arid area. Among these regions, the Eurasian continent had the greatest coverage of significantly intensified desertification (11.77%). In North America, the area of significant desertification intensification was the smallest, 89.33 × 10⁴ km2. Regarding the areas where DDI decreased, Africa exhibited the widest distribution, approximately 23% of the global arid area, and South America exhibited the least distribution, approximately 4% of the global arid area. Among these regions, the areas with significantly reduced desertification were primarily in Africa, covering approximately 879.25 × 10⁴ km2, and their distribution in North America was relatively small, accounting for 1.82% of global arid areas.
After the turning point of DDI (), desertification intensification was primarily observed in Eurasia, Africa and Australia, with relatively small distributions in South America. Among these regions, Africa and Australia exhibited the widest and narrowest range of significant desertification increases, respectively. Areas experiencing desertification reduction were mainly distributed in Africa and Eurasia, with the scope of desertification reduction in Africa being the most extensive, approximately 17.11% of global arid areas.
In T1 and T2, areas with semiarid and dry subhumid climates had the most significant increase in the proportion of land undergoing desertification. A likely explanation for this finding is that lands in semiarid and dry subhumid regions are ecologically fragile. Human activities are frequent in these areas, and ecological disturbances, primarily from agricultural cultivation, abandonment, and grazing, increase the probability of land degradation. These regions also become key focal points for later land science management and desertification control efforts.
4.2. Segmented characteristics of dominant explanatory factors
illustrates the segmental trends of the four representative explanatory factors: precipitation (PREC), potential evapotranspiration (PET), vapor pressure difference (VPD), and soil moisture (SM). During T1, the area of significantly increased PREC was approximately 2186.71 × 104 km2, and the spatial extent exhibiting a significant decrease in PREC was approximately 1456.39 × 104 km2 (). During T2, the increase area in PREC was considerably less than the corresponding decrease area (). Moreover, the predominant transformation types for PREC were T1 > 0 and T2 < 0, encompassing an area of approximately 4629.40 × 104km2. In the case of TEMP, PET, VPD, SWE, and VS, the areas exhibiting a significant increase in these five explanatory factors surpassed the areas displaying a decrease, and the prevailing transformation types for these factors were predominantly T1 > 0 and T2 > 0 (). Additionally, the decreased area of SM exceeded the increased area, with the primary transformation types being T1 < 0 and T2 < 0 (). For CARB, during T1 and T2, CARB had an increasing trend (T1 > 0 and T2 > 0).
Figure 6. Segmental trends of main explanatory variables; (a) PREC change trend during T1; (b)PREC change trend during T2; (c) PET change trend during T1; (d) PET change trend during T2; (e) VPD change trend during T1; (f)VPD change trend during T2; (g) SM change trend during T1; and (h) SM change trend during T2.
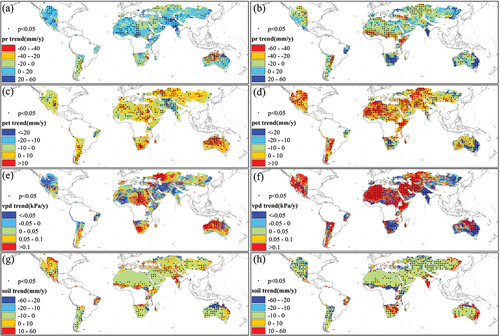
Global precipitation showed a significant trend of first increasing and then decreasing, with the Sahel region of North Africa as an example, where precipitation has a significant turning point and occupies a high proportion of the global precipitation turning area. This result is highly likely to influence the development trend of land desertification. PET and VPD, the main negative variables affecting vegetation growth, showed an increasing trends in both phases, indicating that global warming poses a risk of exacerbating global land desertification.
4.3. Influence of single factors on desertification
The relationship between environmental factors and DDI in arid land was established using XGBoost, RF, LGBM, and MLP. The precision of each model was calculated using 5-fold cross-validation and the evaluation metrics included Root Mean Squared Error (RMSE) and the Coefficient of Determination (R2). The results showed that RF performed the best across all metrics, with the lowest RMSE (20.5) and highest R2 (0.89). XGBoost followed, with an RMSE of 22.5 and R2 of 0.87. MLP model had moderate performance, with an RMSE of 36.5 and an R2 of 0.66. LGBM performed the worst, with an RMSE of 42 and an R2 of 0.57. Therefore, RF was selected to construct the relationship model between environmental factors and DDI.
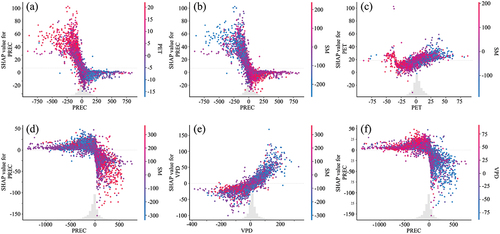
shows the global and local SHAP values for the factors influencing desertification. depicts the global importance ranking of all factors during T1. Among these factors, PREC emerged as the most important factor, with the average magnitude of its SHAP value reaching + 9.92, followed by SM and CARB, ranked according to importance. Factors, namely, VS, SWE, LIVS, and TEMP exhibited relatively low importance, with average SHAP values below + 2. Among all the factors, SLOPE, VPD, and ASPE demonstrated the least importance; the total magnitudes of their SHAP values were lower than + 3.5. shows the ranking of global importance for all factors during T2. Similar to that during T1, PREC remained the most important factor, with the average magnitude of its SHAP value increasing to + 12.93. VPD and SM followed PREC in importance. Moreover, their importance in T2 was higher than that in T1. The remaining explanatory variables were less important than PREC, VPD, and SM.
Figure 7. Driving force diagram of explanatory factors of desertification process; (a) global importance of factors during T1; (b) global importance of factors during T2; (c) local importance of factors during T1; and (d) local importance of factors during T2.
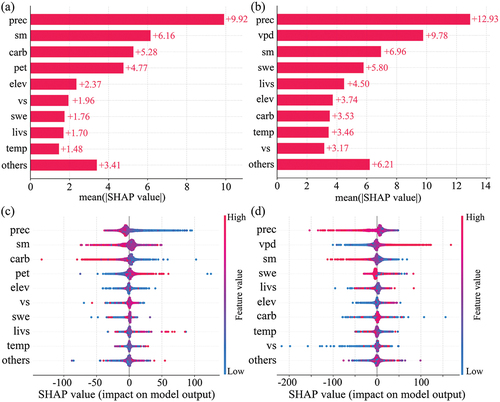
A local explanations study using SHAP values was conducted to determine the significance and direction of the factors. Insights into the local explanatory information of all factors are provided in , where the x-axis represents the SHAP value, and the color represents the value of the factor. During T1, PREC, CARB, and SM were negatively correlated with global desertification, and PET was positively correlated with desertification. In addition, elevation did not significantly influence global desertification. However, the lower the elevation, the higher the likelihood of desertification. Therefore, based on , a focus should be on the possibility of desertification in low-elevation areas to prevent its occurrence and expansion. During T2, PREC and SM continued to exhibit a negative correlation with global desertification, and VPD showed a positive correlation. This result implies that as global VPD increases, the likelihood of it aggravating desertification increases.
4.4. Interactive effects of explanatory factors on desertification
illustrates the coupling effects between the factors before and after DDI transformation. During T1, the most significant couplings were observed between PREC ∩ PET, PREC ∩ SM, and PET ∩ SM in relation to the desertification process. The SHAP values for these couplings were approximately 3.2 (1.6 × 2). The couplings between PREC ∩ ELEV, PREC ∩ CARB, CARB ∩ SM, and PET ∩ CARB were relatively weak. There was almost no coupling between the explanatory variable groups SWE ∩ ASPE and SWE ∩ SLOPE, with the samples randomly distributed.
Figure 8. SHAP values of coupling effect between factors. (a) Coupling effect between factors during T1; (b) Coupling effect among factors during T2.
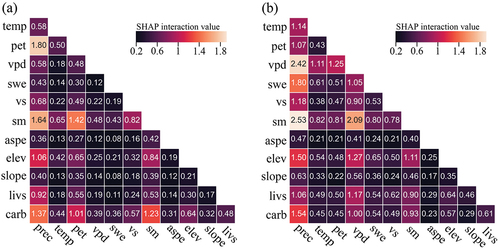
During T2, couplings between the factors were significantly enhanced. Notably, couplings between PREC ∩ SM, PREC ∩ VPD, VPD ∩ SM, and PREC ∩ CARB were stronger than other combinations of explanatory variables. Specifically, the SHAP coupling values for PREC ∩ SM and PREC ∩ VPD were as high as 5.06 (2.53 × 2) and 4.84 (2.42 × 2), respectively. Additionally, strong couplings were observed between VPD ∩ SM, PREC ∩ SWE, PREC ∩ CARB, PREC ∩ ELE, and VPD ∩ ELEV, with substantial SHAP coupling values. There was almost no coupling between the explanatory variable groups ASPE ∩ SLOPE and ASPE ∩ TEMP.
To facilitate a detailed discussion of the coupling effects between two explanatory factors, we generated dependence scatter plots (). In these plots, the x-axis represents the principal factor value, the y-axis represents the SHAP value, and the color indicates the secondary factor value. The coupling dependence between the pivotal factors of desertification during T1 is shown in . demonstrates that as PREC increased, PET decreased, and their coupling effect mitigated the degree of desertification, although the influence was relatively limited (mostly less than −0.002/y). Conversely, as the PREC trend decreased, the PET trend gradually increased, which contributed to the exacerbation of desertification, exhibiting a relatively extensive impact ranging from 0 to 0.006/y. As shown in , SM increased with the increase in PREC, and their combined effects led to a mitigation of desertification. This result indicates that PREC and SM are positively correlated, and both variables have a negative correlation with the rate of change in DDI. In other words, as PREC and SM increase, desertification is alleviated. As shown in , PET and SM exhibited a significant negative correlation, with SM values decreasing as PET increased, while the SHAP value for PET increased significantly, indicating an intensification of desertification.
Figure 9. Coupling dependence scatter plots of main explanatory factors; (a) PREC ∩ PET, (b) PREC ∩ SM, (c) PET ∩ SM, (d) PREC ∩ SM, (e) VPD ∩ SM, and (f) PREC ∩ VPD.
The coupling dependence of the pivotal factors of desertification during T2 is shown in . When the PREC trend was less than 0, the SM exhibited a downward trend, indicating the intensification of desertification (indicated by a positive SHAP value). As PREC and SM increased, the degree of desertification demonstrated a decreasing trend, as low as −0.008/y. As shown in , SM decreased with increasing VPD, leading to the continued intensification of desertification. When the VPD trend was negative, SM rapidly increased, further intensifying desertification. Regarding the interaction between PREC and VPD (), it was exactly the opposite of that between PREC and SM. As PREC increased, VPD significantly decreased, leading to a rapid intensification of desertification, with the maximum annual increase rate of DDI being around 0.01/y. These dependence scatter plots provide valuable insights into the coupling effects between explanatory factors and their impact on desertification during stages T1 and T2.
Globally, natural factors, especially precipitation and SM, remain the primary influence on the process of desertification, however, the impact of human activities in specific regions must be considered. The reversal of desertification in countries such as China and India is mainly attributed to ecological restoration projects and the expansion of farmland (Piao et al. Citation2020). Moreover, in the second phase, the contribution of the factor of livestock numbers increased, second to SM. Thus, with socioeconomic development, rational grazing and scientific land management have become increasingly important measures for preventing and mitigating land desertification.
4.5. Accuracy assessment of desertification results
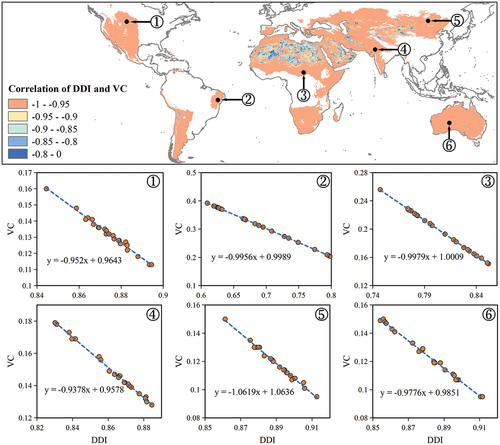
Vegetation cover can serve as an important indicator for characterizing the degree of desertification, and vegetation cover has been used as the criterion for assessing desertification (Hein and De Ridder Citation2006; Kundu et al. Citation2015; Symeonakis and Drake Citation2004; Wei et al. Citation2018). This section demonstrates the credibility of the DDI results by evaluating the correlation between DDI and vegetation cover. Vegetation cover was calculated using the pixel dichotomy model (Wei et al. Citation2018). shows the distribution of the correlation coefficients between DDI and vegetation cover (VC) globally for 2000–2022. Regarding the spatial distribution of correlation, 86% of the global area had a correlation coefficient less than −0.95, with the remaining 14% (correlation coefficient greater than −0.95) of the area primarily concentrated in extremely arid desert regions such as the Sahara Desert, the Arabian Peninsula, and the Taklamakan Desert. This finding may be due to the extremely low VC and DDI values in these regions, where the change in both values during the study period is less than the sensor noise value, causing spurious correlations. shows six sites from various continents to show specific correlations. All six scatter plots show a clear negative correlation (correlation coefficient greater than 0.99); as VC decreased, DDI correspondingly increased (i.e. the degree of desertification intensified).
Figure 10. Correlation graph between Global Desertification Distance Index (DDI) and Vegetation Cover (VC).
5. Discussion
5.1. Global desertification trends and their driving factors
According to statistical results from different arid regions or continents, there has been a significant reversal in desertification globally since 2000. The abundance of vegetation is an important indicator for characterizing desertification in arid lands and if vegetation is used as a reference, the results of this study are consistent with those of Piao et al. (Citation2020), indicating that global vegetation greenness has been increasing during this study. The reversal of desertification is the mainstream trend, and regional differences are pronounced. China and India are the main areas of desertification reversal for opposite reasons. China has implemented the Grain for Green program, resulting in a significant increase in vegetation in the Loess Plateau and achieving zero growth in land degradation (He, Shang, and Zhang Citation2021; Wang et al. Citation2021). India has implemented agricultural intensification, converting arid land into farmland, which also achieved the goal of increasing vegetation from the satellite perspective but many scholars believe this method is unsustainable. Moreover, the amount of dust released during the fallow period of crop rotation is also large (Pi et al. Citation2018). As shown in , the majority of areas in northern Russia on the Eurasian continent have experienced an intensification of desertification in both phases, which is directly related to the increase in atmospheric saturated VPD, increased evapotranspiration, and reduced SM. This research result refines the belief that rising temperatures are the cause of intensified desertification in Russia (Zolotokrylin et al. Citation2016). There is a distinct semiarid region in northeastern Brazil in South America. The present study showed that before 2016, most areas in this region showed a weakening trend in desertification, with few cities in the central part showing an intensifying trend. Our results are highly consistent with those of Bezerra et al. (Citation2020). Areas where desertification intensified are characterized by tropical-arid or tropical-semiarid climates, with the Caatinga biome dominating (Bezerra et al. Citation2020). Our observations indicate a general decline in desertification trends in the Sahel region, located to the south of the Sahara in North Africa, aligning with the findings reported by Yang et al. (Citation2022). However, different from Yang et al. (Citation2022), we did not find that precipitation was the main driving force affecting the reversal of desertification in the region; instead, VPD, PET, and SM were the main influencing factors. This difference may be because Yang et al. (Citation2022) based the driving model on spatial structure. Spatially, desertification is related to precipitation but land desertification is a dynamically changing geographical phenomenon, and analyzing the temporal development trend of desertification from fixed locations is an important method for dissecting the causes of desertification. Therefore, the attribution results we obtained can realistically reflect the causes of changes in desertification. This type of research, using the variability of geographical variables as the dependent variable in the attribution model, has been widely applied in other fields of geography (Huang et al. Citation2021; Meng et al. Citation2020).
5.2. Key areas for desertification control and suggested measures
As shown in , lands experiencing an intensification of desertification are primarily concentrated in arid and dry subhumid regions, becoming globally vulnerable areas for desertification (He et al. Citation2023; Xue et al. Citation2019). The reasons for this finding include but are not limited to human activities such as excessive grazing, farming and abandonment of cultivated lands, and mineral development, coupled with the variability in precipitation caused by unstable monsoons in these regions, which further increases the frequency of surface vegetation fluctuations (D’Odorico et al. Citation2013). Therefore, areas for desertification control should first focus on regions heavily affected by climate change and human activities, such as the agro-pastoral ecotones and grazing areas (Yue, Geng, and Li Citation2023; Zhou et al. Citation2019). Regarding specific spatial distribution (), regions where desertification intensified in both phases mainly included central and western Australia, eastern Russia, the north-central United States, south-central Canada, and a small part of eastern Mongolia. These regions have specific characteristics of land degradation; thus, desertification control should be tailored to local conditions. Central and western Australia and eastern Mongolia should protect and restore native vegetation and scientifically develop agriculture and animal husbandry based on water resources and livestock carrying capacity. North America should develop sustainable land use and management methods, improve agricultural practices, and enhance drought response capabilities. Desertification in eastern Russia is mainly attributed to climate change, deforestation, and improper use of water resources; thus, its control policies should strengthen forest management, limit deforestation, and enhance the capabilities of forest fire monitoring and firefighting.
This study systematically analyzed land desertification development information across global regions and clarified patterns of desertification development and driving forces, providing important information to support the formulation of environmental policies and land management.
5.3. Limitations and further research
This study has three notable limitations. First, as shown in , certain regions, particularly North Asia, exhibited a scarcity of observations, with the minimum number of observations per year below 100. Fewer cloud-free observations led to a significant reduction in the quality of regional satellite monitoring, which directly increased the uncertainty of the MSAVI observations, affecting the assessment results of global desertification trends. Therefore, further research could combine multi-source remote sensing data to reduce the influence of clouds, cloud shadows, and other factors on monitoring results and to improve research accuracy (Balha et al. Citation2021).
Second, because desertification is a slow-changing process, using the dichotomous trend analysis method in this study to assess the changing characteristics of desertification was reasonable, considering the relatively short study period of 23 years (Meng et al. Citation2020). However, certain arid lands worldwide may undergo desertification development processes that involve three or more stages of change. Therefore, further research could refine the segmental analysis approach to comprehensively capture and account for the multistage change characteristics of global desertification, deepening the understanding of desertification dynamics and increasing the accuracy of assessments of desertification patterns and trends.
Third, desertification can be characterized by factors other than changes in vegetation. For example, the transformation from grassland to shrubland landscapes is another form of land degradation or desertification (Bestelmeyer et al. Citation2018). This definition is because an increase in shrub cover, leading to a decrease in grassland area, increases the grazing concentration, accelerating grassland degradation (van de Koppel et al. Citation2002). Additionally, in areas dominated by shrubs, the low grass cover increases the likelihood of wind erosion, leading to the loss of soil organic matter and creating a vicious cycle of land degradation. However, such degradation is difficult to capture with medium-resolution satellite imagery such as MODIS and AVHRR. Thus, for such types of land degradation, further research could combine sub-meter satellite data and drone imagery to develop identification and assessment methods.
6. Conclusion
We utilized MODIS satellite images and the machine learning and SHAP model to systematically evaluate the segmental change characteristics of desertification in arid lands globally. The impact of climate change and human activities on global desertification was quantitatively analyzed, providing new insights into its prevention and control. The main conclusions are as follows:
From 2000 to 2022, desertification of arid land exhibited a decreasing trend globally, with a slower reduction rate before the turning point of DDI than after the turning point. Continuous desertification mitigation was the dominant turning type, and the transition time of DDI was primarily concentrated in 2005–2007 and 2016–2017. During T1, PREC was the most important factor, followed by SM and CARB. During T2, PREC remained the most important factor, followed by VPD and SM. Additionally, the coupling effect analysis revealed strong couplings between PREC and PET, PREC and SM, and PET and SM during T1, with a SHAP value of 3.2. During T2, the couplings among explanatory factors were significantly enhanced, particularly between PREC and SM, PREC, and VPD, with a SHAP value of 4.9 for these two groups.
In summary, fluctuations in PREC and SM are significant bimodal characteristic driving factors of global land desertification. In the later stages of the study, the impact of livestock numbers on desertification increased. Future desertification prevention and control should focus on dry subhumid and semiarid regions. The research revealed that the development trend of land desertification in some areas has multiple fluctuation characteristics, necessitating segmented methods for precise identification.
These findings highlight the complex dynamics of desertification and underscore the importance of considering both climatic and anthropogenic factors to understand its changes. This study provides valuable insights to guide effective measures to prevent and control global desertification.
Disclosure statement
No potential conflict of interest was reported by the author(s).
Data availability statement
The raw data required to reproduce the above findings are available to download from https://modis.gsfc.nasa.gov/data/(MODIS. images) and https://www.climatologylab.org/terraclimate.html (Terraclimate data). The processed data required to reproduce the above findings are available to download from 10.6084/m9.figshare.25989064.v1 and 10.6084/m9.figshare.25990534.v1.
Additional information
Funding
References
- Abatzoglou, J. T., S. Z. Dobrowski, S. A. Parks, and K. C. Hegewisch. 2018. “TerraClimate, a High-Resolution Global Dataset of Monthly Climate and Climatic Water Balance from 1958–2015.” Scientific Data 5 (1): 170191. https://doi.org/10.1038/sdata.2017.191.
- Akbari, M., R. Modarres, and M. Alizadeh Noughani. 2020. “Assessing Early Warning for Desertification Hazard Based on E-SMART Indicators in Arid Regions of Northeastern Iran.” Journal of Arid Environments 174:104086. https://doi.org/10.1016/j.jaridenv.2019.104086.
- Badreldin, N., A. Frankl, and R. Goossens. 2014. “Assessing the Spatiotemporal Dynamics of Vegetation Cover as an Indicator of Desertification in Egypt Using Multi-Temporal MODIS Satellite Images.” Arabian Journal of Geosciences 7 (11): 4461–22. https://doi.org/10.1007/s12517-013-1142-8.
- Balha, A., J. Mallick, S. Pandey, S. Gupta, and C. K. Singh. 2021. “A Comparative Analysis of Different Pixel and Object-Based Classification Algorithms Using Multi-Source High Spatial Resolution Satellite Data for LULC Mapping.” Earth Science Informatics 14 (4): 2231–2247. https://doi.org/10.1007/s12145-021-00685-4.
- Batunacun, W. R., T. Lakes, and C. Nendel. 2021. “Using Shapley Additive Explanations to Interpret Extreme Gradient Boosting Predictions of Grassland Degradation in Xilingol, China.” Geoscientific Model Development 14 (3): 1493–1510. https://doi.org/10.5194/gmd-14-1493-2021.
- Becerril, P. R., and L. C. A. Mastachi. 2021. “Desertification: Causes and Countermeasures.” In Life on Land, edited by W. Leal Filho, A. M. Azul, L. Brandli, A. Lange Salvia, and T. Wall, 219–231. Cham: Springer International Publishing. https://doi.org/10.1007/978-3-319-95981-8_81.
- Bestelmeyer, B. T., D. P. C. Peters, S. R. Archer, D. M. Browning, G. S. Okin, R. L. Schooley, and N. P. Webb. 2018. “The Grassland–Shrubland Regime Shift in the Southwestern United States: Misconceptions and Their Implications for Management.” BioScience 68 (9): 678–690. https://doi.org/10.1093/biosci/biy065.
- Bezerra, F. G. S., A. P. D. Aguiar, R. C. S. Alvalá, A. Giarolla, K. R. A. Bezerra, P. V. P. S. Lima, F. R. Do Nascimento, and E. Arai. 2020. “Analysis of Areas Undergoing Desertification, Using EVI2 Multi-Temporal Data Based on MODIS Imagery as Indicator.” Ecological Indicators 117:106579. https://doi.org/10.1016/j.ecolind.2020.106579.
- Breiman, L. 2001. “Random Forests.” Machine Learning 45 (1): 5–32. https://doi.org/10.1023/A:1010933404324.
- Browning, D. M., J. J. Maynard, J. W. Karl, and D. C. Peters. 2017. “Breaks in MODIS Time Series Portend Vegetation Change: Verification Using Long-Term Data in an Arid Grassland Ecosystem.” Ecological Applications 27 (5): 1677–1693. https://doi.org/10.1002/eap.1561.
- Chen, T., and C. Guestrin. 2016. “XGBoost: A Scalable Tree Boosting System.” Proceedings of the 22nd ACM SIGKDD International Conference on Knowledge Discovery and Data Mining, 785–794. https://doi.org/10.1145/2939672.2939785.
- Descals, A., A. Verger, G. Yin, I. Filella, and J. Peñuelas. 2023. “Local Interpretation of Machine Learning Models in Remote Sensing with SHAP: The Case of Global Climate Constraints on Photosynthesis Phenology.” International Journal of Remote Sensing 44 (10): 3160–3173. https://doi.org/10.1080/01431161.2023.2217982.
- D’Odorico, P., A. Bhattachan, K. F. Davis, S. Ravi, and C. W. Runyan. 2013. “Global Desertification: Drivers and Feedbacks.” Advances in Water Resources, 35th Year Anniversary 51 (51): 326–344. https://doi.org/10.1016/j.advwatres.2012.01.013.
- Eskandari Dameneh, H., H. Gholami, M. W. Telfer, J. R. Comino, A. L. Collins, and J. D. Jansen. 2021. “Desertification of Iran in the Early Twenty-First Century: Assessment Using Climate and Vegetation Indices.” Scientific Reports 11 (1): 20548. https://doi.org/10.1038/s41598-021-99636-8.
- Farr, T. G., P. A. Rosen, E. Caro, R. Crippen, R. Duren, S. Hensley, M. Kobrick, et al. 2007. “The Shuttle Radar Topography Mission.” Reviews of Geophysics 45 (2). https://doi.org/10.1029/2005RG000183.
- Feng, Q., H. Ma, X. Jiang, X. Wang, and S. Cao. 2015. “What has Caused Desertification in China?” Scientific Reports 5 (1): 15998. https://doi.org/10.1038/srep15998.
- Feng, D.-C., W.-J. Wang, S. Mangalathu, and E. Taciroglu. 2021. “Interpretable XGBoost-SHAP Machine-Learning Model for Shear Strength Prediction of Squat RC Walls.” Journal of Structural Engineering 147 (11): 04021173. https://doi.org/10.1061/(ASCE)ST.1943-541X.0003115.
- Geng, L., T. Che, M. Ma, J. Tan, and H. Wang. 2021. “Corn Biomass Estimation by Integrating Remote Sensing and Long-Term Observation Data Based on Machine Learning Techniques.” Remote Sensing 13 (12): 2352. https://doi.org/10.3390/rs13122352.
- Gocic, M., and S. Trajkovic. 2013. “Analysis of Changes in Meteorological Variables Using Mann-Kendall and Sen’s Slope Estimator Statistical Tests in Serbia.” Global and Planetary Change 100:172–182. https://doi.org/10.1016/j.gloplacha.2012.10.014.
- Guo, B., and Y. Wen. 2020. “An Optimal Monitoring Model of Desertification in Naiman Banner Based on Feature Space Utilizing Landsat8 Oli Image.” Institute of Electrical and Electronics Engineers Access 8:4761–4768. https://doi.org/10.1109/ACCESS.2019.2962909.
- Guo, B., F. Yang, Y. Fan, and W. Zang. 2023. “The Dominant Driving Factors of Rocky Desertification and Their Variations in Typical Mountainous Karst Areas of Southwest China in the Context of Global Change.” CATENA 220:106674. https://doi.org/10.1016/j.catena.2022.106674.
- Guo, B., W. Zang, B. Han, F. Yang, W. Luo, T. He, Y. Fan, X. Yang, and S. Chen. 2020. “Dynamic Monitoring of Desertification in Naiman Banner Based on Feature Space Models with Typical Surface Parameters Derived from LANDSAT Images.” Land Degradation & Development N/a 31 (12): 1573–1592. https://doi.org/10.1002/ldr.3533.
- Han, X., G. Jia, G. Yang, N. Wang, F. Liu, H. Chen, X. Guo, W. Yang, and J. Liu. 2020. “Spatiotemporal Dynamic Evolution and Driving Factors of Desertification in the Mu Us Sandy Land in 30 Years.” Scientific Reports 10 (1): 21734. https://doi.org/10.1038/s41598-020-78665-9.
- He, T., F. Gao, S. Liang, and Y. Peng. 2019. “Mapping Climatological Bare Soil Albedos Over the Contiguous United States Using MODIS Data.” Remote Sensing 11 (6): 666. https://doi.org/10.3390/rs11060666.
- He, P., Z. Han, M. He, X. Meng, X. Ma, H. Liu, T. Dong, M. Shi, and Z. Sun. 2023. “Atmospheric Dryness Thresholds of Grassland Productivity Decline in China.” Journal of Environmental Management 338:117780. https://doi.org/10.1016/j.jenvman.2023.117780.
- Hein, L., and N. De Ridder. 2006. “Desertification in the Sahel: A Reinterpretation.” Global Change Biology 12 (5): 751–758. https://doi.org/10.1111/j.1365-2486.2006.01135.x.
- Heinrich, V. H. A., C. Vancutsem, R. Dalagnol, T. M. Rosan, D. Fawcett, C. H. L. Silva-Junior, H. L. G. Cassol, et al. 2023. “The Carbon Sink of Secondary and Degraded Humid Tropical Forests.” Nature 615 (7952): 436–442. https://doi.org/10.1038/s41586-022-05679-w.
- He, C., M. Ji, T. Li, X. Liu, D. Tang, S. Zhang, Y. Luo, M. L. Grieneisen, Z. Zhou, and Y. Zhan. 2022. “Deriving Full-Coverage and Fine-Scale XCO2 Across China Based on OCO-2 Satellite Retrievals and CarbonTracker Output.” Geophysical Research Letters 49 (12): e2022GL098435. https://doi.org/10.1029/2022GL098435.
- He, Z., X. Shang, and T. Zhang. 2021. “Spatiotemporal Evaluation and Driving Mechanism of Land Ecological Security in Yan’an, a Typical Hill-Gully Region of China’s Loess Plateau, from 2000 to 2018.” Forests 12 (12): 1754. https://doi.org/10.3390/f12121754.
- Hosseiny, B., A. M. Abdi, and S. Jamali. 2022. “Urban Land Use and Land Cover Classification with Interpretable Machine Learning – A Case Study Using Sentinel-2 and Auxiliary Data.” Remote Sensing Applications: Society & Environment 28:100843. https://doi.org/10.1016/j.rsase.2022.100843.
- Huang, H., Y. Chen, N. Clinton, J. Wang, X. Wang, C. Liu, P. Gong, et al. 2017. “Mapping Major Land Cover Dynamics in Beijing Using All Landsat Images in Google Earth Engine.” Remote Sensing of Environment, Big Remotely Sensed Data: Tools, Applications and Experiences 202:166–176. https://doi.org/10.1016/j.rse.2017.02.021.
- Huang, W., W. Duan, and Y. Chen. 2022. “Unravelling Lake Water Storage Change in Central Asia: Rapid Decrease in Tail-End Lakes and Increasing Risks to Water Supply.” Journal of Hydrology 614:128546. https://doi.org/10.1016/j.jhydrol.2022.128546.
- Huang, W., W. Duan, D. Nover, N. Sahu, and Y. Chen. 2021. “An Integrated Assessment of Surface Water Dynamics in the Irtysh River Basin During 1990–2019 and Exploratory Factor Analyses.” Journal of Hydrology 593:125905. https://doi.org/10.1016/j.jhydrol.2020.125905.
- Huang, J., G. Zhang, Y. Zhang, X. Guan, Y. Wei, and R. Guo. 2020. “Global Desertification Vulnerability to Climate Change and Human Activities.” Land Degradation & Development 31 (11): 1380–1391. https://doi.org/10.1002/ldr.3556.
- Hu, Y., Y. Han, and Y. Zhang. 2020. “Land Desertification and Its Influencing Factors in Kazakhstan.” Journal of Arid Environments 180:104203. https://doi.org/10.1016/j.jaridenv.2020.104203.
- Jiang, L., G. Jiapaer, A. Bao, A. Kurban, H. Guo, G. Zheng, and P. De Maeyer. 2019. “Monitoring the Long-Term Desertification Process and Assessing the Relative Roles of Its Drivers in Central Asia.” Ecological Indicators 104:195–208. https://doi.org/10.1016/j.ecolind.2019.04.067.
- Ke, G., Q. Meng, T. Finley, T. Wang, W. Chen, W. Ma, Q. Ye, and T.-Y. Liu. 2017. “LightGBM: A Highly Efficient Gradient Boosting Decision Tree.” In Proceedings of the 31st International Conference on Neural Information Processing Systems, edited by von Luxburg Ulrike and Guyon Isabelle, 3149–3157. Long Beach, California, USA: Curran Associates, Inc. https://dl.acm.org/doi/proceedings/10.5555/3294996.
- Kundu, A., N. R. Patel, S. K. Saha, and D. Dutta. 2015. “Monitoring the Extent of Desertification Processes in Western Rajasthan (India) Using Geo-Information Science.” Arabian Journal of Geosciences 8 (8): 5727–5737. https://doi.org/10.1007/s12517-014-1645-y.
- Lamaamri, M., N. Lghabi, A. Ghazi, N. El Harchaoui, M. S. G. Adnan, and M. Shakiul Islam. 2023. “Evaluation of Desertification in the Middle Moulouya Basin (North-East Morocco) Using Sentinel-2 Images and Spectral Index Techniques.” Earth Systems and Environment 7 (2): 473–492. https://doi.org/10.1007/s41748-022-00327-9.
- Lamqadem, A. A., B. Pradhan, H. Saber, and A. Rahimi. 2018. “Desertification Sensitivity Analysis Using MEDALUS Model and GIS: A Case Study of the Oases of Middle Draa Valley, Morocco.” Sensors 18 (7): 2230. https://doi.org/10.3390/s18072230.
- Lamqadem, A. A., H. Saber, and B. Pradhan. 2018. “Quantitative Assessment of Desertification in an Arid Oasis Using Remote Sensing Data and Spectral Index Techniques.” Remote Sensing 10 (12): 1862. https://doi.org/10.3390/rs10121862.
- Lian, X., S. Piao, A. Chen, C. Huntingford, B. Fu, L. Z. X. Li, J. Huang, et al. 2021. “Multifaceted Characteristics of Dryland Aridity Changes in a Warming World.” Nature Reviews Earth and Environment 2 (4): 232–250. https://doi.org/10.1038/s43017-021-00144-0.
- Li, M., J. Guan, and J. Zheng. 2022. “Climate Drivers Contribute in Vegetation Greening Stalls of Arid Xinjiang, China: An Atmospheric Water Drying Effect.” Water 14 (13): 2019. https://doi.org/10.3390/w14132019.
- Liu, Z., J. Si, Y. Deng, B. Jia, X. Li, X. He, D. Zhou, et al. 2023. “Assessment of Land Desertification and its Drivers in Semi-Arid Alpine Mountains: A Case Study of the Qilian Mountains Region, Northwest China.” Remote Sensing 15 (15): 3836. https://doi.org/10.3390/rs15153836.
- Liu, Q., Q. Zhang, Y. Yan, X. Zhang, J. Niu, and J.-C. Svenning. 2020. “Ecological Restoration is the Dominant Driver of the Recent Reversal of Desertification in the Mu Us Desert (China).” Journal of Cleaner Production 268:122241. https://doi.org/10.1016/j.jclepro.2020.122241.
- Lundberg, S., and S.-I. Lee. 2017. “A Unified Approach to Interpreting Model Predictions.” https://doi.org/10.48550/arXiv.1705.07874.
- Mangalathu, S., S.-H. Hwang, and J.-S. Jeon. 2020. “Failure Mode and Effects Analysis of RC Members Based on Machine-Learning-Based SHapley Additive explanations (SHAP) Approach.” Engineering Structures 219:110927. https://doi.org/10.1016/j.engstruct.2020.110927.
- Ma, M., G. Zhao, B. He, Q. Li, H. Dong, S. Wang, and Z. Wang. 2021. “XGBoost-Based Method for Flash Flood Risk Assessment.” Journal of Hydrology 598:126382. https://doi.org/10.1016/j.jhydrol.2021.126382.
- Ma, X., J. Zhu, W. Yan, and C. Zhao. 2021. “Projections of Desertification Trends in Central Asia Under Global Warming Scenarios.” Science of the Total Environment 781:146777. https://doi.org/10.1016/j.scitotenv.2021.146777.
- Meng, X., X. Gao, S. Li, and J. Lei. 2020. “Spatial and Temporal Characteristics of Vegetation NDVI Changes and the Driving Forces in Mongolia During 1982–2015.” Remote Sensing 12 (4): 603. https://doi.org/10.3390/rs12040603.
- Meng, X., X. Gao, S. Li, S. Li, and J. Lei. 2021. “Monitoring Desertification in Mongolia Based on Landsat Images and Google Earth Engine from 1990 to 2020.” Ecological Indicators 129:107908. https://doi.org/10.1016/j.ecolind.2021.107908.
- Nasa, J. 2013. NASA Shuttle Radar Topography Mission Global 1 Arc Second. NASA EOSDIS Land Processes DAAC. https://doi.org/10.5067/MEASURES/SRTM/SRTMGL1.003.
- Nazar, S., J. Yang, X.-E. Wang, K. Khan, M. N. Amin, M. F. Javed, F. Althoey, and M. Ali. 2023. “Estimation of Strength, Rheological Parameters, and Impact of Raw Constituents of Alkali-Activated Mortar Using Machine Learning and SHapely Additive exPlanations (SHAP).” Construction and Building Materials 377:131014. https://doi.org/10.1016/j.conbuildmat.2023.131014.
- Park, H., S. Jeong, and J. Peñuelas. 2020. “Accelerated Rate of Vegetation Green-Up Related to Warming at Northern High Latitudes.” Global Change Biology 26 (11): 6190–6202. https://doi.org/10.1111/gcb.15322.
- Piao, S., X. Wang, T. Park, C. Chen, X. Lian, Y. He, J. W. Bjerke, et al. 2020. “Characteristics, Drivers and Feedbacks of Global Greening.” Nature Reviews Earth and Environment 1 (1): 14–27. https://doi.org/10.1038/s43017-019-0001-x.
- Pi, H., B. Sharratt, W. F. Schillinger, A. I. Bary, and C. G. Cogger. 2018. “Wind Erosion Potential of a Winter Wheat–Summer Fallow Rotation After Land Application of Biosolids.” Aeolian Research 32:53–59. https://doi.org/10.1016/j.aeolia.2018.01.009.
- Rumelhart, D. E., G. E. Hinton, and R. J. Williams. 1986. “Learning Representations by Back-Propagating Errors.” Nature 323 (6088): 533–536. https://doi.org/10.1038/323533a0.
- Sen, P. K. 1968. “Estimates of the Regression Coefficient Based on Kendall’s Tau.” Journal of the American Statistical Association 63 (324): 1379–1389. https://doi.org/10.1080/01621459.1968.10480934.
- Sepehr, A., A. M. Hassanli, M. R. Ekhtesasi, and J. B. Jamali. 2007. “Quantitative Assessment of Desertification in South of Iran Using MEDALUS Method.” Environmental Monitoring and Assessment 134 (1–3): 243–254. https://doi.org/10.1007/s10661-007-9613-6.
- Silva, R. M., C. A. G. Santos, M. Moreira, J. Corte-Real, V. C. L. Silva, and I. C. Medeiros. 2015. “Rainfall and River Flow Trends Using Mann–Kendall and Sen’s Slope Estimator Statistical Tests in the Cobres River Basin.” Natural Hazards 77 (2): 1205–1221. https://doi.org/10.1007/s11069-015-1644-7.
- Symeonakis, E., and N. Drake. 2004. “Monitoring Desertification and Land Degradation Over Sub-Saharan Africa.” International Journal of Remote Sensing 25 (3): 573–592. https://doi.org/10.1080/0143116031000095998.
- Tian, X., Q. Liu, Z. Song, B. Dou, and X. Li. 2018. “Aerosol Optical Depth Retrieval from Landsat 8 OLI Images Over Urban Areas Supported by MODIS BRDF/Albedo Data.” IEEE Geoscience and Remote Sensing Letters 15 (7): 976–980. https://doi.org/10.1109/LGRS.2018.2827200.
- Tiwari, A. D., Y. Pokhrel, D. Kramer, T. Akhter, Q. Tang, J. Liu, J. Qi, H. H. Loc, and V. Lakshmi. 2023. “A Synthesis of Hydroclimatic, Ecological, and Socioeconomic Data for Transdisciplinary Research in the Mekong.” Scientific Data 10 (1): 283. https://doi.org/10.1038/s41597-023-02193-0.
- Ullah, S., Q. You, D. A. Sachindra, M. Nowosad, W. Ullah, A. S. Bhatti, Z. Jin, and A. Ali. 2022. “Spatiotemporal Changes in Global Aridity in Terms of Multiple Aridity Indices: An Assessment Based on the CRU Data.” Atmospheric Research 268:105998. https://doi.org/10.1016/j.atmosres.2021.105998.
- van de Koppel, J., M. Rietkerk, F. van Langevelde, L. Kumar, C. A. Klausmeier, J. M. Fryxell, J. W. Hearne, et al. 2002. “Spatial Heterogeneity and Irreversible Vegetation Change in Semiarid Grazing Systems.” The American Naturalist 159 (2): 209–218. https://doi.org/10.1086/324791.
- van der Laan-Luijkx, I. T., I. R. van der Velde, M. C. Krol, L. V. Gatti, L. G. Domingues, C. S. C. Correia, J. B. Miller, et al. 2015. “Response of the Amazon Carbon Balance to the 2010 Drought Derived with CarbonTracker South America.” Global Biogeochemical Cycles 29 (7): 1092–1108. https://doi.org/10.1002/2014GB005082.
- Wang, H., W. Zhao, C. Li, and P. Pereira. 2021. “Vegetation Greening Partly Offsets the Water Erosion Risk in China from 1999 to 2018.” Geoderma 401:115319. https://doi.org/10.1016/j.geoderma.2021.115319.
- Wei, X., S. Wang, Y. Wang, and R. Li. 2018. “Spatial and Temporal Change of Fractional Vegetation Cover in North-Western China from 2000 to 2010.” Geological Journal 53 (S2): 427–434. https://doi.org/10.1002/gj.3030.
- Wen, Y., B. Guo, W. Zang, D. Ge, W. Luo, and H. Zhao. 2020. “Desertification Detection Model in Naiman Banner Based on the Albedo-Modified Soil Adjusted Vegetation Index Feature Space Using the Landsat8 OLI Images.” Geomatics, Natural Hazards and Risk 11 (1): 544–558. https://doi.org/10.1080/19475705.2020.1734100.
- Wu, C., S. R. Coffield, M. L. Goulden, J. T. Randerson, A. T. Trugman, and W. R. L. Anderegg. 2023. “Uncertainty in US Forest Carbon Storage Potential Due to Climate Risks.” Nature Geoscience 16 (5): 422–429. https://doi.org/10.1038/s41561-023-01166-7.
- Wu, Z., S. Lei, Z. Bian, J. Huang, and Y. Zhang. 2019. “Study of the Desertification Index Based on the Albedo-MSAVI Feature Space for Semi-Arid Steppe Region.” Environmental Earth Sciences 78 (6): 232. https://doi.org/10.1007/s12665-019-8111-9.
- Xie, J., Z. Lu, S. Xiao, and C. Yan. 2023. “The Latest Desertification Process and its Driving Force in Alxa League from 2000 to 2020.” Remote Sensing 15 (19): 4867. https://doi.org/10.3390/rs15194867.
- Xue, J., D. Gui, J. Lei, H. Sun, F. Zeng, D. Mao, Q. Jin, and Y. Liu. 2019. “Oasification: An Unable Evasive Process in Fighting Against Desertification for the Sustainable Development of Arid and Semiarid Regions of China.” Catena 179:197–209. https://doi.org/10.1016/j.catena.2019.03.029.
- Yang, Z., X. Gao, J. Lei, X. Meng, and N. Zhou. 2022. “Analysis of Spatiotemporal Changes and Driving Factors of Desertification in the Africa Sahel.” Catena 213:106213. https://doi.org/10.1016/j.catena.2022.106213.
- Yue, Y., L. Geng, and M. Li. 2023. “The Impact of Climate Change on Aeolian Desertification: A Case of the Agro-Pastoral Ecotone in Northern China.” Science of the Total Environment 859:160126. https://doi.org/10.1016/j.scitotenv.2022.160126.
- Zarei, A. R., and M. R. Mahmoudi. 2021. “Assessing the Influence of PET Calculation Method on the Characteristics of UNEP Aridity Index Under Different Climatic Conditions Throughout Iran.” Geofisica Pura e Applicata 178 (8): 3179–3205. https://doi.org/10.1007/s00024-021-02786-z.
- Zhang, J., X. Ma, J. Zhang, D. Sun, X. Zhou, C. Mi, and H. Wen. 2023. “Insights into Geospatial Heterogeneity of Landslide Susceptibility Based on the SHAP-XGBoost Model.” Journal of Environmental Management 332:117357. https://doi.org/10.1016/j.jenvman.2023.117357.
- Zhen, Z., S. Chen, T. Yin, and J.-P. Gastellu-Etchegorry. 2023. “Improving Crop Mapping by Using Bidirectional Reflectance Distribution Function (BRDF) Signatures with Google Earth Engine.” Remote Sensing 15 (11): 2761. https://doi.org/10.3390/rs15112761.
- Zhou, J., Y. Xu, Y. Gao, and Z. Xie. 2019. “Land Use Model Research in Agro-Pastoral Ecotone in Northern China: A Case Study of Horqin Left Back Banner.” Journal of Environmental Management 237:139–146. https://doi.org/10.1016/j.jenvman.2019.02.046.
- Zolotokrylin, A. N., P. D. Gunin, T. B. Titkova, S. N. Bazha, E. V. Danzhalova, and T. I. Kazantseva. 2016. “Diagnosis of the Desertification Dynamics of Arid Pastures in Mongolia from Observation in Key Areas and MODIS Data.” Arid Ecosystems 6 (3): 149–157. https://doi.org/10.1134/S2079096116030100.