
 ?Mathematical formulae have been encoded as MathML and are displayed in this HTML version using MathJax in order to improve their display. Uncheck the box to turn MathJax off. This feature requires Javascript. Click on a formula to zoom.
ABSTRACT
Effectively identifying urban polycentric spatial structure (UPSS) is essential for data-driven evaluation of urban performance, and it serves as a scientific basis for urban spatial planning. However, existing identification methods have limitations such as subjectivity, poor spatial continuity, and a narrow application scale. Thus, from a morphology perspective, our study proposed a rapid, highly applicable, and spatiotemporally comparable nonparametric approach for detecting morphological urban polycentric spatial structure (MUPS) by integrating remote sensing nighttime light (NTL) and point of interest (POI) data. Taking China as an object, on the basis of recognizing urban entities using NTL data, a wavelet transform was initially introduced to fuse multi-source geospatial data, thereby enhancing the spatial intricacy within a city. Then, a local spatial autocorrelation model was utilized to identify pixel clusters. Finally, post-processing was performed to optimize urban centers, subsequently calculating MUPS. Results reveal that urban entities identified based on NTL have a significant advantage in characterizing the concentration of human activities, which can ensure the accuracy of extracting MUPS. Compared with existing relevant methods, the proposed nonparametric approach avoids the misalignment of multi-temporal urban center distribution, enhancing accuracy and stability. Differentiated spatiotemporal patterns were found in the evolutionary trajectories of MUPS in China, with a progressive intensification in the degree of spatial decentralization. Our study provides valuable insights into spatiotemporal analyses of MUPS at multiple scales and serves as a foundational resource for urban spatial planning.
1. Introduction
The United Nations’ 2030 Agenda recognizes the pivotal role that urbanization plays in the global development trajectory and explicitly advocates for the construction of more inclusive, secure, resilient, and sustainable urban and human settlements (SDG11) (General Assembly Resolution of United Nations Citation2015). However, as global urbanization progresses, populations and socio-economic activities coalesce in central urban areas, giving rise to urban issues such as a decrease in environmental quality (J. Sun, Zhou, and Wang Citation2023; J. Wang et al. Citation2021) and traffic congestion (P. Zhao and Hu Citation2019). In alleviating the pressures of urban development, an increasing number of cities are adopting polycentric planning strategies (W. Li et al. Citation2022). The urban polycentric spatial structure (UPSS), as compared with the urban monocentric spatial structure (UMSS), combines the advantages of concentration and dispersion (Parr Citation2004). Thus, effectively identifying UPSS can offer spatial support for evaluating the performance of urban spatial structures, thereby contributing to the progress and assessment of SDGs.
UPSS refers to a relatively balanced distribution of socioeconomic activities or urban architectural distribution within a certain range, without a distinct primary center (Kloosterman and Musterd Citation2001; Meijers and Burger Citation2010). Previous studies on UPSS primarily explored two dimensions, namely, morphology and functionality (Burger and Meijers Citation2011; W. Li et al. Citation2022). In morphological structure studies, UPSS is defined as the size and distribution pattern of each center in space (Kloosterman and Musterd Citation2001), whereas in functional structure research, it emphasizes the degree of connectivity between centers (Green Citation2007). Scholars have confirmed a significantly positive correlation between the morphological dimension of UPSS and other dimensions (Burger and Meijers Citation2011), which is the primary and minimally restrictive way to understand urban structures (Meijers and Burger Citation2010). Thus, our study focuses on the identification and analysis of morphological urban polycentric spatial structure (MUPS). Notably, MUPS exhibits spatial scale dependency (Cheng and Shaw Citation2018; Liu and Wang Citation2016). At the spatial scale level, urban planning theory recognizes two types of polycentric urban forms. The first pattern involves the dispersion of polycentric cities within a region, such as urban agglomerations (Liu, Derudder, and Wang Citation2017). The second pattern explores the polycentric urban form within a city (T. Sun and Lv Citation2020; Yu et al. Citation2022), which is the primary focus of our study. Identifying polycentricity within a city poses greater challenges compared with identifying regional-scale spatial structures because the prerequisite for measuring MUPS is delineating the boundaries of urban centers.
Prevalent methods for detecting MUPS can be broadly categorized into parametric and nonparametric approaches. Parametric approaches, including threshold methods and parameter models, face challenges in addressing issues such as arbitrary threshold selection, biases in function assumptions, and multicollinearity (Alidadi and Dadashpoor Citation2018; McMillen and McDonald Citation1998), hindering cross-city comparisons. Moreover, parameter methods are based on statistical data analysis. Given the limitations in the availability of spatiotemporal scale data sources and the common use of administrative units for identification (Yang et al. Citation2021), parametric methods based on statistical data easily ignore topographical influences and disrupt the continuity of urban economic layouts, making accurate measurements of urban internal spatial structure difficult. Compared with parametric methods, nonparametric approaches provide greater flexibility, better applicability, and broader utility. Nonparametric approaches involve the identification of urban centers through algorithms such as locally weighted regression, spatial statistics, kernel density analysis, and spatial clustering (McMillen Citation2003). These approaches address some of the shortcomings of parametric methods, considering the interaction between urban centers and surrounding areas, and prevent the arbitrary setting of thresholds. Furthermore, certain nonparametric approaches explore spatial and cluster information from a spatial perspective, significantly enhancing the spatial continuity of identification results. Thus, a high level of spatiotemporal precision in the data source is necessary to utilize nonparametric methods for detecting MUPS.
Compared with discrete statistical data, the flourishing development of spatial data has propelled research on identifying urban internal spatial structures into a new stage (Long Citation2016). Leveraging new technologies such as remote sensing can effectively define the center boundaries, surpass statistical limitations, and address issues of poor data continuity. Remote sensing nighttime light (NTL) data has been proven to be closely related to the concentration of human activities (X. Li et al. Citation2022; Shi et al. Citation2014). Accordingly, based on NTL and combined with geomorphological theory, the identification of potential city center locations can be achieved (Z. Chen et al. Citation2017). Although NTL exhibits greater spatial stability, it fails to reflect the differences in the feature of human footprint during the daytime. Currently, big data from location-based services and social platforms has introduced new data sources for urban-related studies, including points of interest (POI) (Deng et al. Citation2019) and geotagged Weibo check-in data (Lv et al. Citation2021). Nevertheless, datasets relying solely on geographical information, such as Weibo check-ins and POI data, are insufficient in capturing the holistic spatial characteristics of human activities. Such datasets tend to portray MUPS in a biased manner, focusing solely on specific aspects such as population and employment. Hence, combining geographical social big data with NTL effectively addresses “lighting blank” areas and minimizes spill-over effects in highly illuminated zones. This combination improves the details in the city center, facilitating a more seamless integration of urban space at macro and micro levels. It also compensates for the uncertainties inherent in singular data sources, significantly improving the effectiveness of city center extraction. This method is predominantly used at a singular time scale, and research exploring the spatiotemporal dynamics of MUPS is lacking. Cai, Huang, and Song (Citation2017) employed fused data obtained from NTL and social media, applying local spatial autocorrelation (LSA) and geographically weighted regression (GWR) to identify urban centers. However, the instability and uncertainty in Weibo check-in data restricted the study to a single time scale, hampering spatiotemporal analysis. Compared with Weibo check-in data, POI data provides a more effective portrayal of urban functionality and human activities. X. He, Cao, and Zhou (Citation2021) considering the combination of NTL, POI, and population migration data through wavelet transform (WT), applied LSA and GWR to determine urban centers. However, the study fell short of conducting deeper analysis into the evolving patterns and trends of multi-centric urban centers in continuous spatial dimensions.
Despite the favorable outcomes of nonparametric approaches integrating multisource data in tasks such as urban boundary delineation and city center identification (Cai, Huang, and Song Citation2017), these approaches neglect the essential role of urban entities in shaping urban centers, resulting in some identification bias. Existing studies have demonstrated the mismatch between urban morphology and administrative boundaries, revealing that urban morphology is generally smaller than administrative units (Taubenböck et al. Citation2019). This finding underscores the inappropriateness of studying urban morphology at the administrative scale. Current urban theories propose a perspective where the modern urban landscape is considered as a complex mosaic or dynamic process (Hu et al. Citation2020), emphasizing that the definition of cities should not be confined to visual physical structures alone (Grove et al. Citation2015). Drawing on economic principles, urban areas essentially represent aggregations of population (or human activities), encompassing socio-economic and natural features. The spatial form of these regions should exhibit centrality and continuity. Hence, urban entities serve as the optimal method for depicting internal boundaries within a city. However, the academic community has not yet agreed upon a standardized definition for urban entities (Hu et al. Citation2020). Long (Citation2016) introduced the concept of “natural cities” to define the inherent spatial extent of cities, involving the identification of geospatial events that cluster together. They applied the head/tail break rule method to deduce these natural cities. This threshold-based approach has specific data distribution requirements, and its generalizability needs further evaluation. However, a K-means algorithm and post-processing, as proposed by Shi et al., exhibit excellent adaptability (Shi et al. Citation2023). This method can identify urban entities directly at the pixel scale based on the two-dimensional spatial features of the data, demonstrating strong applicability and transferability.
In general, our study aimed to develop a nonparametric approach for detecting MUPS that is fast, universally applicable, and temporally and spatially comparative, focusing on China as a case study of rapid urbanization. Initially, urban entities of China from 2012 to 2020 were extracted on the basis of NTL using partitioned K-means clustering as the foundational data for urban center extraction. Then, after fusing NTL with POI density data by wavelet transform, the local Moran’s I (LMI) was used to identify urban centers, and validation was performed from three perspectives: data, methodology, and delineation accuracy. Finally, MUPS was measured and analyzed at temporal and spatial scales. The nonparametric approach facilitates the delineation of boundaries for various urban centers, addressing the limitations of existing nonparametric approaches that are not suitable for spatiotemporal change analysis.
2. Study areas and data sources
2.1. Study areas
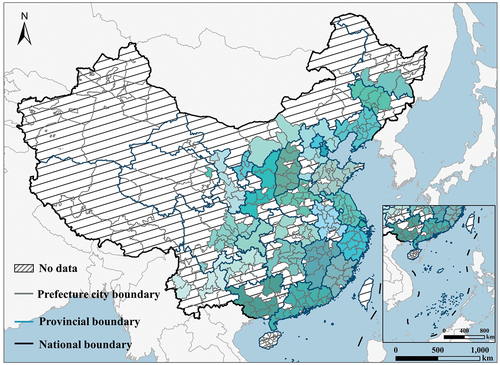
Our study selected mainland Chinese cities as the research objects (), focusing on municipal jurisdictions, because China has undergone the widest and fastest urban development in world history, featuring diverse urban development patterns that hold significant research value. After data cleaning, the study retained 211 prefecture-level administrative regions for subsequent analysis. The selected 211 cities were evenly distributed throughout China, covering various types of cities at different scales, including those in plains and mountains, and encompassing developed and developing cities. Given the slight variation in China’s administrative divisions across different years, the national administrative division of 2020 was used as the baseline for subsequent processing.
Figure 1. Spatial distributions of the selected 211 cities in China.
2.2. Data sources
In this study, four types of data are predominantly used, including NTL data, POI data, WorldPop population, and urban products.
Given its strong accessibility and advantages, including radiation calibration, the study utilized the annual synthesized data of Suomi National Polar-orbit Partnership’s Visible Infrared Imaging Radiometer Suite (SNPP-VIIRS) nighttime light, with a spatial resolution of 15 arcseconds (~500 m). Excluding pixels affected by cloud cover or correcting radiance values using algorithms, the data is proven suitable for estimating socioeconomic indicators. The original SNPP-VIIRS monthly data has issues with angular effect (X. Li et al. Citation2022; Tong et al. Citation2020), outliers, background noise, and defects such as auroras and cloud/mist coverage. Therefore, additional data preprocessing is necessary before annual data synthesis. First, missing data was imputed using a one-time exponential smoothing method (N. Zhao et al. Citation2017), and the data for the remaining months were merged into the annual data from 2012 to 2020. Then, stable light areas with a radiance exceeding 0 in the traditional data were used as a mask for SNPP-VIIRS (Shi et al. Citation2015), and negative pixel values in the data were uniformly set to 0. In eliminating interference noise caused by regional socioeconomic conditions and atmospheric variations, the neighborhood threshold method was introduced to different partitions to correct the data. After segmenting China into 10 regions, the light threshold was established by the maximum radiance value from the most developed provincial capital airport in each region. After correction, the SNPP-VIIRS data successfully eliminates outliers and background noise. In the selected three representative regions, abnormal radiance values have been effectively corrected to fall within a reasonable range (Figure S1).
POI data is sourced from Baidu Maps and provided by the Chinese Academy of Resource and Environmental Science and Data Center (https://www.resdc.cn/). The data represents entities catering to various services essential for residents. Continuous POI density data is derived through kernel density analysis at a spatial resolution of 500 m (Song et al. Citation2018), using ArcGIS 10.8.
WorldPop population from 2012 to 2020 has a spatial resolution of 1 km. The data is primarily generated by the random forest algorithm using spatial auxiliary data (https://www.worldpop.org/geodata/summary?id=17052).
Urban products, which are utilized for auxiliary validation, consist of Moderate Resolution Imaging Spectroradiometer (MODIS) Land Cover Type (MCD12Q1) data (hereinafter referred to as UFM), a city dataset based on a stepwise urban area recognition framework (hereinafter referred to as UFZ) (M. Zhao et al. Citation2022), and urban data based on a fully convolutional network algorithm (hereinafter referred to as UFH) (C. He et al. Citation2019). UFM is generated through the supervised classification of MODIS multispectral data, achieving an overall accuracy of 93%. UFZ is a global 1 km urban dataset developed through potential urban cluster identification, initial urban extent delineation, and urban sequence updating, incorporating multi-source NTL data. It effectively characterizes areas with dense human habitation and intense socioeconomic activities, exhibiting an R2 value not less than 0.86 concerning physical urban boundaries. UFH is a global 1 km urban dataset using a fully convolutional network algorithm with NTL, normalized difference vegetation index (NDVI), and land surface temperature data (LST), with an overall accuracy of over 90%.
3. Methods
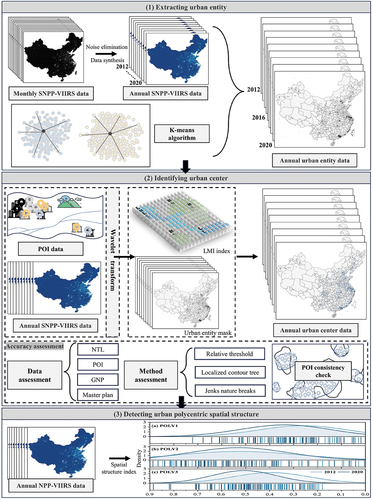
The nonparametric approach for identifying and evaluating MUPS comprised three main parts (). First, using SNPP-VIIRS data, the boundaries of urban entities are extracted by the partitioned K-means algorithm model. Then, after identifying the urban entities, urban centers are recognized by the LMI index, with the integration of NTL and POI data. Finally, MUPS is assessed using a combination of the inverse Primacy index, inverse Hirschman – Herfindahl index (HHI), and inverse Gini index.
Figure 2. Flow chart of detecting MUPS in China. Note: master plan is Chinese urban master planning for the government to determine the overall urban planning, including the planning of the city centers. LMI index is the local Moran’s I.
3.1. Urban entity identification
Urban entities are predefined areas that depict the spatial distribution of human socioeconomic activities (Withanage, Shi, and Shen Citation2023). They provide an objective and authentic reflection of the urban landscape, serving as a crucial prerequisite for identifying the spatial structure of monocentric/polycentric cities. Our study adopted the spatial entity definition from Shi et al. (Citation2023) employing the partitioned K-means algorithm to process NTL and generate urban entities for China from 2012 to 2020. The first step involves partitioning of the data. With regard to the partitioning issue, our study employed examples of 1°, 5°, 10°, and 20° to conduct experiments with the selected regions in China. Subsequently, the change in urban entities after clustering in each partition was assessed to evaluate the impact of image partitioning on data clustering accuracy. Upon examination, a partition size of 10° is proven to be more suitable. In the second step, the partitioned dataset was input into the classifier. After the K-means clustering iterations cease, urban entities and non-urban background are determined on the basis of grayscale differences, and binary transformations are applied to each issue. Furthermore, based on the initial urban boundaries extracted by the K-means algorithm, post-processing was conducted, including time consistency checks and logical reasoning steps (X. Li, Gong, and Liang Citation2015), to construct a temporally consistent time series of urban boundaries.
3.2. Urban center extraction
Although SNPP-VIIRS data can reveal the internal spatial structure of cities, it only provides a single attribute of light intensity. Therefore, within an urban region, the greater the brightness, the higher the NTL intensity value. Nighttime lights from airport main routes can cause high-intensity areas around airport roads, leading to inaccuracies in city center extraction. In addition, certain micro-scale urban elements, such as residential areas, streets, and shopping centers, remain unlit at night, resulting in “lighting blank” spaces within a city. Although nighttime lights in urban residential zones are relatively low, a discernible aggregation of POI is found in this area. Considering that POI data characterizes urban functions through quantitative clustering, the fusion of NTL and POI data can address the urban “void,” enhancing the accuracy of urban center extraction. The urban center is defined as an area with significantly higher socio-economic activity intensity compared with its surroundings in the study. Moreover, the urban center should be composed of continuous units that is of considerable scale and have the potential for local spillover. Urban center extraction comprises two primary steps: (1) the fusion of NTL and POI density data using a wavelet transform (WT); (2) the extraction of clustered pixels through the LMI index, followed by post-processing operations.
WT stands out as an effective algorithm for amalgamating diverse datasets. Working at the pixel scale, it leverages the temporal and frequency relationships among different images to amplify local features. In image transformations, wavelet transform dynamically observes and analyzes sections of the image through a “time-frequency” window, bringing together different images in the time and frequency domains. WT is expressed as follows:
where f(t) represents the signal vector of an image, φ(t) denotes the wavelet transform function, α represents the wavelet transform scale, τ represents the translation of image signals, and b represents a parameter.
Following data fusion, the local Moran’s I (LMI) was utilized in this study to identify pixel clusters (Y. Li Citation2020), classifying pixels into four categories with significance at the 95% confidence level: (1) high-density pixels surrounded by high-density pixels (HH); (2) low-density pixels surrounded by low-density pixels (LL); (3) high-density pixels surrounded by low-density pixels (HL); (4) low-density pixels surrounded by high-density pixels (LH). Pixels in HH and HL categories are considered as potential primary (secondary) centers. The LMI can be denoted as follows:
where n represents the numbers of target zones, xi represents the attribute values of each unit, and Wij represents the spatial weight matrix. According to the study, the spatial adjacency matrix is based on Rook and has passed sensitivity tests (Figure S2).
During this process, the study applied more rigorous criteria to define urban (sub) centers. Pixels with high density but surrounded by grids with relatively lower or not significantly higher density are not considered as constituting population (sub) centers. In particular, in the LMI clustering results, HL clustering can be seen as pixels with higher population density but surrounded by grids with lower or less high population density, which will not be considered as constituting the city (sub) center. As (sub) centers should have continuous regional characteristics, the combination of HH and HL-type pixels, when adjacent under the Rook continuity standard, forms a center. On this basis, the primary urban center is the largest patch of pixel aggregation in the HH category, while the sub-centers are the smaller patches of pixel aggregation in the HH category and the HL category pixels. In subsequent processing, the study used urban entities as masks and performs continuity calibration based on whether the city is contracting, using 2020 as the reference year, to discern central city pixels in accordance with urban development patterns (Zhai et al. Citation2022).
3.3. MUPS calculation
After accurately identifying urban centers, quantifying the distribution of the “importance” proportion within subunits is crucial to measure MUPS relying on Gini coefficient, Primacy, and HHI index (Brezzi and Veneri Citation2015; B. Sun et al. Citation2019). In ensuring that the numerical changes in Primacy, HHI, and the Gini coefficient align with the variations of MUPS, these indicators undergo transformation, namely, inverse Primacy (POLY1), inverse HHI (POLY2), and inverse Gini coefficient (POLY3). This process ensures that the numerical variations fall within the [0–1] range. In underscoring urban “significance,” this study utilized NTL brightness to measure MUPS.
Primacy delineates the “relative importance” of the foremost city in a region, constituting the most frequently used indicator to gauge the spatial structure of either single or multiple central cities. Inverse Primacy is calculated as follows:
where represents the city units with the highest provincial total NTL intensity, and
represents the sum of provincial light brightness.
The HHI index is the sum of squared proportions of individual subunits within the overall area. This index is typically used to gauge the concentration level of industries, and it has been utilized to measure the polycentricity of regions. The inverse HHI coefficient is calculated as follows:
where represents the city units that own the highest provincial total NTL intensity;
represents the sum of provincial light brightness, and
denotes the numbers of subunits within a province.
Gini coefficient, which measures income distribution inequality, has become an important indicator for measuring urban size disparities and quantifying the degree of urban polycentricity. The coefficient is expressed as follows:
where represents the average of provincial light brightness; USi represents the total NTL intensity of the ith city, and
denotes the numbers of subunits within a province.
4. Results
4.1. Evaluations of urban entity expansion
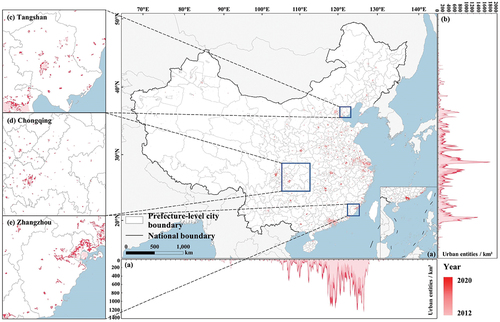
Chinese cities exhibited swift and distinctly diverse expansion (). Between 2012 and 2020, urban entities expanded from 29,854 km2 to 64,548 km2. The increase in area unveils distinct expansion patterns along longitudinal and latitudinal zones. From a longitude perspective, several peaks are found in the distribution of large-scale urban entities between 110°E and 130°E (). On the latitude side, two significant peaks in the distribution of large-scale urban entities are located near 30°N and 20°N (). The latitudinal and longitudinal distribution reveals the primary concentration of urban entities in southeastern China. Over time, areas with consistently rising urban entity expansion rates are located around the peaks, whereas the growth rate notably decelerates near the peaks over the last 4 years. This occurrence may be attributed to China’s extended development of urban agglomerations, where the core cities of these agglomerations, initially experiencing rapid growth, are currently witnessing a slowdown in expansion speed. Based on the 2012 expansion of physical regions, most cities incorporated multiple independent blocks, each showcasing distinct growth trends. For example, Tangshan, Chongqing, and Zhangzhou generated more than five sizable independent blocks (). Contrary to Chongqing’s concentrated expansion at a close range in the inland mountains, Tangshan and Zhangzhou added numerous blocks near the coastline. Notably, Zhangzhou also aggregated some entities at the border with neighboring cities.
Figure 3. Urban entity expansion in China from 2012 to 2020.
4.2. Evaluation of changes in urban centers
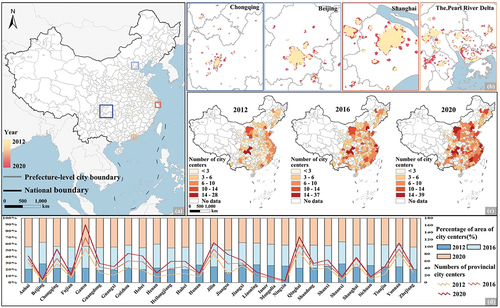
Based on the urban expansion, the development of urban centers shows consistent characteristics. Most cities form polycentric centers, displaying diverse expansion trends (). When examining Chongqing, Beijing, Shanghai, and the Pearl River Delta region (PRD) (), the expansion patterns of urban centers are not entirely uniform. Compared with the other three cities, PRD region demonstrates strong continuity in adding new centers possibly because of the close cooperation among cities in this area. A number of centers with areas exceeding 2 km2 for the years 2012, 2016, and 2020 disclose a decreasing-then-increasing trend in the number of urban centers from west to east in China (). In particular, inland cities with complex terrain in middle eastern parts and coastal cities with higher economic levels, such as Chongqing and Suzhou, generally have more urban centers. Considering the expansion area and number of urban centers, Chongqing and PRD region display a pattern of rapid expansion, whereas Beijing and Shanghai show stable growth. In addition, statistical charts illustrate that Beijing and Shanghai experienced faster early-stage development at the provincial scale, whereas Jiangsu and Anhui demonstrated accelerated growth in later stages (). Remarkably, Gansu and Qinghai have a significantly higher number of urban centers than other provinces because of their challenging natural environments, which greatly diminish the concentration of human activities.
Figure 4. Urban center changes of 211 cities in China. (a) Distribution of urban centers in China; (b) urban center distributions in typical cities; (c) statistics of urban centers in 211 cities; (d) statistics of urban centers at the provincial scale.
4.3. Spatiotemporal patterns of MUPS in China
The distribution of China’s MUPS from 2012 to 2020 is depicted in , with all three indices indicating an overall deepening of polycentricity during this period. In general, the rising values of POLY1 and POLY2 (), signify a decrease in the “relative importance” of leading centers and the concentration of regional industries, contributing to a gradual enhancement of polycentricity in urban spatial structure. However, the POLY3 index for Chinese cities shows a declining trend from west to east (), indicating that the size disparity among cities in the central and eastern regions persists. In addition, differences in the spatiotemporal evolution of MUPS are observed. Although most cities display a stable polycentric trend, some cities exhibit insignificant changes or fluctuations in spatial structure indices. This phenomenon may be associated with the diverse sizes and developmental stages of different cities. For example, the urban structure index of Ulanqab City displays an inverted “V”-shaped variation, with 2016 standing out as the year of most significant polycentricity (). In 2016, Ulanqab actively integrated into the Hohhot – Baotou – Erdos economic circle and the Beijing – Tianjin – Hebei urban agglomeration, absorbing functions relocated from Beijing and undergoing industrial transfers, significantly reducing the gap with other cities. Nevertheless, as a historically agricultural and pastoral region, Ulanqab’s urban transformation and sustained benefits are relatively less stable, and they are influenced by several factors such as natural conditions.
Figure 5. Spatial distribution of MUPS in China between 2012 and 2020. Note: POYL1, POLY2, and POLY3 are the inverse Primacy index, inverse HHI, Gini coefficient, respectively.
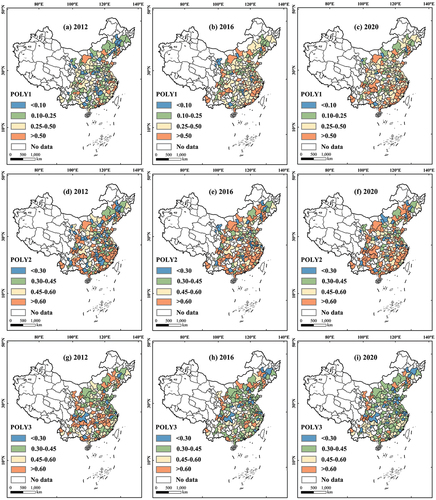
Figure 6. Density distribution of MUPS in China between 2012 and 2020. Note: POYL1, POLY2, and POLY3 are the inverse Primacy index, inverse HHI, Gini coefficient, respectively.
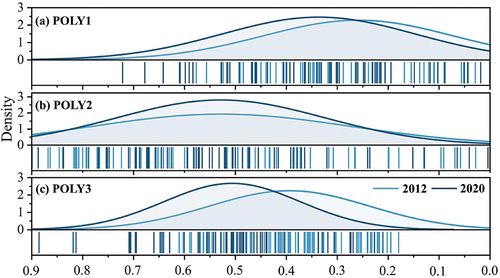
The kernel density plots shown in also display a leftward shift in the density curves of three MUPS between 2012 and 2020. This finding supports the perspective that polycentric urban spatial structure indices in Chinese cities are on an upward trend. Except for POLY2, most cities exhibit relatively small values for the other two indices, indicating that the majority of cities continued to develop in a monocentric mode from 2012 to 2020. Notably, the most populous and economically developed Chinese cities, such as Beijing, Tianjin, Shanghai, Chengdu, Guangzhou, and Shenzhen, have lower POLY1 values, which is consistent with the concept that large cities may enhance economic performance through a monocentric spatial development mode (B. Sun and Li Citation2016). Further analysis will be discussed in the 5.3 section.
5. Discussion
5.1. Rationality of using urban entities
The prerequisite for evaluating MUPS is to identify urban entities. However, the current definition of urban areas typically characterizes them as the physical regions of built environments or social interaction rather than as spatial entities inherently aggregating human activities (Long, Song, and Chen Citation2021). In actuality, urban entities are comprehensive structures that combine social and physical attributes, with the essential characteristic of reflecting the aggregative nature of human activities (Y. Chen et al. Citation2022). Given that urban centers equally represent spatial aggregations of human activities, using urban entities for extracting city centers is advantageous. Nevertheless, earlier research has primarily centered on physical characteristics, treating urban entities similar to impermeable surfaces or built-up areas, overstating the spatial scope of human activity concentrations. Thus, impermeable surfaces or built-up areas do not authentically depict urban entities. Acknowledging the necessity for physical and socio-economic attributes of cities, selecting NTL as the data source emerges as a relatively suitable option. Urban entities extracted from NTL can mirror the spatial concentration of human activities and reveal manifold urban characteristics. This phenomenon forms the foundation for extracting urban centers, which can effectively represent the development patterns of polycentric cities. Next, we have assessed the rationality of utilizing urban entities to extract urban centers by evaluating their representation of urban social and physical attributes. First, we visually compare urban entities with WorldPop population products and road networks to emphasize their close correlation with human activities characterized by socio-economic and natural features. Second, we contrast urban entities with existing urban products to demonstrate their appropriateness in representing the physical scope of cities.
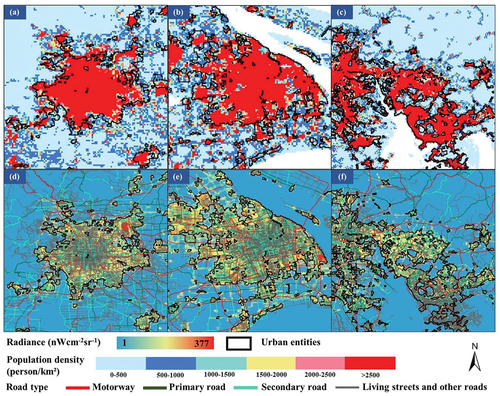
Rationality assessment of urban social attributes. Population density or size is the primary criterion for government-defined urban entities; hence, population density is selected for comparison. After overlaying urban entities on the WorldPop population density products of Beijing, Shanghai, and PRD region, a relative consistency with areas showing a population density of above 500/km2 was observed () (Shi et al. Citation2023), despite existing spatial differences. Urban commuting zones, reflecting human activity scopes and employment levels, are broadly defined as urban entities in economics. Therefore, road networks are also considered as a comparative reference. A high overlap was observed between urban entities and high-density road networks, with brighter lights corresponding to denser road networks (). Moreover, within different cities, urban entities exhibit good spatial consistency with boundaries such as residential streets, as similar data like SNPP-VIIRS indirectly reflects human commuting areas. These results confirm that SNPP-VIIRS data has significant advantages in identifying entities, which is consistent with the characteristics of high population aggregation in urban areas. An annual correlation analysis between economic data and urban entities was conducted to avoid randomness using statistical data from the China Statistical Yearbook (Table S1).
Figure 7. Rationality assessment of urban social attributes in urban entities. Note: World Pop data were resampled to a spatial resolution of 500 m.
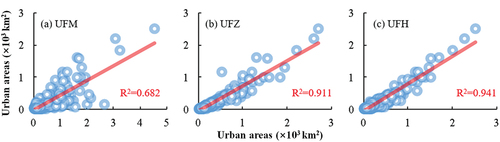
Rationality assessment of social – physical attributes. Considering that artificial impervious surfaces or urban built-up areas obtained from satellite remote sensing data are widely recognized as alternatives to urban extents, this study selected three urban products—UFM, UFH, and UFZ—for quantitative evaluation and mutual comparison with urban entities (UFN). The area of UFN in 2015 is essentially consistent with the area of regional products in China, with an R2 value not less than 0.68 (). Furthermore, most city points lie below the 1:1 line, suggesting that the area of UFN is lower than the total area of the three mentioned products. The phenomenon of fewer areas can be explained as follows: First, UFN typically excludes extensive impervious surfaces/urban built-up areas and large areas with dim lighting (such as water bodies, grasslands, and forests). Second, dimly lit impervious surfaces/urban built-up areas with human settlements on the urban periphery (such as towns or large villages) may be excluded from UFN. Third, the spatial aggregation of impervious surfaces associated with human activities is determined from a perspective that differs from the delineation of impervious surfaces/urban built-up areas based on urban landscapes or physical structures. For example, certain highway intersections at the urban periphery may be identified as impervious surfaces/urban built-up areas; however, these regions may not be considered part of UFN because of a low level of human activity aggregation.
Figure 8. Correlations between urban entities and different urban products in 2015.
5.2. Accuracy verification and evaluation of urban centers
The correctness of urban centers determines the rationality of identifying MUPS in China. Validating the accuracy of urban center identification results remains challenging because of the absence of clear geographical boundaries for urban centers. Compared with the well-defined concept of built-up areas or administrative divisions, urban centers lack explicit boundary indications. The definition of their boundaries is rather ambiguous, and urban land-use master plans typically only outline the approximate center area. In assessing the effectiveness of extracting urban centers, comparative validations are conducted using different methods and datasets, complemented by quantitative analysis of spatial coverage accuracy to evaluate spatial delineation accuracy.
(1) Comparisons with different methods
Urban center extraction methods from NTL can be categorized into parametric and non-parametric approaches. Parametric approaches often utilize thresholding, whereas nonparametric methods incorporate spatial autocorrelation, the contour tree method, and the natural break (NB) method. The wide application of the relative thresholding method in parametric approaches is attributed to its simplicity and objectivity. However, studies have indicated the need for improvement in identifying well-defined urban centers using the relative thresholding method. Therefore, our study refrains from further comparison. In assessing the effectiveness of the proposed nonparametric method, this study focuses on nonparametric approaches, specifically comparing the results using local contour tree (LCT) and NB methods to validate the continuity and rationality of the proposed nonparametric methods. Considering the accessibility of comparative data, the study ultimately selects economically developed cities—Hangzhou, Fuzhou, and Quanzhou—for specific comparisons in the years 2012, 2016, and 2020.
The method proposed by Chen et al. for identifying urban centers using LCT was compared (Z. Chen et al. Citation2017). This method recognizes nodes representing urban centers based on the topological relationship among contours. The entire geographical space is divided into multiple local regions, and an independent “tree” is generated for each region to depict the hierarchical structure within urban regions. In the case of larger cities such as Beijing, Chongqing, and Tianjin, the light variation within urban (sub) centers is more pronounced. Z. Chen et al. (Citation2017) considered all primary nodes as urban centers, resulting in a fragmented distribution of urban (sub) centers. When applied to identify the temporal evolution of urban spatial structures, this approach may lead to a misalignment of centers. reveals that LCT yields urban (sub) center patches with lower clustering in Hangzhou, Fuzhou, and Quanzhou, exhibiting significant fragmentation. A comparison with government planning data indicates that the identified (sub) centers using LCT are more frequently overlooked, with markedly smaller areas, possibly because of their definition bias toward areas with high commercial density. In addition, the logical consistency of changes in some independent urban (sub) center patches is weak, with instances in all three cities where (sub) centers disappear in 2015 only to reappear almost equally large in 2019. With regard to temporal changes, Chen et al.’s results suggest a relatively weak expansion of Hangzhou’s urban center (), whereas Fuzhou and Quanzhou () demonstrate an initial trend of concentrated expansion followed by subsequent dispersed contraction. This result contradicts our findings of a stable, small-scale expansion. Despite substantial GDP growth in Hangzhou, Fuzhou, and Quanzhou over the last decade, indicating significant shifts in urban centers with a notable increase in planned (sub) center numbers (), LCT shows minimal change in Hangzhou’s center, deviating from actual economic development. Moreover, the generated contour lines are prone to non-closure influenced by administrative boundaries, necessitating manual removal or further processing. Furthermore, the setting of initial values and spacing for contour lines relies on prior knowledge, restricting broad regional applications.
Figure 9. Urban centers detected by different methods. Note: Chen et al.’s results are available for the years 2010, 2015, and 2019.
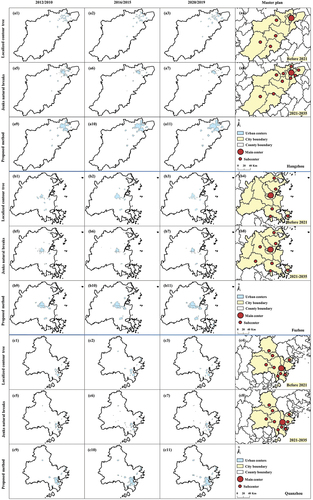
A comparison was also made between Long et al.’s method of combining LSA and NB with urban center identification. Long, Song, and Chen (Citation2021) used their approach at the town and street scale for cities of different sizes, employing a singular natural breakpoint method when the number of town and street units was below 30 and a combined method otherwise. However, this method initially shows limitations in providing detailed characterization because of its reliance on administrative street boundaries. When compared with the other two identification methods and governmental planning, all three cities manifest cases of either omitting or partially exaggerating (sub) centers. The variations in center areas across cities are noteworthy, with NB resulting in considerably larger multi-period central areas for Hangzhou than those identified by LCT. Conversely, the central areas for Fuzhou and Quanzhou tend to be smaller with NB compared with LCT. Although NB is proficient in maximizing differences among various categories, it grapples with data-specific limitations, posing challenges for a comprehensive spatiotemporal scale analysis. In particular, results using NB show that the centers of Hangzhou, Fuzhou, and Quanzhou exhibit marginal expansion from 2012 to 2020 (), continuous contraction (), and an initial widespread contraction followed by expansion (). The specificity of the urban center data is evident, highlighting significant deviations in temporal trends from governmental planning.
This study adheres to the principles of Long for extracting urban centers, encompassing the core area and its radiating regions. Defining the primary center as the space with the highest human activity level and the secondary center as regions with relatively high but less developed human activity, the extracted results consistently encompass a larger area than those obtained from LCT and NB. This conformity with governmental urban planning is more pronounced. Compared with the other methods, our approach demonstrates heightened sensitivity in identifying secondary centers across different cities, providing more numerous and accurate identifications in all three instances. Across different time periods, our identification method consistently captures emerging secondary centers. Compared with the other two methods, our approach successfully pinpointed newly established secondary centers in the Quanzhou region in 2020 (). This finding indicates a gradual expansion of central influence within the bay area, which is consistent with the planning direction of the Quanzhou government.
(2) Comparisons with different data resources
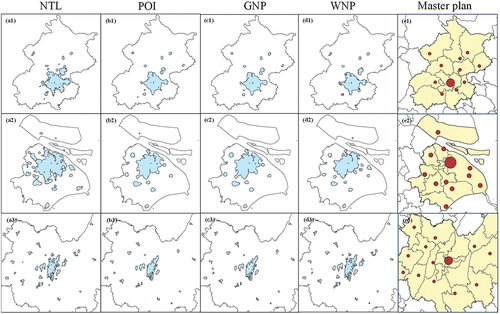
In validating the appropriateness of the selected data sources, diverse data sources and fusion methodologies were used. In addition, the precision of four datasets, namely, single NTL data, single POI data, geometric mean fused data integrating NTL and POI (GNP), and wavelet-transformed fused data merging NTL and POI (WNP), was compared.
In this study, the predominant central area within each city is regarded as the primary urban center. presents a comparative analysis of urban center extraction results from different data applications for major cities like Beijing, Shanghai, and Chongqing. When utilizing NTL, the identification of centers through spatial clustering results in Beijing and Shanghai lacking clear and continuous main central areas, indicating fragmentation. This finding suggests a suboptimal performance in urban center identification using only NTL. In addition, based on the outcomes from POI and GNP analysis, the primary center outlines in Beijing and Chongqing exhibit similarities. However, notable disparities in the detection of secondary centers are found. For POI data, the identification of urban center areas is limited, particularly in the Chongqing region. The unique topography of Chongqing’s main urban area leads to dispersed central regions, and POI and GNP data fall short in effectively recognizing this emerging tea plantation cluster. Despite a general consistency in urban center ranges identified across the four data types concerning urban planning spatial layouts, a detailed comparative analysis reveals that the urban center identified by WNP data aligns more closely with the urban planning layout. The disparities between centers extracted through the fusion of NTL and POI and the urban planning centers arise from diverse perspectives on urban centrality. Urban planning is centered on land use functionality, whereas NTL and POI data have more direct associations with the intensity of human socio-economic activities. Therefore, in comparison with using a single data source for urban center extraction, WNP data provides a more intuitive and comprehensive insight into human behavior, as well as societal and economic activity responsiveness to government planning policies. This analysis underscores the reliability and applicability of our approach in identifying urban spatial structures for research.
Figure 10. Urban centers detected by different data resources.
(3) Consistency check of multi-type POI distributions
POI data serves as effective indicators of human activities, aiding in the delineation of urban functional zones. This study employs the Kappa coefficient to quantitatively check the alignment between central areas and POI data, validating the accuracy of identification results. Due to the differences in terrain and economic development, different large and medium-sized cities in China were chosen for the study, including Anqing, Hanzhong and Zhumadian as small cities (with a population of less than 1million), Nanchang, Guiyang and Zhengzhou as medium-sized cities (with a population of 1million to 3million), and Beijing, Shanghai and Chongqing as large cities (with a population of more than 3million).
This study gathered 13 types of POI data closely associated with the daily lives of residents (Figure S3 and Table S5). POI data were plotted onto a 500 m resolution grid with a consistent projection. Diverse POI distribution grid data were created by identifying whether each grid contained POI records. The resulting POI distribution grid data are then compared with central regions using the Kappa coefficient to measure spatial distribution consistency. While multiple types of POI can denote the true urban center distribution, a high alignment between daily life – related POI coverage areas and detected central areas indicates greater result accuracy (Lv et al. Citation2021). The results shown in , S2, and S3 detail the consistency tests between (sub) centers identified in 2012, 2016, and 2020 for large, medium, and small cities and the spatial distribution of POI. In small cities, the Kappa coefficient averages around 0.3, reflecting moderate consistency between POI coverage areas and urban centers. For medium city samples, the Kappa coefficient averages around 0.4. Large cities such as Beijing and Shanghai present higher Kappa coefficients (Kappa > 0.42), indicating superior alignment compared with other city sizes. However, Chongqing, despite its large size, exhibits lower Kappa coefficient averages (Kappa > 0.3) because of its extensive urban area, thereby affecting Kappa coefficient calculations.
Table 1. Consistency check of multi-type POI distributions in 2020.
In addition, this study cross-references the Kappa coefficients calculated by (Cai, Huang, and Song Citation2017), focusing on the overlap between POI coverage grids and urban center areas (Table S4 for identical POI types such as hospitals, pharmacies, and banks). Compared with the Kappa coefficient of approximately 0.15 reported by Cai et al. based on Weibo check-in data for determining the overlap between urban center areas and POI grids, our method consistently yields higher Kappa coefficients, consistently surpassing 0.25. Notably, the highest Kappa coefficient is observed in 2016 for Beijing’s bank POI data, reaching 0.571 when compared with the urban center.
5.3. Spatiotemporal variations of MUPS
Regions characterized by mountains, hills, and dense river networks, such as the Southeast and Southwest, lean toward a more decentralized spatial structure with multiple centers (). This observation is consistent with the research findings of (Liu and Wang Citation2016), which highlight a correlation between the formation of MUPS and factors such as terrain curvature and landscape richness. Over time, a discernible trend of increasing nucleation in socio-economic activities in Chinese cities is observed, which is consistent with the promotion of developing polycentricity and new urban areas. M. Wang (Citation2020) conducted an empirical examination of the relationship between MUPS of 309 Chinese cities and the equitable distribution of urban facilities under four different allocation scenarios. This study revealed that as urban facilities improve and distribution becomes more balanced, the polycentricity of cities strengthens. Interestingly, highly populated and economically developed cities such as Beijing and Shanghai tend to adopt MUPS, a characteristic potentially influenced by factors such as population distribution and governmental planning. Meng et al.’s study on the Shanghai metropolitan area highlights the role of population dispersion, highway development, and governmental planning in the emergence of MUPS (Meng, Shang, and Yang Citation2021). Nevertheless, the influence of secondary centers on multi-centricity weakens as the population concentration in the primary urban center becomes excessive, potentially leading to MUPS (Yue et al. Citation2019).
The spatial heterogeneity and size differences of MUPS are, to some extent, influenced by the mismatch between the physical development of secondary centers (e.g. urban expansion) and the subsequent intensity of socio-economic activities. In cities with flat terrain, socio-economic activities mainly concentrate in the primary central area. Conversely, cities adapted to natural elements experience geographical fragmentation, resulting in developed facilities in some secondary centers (Bertram and Chilla Citation2023; Yue et al. Citation2019). In addition, urban spatial agglomeration in some cities may be influenced by policies related to urban history and culture, including the protection of cultural heritage sites (F. Wang and Gu Citation2023). Despite the current relatively low polycentricity in cities such as Beijing, Tianjin, and Shanghai, the effects of polycentric urban planning, guided by governmental initiatives such as new district planning and improved transportation networks, can gradually strengthen across Chinese cities (Liu and Wang Citation2016).
Although the Chinese government has formulated and promoted plans for urban agglomerations, such as polycentric and new city construction to narrow the gap in urban development, challenges persist because of phenomena such as the suction effect. In plain regions, the progress of polycentric and new city development tends to be slow, resulting in urban sprawl and the emergence of “ghost cities,” exemplified by Shanghai’s core circle (<5 km) population concentration surpassing that of cities such as Seoul and London. In addressing these challenges, a targeted approach for plain cities is necessary, involving actions such as optimizing population structure, enhancing urban facilities, and improving transportation networks (Xu et al. Citation2022), to facilitate polycentric development. Therefore, MUPS may not uniformly generate positive impacts on environmental, economic, and social performance (Wu et al. Citation2023; Zheng, Huang, and Fu Citation2023), underscoring the need for flexible planning.
6. Conclusion
This study introduces an nonparametric approach for the prolonged evaluation of MUPS covering the period from 2012 to 2020. The approach excels in two aspects: (1) recognizing the fundamental role of urban entities in center extraction and (2) addressing spatiotemporal gaps inherent in traditional statistical studies by utilizing multiple data sources with spatiotemporal comparability, thereby extending the continuous spatiotemporal scale of prevailing non-parametric approaches. Comparative results show superior stability compared with nonparametric approaches such as LCT and NB. The “one main center with multiple sub-centers” closely aligns with urban planning schemes. Furthermore, utilizing spatial structural indices such as inverse Primacy, inverse HHI, and inverse Gini index, this study quantifies and analyzes the spatiotemporal characteristics of MUPS. We observed that most Chinese cities are currently in the process of developing a polycentric urban structure.
This study also faces certain limitations. First, the classification of polycentric regions in highly urbanized plains, such as Beijing and Shanghai, requires further refinement because of the extensive and contiguous nighttime lights, coupled with limited topographical constraints on inter-center communication within cities. Second, the analysis of polycentricity lacks comprehensive exploration with regard to morphology and functionality, thereby presenting certain limitations. Third, the city accuracy identified in this study operates at a resolution of 500 m, which necessitates improvement. Future research will consider the utilization of high-resolution satellite data, such as Luojia-1 and Jilin-1 (Yang et al. Citation2021). Finally, considering the availability of long-term series data, the study only used NTL data and POI data, and more data will be explored in the future.
Supporting Information.docx
Download MS Word (3.8 MB)Acknowledgments
We want to express our respects and gratitude to the anonymous reviewers and editors for their valuable comments on improving the quality of the paper.
Disclosure statement
No potential conflict of interest was reported by the author(s).
Data availability statement
The original SNPP-VIIRS monthly data can be accessed through Earth Observation Group (https://eogdata.mines.edu/nighttime_light/monthly/v10/). POI data can be obtained through the Chinese Academy of Resource and Environmental Science and Data Center (https://www.resdc.cn/). WorldPop population data from 2012 to 2020 are openly available at https://www.worldpop.org/geodata/summary?id=17052. MODIS Q1 land-use data (UFM) were obtained from the Earth Science Data Systems (ESDS) Program (https://ladsweb.modaps.eosdis.nasa.gov/missions-and-measurements/science-domain/land-cover-and-phenology/). Urban extent dataset (UFZ) based on a stepwise urban area recognition framework were collected from (M. Zhao et al. Citation2022). Urban built-up areas (UFH) were proposed by (C. He et al. Citation2019).
Supplementary material
Supplemental data for this article can be accessed online at https://doi.org/10.1080/15481603.2024.2383461
Additional information
Funding
References
- Alidadi, M., and H. Dadashpoor. 2018. “Beyond Monocentricity: Examining the Spatial Distribution of Employment in Tehran Metropolitan Region, Iran.” International Journal of Urban Sciences 22 (1): 38–21. January. https://doi.org/10.1080/12265934.2017.1329024.
- Bertram, D., and T. Chilla. 2023. “Polycentricity and Accessibility in Mountain Areas: The Alpine Case.” European Planning Studies 31 (12): 2425–2445. December. https://doi.org/10.1080/09654313.2022.2145874.
- Brezzi, M., and P. Veneri. 2015. “Assessing Polycentric Urban Systems in the OECD: Country, Regional and Metropolitan Perspectives.” European Planning Studies 23 (6): 1128–1145. June. https://doi.org/10.1080/09654313.2014.905005.
- Burger, M., and E. Meijers. 2011. “Form Follows Function? Linking Morphological and Functional Polycentricity.” Urban Studies 49 (5): 1127–1149. April. https://doi.org/10.1177/0042098011407095.
- Cai, J., B. Huang, and Y. Song. 2017. “Using Multi-Source Geospatial Big Data to Identify the Structure of Polycentric Cities.” Remote Sensing of Environment 202:210–221. December. https://doi.org/10.1016/j.rse.2017.06.039.
- Chen, Y., J. Wang, Y. Long, X. Zhang, and X. Li. 2022. “Defining Urban Boundaries by Characteristic Scales.” Computers, Environment and Urban Systems 94:101799. June. https://doi.org/10.1016/j.compenvurbsys.2022.101799.
- Chen, Z., B. Yu, W. Song, H. Liu, Q. Wu, K. Shi, and J. Wu. 2017. “A New Approach for Detecting Urban Centers and Their Spatial Structure with Nighttime Light Remote Sensing.” IEEE Transactions on Geoscience & Remote Sensing 55 (11): 6305–6319. August. https://doi.org/10.1109/TGRS.2017.2725917.
- Cheng, H., and D. Shaw. 2018. “Polycentric Development Practice in Master Planning: The Case of China.” International Planning Studies 23 (2): 163–179. April. https://doi.org/10.1080/13563475.2017.1361318.
- Deng, Y., J. Liu, Y. Liu, and A. Luo. 2019. “Detecting Urban Polycentric Structure from POI Data.” ISPRS International Journal of Geo-Information 8 (6). June. https://doi.org/10.3390/ijgi8060283.
- General Assembly Resolution of United Nations. 2015. Department of Economic, and S. Affairs. “Transforming Our World: The 2030 Agenda for Sustainable Development.” UN Doc. A/RES/70/1 (September 25, 2015).
- Green, N. 2007. “Functional Polycentricity: A Formal Definition in Terms of Social Network Analysis.” Urban Studies 44 (11): 2077–2103. October. https://doi.org/10.1080/00420980701518941.
- Grove, J. M., M. L. Cadenasso, S. T. Pickett, G. E. Machlis, and W. R. Burch. 2015. The Baltimore School of Urban Ecology: Space, Scale, and Time for the Study of Cities. New Haven: Yale University Press.
- He, C., Z. Liu, S. Gou, Q. Zhang, J. Zhang, and L. Xu. 2019. “Detecting Global Urban Expansion Over the Last Three Decades Using a Fully Convolutional Network.” Environmental Research Letters 14 (3): 034008. March. https://doi.org/10.1088/1748-9326/aaf936.
- He, X., Y. Cao, and C. Zhou. 2021. “Evaluation of Polycentric Spatial Structure in the Urban Agglomeration of the Pearl River Delta (PRD) Based on Multi-Source Big Data Fusion.” Remote Sensing 13:18. September. https://doi.org/10.3390/rs13183639.
- Hu, X., Y. Qian, S. T. A. Pickett, and W. Zhou. 2020. “Urban Mapping Needs Up-To-Date Approaches to Provide Diverse Perspectives of Current Urbanization: A Novel Attempt to Map Urban Areas with Nighttime Light Data.” Landscape and Urban Planning 195:103709. March. https://doi.org/10.1016/j.landurbplan.2019.103709.
- Kloosterman, R. C., and S. Musterd. 2001. “The Polycentric Urban Region: Towards a Research Agenda.” Urban Studies 38 (4): 623–633. April. https://doi.org/10.1080/00420980120035259.
- Li, W., B. Sun, T. Zhang, and Z. Zhang. 2022. “Panacea, Placebo or Pathogen? An Evaluation of the Integrated Performance of Polycentric Urban Structures in the Chinese Prefectural City-Regions.” Cities 125:103624. June. https://doi.org/10.1016/j.cities.2022.103624.
- Li, X., P. Gong, and L. Liang. 2015. “A 30-Year (1984–2013) Record of Annual Urban Dynamics of Beijing City Derived from Landsat Data.” Remote Sensing of Environment 166:78–90. September. https://doi.org/10.1016/j.rse.2015.06.007.
- Li, X., X. Shang, Q. Zhang, D. Li, F. Chen, M. Jia, Y. Wang, et al. 2022. “Using Radiant Intensity to Characterize the Anisotropy of Satellite-Derived City Light at Night.” Remote Sensing of Environment 271:112920. https://doi.org/10.1016/j.rse.2022.112920.
- Li, Y. 2020. “Towards Concentration and Decentralization: The Evolution of Urban Spatial Structure of Chinese Cities, 2001–2016.” Computers, Environment and Urban Systems 80:101425. March. https://doi.org/10.1016/j.compenvurbsys.2019.101425.
- Liu, X., B. Derudder, and M. Wang. 2017. “Polycentric Urban Development in China: A Multi-Scale Analysis.” Environment & Planning B: Urban Analytics & City Science 45 (5): 953–972. September. https://doi.org/10.1177/2399808317690155.
- Liu, X., and M. Wang. 2016. “How Polycentric is Urban China and Why? A Case Study of 318 Cities.” Landscape and Urban Planning 151:10–20. July. https://doi.org/10.1016/j.landurbplan.2016.03.007.
- Long, Y. 2016. “Redefining Chinese City System with Emerging New Data.” Applied Geography 75:36–48. October. https://doi.org/10.1016/j.apgeog.2016.08.002.
- Long, Y., Y. Song, and L. Chen. 2021. “Identifying Subcenters with a Nonparametric Method and Ubiquitous Point-Of-Interest Data: A Case Study of 284 Chinese Cities.” Environment & Planning B: Urban Analytics & City Science 49 (1): 58–75. January. https://doi.org/10.1177/2399808321996705.
- Lv, Y., L. Zhou, G. Yao, and X. Zheng. 2021. “Detecting the True Urban Polycentric Pattern of Chinese Cities in Morphological Dimensions: A Multiscale Analysis Based on Geospatial Big Data.” Cities 116:103298. September. https://doi.org/10.1016/j.cities.2021.103298.
- McMillen, D. P. 2003. “Identifying Sub-Centres Using Contiguity Matrices.” Urban Studies 40 (1): 57–69. January. https://doi.org/10.1080/00420980220080161.
- McMillen, D. P., and J. F. McDonald. 1998. “Suburban Subcenters and Employment Density in Metropolitan Chicago.” Journal of Urban Economics 43 (2): 157–180. March. https://doi.org/10.1006/juec.1997.2038.
- Meijers, E. J., and M. J. Burger. 2010. “Spatial Structure and Productivity in US Metropolitan Areas.” Environment & Planning A: Economy & Space 42 (6): 1383–1402. June. https://doi.org/10.1068/a42151.
- Meng, M., Y. Shang, and Y. Yang. 2021. “Did Highways Cause the Urban Polycentric Spatial Structure in the Shanghai Metropolitan Area?.” Journal of Transport Geography 92:103022. April. https://doi.org/10.1016/j.jtrangeo.2021.103022.
- Parr, J. 2004. “The Polycentric Urban Region: A Closer Inspection.” Regional Studies 38 (3): 231–240. May. https://doi.org/10.1080/003434042000211114.
- Shi, K., Y. Wu, S. Liu, Z. Chen, C. Huang, and Y. Cui. 2023. “Mapping and Evaluating Global Urban Entities (2000–2020): A Novel Perspective to Delineate Urban Entities Based on Consistent Nighttime Light Data.” GIScience & Remote Sensing 60 (1): 2161199. December. https://doi.org/10.1080/15481603.2022.2161199.
- Shi, K., B. Yu, Y. Hu, C. Huang, Y, Y. Chen, Huang, Z. Chen, and J. Wu. 2015. “Modeling and Mapping Total Freight Traffic in China Using NPP-VIIRS Nighttime Light Composite Data.” GIScience & Remote Sensing 52 (3): 274–289. May. https://doi.org/10.1080/15481603.2015.1022420.
- Shi, K., B. Yu, Y, Y. Huang, Hu, B. Yin, Z. Chen, L. Chen, and J. Wu. 2014. “Evaluating the Ability of NPP-VIIRS Nighttime Light Data to Estimate the Gross Domestic Product and the Electric Power Consumption of China at Multiple Scales: A Comparison with DMSP-OLS Data.” Remote Sensing 6 (2): 1705–1724. February. https://doi.org/10.3390/rs6021705.
- Song, Y., Y. Long, P. Wu, and X. Wang. 2018. “Are All Cities with Similar Urban Form or Not? Redefining Cities with Ubiquitous Points of Interest and Evaluating Them with Indicators at City and Block Levels in China.” International Journal of Geographical Information Science 32 (12): 2447–2476. December. https://doi.org/10.1080/13658816.2018.1511793.
- Sun, B., and W. Li. 2016. “City Size Distribution and Economic Performance: Evidence from City-Regions in China.” SCIENTIA GEOGRAPHICA SINICA 36 (3): 328–334. March. https://doi.org/10.13249/j.cnki.sgs.2016.03.002.
- Sun, B., W. Li, Z. Zhang, and T. Zhang. 2019. “Is Polycentricity a Promising Tool to Reduce Regional Economic Disparities? Evidence from China’s Prefectural Regions.” Landscape and Urban Planning 192:103667. December. https://doi.org/10.1016/j.landurbplan.2019.103667.
- Sun, J., T. Zhou, and D. Wang. 2023. “Effects of Urbanisation on PM2.5 Concentrations: A Systematic Review and Meta-Analysis.” Science of the Total Environment 900:166493. November. https://doi.org/10.1016/j.scitotenv.2023.166493.
- Sun, T., and Y. Lv. 2020. “Employment Centers and Polycentric Spatial Development in Chinese Cities: A Multi-Scale Analysis.” Cities 99:102617. April. https://doi.org/10.1016/j.cities.2020.102617.
- Taubenböck, H., M. Weigand, T. Esch, J. Staab, M. Wurm, J. Mast, and S. Dech. 2019. “A New Ranking of the world’s Largest Cities—Do Administrative Units Obscure Morphological Realities?.” Remote Sensing of Environment 232:111353. October. https://doi.org/10.1016/j.rse.2019.111353.
- Tong, K. P., C. C. M. Kyba, G. Heygster, H. U. Kuechly, J. Notholt, and Z. Kolláth. 2020. “Angular Distribution of Upwelling Artificial Light in Europe as Observed by Suomi–NPP Satellite.” Journal of Quantitative Spectroscopy & Radiative Transfer 249:107009. July. https://doi.org/10.1016/j.jqsrt.2020.107009.
- Wang, F., and N. Gu. 2023. “Exploring the Spatio-Temporal Characteristics and Driving Factors of Urban Expansion in Xi’an During 1930–2014.” International Journal of Urban Sciences 27 (1): 39–64. January. https://doi.org/10.1080/12265934.2022.2085152.
- Wang, J., Y. Chen, W. Liao, G. He, S. F. B. Tett, Z. Yan, P. Zhai, et al. 2021. “Anthropogenic Emissions and Urbanization Increase Risk of Compound Hot Extremes in Cities.” Nature Climate Change 11 (12): 1084–1089. December. https://doi.org/10.1038/s41558-021-01196-2.
- Wang, M. 2020. “Polycentric Urban Development and Urban Amenities: Evidence from Chinese Cities.” Environment & Planning B: Urban Analytics & City Science 48 (3): 400–416. March. https://doi.org/10.1177/2399808320951205.
- Withanage, N. C., K. Shi, and J. Shen. 2023. “Extracting and Evaluating Urban Entities in China from 2000–2020 Based on SNPP-VIIRS-like Data.” Remote Sensing 15:18. September. https://doi.org/10.3390/rs15184632.
- Wu, Y., K. Shi, Y. Cui, S. Liu, and L. Liu. 2023. “Differentiated Effects of Morphological and Functional Polycentric Urban Spatial Structure on Carbon Emissions in China: An Empirical Analysis from Remotely Sensed Nighttime Light Approach.” International Journal of Digital Earth 16 (1): 532–551. October. https://doi.org/10.1080/17538947.2023.2176558.
- Xu, R., W. Yue, F. Wei, G. Yang, T. He, and K. Pan. 2022. “Density Pattern of Functional Facilities and Its Responses to Urban Development, Especially in Polycentric Cities.” Sustainable Cities and Society 76:103526. January. https://doi.org/10.1016/j.scs.2021.103526.
- Yang, Z., Y. Chen, G. Guo, Z. Zheng, and Z. Wu. 2021. “Using Nighttime Light Data to Identify the Structure of Polycentric Cities and Evaluate Urban Centers.” Science of the Total Environment 780:146586. August. https://doi.org/10.1016/j.scitotenv.2021.146586.
- Yu, H., J. Yang, T. Li, Y. Jin, and D. Sun. 2022. “Morphological and Functional Polycentric Structure Assessment of Megacity: An Integrated Approach with Spatial Distribution and Interaction.” Sustainable Cities and Society 80:103800. May. https://doi.org/10.1016/j.scs.2022.103800.
- Yue, W., S. Qiu, H. Xu, L. Xu, and L. Zhang. 2019. “Polycentric Urban Development and Urban Thermal Environment: A Case of Hangzhou, China.” Landscape and Urban Planning 189:58–70. September. https://doi.org/10.1016/j.landurbplan.2019.04.008.
- Zhai, W., Z. Jiang, X, X. Meng, Zhang, M. Zhao, and Y. Long. 2022. “Satellite Monitoring of Shrinking Cities on the Globe and Containment Solutions.” iScience 25 (6): 104411. June. https://doi.org/10.1016/j.isci.2022.104411.
- Zhao, M., C. Cheng, Y. Zhou, X. Li, S. Shen, and C. Song. 2022. “A Global Dataset of Annual Urban Extents (1992–2020) from Harmonized Nighttime Lights.” Earth System Science Data 14 (2): 517–534. February. https://doi.org/10.5194/essd-14-517-2022.
- Zhao, N., F.-C. Hsu, G. Cao, and E. L. Samson. 2017. “Improving Accuracy of Economic Estimations with VIIRS DNB Image Products.” International Journal of Remote Sensing 38 (21): 5899–5918. November. https://doi.org/10.1080/01431161.2017.1331060.
- Zhao, P., and H. Hu. 2019. “Geographical Patterns of Traffic Congestion in Growing Megacities: Big Data Analytics from Beijing.” Cities 92:164–174. September. https://doi.org/10.1016/j.cities.2019.03.022.
- Zheng, S., Y. Huang, and Y. Fu. 2023. “The Effect of Polycentric Urban Spatial Structure on PM2.5: An Empirical Study of China.” Sustainable Cities and Society 98:104806. November. https://doi.org/10.1016/j.scs.2023.104806.