
 ?Mathematical formulae have been encoded as MathML and are displayed in this HTML version using MathJax in order to improve their display. Uncheck the box to turn MathJax off. This feature requires Javascript. Click on a formula to zoom.
ABSTRACT
The Global Precipitation Measurement (GPM) Microwave Imager (GMI) is a microwave (MW) radiometer that has near-global coverage and frequent revisit time. To date, operational total column water vapor (TCWV) data records from the GPM GMI sensor have been exclusively offered over oceanic regions. It is challenging to retrieve TCWV over land from satellite MW measurements because of varying land surface characteristics. In this paper, a novel Light Gradient Boosting Machine-based retrieval algorithm is proposed to derive TCWV over land from GMI-sensed MW brightness temperature (BT) observations. The GMI-observed MW BT at 18.7 GHz and 23.8 GHz, differential BT between 18.7 GHz and 23.8 GHz, latitude, longitude, and month are selected and utilized as the input variables of the retrieval approach, because of their strong correlation with satellite-sensed MW TCWV retrievals. Instead of surface emissivity data or radiative transfer model, we take into account the spatial and temporal elements, namely latitude, longitude, and month. The training of the retrieval method is performed based on ground-based TCWV estimates from worldwide 4,471 Global Navigation Satellite System (GNSS) stations in 2017. The performance of the newly proposed retrieval algorithm is independently validated in a worldwide coverage using reference TCWV from additional 4,341 GNSS stations in 2018–2020 and 605 radiosonde stations in 2017–2020. The newly retrieved TCWV estimates over land have a correlation coefficient of 0.76 and 0.83, a root-mean-square error (RMSE) of 5.82 mm and 6.02 mm, a relative RMSE of 34.91% and 34.36%, and a mean bias of 0.02 mm and −0.42 mm compared to reference TCWV from GNSS and radiosonde, respectively. The performance of the retrieval algorithm is satisfactory when compared to that of land-purpose TCWV of other satellite missions, though we have not used either surface emissivity data or radiative transfer model. This result increases confidence in retrieving TCWV over land from satellite-sensed MW BT measurements based on machine learning using ground-based TCWV observations. The newly developed retrieval algorithm has the potential for integration into operational satellite missions or meteorological services, thereby enhancing weather forecasting, climate modeling, and other relevant applications.
Introduction
Atmospheric water vapor is a key parameter that plays a critical role in the energy transport and hydrology cycle (Sherwood et al. Citation2010). It has a significant impact in amplifying greenhouse warming, which is strongly correlated with environment, climate, and weather in both local and global scales (Cess Citation2005; You et al. Citation2021). Water vapor is also considered an essential factor in connection with numerical weather predictions (Manandhar et al. Citation2019; Rohm et al. Citation2019). The distribution of atmospheric water vapor shows a high uncertainty in the spatial-temporal domain (Trenberth, Fasullo, and Smith Citation2005). Radiosonde is considered a primary ground-based instrument to observe total column water vapor (TCWV), which typically provides one or two data records per day at each specific station (Vaquero-Martínez et al. Citation2018; Xu and Liu Citation2023d). Radiosonde-measured TCWV data estimates have been utilized to validate water vapor observations from other ground-based and satellite-based instruments (du Piesanie et al. Citation2013; Z. Liu et al. Citation2013; Vaquero-Martínez et al. Citation2018; Xu and Liu Citation2023b).
In addition to radiosonde-based TCWV, the Global Navigation Satellite System (GNSS) can also provide TCWV measurements with a higher temporal resolution, i.e. hourly TCWV (Vaquero-Martínez et al. Citation2018). GNSS-sensed TCWV has been commonly used as ground-based reference TCWV in the development of the TCWV retrieval algorithm (He and Liu Citation2020; Ma et al. Citation2022; Xu and Liu Citation2021, Citation2022a) as well as the validation of other TCWV measurements from ground-based and satellite-based sensors (Vaquero-Martínez et al. Citation2018; S. Wang et al. Citation2020; Xu and Liu Citation2022d).
Unlike ground-based GNSS and radiosonde instruments that exclusively provide station-wise TCWV measurements, sensors onboard space-based satellite platforms offer a unique means to measure spatiotemporally continuous TCWV estimates in a large or even global coverage, along with a proper spatial-temporal resolution (Xu and Liu Citation2023d). It will help better monitor the spatiotemporal distribution of atmospheric TCWV in both local and global scales, compared to ground-based sensors. Satellite-based TCWV measurements can be derived based on different spectral wavelength ranges, such as visible, near-infrared, infrared, and microwave (MW) (Borger et al. Citation2020; Di Natale et al. Citation2019; Kaufman and Gao Citation1992; Liu et al. Citation2020; Seemann et al. Citation2003; Wang et al. Citation2014; Xu and Liu Citation2022b). Additionally, satellite remotely sensed data are frequently employed in the mapping of various physical dynamics, as presented in the previous work (Orusa et al. Citation2020; Orusa, Viani, and Borgogno-Mondino Citation2024; Orusa, Viani, Cammareri, et al. Citation2023; Orusa, Viani, Moyo, et al. Citation2023; Viani et al. Citation2023). For instance, a methodological approach, developed using geomatics and satellite data, has been proposed to enhance our understanding of wildlife disease assessment at the landscape scale (Orusa et al. Citation2020).
The TCWV products, obtained from satellite near-infrared channels, are considerably impacted by clouds, resulting in significant TCWV uncertainties in the presence of clouds (Xu and Liu Citation2022c). For instance, the near-infrared TCWV product of the Moderate Resolution Imaging Spectroradiometer (MODIS) shows a correlation of below 0.2, a root-mean-square error (RMSE) of larger than 10 mm, and a mean bias (MB) of below −10 mm under cloudy sky conditions compared to reference GNSS TCWV measurements (Xu and Liu Citation2022c). The Remote Sensing Systems (RSS) provides operational TCWV products derived from satellite-sensed MW observations, which are currently only available for oceanic regions due to the MW bands’ high sensitivity to the emissivity of land surfaces (Draper et al. Citation2015; Du, Kimball, and Jones Citation2015; Sensing Systems and Meissner Citation2012). For instance, the RSS provides TCWV data over ocean from the Global Precipitation Measurement (GPM) Microwave Imager (GMI) sensor, with a spatial resolution of 0.25° × 0.25° (Draper et al. Citation2015; Sensing Systems and Meissner Citation2012). The GMI instrument, launched in February 2014, consists of 13 bands ranging from 10.65 GHz to 183.31 GHz, which is primarily designed to observe precipitation (Draper et al. Citation2015). However, due to significant uncertainties in MW-based TCWV retrievals over land surfaces, the RSS-based operational GMI-derived water vapor observations are not provided over land areas (Draper et al. Citation2015; Sensing Systems and Meissner Citation2012).
While it is challenging to retrieve TCWV over land using satellite MW measurements, several efforts have been dedicated to developing retrieval methods for estimating TCWV from satellite MW bands over land regions. Deeter (Deeter Citation2007) proposed a novel retrieval approach to derive TCWV over land and ocean using MW measurements at 18.7 GHz and 23.8 GHz, which associated MW polarization difference signals with TCWV. The results showed that the new TCWV retrieval approach had a reasonable performance over both land and oceanic areas. The research in Ji et al. (Citation2017) developed a new retrieval algorithm based on optical and MW observations to derive TCWV over land, showing that the new TCWV estimates agreed well with GNSS-retrieved reference TCWV measurements, with an RMSE from 4.66 mm to 6.25 mm and a correlation coefficient of 0.86 to 0.92. Additionally, an enhanced TCWV retrieval method was proposed to estimate water vapor over land surfaces from MW observations of the Fengyun-3D (FY-3D) satellite (Du et al. Citation2020). The new FY-3D TCWV data over land areas exhibited an RMSE of 5.69 mm compared to GNSS TCWV and 5.47 mm compared to radiosonde TCWV, with a correlation coefficient of 0.87 and 0.94, respectively (Du et al. Citation2020).
Although several retrieval models have been developed to derive TCWV over land from satellite MW data, previously published studies have not investigated the retrieval of water vapor over land using MW observations of the GMI/GPM sensor so far. Because of this, the primary objective of this study is to develop a novel retrieval approach that can accurately derive TCWV over land using satellite MW observations from the GMI/GPM sensor. This endeavor seeks to fill a significant gap in the field of atmospheric science, as there are currently no existing operational products that provide TCWV data for land regions derived from the GMI/GPM sensor’s measurements. By achieving this goal, the study aims to enhance the satellite data sources available to meteorologists and climate scientists for monitoring and analyzing TCWV distribution over land, which is a critical factor in weather forecasting and climate studies.
In this article, we propose a new retrieval algorithm to derive TCWV over land from MW measurements based on a machine-learning model. In contrast to previous studies relying upon microwave radiative transfer approaches (Deeter Citation2007; J. Du, Kimball, and Jones Citation2015; Du et al. Citation2020; Ji et al. Citation2017), our retrieval algorithm utilizes a machine-learning method to derive TCWV from GMI-based brightness temperature (BT) observations, considering the spatial and temporal factors (i.e. latitude, longitude, and month). By utilizing latitude, longitude, and month data, climatological emissivity is implicitly and indirectly incorporated into our machine learning-based retrieval algorithm. Both horizontally and vertically polarized BT measurements at 18.7 GHz are utilized, together with the vertically polarized BT measurements at 23.8 GHz. The retrieval algorithm does not require surface emissivity measurements that are frequently required in previous studies (Deeter Citation2007; Du, Kimball, and Jones Citation2015; B. Du et al. Citation2020; Ji et al. Citation2017). This study offers implications for directly retrieving TCWV over land from GMI-sensed MW data based on machine learning, without the employment of surface emissivity or radiative transfer model.
Materials
In this article, three types of data sets are utilized, namely GMI MW data, GNSS TCWV data, and radiosonde TCWV data. The detailed introduction of the three-type datasets used in this paper is given in the following sub-sections.
GMI-based MW data
The GPM Microwave Imager (GMI), flown on the National Aeronautics and Space Administration (NASA)/Japan Aerospace Exploration Agency (JAXA) GPM spacecraft launched in February 2014, is a passive MW instrument that has a focus on the Earth’s precipitation (Draper et al. Citation2015). It is capable of offering near real-time measurements employed for determining severe weather events, with highly stable performance (Draper et al. Citation2015; Milani and Kidd Citation2023; Shen et al. Citation2022; Skofronick-Jackson et al. Citation2018). The GMI sensor consists of 13 radiometric bands from 10.65 GHz to 183.31 GHz, which is a key component in the GPM satellite to link the core observatory with the constellation instruments (Draper et al. Citation2015).
The GPM GMI Common Calibrated Brightness Temperatures Collocated L1C 1.5 h 13 km V07 (GPM_1CGPMGMI 07) product is used in this article, which can be freely accessed from the Goddard Earth Sciences Data and Information Services Center (GES DISC) (Citation2023). This data product offers BT observations from each GMI MW channel of the GPM spacecraft, together with spatial (i.e. latitude and longitude) and temporal (i.e. observation time) data fields (Citation2023). The GPM_1CGPMGMI is an “instantaneous” orbital product and has varying temporal resolution due to the irregular and latitude-dependent revisit time of the GMI instrument (Citation2023). It is also important to note that the GPM_1CGPMGMI product exhibits varying spatial resolution across different GMI channels (Citation2023).
In this study, the GPM_1CGPMGMI 07 products, collected from 2017 to 2020 across the world, were employed for the development and verification of the TCWV retrieval model. Three-type GMI-sensed BT data were utilized: horizontally polarized BT at 18.7 GHz, vertically polarized BT at 18.7 GHz, and vertically polarized BT at 23.8 GHz.
GNSS-based TCWV data
The ground-based GNSS-derived TCWV data, acquired from the Nevada Geodetic Laboratory (Blewitt, Hammond, and Kreemer Citation2018), are regarded as true water vapor values for the development and verification of the retrieval method. The retrieval of TCWV from GNSS observations is based on Bevis et al. (Bevis et al. Citation1992, Citation1994). A sum of 8,812 GNSS stations is employed in this work. 4,471 stations are used for the algorithm development, while the other 4,341 stations are used for the validation of the retrieval algorithm (see ).
Figure 1. Worldwide distribution of ground-based GNSS and radiosonde stations employed for the development and verification of the retrieval algorithm. The blue circles indicate the ground-based 4,471 GNSS stations used for developing the retrieval algorithm. The red circles indicate the ground-based 4,341 GNSS stations used for validating the retrieval algorithm. The red triangles indicate the ground-based 605 radiosonde stations used for validating the retrieval algorithm.
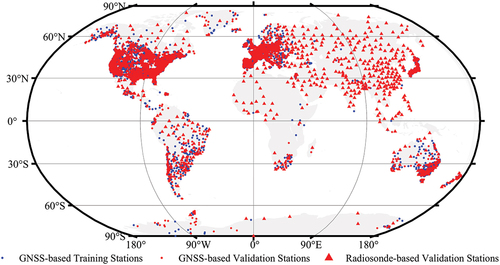
While no strict criterion has been applied to selecting the GNSS stations used for model training and validation, these chosen GNSS-based training and testing stations are required to distribute as evenly as possible. The exact selection of each individual station in each region is random. This aims to minimize any potential bias in the model training process, thereby ensuring the performance of our newly developed retrieval algorithm to be as good as possible. This also aims to independently evaluate the performance of the newly derived TCWV estimates.
In this research, one-year worldwide GNSS-based TCWV data measurements collected in 2017 from 4,471 training stations were utilized to train the TCWV retrieval approach. In the verification procedure, three-year worldwide GNSS-based TCWV data collected in 2018–2020 from the other 4,341 testing stations were used.
Radiosonde-based TCWV data
In addition to ground-based GNSS-based TCWV observations, the radiosonde-estimated TCWV data records are also utilized to evaluate the performance of newly retrieved water vapor data. presents the geographical distribution of ground-based radiosonde sites across the world, with a total of 605 stations.
The worldwide radiosonde-based measurements, acquired from the Integrated Global Radiosonde Archive Version 2 (Durre et al. Citation2016), are used in this research to retrieve reference TCWV observations. The radiosonde-observed TCWV data records are calculated using specific humidity observations from the surface to the top of radio sounding based on previous studies (Bolton Citation1980; Zhang et al. Citation2019). The IGRA2 radiosonde data are typically released twice daily, corresponding to the 00 and 12 UTC.
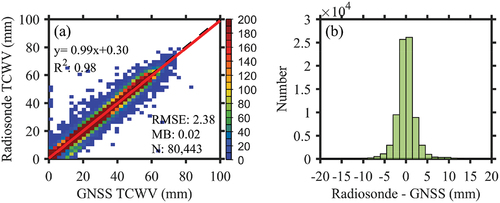
In this study, four-year worldwide radiosonde-based TCWV data observations during 2017 to 2020 were used to further validate the retrieval performance of newly derived TCWV estimates. shows the comparison between GNSS TCWV and radiosonde TCWV in 2017 across the world. In this comparison, the spatial distance between the collocated GNSS and radiosonde observations is required to be as close as possible and this distance does not exceed 3 km. Temporally, the observation time discrepancy between GNSS and radiosonde is less than 1 h. We also require the altitude difference between GNSS and radiosonde to be smaller than 100 m. The results in show that GNSS-derived TCWV data records have an excellent consistency with radiosonde-estimated TCWV observations, consistent with the results shown in previous studies (Vaquero-Martínez et al. Citation2019; Wang and Zhang Citation2008).
Figure 2. Comparison of GNSS TCWV versus radiosonde TCWV during 2017 across the world. The black dashed line is the reference 1:1 line, whereas the red line is the linear regression line between collocated data observations. The color bar indicates the number of collocated data points. N is the total number of collocated data points.
Methods
Light gradient boosting machine (LightGBM)
The Light Gradient Boosting Machine (LightGBM) is a machine learning approach based on gradient boosting, with fast, distributed, and high performance (Ke et al. Citation2017). It relies upon decision trees that can be used to address the classification and regression problems (Ke et al. Citation2017). The LightGBM is a new implementation of the Gradient Boosting Decision Tree (GBDT) method (Ke et al. Citation2017).
In this work, the LightGBM machine learning approach is selected and used to define the relationship between the retrieved TCWV and the satellite GMI MW observations, together with other input factors. On the one hand, using traditional approaches is very hard to address the complex non-linear multi-factor regression problem, while machine learning is beneficial in solving it (Ma et al. Citation2022; Xu and Liu Citation2023a). On the other hand, previous studies showed that the GBDT model has a good potential to adjust the observational quality of satellite-derived TCWV data products (Xu and Liu Citation2022b, Citation2023c). Consequently, we utilize the LightGBM model, which is a new implementation of the GBDT.
Retrieval of TCWV from MW measurements of the GMI instrument
We develop a novel retrieval approach based on LightGBM to obtain new TCWV data over land from MW observations of the GMI/GPM sensor.
The input source of the retrieval approach includes horizontally polarized BT at 18.7 GHz, vertically polarized BT at 18.7 GHz, vertically polarized BT at 23.8 GHz, differential BT between horizontally polarized BT at 18.7 GHz and vertically polarized BT at 23.8 GHz, and differential BT between vertically polarized BT at 18.7 GHz and vertically polarized BT at 23.8 GHz, in addition to spatial fields, i.e. latitude and longitude as well as the temporal field, i.e. month. The BT, differential BT, latitude, longitude, and month have a significant influence on satellite-derived TCWV data products, as presented in previous studies (Ji et al. Citation2017; Vaquero-Martínez et al. Citation2018; Xu and Liu Citation2023d). There is an implicit and indirect inclusion of climatological emissivity in our machine learning-based retrieval algorithm, based on the use of latitude, longitude, and month data.
The employment of 18.7 GHz and 23.8 GHz channels of the GMI sensor is primarily based on previous studies (Deeter Citation2007; Du et al. Citation2020; Ji et al. Citation2017). Specifically, the 23.8 GHz band is selected due to its absorption properties for atmospheric water vapor. The 18.7 GHz channel is utilized as a non-absorption reference channel. The water vapor retrieval from GMI MW observations is viewed as an inversion problem that links the derived TCWV with satellite GMI MW measurements as well as the spatial-temporal fields. For each GMI pixel, the newly derived TCWV can be calculated as:
where W is the newly retrieved TCWV from MW observations of the GMI sensor; TH18.7 is the horizontally polarized BT at 18.7 GHz; TV18.7 is the vertically polarized BT at 18.7 GHz; TV23.8 is the vertically polarized BT at 23.8 GHz; DTH is the differential BT between horizontally polarized BT at 18.7 GHz and vertically polarized BT at 23.8 GHz; DTV is the differential BT between vertically polarized BT at 18.7 GHz and vertically polarized BT at 23.8 GHz; and LT, LN, and M are the latitude, longitude, and month of GMI-sensed MW observations, respectively.
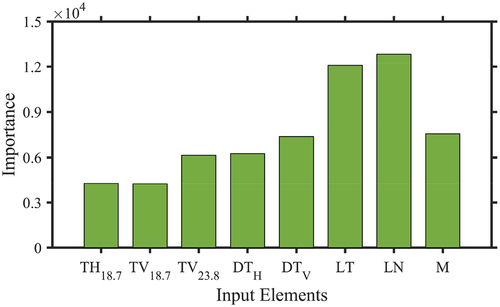
The function F is defined using the LightGBM, which has the advantage of addressing the complex multi-factor regression problem (Xu and Liu Citation2022b, Citation2023c). All fields included in the retrieval model can be acquired from the operational GPM_1CGPMGMI 07 data product. The importance of each input parameter of the newly proposed retrieval algorithm is presented in . It can be found that all input elements contribute to the GMI-based TCWV retrieval over land. In particular, the combined importance of all inputting GMI-based measurements (i.e. TH18.7, TV18.7, TV23.8, DTH, and DTV) is comparable to that of all inputting spatial-temporal fields, namely LT, LN, and M. This illustrates the feasibility of retrieving TCWV over land from satellite GMI-sensed BT measurements, along with the use of spatiotemporal data.
Figure 3. The importance of each input element in the LightGBM-based retrieval algorithm, which is employed for the retrieval of TCWV over land from GMI-sensed MW observations.
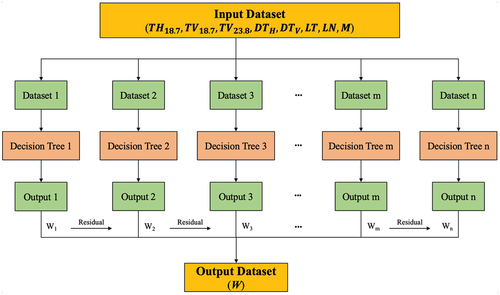
shows the overall schematic to retrieve TCWV from GMI MW observations based on LightGBM. It is crucial to collocate GMI data observations with GNSS and radiosonde data measurements in the spatial and temporal coverages, aiming to develop and validate the novel TCWV retrieval approach. In this article, the center of GMI pixels is required to be as close to the location of GNSS and radiosonde stations as possible, on the condition that the distance between GMI–GNSS or GMI–radiosonde observations has to be below 10 km. The temporal discrepancy between matched GMI–GNSS data sets must be below 30 min. It is required that the collocated GMI–radiosonde measurements be below 1 h.
Figure 4. The overall structure of the retrieval of TCWV over land from GMI MW measurements based on the LightGBM machine learning approach.
In the training of retrieval model, the ground-based GNSS-measured TCWV data records, collected from 4,471 training stations in 2017 across the globe, are utilized, i.e. W in EquationEquation (1)(1)
(1) . A total of collocated 1,396,710 GMI–GNSS data pairs in 2017 across the globe are used in this algorithm training procedure.
The boosting type of the LightGBM is set as GBDT. We set the maximal leaves of each decision tree from 5 to 300, with an increment step of 5. The largest depth of decision trees is set from 1 to 20 with an increment step of 1. The quantity of decision trees is set from 5 to 1000 with an increment step of 5. Finally, the optimal results of the above parameters of the LightGBM are respectively 205, 8, and 330, based on a 5-fold cross-validation approach. Note that other parameters of the LightGBM that are not listed are set to be the default. After the completion of the model training, we then apply the trained retrieval approach to derive new TCWV data records from global GMI MW observations during the period from 2017 to 2020.
Quantitative assessment metrics
In this article, four verification metrics, i.e. R2, RMSE, relative RMSE (RRMSE), and MB, are employed to evaluate the observational performance of the newly derived TCWV data observations based on ground-based GNSS and radiosonde TCWV measurements.
The correlation coefficient, namely R2, is utilized to illustrate the strength between collocated GMI–GNSS or GMI–radiosonde measurements. It is computed as:
where WGMI is the TCWV derived from satellite GMI MW channels; is the average of TCWV derived from satellite GMI MW channels; WRF is the reference TCWV derived from GNSS or radiosonde sensor;
is the average of reference TCWV derived from GNSS or radiosonde sensor; and N is the total number of matched data points.
The RMSE, RRMSE, and MB are utilized to illustrate the observational accuracy of new GMI-based TCWV data records compared to reference TCWV from GNSS or radiosonde instruments. They are written as:
Note, the MB metric can also indicate the overestimation or underestimation of TCWV values based on reference GNSS and radiosonde TCWV estimates.
Results
The worldwide performance of the newly derived TCWV data from satellite GMI BT measurements is evaluated using TCWV observations from an additional 4,341 GNSS-based testing stations in 2018–2020. In addition, the observational accuracy of new GMI-retrieved TCWV data is also verified using TCWV estimates from 605 radiosonde-based verification stations in 2017–2020. Both validation procedures are independent of the algorithm training process, which employs TCWV measurements from 4,471 GNSS-based training stations in 2017.
Worldwide comparison of GMI TCWV with GNSS TCWV during 2018–2020
lists the validation results of new GMI-derived TCWV observations based on GNSS-measured TCWV estimates from an additional 4,341 testing stations during 2018–2020 across the world. A total of 4,903,035 GMI–GNSS data pairs are utilized in this verification process.
Figure 5. Verification of newly retrieved TCWV over land from GMI MW measurements using reference TCWV from additional 4,341 GNSS stations during the period from 2018 to 2020 across the globe. The first, second, third, and fourth rows show the verification results in 2018, 2019, 2020, and 2018–2020, respectively. The black dashed line is the reference 1:1 line, whereas the red line is the linear regression line between collocated data observations. The color bar indicates the number of collocated data points.
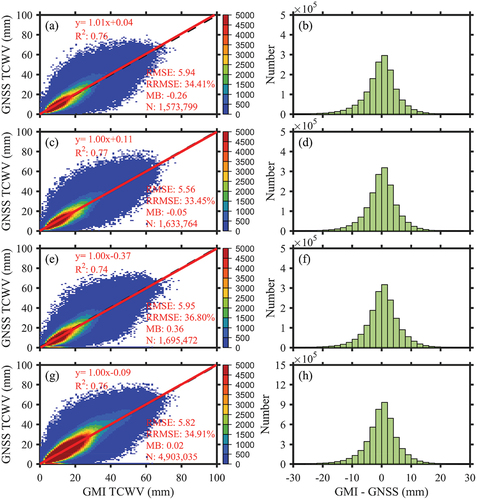
The results in indicate that all new TCWV data presented a good consistency with GNSS-derived reference TCWV observations. The correlation coefficient R2 was in the range of 0.74 to 0.77. The GMI-derived TCWV measurements exhibited an RMSE of 5.94 mm in 2018, 5.56 mm in 2019, 5.95 mm in 2020, and 5.82 mm in 2018–2020, when compared with reference TCWV from GNSS measurements. In terms of RMSE, the newly developed retrieval model in this work had a relatively stable performance in different years from 2018 to 2020, though it was developed based on the 2017 data.
The MB values of GMI TCWV versus GNSS TCWV were in the range of −0.26 mm (2018) to 0.36 mm (2020). The frequency distribution of MB between GMI TCWV and GNSS TCWV was, in general, reasonable, with the most collocated GMI–GNSS data measurements between −4 mm and 4 mm. The slopes of linear regression lines between TCWV from GMI and GNSS were approximate to 1, with the offsets from −0.37 to 0.11.
In , with the increase of TCWV, the RMSE values between GMI TCWV and GNSS TCWV had an increased trend, due to the magnitude of TCWV values (Vaquero-Martínez et al. Citation2018; Xu and Liu Citation2022b, Citation2023d). In terms of RRMSE, there was an overall decreased tendency with the increasing TCWV, consistent with the previous work (Xu and Liu Citation2023d). In addition, fewer available matched GMI–GNSS data pairs at high TCWV values could affect the results for the high TCWV groups (Vaquero-Martínez et al. Citation2018; Xu and Liu Citation2022b, Citation2023d). The newly derived TCWV data records overestimated the TCWV values (positive MB) when the TCWV values were no more than 20 mm. When the TCWV values were larger than 20 mm, an underestimation trend of TCWV values (negative MB) was observed. Notedly, the poor metrics like slope, offset, and R2, could be attributed to the high variability in each TCWV group, as presented in .
Table 1. Verification of newly derived TCWV over land from GMI MW measurements using reference TCWV from an additional 4,341 GNSS stations during the period from 2018 to 2020 across the globe, at different TCWV levels.
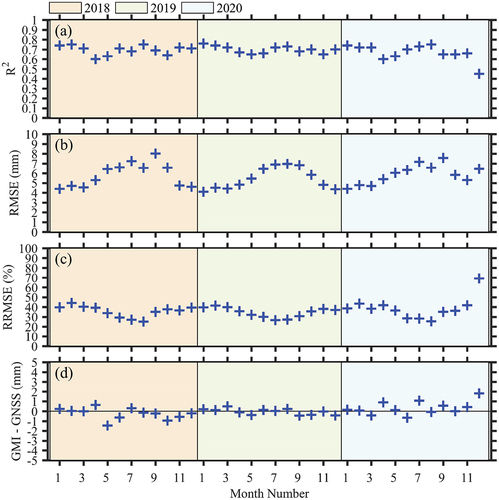
The monthly-series assessment between GMI TCWV against GNSS TCWV during 2018–2020 is shown in . The monthly R2, RMSE, RRMSE, and MB metrics were determined based on collocated GMI–GNSS observations on a monthly basis. The new GMI-derived monthly mean TCWV data also presented a good consistency with the reference GNSS monthly averaged water vapor observations. The monthly R2 of GMI TCWV versus GNSS TCWV was in the range of 0.45 (December 2020) to 0.76 (January 2019), with the monthly R2 above 0.65 at almost all months. The newly derived water vapor observations exhibited a monthly RMSE between 4.10 mm (January 2019) and 8.02 mm (September 2018), with a monthly MB close to 0 at most months. For RRMSE, it was in the range of 25.12% (August 2018) to 69.18% (December 2020) on a monthly basis. It should be mentioned that the new GMI-retrieved TCWV observations tended to show larger RMSE and lower RRMSE in wet months than in dry months. This was due to the magnitude of TCWV values, as demonstrated in previous studies (Vaquero-Martínez et al. Citation2018; Xu and Liu Citation2023d). In general, the newly developed TCWV retrieval algorithm exhibited a relatively stable performance in estimating water vapor from GMI MW observations at the temporal monthly series, when compared with GNSS-observed reference TCWV estimates.
Figure 6. Temporal monthly-series verification of newly derived TCWV over land from GMI MW measurements using reference TCWV from additional 4,341 GNSS stations during the period from 2018 to 2020 across the globe.
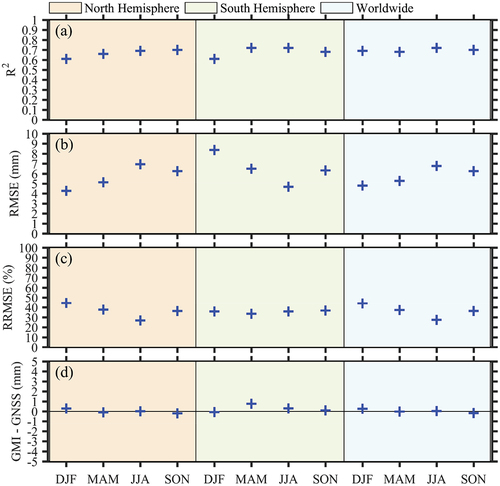
In , we also classified the temporal period into four distinct seasons, namely DJF (December, January, and February), MAM (March, April, and May), JJA (June, July, and August), and SON (September, October, and November). It is observed that the GMI-derived seasonal mean TCWV estimates showed a good consistency with GNSS-derived seasonal averaged water vapor data. The newly derived TCWV observations had a seasonal correlation between 0.61 and 0.72, a seasonal RMSE between 4.27 mm and 8.37 mm, a seasonal RRMSE between 26.88% and 44.42%, and a seasonal MB between −0.20 mm and 0.76 mm. The new GMI-retrieved TCWV observations tended to show larger RMSE and smaller RRMSE in wet seasons (large TCWV) in both north and south hemispheres, consistent with the previous research (Vaquero-Martínez et al. Citation2018; Xu and Liu Citation2023d).
Figure 7. Seasonal verification of newly derived TCWV over land from GMI MW measurements using reference TCWV from additional 4,341 GNSS stations during the period from 2018 to 2020 across the globe.
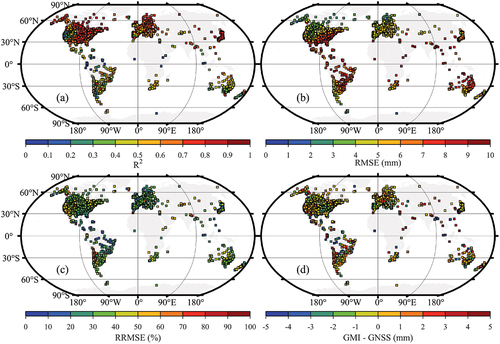
At most GNSS stations, the satellite-based GMI-derived TCWV data agreed well with ground-based GNSS-derived TCWV data. When compared with GNSS-measured reference TCWV data, the station-wise RMSE was in the range of 3 mm to 6 mm in most stations, with a station-wise RRMSE of 20% to 40% as well a station-wise MB of −2 mm to 2 mm (see ). Note that the station-wise RMSE values between GMI TCWV and GNSS TCWV reached around 10 mm at several coastal stations in South and North American regions, with relatively low RRMSE values in these regions. This resulted from the large TCWV values at coastal areas, consistent with the previous research (Vaquero-Martínez et al. Citation2018; Xu and Liu Citation2022b, Citation2023d).
Figure 8. Station-wise verification of newly derived TCWV over land from GMI MW measurements using reference TCWV from additional 4,341 GNSS stations during the period from 2018 to 2020 across the globe. The (a), (b), (c), and (d) show the station-wise R2, RMSE, RRMSE, and MB between GMI TCWV and GNSS TCWV, respectively.
Worldwide comparison of GMI TCWV with radiosonde TCWV during 2017–2020
The additional assessment of the newly retrieved TCWV data records is conducted using radiosonde-based TCWV observations from 605 stations in 2017–2020, with a sum of spatial-temporal 229,469 GMI–radiosonde data collocations.
In , the new GMI-derived TCWV observations presented R2, RMSE, RRMSE, and MB of 0.84, 5.84 mm, 33.66%, and −0.38 mm in 2017, 0.83, 6.28 mm, 34.88%, and −0.65 mm in 2018, 0.83, 6.03 mm, 34.05%, and −0.41 mm in 2019, 0.82, 5.92 mm, 34.83%, and −0.23 mm in 2020, and 0.83, 6.02 mm, 34.36%, and −0.42 mm in 2017–2020, when compared to radiosonde-derived reference TCWV measurements. It is indicated that the retrieval algorithm developed in this work has a relatively stable performance during the period between 2017 and 2020, although it was built based on the 2017 GNSS-based TCWV data.
Figure 9. Verification of newly derived TCWV over land from GMI MW measurements using reference TCWV from 605 radiosonde stations during the period from 2017 to 2020 across the globe. The first, second, third, fourth, and fifth rows show the verification results in 2017, 2018, 2019, 2020, and 2017–2020, respectively. The black dashed line is the reference 1:1 line, whereas the red line is the linear regression line between collocated data observations. The color bar indicates the number of collocated data points.
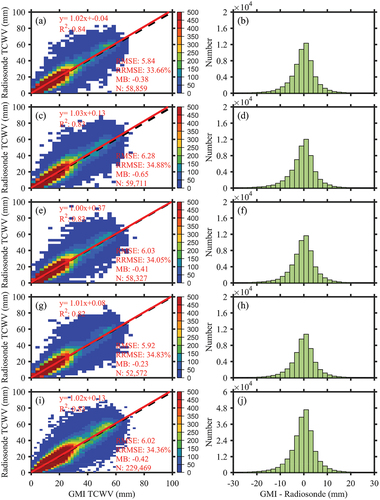
In addition, the newly derived TCWV data observations showed an overall reasonable MB frequency distribution, with most paired GMI–radiosonde measurements having an MB from −4 mm to 4 mm. The slopes of linear regression lines of GMI TCWV versus radiosonde TCWV were in the range of 1.00 to 1.03, which were approximate to 1. The newly retrieved water vapor estimates exhibited an overall underestimation of TCWV values, as indicated by negative MB values.
As shown in , the newly derived water vapor measurements exhibited an increased RMSE as the TCWV values increased, proportional to the magnitude of TCWV values (Vaquero-Martínez et al. Citation2018; Xu and Liu Citation2022b, Citation2023d). At the same time, with the increase of TCWV values, there was an overall decreased tendency in RRMSE between GMI TCWV and radiosonde TCWV. This had a good consistency with the previous work (Xu and Liu Citation2023d). The retrieval model also presented positive MB values (overestimation) when the TCWV values were below 20 mm. On the contrary, when the TCWV values were over 20 mm, it showed negative MB values (underestimation). Additionally, the slope, offset, and R2 metrics were poor because of high variability at each TCWV category, as demonstrated in .
Table 2. Verification of newly derived TCWV over land from GMI MW measurements using reference TCWV from 605 radiosonde stations during the period from 2017 to 2020 across the globe, at different TCWV levels.
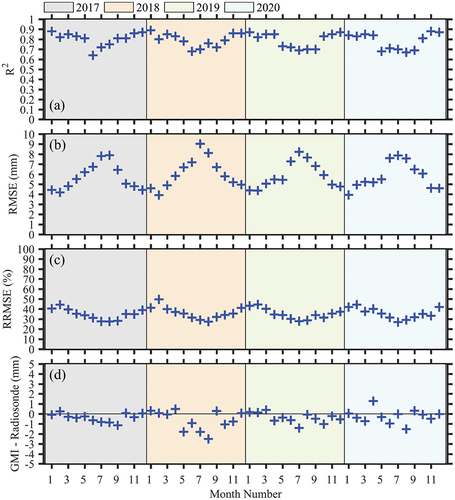
shows the temporal monthly-series comparison between GMI TCWV versus radiosonde TCWV during 2017–2020 across the world. On a monthly basis, the newly derived water vapor measurements also exhibited a good agreement with reference radiosonde-based TCWV estimates, with a monthly R2 from 0.64 to 0.89, a monthly RMSE from 3.92 mm to 9.03 mm, a monthly RRMSE from 27.00% to 49.62%, and a monthly MB from −2.50 mm to 1.28 mm. In terms of RMSE, the new GMI-retrieved monthly averaged TCWV shows a poorer performance in wet months than in dry months, i.e. larger RMSE values at wet months. This is due to the larger TCWV values in wet months, consistent with the previous work (Vaquero-Martínez et al. Citation2018; Xu and Liu Citation2023d). On the contrary, because of large TCWV values in wet months, the monthly RRMSE values between GMI TCWV and radiosonde TCWV were relatively lower in wet months than in dry months, which had a good agreement with the previous research (Xu and Liu Citation2023d). Overall, the retrieval algorithm developed in this research presented an overall stable performance in retrieving TCWV over land from satellite GMI MW observations in the temporal monthly series, when compared to radiosonde-measured reference TCWV estimates.
Figure 10. Temporal monthly-series verification of newly derived TCWV over land from GMI MW measurements using reference TCWV from 605 radiosonde stations during the period from 2017 to 2020 across the globe.
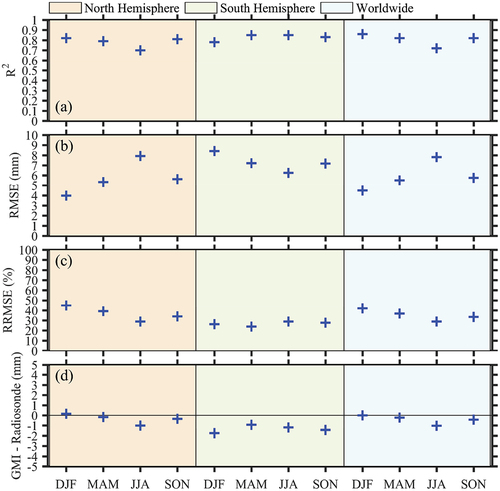
The GMI-retrieved seasonal TCWV estimates also exhibited a good agreement with radiosonde-based seasonal TCWV data, with the results displayed in . On a seasonal basis, the newly retrieved TCWV data showed an R2 from 0.70 to 0.86, an RMSE from 3.98 mm to 8.41 mm, and an RRMSE from 23.84% to 44.85%, when compared to reference radiosonde TCWV data. The seasonal MB values between TCWV from GMI and radiosonde were −1.75 mm to 0.15 mm. In terms of RMSE, the newly proposed retrieval algorithm presented a relatively poorer performance in wet seasons, because of the large TCWV in wet months (Vaquero-Martínez et al. Citation2018; Xu and Liu Citation2023d). Additionally, little training data in several regions worldwide, employed in the LightGBM-based retrieval method, could also be responsible for our algorithm’s poor performance in wet seasons.
Figure 11. Seasonal verification of newly derived TCWV over land from GMI MW measurements using reference TCWV from 605 radiosonde stations during the period from 2017 to 2020 across the globe.
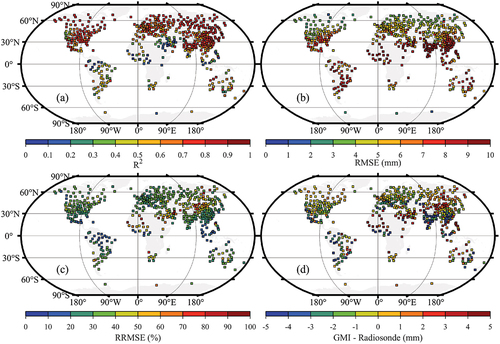
As presented in , the new GMI-based TCWV data agreed well with radiosonde-observed TCWV data at most stations. The station-wise RMSE values between GMI TCWV with radiosonde TCWV were, in general, in the range of 3 mm to 6 mm, with an overall station-wise RRMSE of 20% to 40% and an overall station-wise MB of −2 mm to 2 mm. Notedly, the newly retrieved TCWV data measurements exhibited an overall station-wise RMSE around 10 mm in the South and North American areas, due to the large TCWV values at coastal regions (Vaquero-Martínez et al. Citation2018; Xu and Liu Citation2023d). This was confirmed by relatively low RRMSE values in coastal areas of the South and North American (Xu and Liu Citation2023d). Additionally, in India and China, there were several station-wise RMSE values around 10 mm. This could also be due to large TCWV values in these regions. In addition, as very few GNSS stations, located in India and China, were utilized in the training of the retrieval model (see ), and as a result, the retrieval model was not well trained in India and China. This could lead to poor performance of new GMI-based TCWV data in India and China.
Figure 12. Station-wise verification of newly derived TCWV over land from GMI MW measurements using reference TCWV from 605 radiosonde stations during the period from 2017 to 2020 across the globe. The (a), (b), (c), and (d) show the station-wise R2, RMSE, RRMSE, and MB between GMI TCWV and radiosonde TCWV, respectively.
Discussion
A novel retrieval algorithm for GMI MW observations based on LightGBM is proposed to derive TCWV estimates over land. It is different from previous MW TCWV retrieval studies which use radiative transfer model and surface emissivity data (Deeter Citation2007; Di Natale et al. Citation2019; Du, Kimball, and Jones Citation2015; Ji et al. Citation2017; Liu et al. Citation2020). The LightGBM-based retrieval model is established using GMI-sensed BT observations as well as GNSS-sensed high-accuracy TCWV estimates, considering the spatial-temporal information (latitude, longitude, and month), without using radiative transfer model or surface emissivity data. Our machine learning-based retrieval algorithm indirectly and implicitly incorporates climatological emissivity by utilizing data on latitude, longitude, and month.
In the algorithm training process, the GNSS TCWV measurements from 4,471 stations in 2017 are used for the development and training of the retrieval model. On the other hand, the ground-based water vapor estimates, obtained from an additional 4,341 GNSS stations in 2018–2020 and from 605 radiosonde stations in 2017–2020, are employed to verify the performance of newly retrieved TCWV data from GMI MW observations. A total of 4,903,035 data pairs from GMI–GNSS measurements and 229,469 data pairs from GMI–radiosonde measurements are employed in the model verification process. The assessment of the retrieval model is independent of the retrieval model training procedure, as collocated observations, utilized in model training and verification processes, are distinct in both spatial and temporal domains. By utilizing spatiotemporally independent reference data to validate our retrieval algorithm, we can more accurately assess its ability to retrieve TCWV data over land from GMI MW observations.
The newly retrieved TCWV measurements exhibit an increasing RMSE with the increasing TCWV values, because of the magnitude of TCWV values (Vaquero-Martínez et al. Citation2018; Xu and Liu Citation2022b, Citation2023d). It makes sense to find this multiplicative error structure in TCWV estimates, which is well recognized in the precipitation remote sensing community. In addition, there is an overall decreased RRMSE with the increasing TCWV values, consistent with the previous research (Xu and Liu Citation2023d).
Spatial stability of the retrieval algorithm
At most GNSS and radiosonde stations, the satellite-based GMI-retrieved TCWV data show a good agreement with ground-based TCWV data from GNSS and radiosonde instruments, with a station-wise RMSE from 3 mm to 6 mm, a station-wise RRMSE from 20% to 40%, and a station-wise MB from −2 mm to 2 mm.
In terms of RMSE, the newly derived TCWV data records present a relatively poorer performance in several coastal GNSS and radiosonde stations in the South and North American regions, due to the high water vapor values at coastal regions (see and ), which is consistent with previous studies (Vaquero-Martínez et al. Citation2018; Xu and Liu Citation2022b, Citation2023d). In addition, the suboptimal performance of the retrieval algorithm in coastal regions may be attributed to the complex intermingling of land and ocean surfaces in these areas.
The station-wise RMSE values between GMI TCWV and radiosonde TCWV in Africa, India, and China are around 10 mm, which are larger than those at other worldwide regions. This could be because the retrieval model has not been well trained with few GNSS stations in Africa, India, and China (see ). The poor training of the retrieval model in the Africa, India, and China areas could then result in the poor performance of new GMI-derived TCWV data measurements. In addition, the high TCWV values in Africa, India, and China could also lead to the large RMSE values in these regions, as demonstrated in previous studies (Vaquero-Martínez et al. Citation2018; Xu and Liu Citation2022b, Citation2023d).
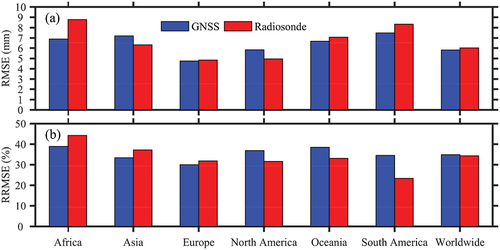
In , the newly retrieved TCWV data show an RMSE in the range of 4.75 mm to 7.48 mm compared to GNSS TCWV and in the range of 4.83 mm to 8.77 mm compared to radiosonde TCWV, in different areas worldwide. Their RRMSE values are in the range between 29.99% and 38.91% and between 23.32% and 44.25%, respectively. The retrieval algorithm performs the worst in Africa where few GNSS stations are utilized in the training of the retrieval approach. This further confirms that the poor training of the retrieval approach with few GNSS stations may lead to the low accuracy of newly derived TCWV estimates. This also illustrates that dense ground-based TCWV observation station networks are desired for the training of machine learning-based retrieval methods.
Figure 13. Verification of newly retrieved TCWV over land from GMI MW measurements using reference TCWV from additional 4,341 GNSS stations during the period from 2018 to 2020 and 605 radiosonde stations during the period from 2017 to 2020, in different regions worldwide.
Overall, the retrieval approach, developed in this study, exhibits a relatively stable performance in most areas worldwide, except for some coastal areas as well as regions with few training stations.
Temporal stability of the retrieval algorithm
Annually, the new GMI-derived TCWV data show a good agreement with GNSS-derived reference TCWV observations, with R2 from 0.74 to 0.77, RMSE from 5.56 mm to 5.95 mm, and MB from −0.26 mm to 0.36 mm. Compared with radiosonde-retrieved reference TCWV measurements, the newly retrieved TCWV observations have an R2 of 0.82 to 0.84, RMSE of 5.84 mm to 6.28 mm, and MB of −0.65 mm to −0.23 mm. The annual validation results in 2018, 2019, and 2020 show that the new retrieval model performs stably year over year.
Monthly, the new LightGBM-estimated TCWV estimates agree well with reference TCWV estimates from GNSS and radiosonde observations. The monthly RMSE is between 4.10 mm and 8.02 mm when compared to GNSS TCWV and the monthly RMSE is between 3.92 mm and 9.03 mm when compared to radiosonde TCWV. Additionally, the monthly RRMSE values of newly derived TCWV data are in the range of 25.12% to 69.18% and 27.00% to 49.62% compared to GNSS and radiosonde TCWV measurements, respectively. Note that the new GMI-retrieved TCWV observations show higher RMSE values in wet months than in dry months, because of the large TCWV values at wet months (Vaquero-Martínez et al. Citation2018; Xu and Liu Citation2022b, Citation2023d).
Seasonally, the newly derived TCWV data exhibit a seasonal correlation between 0.61 and 0.72, a seasonal RMSE between 4.27 mm and 8.37 mm, a seasonal RRMSE between 26.88% and 44.42%, and a seasonal MB between −0.20 mm and 0.76 mm, when compared to GNSS TCWV. When compared to radiosonde TCWV, the newly retrieved TCWV estimates present an R2 from 0.70 to 0.86, an RMSE from 3.98 mm to 8.41 mm, an RRMSE from 23.84% to 44.85%, and an MB from −1.75 mm to 0.15 mm on a seasonal cycle. The retrieval algorithm shows a relatively poorer performance in wet seasons, because of the large TCWV values (Vaquero-Martínez et al. Citation2018; Xu and Liu Citation2023d). Additionally, little training data in several regions worldwide, employed in the LightGBM-based retrieval method, could also result in our algorithm’s poor performance in wet seasons.
The annual, monthly, and seasonal assessment results show that, in the temporal domain, the newly developed retrieval approach has a relatively reliable performance when retrieving TCWV estimates from GMI MW measurements.
Comparison of the retrieval algorithm with different machine learning approaches
To further investigate the feasibility and practicality of the retrieval algorithm, we validate the performance of the retrieval method using other common machine learning approaches, such as Back Propagation Neural Network (BPNN), GBDT, Multilayer Perceptron Neural Network (MLPNN), Random Forest (RF), and Extreme Gradient Boosting (XGboost).
As listed in , the newly derived TCWV data present an RMSE in the range of 5.82 mm (LightGBM) to 5.96 mm (RF) when compared to GNSS TCWV and in the range of 5.99 mm (XGBoost) to 6.14 mm (MLPNN) when compared to radiosonde TCWV. Similarly, the RRMSE values are in the range from 34.91% (LightGBM) to 35.75% (RF) when compared to GNSS TCWV and in the range from 34.36% (XGBoost) to 35.04% (MLPNN) when compared to radiosonde TCWV.
Figure 14. Verification of the performance of the retrieval algorithm developed based on BPNN, GBDT, LightGBM, MLPNN, RF, and XGBoost. The reference TCWV, collected from additional 4,341 GNSS stations during the period from 2018 to 2020 and 605 radiosonde stations during the period from 2017 to 2020, are utilized for the validation of newly retrieved TCWV over land from GMI MW measurements.
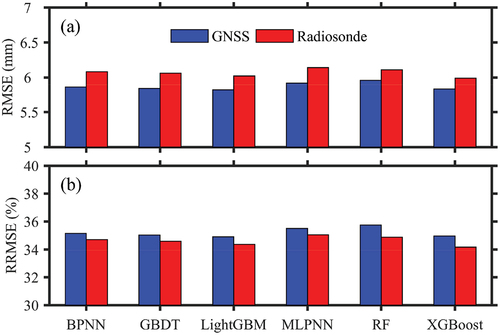
In terms of RMSE and RRMSE, the retrieval algorithm, developed with different machine learning approaches, exhibits an overall comparable performance in deriving TCWV from GMI-sensed MW measurements. When compared to GNSS TCWV, our LightGBM-based retrieval algorithm has the best performance, demonstrating the feasibility and practicality of the LightGBM-based retrieval approach in our research.
Comparison between our work against previous studies
While several retrieval models have been proposed to derive TCWV over land from satellite MW observations (Deeter Citation2007; Di Natale et al. Citation2019; Du, Kimball, and Jones Citation2015; Ji et al. Citation2017; Liu et al. Citation2020), no study has been reported to derive TCWV over land from GMI MW measurements. In our work, a new retrieval algorithm for GMI MW observations based on machine learning (i.e. LightGBM) is developed to derive TCWV estimates over land.
In previous work, several algorithms have been presented to retrieve TCWV over land from satellite-sensed MW observations at 18.7 GHz and 23.8 GHz, based on radiative transfer using surface emissivity (Deeter Citation2007; B. Du et al. Citation2020; Ji et al. Citation2017). The previously published MW TCWV estimates over land have an overall RMSE from 4 mm to 6 mm compared to ground-based reference TCWV estimates, with a correlation coefficient R2 between 0.72 and 0.90 (Deeter Citation2007; B. Du et al. Citation2020; Ji et al. Citation2017). In our research, the RMSE values between GMI TCWV with reference TCWV are 5–6 mm, with a correlation coefficient R2 between 0.77 and 0.87. In terms of RMSE and correlation coefficient, our machine learning-based retrieval model presents a performance comparable with previous retrieval methods, although we do not use radiative transfer model or surface emissivity data, both of which are usually utilized in previous studies (Deeter Citation2007; Di Natale et al. Citation2019; Du, Kimball, and Jones Citation2015; Ji et al. Citation2017; Liu et al. Citation2020).
Inter-comparison shows that the newly derived land-based MW TCWV data from the GMI instrument exhibit a comparable performance with the operational clear-sky near-infrared TCWV product of the MODIS sensor, i.e. similar R2, RMSE, and MB values (Xu and Liu Citation2023d; Zhu et al. Citation2021). Their performance is much better when compared to operational MODIS near-infrared water vapor measurements under cloudy sky conditions (Xu and Liu Citation2023d; Zhu et al. Citation2021).
Limitation and future work
Although the retrieval algorithm performs well in most regions worldwide, it still has a relatively poor performance (i.e. large RMSE) in some coastal areas as well as regions with few training stations. In our future research, an additional calibration procedure based on machine learning or conventional regression will be included in the current retrieval model to further enhance its worldwide performance of new GMI-based TCWV estimates at coastal regions as well as at regions with few training stations, as indicated in previous studies (Ji et al. Citation2017; Xu and Liu Citation2023c; Zhu et al. Citation2021).
In addition, the integration of additional variables like surface emissivity could improve the poor performance of the retrieval algorithm in coastal areas and regions with few training stations. The addition of optical remote sensing measurements or other data sources could also further improve the performance of the retrieval algorithm, as demonstrated in the previous research (Ji et al. Citation2017). The current verification of the retrieval approach is solely performed based on the data from 2017 to 2020. In future work, we will use data sets of extended periods to further validate the performance of our newly proposed TCWV retrieval approach.
Conclusion
In this article, we propose a novel retrieval algorithm to retrieve TCWV data over land from MW measurements of the GMI sensor based on a machine learning approach using spatial-temporal fields. Major findings are shown as follows:
The new GMI-derived TCWV data observations agree well with reference TCWV estimates from GNSS and radiosonde observations, with R2 = 0.76, RMSE = 5.82 mm, RRMSE = 34.91%, and MB = 0.02 mm compared with GNSS TCWV and R2 = 0.83, RMSE = 6.02 mm, RRMSE = 34.36%, and MB = −0.42 mm compared with radiosonde TCWV.
With the increase of TCWV values, the newly retrieved TCWV data exhibit a decreased retrieval performance, i.e. large RMSE at high TCWV. In terms of RRMSE, it decreases with the increasing TCWV values, namely small RRMSE at large TCWV. When TCWV is more than 50 mm, the newly derived TCWV data present the largest RMSE of 12.89 mm (12.66 mm) and the lowest RRMSE of 23.36% (21.72%) compared to GNSS (radiosonde) TCWV observations.
The retrieval algorithm presents a stable annual, monthly, and seasonal performance in deriving TCWV data from GMI MW measurements, with an annual RMSE between 5 mm and 6 mm, a monthly RRMSE between 4 mm and 8 mm, and a seasonal RMSE between 4 mm and 8 mm. The retrieval approach shows a relatively poor performance in wet months and seasons than in dry months and seasons.
The new GMI-retrieved TCWV data presented an overall good quality at most regions worldwide, apart from areas with large TCWV or areas with few training stations. The station-wise RMSE values of newly retrieved TCWV data are from 3 mm to 6 mm in most GNSS and radiosonde stations, with the station-wise RRMSE values between 20% and 40%.
The retrieval model, developed without the use of radiative transfer and surface emissivity, has an overall RMSE of 4 mm to 6 mm, comparable to the performance of previous retrieval methods developed based on radiative transfer and surface emissivity. The accuracy of new GMI-derived TCWV data records in terms of RMSE is also comparable to that of operational clear-sky near-infrared TCWV observations, such as the operational MODIS near-infrared TCWV product.
Acknowledgments
This study was supported by the Research Grants Council of the Hong Kong Special Administrative Region, China under Project PolyU/RGC 15221620/B-Q80Q, 15205821/B-Q84W, and 15212622/B-Q94L. The authors would like to thank the three anonymous reviewers and the editorial team for their precious time and invaluable comments that help improve the quality of this manuscript. The authors would also like to thank the Goddard Earth Sciences (GES) Data and Information Services Center (DISC) for providing GMI data. The ground-based observations, collected from the Nevada Geodetic Laboratory and Integrated Global Radiosonde Archive Version 2, are also acknowledged.
Disclosure statement
No potential conflict of interest was reported by the author(s).
Data availability statement
The GMI data that are utilized in this study are openly and freely available at Goddard Earth Sciences (GES) Data and Information Services Center (DISC) (https://disc.gsfc.nasa.gov/). The GNSS water vapor data are openly and freely available at http://geodesy.unr.edu/gps_timeseries/trop/. The radiosonde data can be accessed through https://www1.ncdc.noaa.gov/pub/data/igra/derived/derived-por/.
Additional information
Funding
References
- Bevis, M., S. Businger, S. Chiswell, T. A. Herring, R. A. Anthes, C. Rocken, and R. H. Ware. 1994. “Gps Meteorology - Mapping Zenith Wet Delays Onto Precipitable Water.” Journal of Applied Meteorology 33 (3): 379–21. https://doi.org/10.1175/1520-0450(1994)033<0379:GMMZWD>2.0.CO;2.
- Bevis, M., S. Businger, T. A. Herring, C. Rocken, R. A. Anthes, and R. H. Ware. 1992. “GPS Meteorology: Remote Sensing of Atmospheric Water Vapor Using the Global Positioning System.” Journal of Geophysical Research Atmospheres 97 (D14): 15787–15801. https://doi.org/10.1029/92JD01517.
- Blewitt, G., W. C. Hammond, and C. Kreemer. 2018. “Harnessing the GPS Data Explosion for Interdisciplinary Science.” Eos 99 (10.1029): 485. https://doi.org/10.1029/2018EO104623.
- Bolton, D. 1980. “The Computation of Equivalent Potential Temperature.” Monthly Weather Review 108 (7): 1046–1053. https://doi.org/10.1175/1520-0493(1980)108<1046:TCOEPT>2.0.CO;2.
- Borger, C., S. Beirle, S. Dörner, H. Sihler, and T. Wagner. 2020. “Total Column Water Vapour Retrieval from S-5P/TROPOMI in the Visible Blue Spectral Range.” Atmospheric Measurement Techniques 13 (5): 2751–2783. https://doi.org/10.5194/amt-13-2751-2020.
- Cess, R. D. 2005. “Water Vapor Feedback in Climate Models.” Science 310 (5749): 795–796. https://doi.org/10.1126/science.1119258.
- Deeter, M. N. 2007. “A New Satellite Retrieval Method for Precipitable Water Vapor Over Land and Ocean.” Geophysical Research Letters 34 (2). https://doi.org/10.1029/2006GL028019.
- Di Natale, G., S. Del Bianco, U. Cortesi, M. Gai, G. Macelloni, F. Montomoli, L. Rovai, et al. 2019. “Implementation and Validation of a Retrieval Algorithm for Profiling of Water Vapor from Differential Attenuation Measurements at Microwaves.” IEEE Transactions on Geoscience & Remote Sensing 57 (8): 5939–5948. https://doi.org/10.1109/TGRS.2019.2903468.
- Draper, D. W., D. A. Newell, F. J. Wentz, S. Krimchansky, and G. M. Skofronick-Jackson. 2015. “The Global Precipitation Measurement (GPM) Microwave Imager (GMI): Instrument Overview and Early On-Orbit Performance.” IEEE Journal of Selected Topics in Applied Earth Observations & Remote Sensing 8 (7): 3452–3462. https://doi.org/10.1109/JSTARS.2015.2403303.
- Du, B., D. Ji, J. Shi, Y. Wang, T. Lei, P. Zhang, H. Letu, et al. 2020. “The Retrieval of Total Precipitable Water Over Global Land Based on FY-3D/MWRI Data.” Remote Sensing 12 (9): 1508. https://doi.org/10.3390/rs12091508.
- Du, J., J. S. Kimball, and L. A. Jones. 2015. “Satellite Microwave Retrieval of Total Precipitable Water Vapor and Surface Air Temperature Over Land from AMSR2.” IEEE Transactions on Geoscience & Remote Sensing 53 (5): 2520–2531. https://doi.org/10.1109/TGRS.2014.2361344.
- du Piesanie, A., A. J. M. Piters, I. Aben, H. Schrijver, P. Wang, and S. Noël. 2013. “Validation of Two Independent Retrievals of SCIAMACHY Water Vapour Columns Using Radiosonde Data.” Atmospheric Measurement Techniques 6 (10): 2925–2940. https://doi.org/10.5194/amt-6-2925-2013.
- Durre, I., Y. Xungang, R. S. Vose, S. Applequist, and J. Arnfield. 2016. “Integrated Global Radiosonde Archive (IGRA) Version 2.” NOAA National Centers for Environmental Information. https://doi.org/10.7289/V5X63K0Q.
- ”GES DISC Dataset: GPM GMI Common Calibrated Brightness Temperatures Collocated L1C 1.5 Hours 13 Km V07 (GPM_1CGPMGMI 07).” Accessed: June 20, 2023. [Online]. Available: https://disc.gsfc.nasa.gov/datasets/GPM_1CGPMGMI_07/summary.
- He, J., and Z. Liu. 2020. “Water Vapor Retrieval from MODIS NIR Channels Using Ground-Based GPS Data.” IEEE Transactions on Geoscience & Remote Sensing 58 (5): 3726–3737. https://doi.org/10.1109/TGRS.2019.2962057.
- Ji, D., J. Shi, C. Xiong, T. Wang, and Y. Zhang. 2017. “A Total Precipitable Water Retrieval Method Over Land Using the Combination of Passive Microwave and Optical Remote Sensing.” Remote Sensing of Environment 191:313–327. https://doi.org/10.1016/j.rse.2017.01.028.
- Kaufman, Y. J., and B.-C. Gao. 1992. “Remote Sensing of Water Vapor in the Near IR from EOS/MODIS.” IEEE Transactions on Geoscience and Remote Sensing: A Publication of the IEEE Geoscience and Remote Sensing Society 30 (5): 871–884. https://doi.org/10.1109/36.175321.
- Ke, G., Q. Meng, T. Finley, T. Wang, W. Chen, W. Ma, Q. Ye and T.Y. Liu. 2017. “LightGBM: A Highly Efficient Gradient Boosting Decision Tree.” In Advances in Neural Information Processing Systems 30 (Nips 2017), edited by I. Guyon, U. V. Luxburg, S. Bengio, H. Wallach, R. Fergus, S. Vishwanathan, and R. Garnett. La Jolla: Neural Information Processing Systems (nips). Accessed: May 14, 2022. [Online]. Available: https://www.webofscience.com/wos/woscc/full-record/WOS:000452649403021.
- Liu, H., H. Li, S. Tang, M. Duan, S. Zhang, X. Deng, J. Hu. 2020. “A Physical Algorithm for Precipitable Water Vapour Retrieval Over Land Using Passive Microwave Observations.” International Journal of Remote Sensing 41 (16): 6288–6306. https://doi.org/10.1080/01431161.2020.1737337.
- Liu, Z., M. S. Wong, J. Nichol, and P. W. Chan. 2013. “A Multi-Sensor Study of Water Vapour from Radiosonde, MODIS and AERONET: A Case Study of Hong Kong.” International Journal of Climatology 33 (1): 109–120. https://doi.org/10.1002/joc.3412.
- Ma, X., Y. Yao, B. Zhang, Y. Qin, Q. Zhang, and H. Zhu. 2022. “An Improved MODIS NIR PWV Retrieval Algorithm Based on an Artificial Neural Network Considering the Land-Cover Types.” IEEE Transactions on Geoscience & Remote Sensing 60:1–12. https://doi.org/10.1109/TGRS.2022.3170078.
- Manandhar, S., S. Dev, Y. H. Lee, Y. S. Meng, and S. Winkler. 2019. “A Data-Driven Approach for Accurate Rainfall Prediction.” IEEE Transactions on Geoscience & Remote Sensing 57 (11): 9323–9331. https://doi.org/10.1109/TGRS.2019.2926110.
- Milani, L., and C. Kidd. 2023. “The State of Precipitation Measurements at Mid-To-High Latitudes.” Atmosphere 14 (11): 1677. https://doi.org/10.3390/atmos14111677.
- Orusa, T., R. Orusa, A. Viani, E. Carella, and E. Borgogno Mondino. 2020. “Geomatics and EO Data to Support Wildlife Diseases Assessment at Landscape Level: A Pilot Experience to Map Infectious Keratoconjunctivitis in Chamois and Phenological Trends in Aosta Valley (NW Italy).” Remote Sensing 12 (21): 3542. https://doi.org/10.3390/rs12213542.
- Orusa, T., A. Viani, and E. Borgogno-Mondino. 2024. “Earth Observation Data and Geospatial Deep Learning AI to Assign Contributions to European Municipalities Sen4MUN: An Empirical Application in Aosta Valley (NW Italy).” The Land 13 (1): 80. https://doi.org/10.3390/land13010080.
- Orusa, T., A. Viani, D. Cammareri, and E. Borgogno Mondino. 2023. “A Google Earth Engine Algorithm to Map Phenological Metrics in Mountain Areas Worldwide with Landsat Collection and Sentinel-2.” Geomatics 3 (1): 221–238. https://doi.org/10.3390/geomatics3010012.
- Orusa, T., A. Viani, B. Moyo, D. Cammareri, and E. Borgogno-Mondino. 2023. “Risk Assessment of Rising Temperatures Using Landsat 4–9 LST Time Series and Meta® Population Dataset: An Application in Aosta Valley, NW Italy.” Remote Sensing 15 (9): 2348–2349. https://doi.org/10.3390/rs15092348.
- Rohm, W., J. Guzikowski, K. Wilgan, and M. Kryza. 2019. “4DVAR Assimilation of GNSS Zenith Path Delays and Precipitable Water into a Numerical Weather Prediction Model WRF.” Atmospheric Measurement Techniques 12 (1): 345–361. https://doi.org/10.5194/amt-12-345-2019.
- Seemann, S. W., J. Li, W. P. Menzel, and L. E. Gumley. 2003. “Operational Retrieval of Atmospheric Temperature, Moisture, and Ozone from MODIS Infrared Radiances.” Journal Applied Meteorology Climatology 42 (8): 1072–1091. https://doi.org/10.1175/1520-0450(2003)042<1072:OROATM>2.0.CO;2.
- Sensing Systems, R., and T. Meissner. 2012. “GMI Calibration Algorithm and Analysis Theoretical Basis Document.” Remote Sensing Systems, Apr. https://doi.org/10.56236/RSS-au.
- Shen, Z., B. Yong, L. Yi, H. Wu, and H. Xu. 2022. “From TRMM to GPM, How Do Improvements of Post/near-Real-Time Satellite Precipitation Estimates Manifest?” Atmospheric Research 268:106029. https://doi.org/10.1016/j.atmosres.2022.106029.
- Sherwood, S. C., R. Roca, T. M. Weckwerth, and N. G. Andronova. 2010. “Tropospheric Water Vapor, Convection, and Climate.” Reviews of Geophysics 48 (2). https://doi.org/10.1029/2009RG000301.
- Skofronick-Jackson, G., D. Kirschbaum, W. Petersen, G. Huffman, C. Kidd, E. Stocker and R. Kakar. 2018. “The Global Precipitation Measurement (GPM) mission’s Scientific Achievements and Societal Contributions: Reviewing Four Years of Advanced Rain and Snow Observations.” Quarterly Journal of the Royal Meteorological Society 144 (S1): 27–48. https://doi.org/10.1002/qj.3313.
- Trenberth, K. E., J. Fasullo, and L. Smith. 2005. “Trends and Variability in Column-Integrated Atmospheric Water Vapor.” Climate Dynamics 24 (7–8): 741–758. https://doi.org/10.1007/s00382-005-0017-4.
- Vaquero-Martínez, J., M. Antón, J. P. Ortiz de Galisteo, V. E. Cachorro, P. Álvarez-Zapatero, R. Román, D. Loyola, et al. 2018. “Inter-Comparison of Integrated Water Vapor from Satellite Instruments Using Reference GPS Data at the Iberian Peninsula.” Remote Sensing of Environment 204:729–740. https://doi.org/10.1016/j.rse.2017.09.028.
- Vaquero-Martínez, J., M. Antón, J. P. Ortiz de Galisteo, R. Román, V. E. Cachorro, and D. Mateos. 2019. “Comparison of Integrated Water Vapor from GNSS and Radiosounding at Four GRUAN Stations.” Science of the Total Environment 648:1639–1648. https://doi.org/10.1016/j.scitotenv.2018.08.192.
- Viani, A., T. Orusa, E. Borgogno-Mondino, and R. Orusa. 2023. “Snow Metrics as Proxy to Assess Sarcoptic Mange in Wild Boar: Preliminary Results in Aosta Valley (Italy).” Life 13 (4): Art. no. 4. https://doi.org/10.3390/life13040987.
- Wang, H., X. Liu, K. Chance, G. González Abad, and C. Chan Miller. 2014. “Water vapor retrieval from OMI visible spectra.” Atmospheric Measurement Techniques 7 (6): 1901–1913. https://doi.org/10.5194/amt-7-1901-2014.
- Wang, J., and L. Zhang. 2008. “Systematic Errors in Global Radiosonde Precipitable Water Data from Comparisons with Ground-Based GPS Measurements.” Journal of Climate 21 (10): 2218–2238. https://doi.org/10.1175/2007JCLI1944.1.
- Wang, S., T. Xu, W. Nie, C. Jiang, Y. Yang, Z. Fang, M. Li, and Z. Zhang. 2020. “Evaluation of Precipitable Water Vapor from Five Reanalysis Products with Ground-Based GNSS Observations.” Remote Sensing 12 (11): 1817. https://doi.org/10.3390/rs12111817.
- Xu, J., and Z. Liu. 2021. “Radiance-Based Retrieval of Total Water Vapor Content from Sentinel-3A OLCI NIR Channels Using Ground-Based GPS Measurements.” International Journal of Applied Earth Observation and Geoinformation 104:102586. https://doi.org/10.1016/j.jag.2021.102586.
- Xu, J., and Z. Liu. 2022a. “A Back Propagation Neural Network-Based Algorithm for Retrieving All-Weather Precipitable Water Vapor from MODIS NIR Measurements.” IEEE Transactions on Geoscience & Remote Sensing 60:1–14. https://doi.org/10.1109/TGRS.2022.3219405.
- Xu, J., and Z. Liu. 2022b. “Enhanced All-Weather Precipitable Water Vapor Retrieval from MODIS Near-Infrared Bands Using Machine Learning.” International Journal of Applied Earth Observation and Geoinformation 114:103050. https://doi.org/10.1016/j.jag.2022.103050.
- Xu, J., and Z. Liu. 2022c. “Evaluation of Precipitable Water Vapor Product from MODIS and MERSI-II NIR Channels Using Ground- Based GPS Measurements Over Australia.” IEEE Journal of Selected Topics in Applied Earth Observations & Remote Sensing 15:8744–8758. https://doi.org/10.1109/JSTARS.2022.3211879.
- Xu, J., and Z. Liu. 2022d. “The First Validation of Sentinel-3 OLCI Integrated Water Vapor Products Using Reference GPS Data in Mainland China.” IEEE Transactions on Geoscience & Remote Sensing 60:1–17. https://doi.org/10.1109/TGRS.2021.3099168.
- Xu, J., and Z. Liu. 2023a. “A Back Propagation Neural Network-Based Calibration Approach for Sentinel-3 OLCI Near-Infrared Water Vapor Product.” IEEE Geoscience & Remote Sensing Letters 20:1–5. https://doi.org/10.1109/LGRS.2023.3235983.
- Xu, J., and Z. Liu. 2023b. “A Gradient Boosting Decision Tree Based Correction Model for AIRS Infrared Water Vapor Product.” Geophysical Research Letters 50 (14): e2023GL104072. https://doi.org/10.1029/2023GL104072.
- Xu, J., and Z. Liu. 2023c. “Improving the Accuracy of MODIS Near-Infrared Water Vapor Product Under All Weather Conditions Based on Machine Learning Considering Multiple Dependence Parameters.” IEEE Transactions on Geoscience & Remote Sensing 61:1–15. https://doi.org/10.1109/TGRS.2023.3252024.
- Xu, J., and Z. Liu. 2023d. “Water Vapour Products from ERA5, MERSI-II/FY-3D, Olci/sentinel-3A, Olci/sentinel-3B, MODIS/Aqua and MODIS/Terra in Australia: A Comparison Against in situ GPS Water Vapour Data.” Quarterly Journal of the Royal Meteorological Society 149 (753): 1435–1458. https://doi.org/10.1002/qj.4467.
- You, Q., Z. Cai, N. Pepin, D. Chen, B. Ahrens, Z. Jiang, F. Wu, et al. 2021. “Warming Amplification Over the Arctic Pole and Third Pole: Trends, Mechanisms and Consequences.” Earth-Science Reviews 217:103625. https://doi.org/10.1016/j.earscirev.2021.103625.
- Zhang, Y., C. Cai, B. Chen, and W. Dai. 2019. “Consistency Evaluation of Precipitable Water Vapor Derived from ERA5, ERA-Interim, GNSS, and Radiosondes Over China.” Radio Science 54 (7): 561–571. https://doi.org/10.1029/2018RS006789.
- Zhu, D., K. Zhang, L. Yang, S. Wu, and L. Li. 2021. “Evaluation and Calibration of MODIS Near-Infrared Precipitable Water Vapor Over China Using GNSS Observations and ERA-5 Reanalysis Dataset.” Remote Sensing 13 (14): 2761. https://doi.org/10.3390/rs13142761.