
ABSTRACT
The composition and variations of sugars, organic acids and phenolic compounds of red and black currant fruits and leaves were studied during the last four weeks of ripening. The results showed that sugar content increased during berry ripening in both species. In comparison, organic acids decreased in red currant, whereas no differences between sampling dates were observed in black currant. Forty-seven individual phenolic compounds, belonging to anthocyanins, flavonols, flavanols, hydroxycinnamic acid derivatives and flavanones were identified in red currant fruits and 52 in black currant fruits by HPLC-MS analysis. In black currant fruits, the major phenolic compounds were anthocyanins (81.51–85.15% of total phenolics), which increased during ripening until the last sampling date. In both red and black currant leaves, 47 phenolic compounds were identified. The content of phenolic compounds in red currant leaves was 1.31-fold to 1.90-fold higher compared to the content in black currant leaves. The most abundant phenolics in both currant leaves were flavonol glycosides, accounting for 58.5–67.9% of total phenolics, and their content was the highest at the end of berry ripening.
Introduction
Red and black currants belong to the Grossularia L. family, which includes more than 150 different species (Hummer and Dale, Citation2010). They are commonly found in home gardens, whereas commercial cultivation is concentrated in the northern part of Europe (Ersoy et al., Citation2018; Yang et al., Citation2013; Ziobroń et al., Citation2021). Currants can be eaten fresh or processed into juices, jams, jellies and syrups (Hummer and Dale, Citation2010; Ziobroń et al., Citation2021). Currants are a good source of bioactive and health-promoting substances (Berk et al., Citation2020; Karjalainen et al., Citation2009; Mikulic-Petkovsek et al., Citation2016; Zorenc et al., Citation2017), which are higher in black currant (Aneta et al., Citation2013; Gavrilova et al., Citation2011; Määttä et al., Citation2001; Mikulic-Petkovsek et al., Citation2015) than in red currant.
Phenolic compounds are among the most significant biochemicals; they derived from primary metabolites via the activity of phenylalanine ammonia lyase (PAL), which catalyses the conversion of phenylalanine to trans-cinnamic acid (Saltveit, Citation2017). Currants have been reported to contain representatives of hydroxybenzoic (HBA) and hydroxycinnamic acids (HCA), flavanols (FLA), flavonols (FLO), anthocyanins (ANT) and proanthocyanidins (Määttä et al., Citation2001; Vagiri et al., Citation2012) with an especially high content of catechin, rutin and gallic acid (Ersoy et al., Citation2018). Currant leaves are much richer in phenolics than currant berries (Paunović et al., Citation2017; Tabart et al., Citation2011; Vagiri et al., Citation2012; Ziobroń et al., Citation2021) and are more interesting from an industrial point of view as they are a high source of biochemicals (Allai et al., Citation2020). As reported by Tabart et al. (Citation2006), total phenolic content in black currant leaves is five times higher than in fruits or other parts of black currant. Among the most present phenolics in currant leaves are derivatives of quercetin, myricetin, rutin, catechin and phenolic acids (Vagiri et al., Citation2012; Ziobroń et al., Citation2021).
Many morphological and biochemical changes, which greatly affect fruit taste of red and black currants, occur during ripening (Berk et al., Citation2020; Mikulic-Petkovsek et al., Citation2015; Zorenc et al., Citation2017). At the level of the phenolic profile of red currant fruits, HCA, FLA and FLO decrease during ripening, on the other hand, ANT increases (Zorenc et al., Citation2017). For HCA and ANT, a similar trend was also detected in the red currant of the “Jonkheer van Tets,” “Junifer” and “Rovanda” cultivars (Mikulic-Petkovsek et al., Citation2015). Berk et al. (Citation2020) determined that 12 individual phenolics in red currant fruit, including vanillic acid, ferulic acid, rutin, phloridzin, and quercetin, increased with ripening. In contrast, HCAs, FLAs and ANT increased in black currant fruit (Mikulic-Petkovsek et al., Citation2015), which consequently brings about a significant increase in total phenolics on final harvest dates (Krüger et al., Citation2011). However, no information is available on seasonal changes in the phenolic content of currant leaves. In general, phenolic compound content was lower in the leaves harvested at the beginning of blackcurrant ripening (June) compared to those harvested in August, except for some individual phenolics, such as neochlorogenic acid and kaempferol rutinoside (Vagiri et al., Citation2015). During ripening, the ratio between primary metabolites in currant fruit is also of great importance (Berk et al., Citation2020; Mikulic-Petkovsek et al., Citation2015; Zorenc et al., Citation2017). Toldam-Andersen and Hansen (Citation1997) reported that black currant fruit malic acid increased until the beginning of ripening, but it decreased until the end of the harvest. The opposite occurred to citric acid, which continued to increase during ripening. At the same time, sugars began to accumulate, especially glucose and fructose. Mikulic-Petkovsek et al. (Citation2015) similarly reported that all individual sugars increased during ripening, while all organic acids decreased until the end of the harvest in both red and black currants.
The composition and changes of primary and secondary metabolites in fruits of different currant species during ripening have been studied before, however, there is a lack of knowledge about what occurs in currant leaves during the last month of ripening. What is more, no evidence on whether there is a correlation between the accumulation of phenolics in red and black currant leaves and fruits has been obtained. The aim of this study is, therefore, to contribute to a better understanding of the biochemical processes in fruits and leaves of red and black currants during the last month of ripening.
Materials and Methods
Plant Material and Sampling
The experiment was conducted in the experimental plantation of the Biotechnical Faculty in Ljubljana (latitude: 46°05′ N, longitude: 14°47′ E, altitude: 295 m) on eight red currant bushes of the variety “Jonkheer van Tets” and on four black currant bushes of the variety “Titania.” Fruits and leaves of both species were sampled on four sampling dates during the last month of fruit ripening (2018-08-06 to 2018-07-04) in seven-day intervals.
For phenolic compounds, sugar and organic acid analysis, 16 ripe clusters were sampled from eight red currant bushes and eight ripe clusters from four black currant bushes. Color measurements were performed on the same fruits, with a portable colorimeter (CR-200 b Chroma; Minolta, Osaka, Japan). For the analysis of phenolic compounds in leaves, 16 leaf samples were coincidentally collected from eight red currant bushes (six leaves for two samples per bush) and eight leaf samples from four black currant bushes (six leaves for two samples per bush) on each sampling date. The sampled leaves were fully developed, of similar color and size, and sampled at approximately the same height of the bush. One leaf per bush was taken from the east side of the bush and one from the west side.
Chemicals
For the determination of primary metabolites in red and black currant fruit sucrose, fructose and glucose, citric, malic, and tartaric acid standards from Fluka Chemie (Buchs, Switzerland) were used. For the determination of phenolics the following standards were used: cyanidin-3-glucoside, peonidin-3-glucoside, delphinidin-3-glucoside, pelargonidin-3-glucoside for ANT quantification, chlorogenic acid, caffeic acid, p-coumaric acid for HCA quantification, procyanidin B1, catechin and epicatechin for FLA quantification, quercetin-3-galactoside, quercetin-3-glucoside, quercetin-3-rutinoside, quercetin-3-xyloside, quercetin-3-rhamnoside, quercetin-3-arabinopyranoside, kaempferol-3-glucoside, myricetin rhamnoside, isorhamnetin-3-glucoside for FLO quantification and naringenin for FLN quantification. All the standards used for the phenolic compounds analysis were obtained from Fluka Chemie or Sigma-Aldrich (St. Louis, MO, USA).
Phenolic compounds in red and black currant fruit and leaves were extracted with the extraction solution of 80% methanol from Sigma-Aldrich and 3% formic acid from Fluka Chemie.
The mobile phases for a combined analysis of phenolic compounds by HPLC-MS consisted of a mixture of mobile phases A (97% acetonitrile + .1% formic acid) and B (3% acetonitrile + .1% formic acid), obtained from Sigma Aldrich. The mobile phase for organic acids was 4 mM sulfuric acid, obtained by Sigma Aldrich. Water was double distilled and purified with a Milli-Q system (Millipore, Bedford, MA, USA).
Analysis of Sugar and Organic Acid Content with an HPLC System
The analysis of sugar and organic acid content was made merely for red and black currant fruits. Approximately 2 g of red currant berries were finely chopped and poured with 9 mL of bi-distilled water. A similar procedure was performed on black currant fruit, except that the weight of the plant material was approximately 4 g and the volume of bi-distilled water was 20 mL. The samples from both species were stirred continuously for half an hour at room temperature. The samples were then centrifuged at 8.000 rpm for 7 min at 10°C (Eppendorf Centrifuge 5819 R, Hamburg, Germany) and filtered through cellulose ester filters (.20 µm; Macherey-Nagel, Düren, Germany) into glass vials, and the extracts were analyzed using an HPLC system (Thermo Scientific, San Jose, CA, USA). The HPLC conditions for the analysis of sugars and organic acid content were the same as described by Gačnik et al. (Citation2021). Detection of sugars was performed with a refractive index (RI) detector, and for organic acids a UV detector, set at 210 nm, was used. For both analyses, the total run time was 30 min. Identification of sugars (fructose, sucrose, glucose) and organic acids (citric, malic, tartaric acid) present in currants was performed using external standards. The results were then calculated and expressed as g of sugar or organic acid per kg fresh weight (FW).
Phenolic Compound HPLC-MS Analysis
For the extraction of phenolic compounds in red and black currant fruit, approximately 2 g of currant berries were finely chopped and 7 mL of extraction solution (80% methanol and 3% formic acid) was added. Phenolics from currant leaves were extracted with the same solution except that the weight of the plant material and the volume of the extraction solution were adjusted (.15 g and 5 mL). The samples were transferred to a cooled ultrasonic bath, where the phenolic compounds were extracted for 45 minutes. The samples were then centrifuged at 10,000 rpm for 5 minutes at 4°C using an Eppendorf Centrifuge 5810 R and filtered into vials using a .20 µm Chromafil AO-20/25 polyamide (Macherey-Nagel) filter.
Quantification of individual phenolics was performed by HPLC as described in Gačnik et al. (Citation2021). Identification of phenolic compounds was performed using an LTQ XLTM Linear Ion Trap Mass Spectrometer (Thermo Scientific) with electrospray ionization (scanning from m/z 115–1500; operating in negative mode to identify all phenolic groups except ANT in positive mode) and a diode array detector (DAD) set to three different wavelengths: 280 nm for HCA and FLA, 350 nm for FLO, HCA and FLN and 530 nm for ANT. The column used was a Gemini C18 (150 × 4.6 mm, 3 μm) from Phenomenex (Torrance, USA) set at 25°C.
Content calculation of each phenolic compound in red and black currant fruits and leaves was performed using calibration curves of external standards and peak areas of the corresponding phenolic compound. The results were expressed as mg kg−1 FW of currant fruit and leaves.
Statistical Analysis
R-commander statistical software (R Formation for Statistical Computing, Auckland, New Zealand) was used to analyze the data. The differences in each analyzed compound between different sampling dates in currant fruits and leaves were examined with a one-way analysis of variance (ANOVA), using a Duncan’s test. All tests were performed with 95% confidence.
Results and Discussion
Changes in Sugars, Organic Acids and Phenolic Compounds During Ripening and Correlations Among Them in Red and Black Currant Fruit
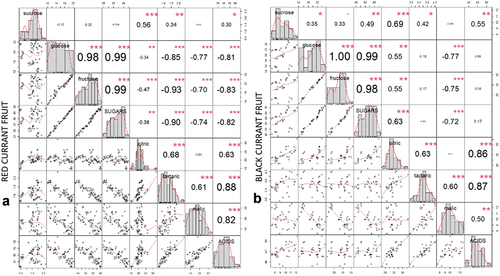
The change in the ratio of sugars and organic acids is one of the key indicators of red and black currant ripening and has a great influence on taste and consumer acceptance (Gao et al., Citation2018). The composition of sugars and organic acids () did not differ significantly between red and black currant. Sugars accumulated during ripening in both species () from 30.1 ± 1.10 (T1) to 45.12 ± .72 (T4) g kg−1 FW in red currant fruit (Table S1) and from 47.38 ± .60 (T1) to 67.78 ± .73 (T4) g kg−1FW in black currant fruit (Table S2), on the other hand, organic acids in red currant fruit decreased during ripening () from 45.11 ± .51 (T1) to 36.99 ± .96 (T4) g kg−1FW (Table S1). Similar findings were reported by Zorenc et al. (Citation2017), who analyzed sugar and organic acid content during advanced ripening in different colored red currant fruit cultivars. Furthermore, in black currant, no differences in organic acid content were observed between samplings (; Table S2). In red currant, total sugars were strongly negatively correlated with total organic acids (R = − .82; p < .05; ), while in black currant () no correlation was found between total primary metabolites (p > .05). Among individual sugars, glucose and fructose () were the most abundant in both currants, while sucrose content was not substantially lower in blackcurrant, which is consistent with the findings by Mikulic-Petkovsek et al. (Citation2015), Zorenc et al. (Citation2017) and Milivojevic et al. (Citation2009). In red currant, sucrose accounted for 2.88–6.08%, glucose for 40.53–43.13%, and fructose for 51.71–53.99% of total sugars (). In black currant, the proportion of sucrose was higher (13.76–19.28%), while the proportion of glucose was lower (32.67–35.51%), compared to the proportions in red currant fruit. What is more, fructose accounted for 48.05–50.73% of total sugars in black currant fruit (). In red currant fruit () citric (45.95–57.56% of total organic acids) and malic acids (39.93–50.54% total organic acids) were the most abundant and decreased during ripening, whereas in black currant fruit citric acid (65.98–73.07% of total organic acids) was the most abundant and it increased during ripening (). Glucose was strongly negatively correlated (p < .05; ) with malic acid in both species and with tartaric acid in red currant fruit. Fructose was significantly negatively correlated (p < .001) with malic acid content only in black currant fruit. The sugars/organic acid (S/A) ratio, the most important index for assessing fruit quality, especially flavor and fruit ripeness (Zhang et al., Citation2021), increased during ripening in both species ().
Figure 1. Content of primary metabolites (PM) and sugar/acids ratio (S/A) in black currant fruit (A) and red currant fruit (F), heatmaps of individual primary metabolites in black currant fruit (B) and red currant fruit (G), heatmaps of main phenolic groups analyzed in black currant fruit (C) and red currant fruit (H) with exposing individual representatives of anthocyanins (ANT) for black currant fruit (D) and red currant fruit (I) and content of total analyzed phenolics (TAP) for black currant fruit (E) and red currant fruit (J). Different coloring in heatmaps indicates a different content of phenolic compounds – a lower color intensity determines a lower content of a certain primary metabolites (g kg−1 FW), phenolic compound (mg kg−1 FW) or the phenolic group (mg kg−1 FW). Abbreviations: FLA – flavanols, HCA – hydroxycinnamic acids, FLO – flavonols, FLN – flavanones, cy-3-glu: cyanidin-3-glucoside, cy-3-rut: cyanidin-3-rutinoside, peo-3-rut: peonidin-3-rutinoside, delph-3-(6ʺ-com)-glu: delphinidin-3-(6ʺ-coumaroyl)-glucoside, cy-3-(6ʺ-com)-glu: cyanidin-3-(6ʺ-comaroyl)-glucoside, delph-3-rut: delphinidin-3-rutinoside, delph-3-glu: delphinidin-3-glucoside, pel-3-rut: pelargonidin-3-rutinoside, delph-3-xyl: delphinidin-3-xyloside; cy-3-sambubioside: cyanidin-3-sambubioside, cy-3-sophoroside: cyanidin-3-sophoroside, cy-3-xylosyl rut: cyanidin-3-xylosyl rutinoside, cy-3-O-(2-glucosyl rut): cyanidin-3-O-(2-glycosyl rutinoside); T1 – T4 denote sampling dates during fruit ripening; letters a-d indicate a significant difference between sampling dates obtained by Duncan’s test at the .05 level of significance.
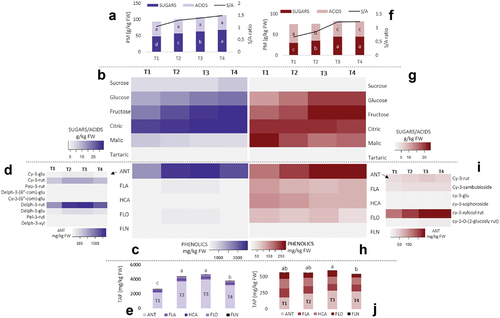
Figure 2. Correlation matrix of correlation tests between primary metabolites in red currant fruit (A) and black currant fruit (B). The values are R-values (Pearson’s correlation coefficient) for the correlation tests between the variables corresponding to x-axis and y-axis. The stars top-right to the R-values indicate the significance of the correlation: *** indicates p < .001, ** indicates p < .01, and * indicates p < .05. The midline histograms show the distribution of each set of data. The bottom-left scatterplots show correlation between the variables corresponding to the x-axis and y-axis.
Forty-seven phenolic compounds, belonging to the phenolic groups ANT, FLA, HCA, FLO and FLN (, Tables S3-S4) were analyzed by HPLC-MS in red currant fruit and 52 in black currant fruit. Other authors also reported HBA representatives (Määttä et al., Citation2001; Vagiri et al., Citation2012), but they were not identified in the fruits of the cultivars “Titania” (black currant) and “Jonkheer van Tets” (red currant). In black currant fruit, ANT () was by far the most abundant phenolic compound (81.51–85.15% TAP) and it was increasing during ripening until the last sample date (T4), which is partially consistent with the results of Mikulic-Petkovsek et al. (Citation2015) and Zorenc et al. (Citation2017). Furthermore, ANT content () detected in black currant was from 11.8 to 15.8-fold higher than in red currants. In black currant fruit (), the most abundant ANT was delphinidin-3-rutinoside (51.88–55.89% ANT), followed by cyanidin-3-rutinoside (23.10–23.62% ANT), with similar behavior observed for the total ANT content throughout ripening. Total phenolic content (TAP) in black currant fruit () was increasing until the last sampling date (T4) and then decreased on the last sampling date. Rawat et al. (Citation2023) monitored the synthesis of ANT from green berries to ripened dark brown berries in Mahonia nepalensis fruits, which increased as ripening proceeded, with markedly increased synthesis in the last month of ripening.
In red currant (), the difference in the content between ANT and other phenolic groups was not so evident. In red currant fruit (), cyanidin-3-xylosylrutinoside (65.68–67.18% ANT) and cyanidin-3-rutinoside (17.11–18.94% ANT) were the most abundant representatives of ANT. The trend of other phenolic groups in red currant fruit was not clear, except for HCA, which decreased during ripening (from 145.42 ± 3.72 (T1) to 107.38 ± 4.49 mg kg−1 FW (T4)). The total phenolic content (TAP) of red currant fruit did not undergo any changes during ripening (). All the samplings in this research were carried out on fully ripened fruits, since currants are characterized by successive ripening (Mikulic-Petkovsek et al., Citation2015). However, a seasonally longer sampling study was also carried out on various berry fruits (Belwal et al., Citation2019), where a decreasing trend of TAP content was shown to stabilize at the end of ripening, which confirms our results for the last month of ripening.
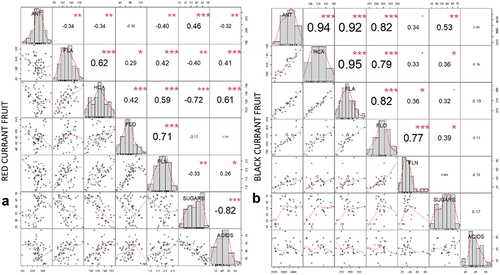
Primary metabolites and phenolic components are interrelated, which is well established in case of sugars, which are the substrate for the synthesis of ANTs. Organic acids are also potential stimulators for the synthesis of ANTs (Ban et al., Citation2009; Noro et al., Citation1989). Amongst the main metabolic groups quantified with an HPLC/MS analysis in red and black currant fruit, a correlation analysis was performed () to verify the interactions between the main primary metabolites and phenolic compounds analyzed, which showed divergent results depending on the current species. In black currant fruit () ANT, HCA, FLA and FLO were strongly correlated with each other, while FLN was positively correlated only with FLO (R = .77). In comparison, in red currant fruit, a positive correlation (R = .62) existed only between FLA and HCA content, while FLN was moderately correlated with FLO and HCA (). Sugar content had a weaker positive correlation with ANT content in both species (red: R = .46; black: R = .53).
Figure 3. Correlation matrix of correlation tests between main analyzed metabolites (ANT – anthocyanins, FLA – flavanols, HCA – hydroxycinnamic acids, FLO – flavonols, FLN – flavanones, sugars and organic acids) in red currant fruit (A) and black currant fruit (B). The values are R-values (Pearson’s correlation coefficient) for the correlation tests between the variables corresponding to x-axis and y-axis. The stars top-right to the r-values indicate the significance of the correlation: *** indicates p < .001, ** indicates p < .01, and * indicates p < .05. The midline histograms show the distribution of each set of data. The bottom-left scatterplots show correlation between the variables corresponding to the x-axis and y-axis.
Changes in Phenolic Compounds in Red and Black Currant Leaves During Ripening and Correlations Among Analysed Phenolic Groups
To present an overall picture of the phenolic profile of black and red currant leaves a heatmap () was created. In both red and black currants, 47 different phenolic compounds were identified (Tables S5-S6, – trace compounds are not shown on the heatmap), belonging to four phenolic groups – HCA, FLA, FLO and FLN. In the leaves of both currants, the most abundant was FLO (red: 58.5–67.9% TAP; black: 58.8–63.1% TAP), followed by FLA (red: 29.5–30.6% TAP; black: 19.3–22.0% TAP). The content of phenolic compounds in red currant leaves was 1.31-fold (T2) to 1.90-fold (T4) higher compared to black currant leaves. There has been no study conducted on the dynamics of changes in the content of phenolic compounds in leaves during fruit ripening; the only data available are on the dynamics over a longer period, where the content of phenolic compounds in the leaves harvested in the first stages of fruit ripening (June) was lower than in August, except for some individual phenolics, such as neochlorogenic acid, kaempferol-rutinoside (Vagiri et al., Citation2015). In addition, similar findings were reported by Nour et al. (Citation2014), who recorded the highest content of phenolics in mid-June. Ziobroń et al. (Citation2021) compared the content of polyphenols in black, red and white currant bushes, collected in May and at the beginning of June, July and August in 2018 and 2019, and found that the highest content was in black currant leaves, collected in July during the full ripeness of the fruit.
Figure 4. Dynamics of the phenolic profile of red currant leaves (A – based on phenolic groups; B – based on all identified individual phenolic compounds) and black currant leaves (C – based on phenolic groups; D – based on all identified individual phenolic compounds) during fruit ripening (T1-T4). Different coloring in heatmaps indicates a different content of phenolic compounds – a lower intensity determines a lower content of a certain phenolic compound or phenolic group (mg g−1 FW). Abbreviations: HCA: hydroxycinnamic acids, FLA: flavanols, FLO: flavonols, FLN: flavanones, p-CoA hexs: p-coumaric acid hexosides, 5-CQA1: 5-caffeoylquinic acid 1, 3-FQA: 3-feruloylquinic acid; 5-CQA2: 5-caffeoylquinic acid 2, caff acid der: caffeic acid derivative, 3-p-CQA: 3-p-caffeoylquinic acid, procy dims: procyanidin dimers, kaem hex rha hex: kaempferol hexosyl rhamnosyl hexoside, Q-pent rha hex: quercetin pentosyl rhamnosyl hexoside, myric-hex: myricetin hexosides, Q-pent-hex: quercetin pentosyl hexoside, kae-3-rut: kaempferol-3-rutinoside, Q-3-rha: quercetin-3-rhamnoside, Q-rha pent hex: quercetin rhamnosyl pentosyl hexoside, Q-rha hex: quercetin rhamnosyl hexoside, myric rha hex; myricetin rahmnosyl hexoside, Q-3-arapyr: quercetin-3-arabinopyranoside, kaem-3-gal: kaepferol-3-galactoside, Q-3-glucur: quercetin-3-glucuronide, Q-acetyl hex: quercetin acetyl hexoside, Q-dihex: quercetin-dihexoside, kaempf-gylcoside: kaempferol glycoside, Q-3-rut: quercetin-3-rutinoside, Q-3-glu: quercetin-3-glucoside, kaem-3-rut: kaempferol-3-rutinoside, iso-3-rut: isorhamnetin-3-rutinoside, Q-3-xyl: quercetin-3-xyloside, Nar hex: naringenin hexosides, 3-p-CoQA: 3-p-coumaroylquinic acid, 4-p-CoQA: 4-p-coumaroylquinic acid, kaem rham hex: kaempferol rhamnosyl hexoside.
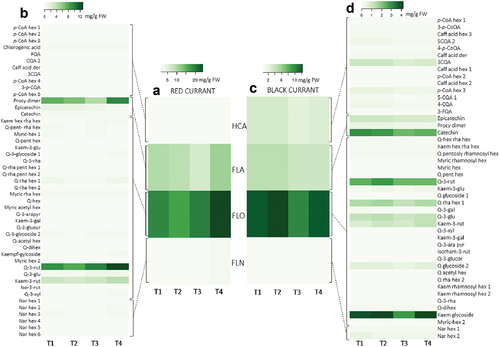
In red currant leaves FLOs were present in 58.5–67.9% of TAP, with the highest rate at the end of ripening (25.14 ± .76 mg g−1 FW). No significant differences were observed between other sampling dates (p > .05). In the analysis of phenolics in black currant leaves, the major FLO were present as conjugates of myricetin, quercetin, kaempferol, and isorhamnetin, consistent with Vagiri et al. (Citation2012). Oszmiański et al. (Citation2011) reported that quercetin derivatives are the dominant phenolics in the black currant leaf extract. From the heatmap () it is clear that quercetin-3-rutinoside was a major FLO in red currant leaves, accounting for 48.4–51.4% of total FLO and was significantly (p < .05) the highest on the last sampling date (Table S5; 12.92 ± .97 mg g−1 FW). The second most abundant FLO was kaempferol-3-rutinoside with a share of 15.9–18.1% FLO, while the other components were present in lower contents. The content of FLO in black currant leaves was lower than in red currant leaves (6.14–15.40 mg g−1 FW). The content of FLO differed between sampling days T2 and T3 (Table S5). Kaempferol glycoside () was the most abundant FLO in black currant leaves accounting for 28.6–32.6% of the total FLO, followed by quercetin-3-rutinoside (18.9–21.7% FLO) and quercetin-rhamnosyl hexoside 1 (11.8–12.2% FLO).
In red currant leaves the lowest percentage of FLA () from TAP was present on the sampling date T3 (20.6% TAP), while it was significantly (p < .05) higher on other sampling dates (T1: 29.5%, T2: 30.6%, T4: 30.6% from TAP). In red currant leaves, FLA (p < .05; Table S5) was present in the significantly highest content at the end of the ripening period (T4: 11.38 ± .68 mg g−1 FW). In black currant leaves, the proportion of FLA was 19.3–22.0% from TAP and the content did not substantially change (p > .05) during ripening. Among the individual FLA representatives, epicatechin, catechin and procyanidin dimer were identified in the leaves of both currants (). The presence of epigallocatechin, catechin, and epicatechin has been previously reported in the leaves of black currant by Vagiri et al. (Citation2012). A procyanidin dimer was the most abundant in red currant leaves, while epicatechin and especially catechin dominated in black currant leaves. In red currant leaves the contents of the procyanidin dimer and catechin were the highest at the end of ripening (; Table S5), while the content of epicatechin was the highest at the beginning of ripening. The individual representatives of FLA in black currant leaves (; Table S6) did not change during ripening, with the exception of the procyanidin dimer, whose content was considerably the highest at the beginning of ripening on T1 (2.97 ± .32 mg g−1 FW) and T2 (2.89 ± .28 mg g−1 FW).
HCAs () were present in greater proportions in black currant leaves (14.6–15.9% TAP) than in red currant leaves (), where their share of TAP ranged from 4.0% to 5.4%. During ripening, the total HCA content in the leaves of both currant species did not change significantly (p > .05) (, Table S5 and Table S6). Among the HCAs in red currant leaves, chlorogenic acid was the most abundant, accounting for between 34.4% (T3) and 47.2% of the total HCA (T1), although there were no considerable differences observed (p > .05) in its content between sampling dates (Table S5). According to Vagiri et al. (Citation2012), Raudsepp et al. (Citation2010) and Oszmiański et al. (Citation2011) the most abundant HCAs in black currant are neochlorogenic and chlorogenic acids. In black currant leaves of the cultivar “Titania,” neochlorogenic acid () predominated with a proportion between 29.6% HCA (T4) and 31.3% HCA (T1). Again, no significant differences (p > .05) were found between the samplings (Table S6).
FLNs represent the lowest percentage of the analyzed TAP in the leaves of red and black currant (red: 5.1% − 6.2% and black: 3.0–3.4%), again with no major changes in content during ripening. Only naringenin hexosides were analyzed in the leaves of both currants.
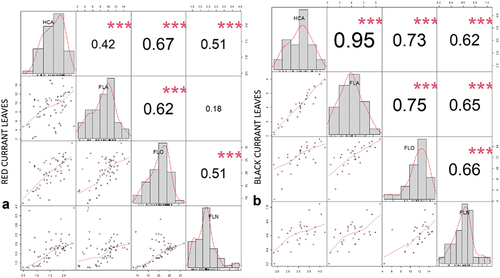
In black currant leaves all main phenolic groups correlated strongly (R > .6) or even very strongly (R > .8) and positively among themselves (), whereas in red currant leaves HCA, FLA and FLO (R > .4) correlated moderately with each other. FLN was moderately correlated with the content of FLO in red currant leaves (R = .51). There was no correlation observed between phenolics in leaves and fruits in the leaves in both currants.
Figure 5. Correlation matrix of correlation tests between main analyzed phenolic groups (FLA – flavanols, HCA – hydroxycinnamic acids, FLO – flavonols, FLN – flavanones) in red currant leaves (A) and black currant leaves (B). The values are R-values (Pearson’s correlation coefficient) for the correlation tests between the variables corresponding to x-axis and y-axis. The stars top-right to the r-values indicate the significance of the correlation: *** indicates p < .001, ** indicates p < .01, and * indicates p < .05. The midline histograms show the distribution of each set of data. The bottom-left scatterplots show correlation between the variables corresponding to the x-axis and y-axis.
Conclusion
The composition and variations of primary and secondary metabolites in red and black currant fruit during ripening had already been researched and was consequently merely roughly evaluated in this study. The focus has, therefore, rather been on examining the relationships between the main metabolites during ripening and filling the gaps in the knowledge of phenolic variation in leaves during ripening of both currant species. This is by far the most comprehensive study on the identification and quantification of phenolic compounds by an HPLC/MS analysis in black and red currant leaves during fruit ripening. Sugars accumulated in fruits during ripening in both species, on the other hand, organic acids decreased in red currant during ripening. In black currant, no differences in organic acid content were observed between the samplings. In red currant fruit 47 individual phenolic compounds were analyzed with HPLC-MS and 52 in black currant fruit. ANT was by far the most abundant phenolic compound in black currants and was in increase during ripening until the last sampling date. Total phenolic content (TAP) in black currant fruit increased until the last sampling date. TAP of red currant fruit did not change during ripening. In black currant fruit, ANT, HCA, FLA and FLO strongly correlated with each other, while FLN was positively correlated only with FLO. In both red and black currant leaves, 47 different phenolic compounds belonging to four phenolic groups – HCA, FLA, FLO and FLN, were identified. The content of phenolic compounds in red currant leaves was 1.31 to 1.90-fold higher compared to black currant leaves. In the leaves of both currants, FLO was the most abundant, with the highest content at the end of ripening. In black currant leaves, all main phenolic groups correlated strongly and positively with each other, whereas in red currant leaves HCA, FLA and FLO correlated moderately with each other. FLN correlated moderately with the content of FLO in red currant leaves. There was no correlation observed between the phenolic groups studied in fruits and leaves.
Authorship contribution
Sasa Gacnik: methodology, validation, writing – original draft, visualization, investigation. Maja Mikulic-Petkovsek: conceptualization, methodology, investigation, validation, supervision, writing – review & editing. Metka Hudina: funding, supervision, writing – review & editing. Robert Veberic: conceptualization, funding, supervision, writing – review & editing.
Supplemental Material
Download MS Word (61.9 KB)Acknowledgments
This research is part of the program Horticulture P4‐0013‐0481 supported by the Slovenian Research and Innovation Agency (ARIS) and the infrastructural centre IC RRC AG (10-0022-0481-001).
Disclosure statement
The authors declare that they have no known competing financial interests or personal relationships that could have appeared to influence the work reported in this paper.
Data availability statement
The data that support the findings of this study are available from the corresponding author, [S.G.], upon reasonable request.
Supplementary material
Supplemental data for this article can be accessed online at https://doi.org/10.1080/15538362.2024.2322746.
Additional information
Funding
References
- Allai, F.M., Z.R. Azad, K. Gul, B.N. Dar, A. Jabeen, and D. Majid. 2020. Black currant, In: pp. 271–293. In: G.A. Nayik and A. Gull (eds.). Antioxidants in fruits: Properties and health benefits. Springer Singapore. doi: 10.1007/978-981-15-7285-2_14.
- Aneta, W., O. Jan, M. Magdalena, and W. Joanna. 2013. Phenolic profile, antioxidant and antiproliferative activity of black and red currants (ribes spp.) from organic and conventional cultivation. Int. J. Food Sci. Tech. 48(4):715–726. doi: 10.1111/ijfs.12019.
- Ban, Y., S. Kondo, B.E. Ubi, C. Honda, H. Bessho, and T. Moriguchi. 2009. UDP-sugar biosynthetic pathway: Contribution to cyanidin 3-galactoside biosynthesis in apple skin. Planta 230(5):871–881. doi: 10.1007/s00425-009-0993-4.
- Belwal, T., A. Pandey, I.D. Bhatt, R.S. Rawal, and Z. Luo. 2019. Trends of polyphenolics and anthocyanins accumulation along ripening stages of wild edible fruits of Indian Himalayan region. Sci. Rep. 9(1):5894. doi: 10.1038/s41598-019-42270-2.
- Berk, S., M. Gundogdu, S. Tuna, and A. Tas. 2020. Role of maturity stages on phenolic compounds and organic acids contents in red currant fruits. Int. J. Fruit. Sci. 20(sup2):S1054–S1071. doi: 10.1080/15538362.2020.1774476.
- Ersoy, N., M. Kupe, M. Gundogdu, G. Ilhan, and S. Ercisli. 2018. Phytochemical and antioxidant diversity in fruits of currant (ribes spp.). Not. Bot. Horti. Agrobot. Cluj. Napoca. 46(2):381–387. doi: 10.15835/nbha46211103.
- Gačnik, S., R. Veberič, M. Hudina, D. Koron, and M. Mikulič-Petkovšek. 2021. Salicylate treatment affects fruit quality and also alters the composition of metabolites in strawberries. Horticulturae 7(10):400. doi: 10.3390/horticulturae7100400.
- Gao, L., S. Zhao, X. Lu, N. He, H. Zhu, J. Dou, W. Liu, and Y. Huang. 2018. Comparative transcriptome analysis reveals key genes potentially related to soluble sugar and organic acid accumulation in watermelon. PloS. One. 13(1):e0190096. doi: 10.1371/journal.pone.0190096.
- Gavrilova, V., M. Kajdžanoska, V. Gjamovski, and M. Stefova. 2011. Separation, characterization and quantification of phenolic compounds in blueberries and red and black currants by HPLC−DAD−ESI-MS n. J. Agric. Food. Chem. 59(8):4009–4018. doi: 10.1021/jf104565y.
- Hummer, K.E., and A. Dale. 2010. Horticulture of Ribes: Horticulture of Ribes. For. Pathol. 40(3–4):251–263. doi: 10.1111/j.1439-0329.2010.00657.x.
- Karjalainen, R., M. Anttonen, N. Saviranta, D. Stewart, G.J. McDougall, H. Hilz, P. Mattila, and R. Törrönen. 2009. A review on bioactive compounds in black currants (ribes nigrum L.) and their potential health-promoting properties. Acta Hortic. 839(839):301–307. doi: 10.17660/ActaHortic.2009.839.38.
- Krüger, E., H. Dietrich, M. Hey, and C. Patz. 2011. Effects of Cultivar, yield, Berry Weight, temperature and ripening stage on bioactive compounds of black currants. J. Applied Bot. And Food Qual 84(1):40–46.
- Määttä, K., A. Kamal-Eldin, and R. Törrönen. 2001. Phenolic compounds in berries of black, red, green, and white currants (Ribes sp.). Antioxid. Redox Signal. 3(6):981–993. doi: 10.1089/152308601317203521.
- Mikulic-Petkovsek, M., D. Koron, and R. Veberic. 2016. Quality parameters of currant berries from three different cluster positions. Sci. Hortic. 210:188–196. doi: 10.1016/j.scienta.2016.07.030.
- Mikulic-Petkovsek, M., J. Rescic, V. Schmitzer, F. Stampar, A. Slatnar, D. Koron, and R. Veberic. 2015. Changes in fruit quality parameters of four Ribes species during ripening. Food Chem. 173:363–374. doi: 10.1016/j.foodchem.2014.10.011.
- Milivojevic, J., V. Maksimovic, and M. Nikolic. 2009. Sugar and organic acids profile in the fruits of black and red currant cultivars. J Agric Sci BGD 54(2):105–117. doi: 10.2298/JAS0902105M.
- Noro, S., N. Kudo, and T. Kitsuwa. 1989. Differences in sugar and organic acid contents between bagged and unbagged fruits of the Yellow Apple Cultivars, and the effect on development of anthocyanin. Engei Gakkai Zasshi 58(1):17–24. doi: 10.2503/jjshs.58.17.
- Nour, V., I. Trandafir, and S. Cosmulescu. 2014. Antioxidant capacity, phenolic compounds and minerals content of blackcurrant (ribes nigrum L.) leaves as influenced by harvesting date and extraction method. Ind. Crops Prod. 53:133–139. doi: 10.1016/j.indcrop.2013.12.022.
- Oszmiański, J., A. Wojdyło, J. Gorzelany, and I. Kapusta. 2011. Identification and characterization of low molecular weight polyphenols in berry leaf extracts by HPLC-DAD and LC-ESI/MS. J. Agric. Food. Chem. 59(24):12830–12835. doi: 10.1021/jf203052j.
- Paunović, S.M., P. Mašković, M. Nikolić, and R. Miletić. 2017. Bioactive compounds and antimicrobial activity of black currant (ribes nigrum L.) berries and leaves extract obtained by different soil management system. Sci. Hortic. 222:69–75. doi: 10.1016/j.scienta.2017.05.015.
- Raudsepp, P., H. Kaldmäe, A. Kikas, A.-V. Libek, and T. Püssa. 2010. Nutritional quality of berries and bioactive compounds in the leaves of black currant (ribes nigrum L.) cultivars evaluated in Estonia. J. Berry. Res. 1(1):53–59. doi: 10.3233/BR-2010-006.
- Rawat, S., P. Acharya, P.O. Bhutia, A. Pandey, D. Kumar, R. Joshi, and I.D. Bhatt. 2023. Changes in nutritional, physicochemical, phytochemical composition and antioxidant potential of Mahonia nepalensis fruits during ripening. Int. J. Food Prop. 26(1):1062–1078. doi: 10.1080/10942912.2023.2200480.
- Saltveit, M.E. 2017. Synthesis and metabolism of phenolic compounds, In: pp. 115–124. In: E.M. Yahia (ed.). Fruit and vegetable phytochemicals. John Wiley & Sons, Ltd. doi: 10.1002/9781119158042.ch5.
- Tabart, J., C. Kevers, D. Evers, and J. Dommes. 2011. Ascorbic acid, phenolic acid, flavonoid, and carotenoid profiles of selected extracts from Ribes nigrum. J. Agric. Food. Chem. 59(9):4763–4770. doi: 10.1021/jf104445c.
- Tabart, J., C. Kevers, J. Pincemail, J.-O. Defraigne, and J. Dommes. 2006. Antioxidant capacity of black currant varies with organ, season, and Cultivar. J. Agric. Food. Chem. 54(17):6271–6276. doi: 10.1021/jf061112y.
- Toldam-Andersen, T.B., and P. Hansen. 1997. Growth and development in black currant (ribes nigrum). III. Seasonal changes in sugars, organic acids, chlorophyll and anthocyanins and their possible metabolic background. J. Hortic. Sci. 72(1):155–169. doi: 10.1080/14620316.1997.11515502.
- Vagiri, M., S. Conner, D. Stewart, S.C. Andersson, S. Verrall, E. Johansson, and K. Rumpunen. 2015. Phenolic compounds in blackcurrant (ribes nigrum L.) leaves relative to leaf position and harvest date. Food Chem. 172:135–142. doi: 10.1016/j.foodchem.2014.09.041.
- Vagiri, M., A. Ekholm, S.C. Andersson, E. Johansson, and K. Rumpunen. 2012. An optimized method for analysis of phenolic compounds in buds, leaves, and fruits of black currant (ribes nigrum L.). J. Agric. Food. Chem. 60(42):10501–10510. doi: 10.1021/jf303398z.
- Yang, B., J. Zheng, O. Laaksonen, R. Tahvonen, and H. Kallio. 2013. Effects of latitude and weather conditions on phenolic compounds in currant (ribes spp.) cultivars. J. Agric. Food. Chem. 61(14):3517–3532. doi: 10.1021/jf4000456.
- Zhang, X., X. Wei, M.M. Ali, H.M. Rizwan, B. Li, H. Li, K. Jia, X. Yang, S. Ma, S. Li, et al. 2021. Changes in the content of organic acids and expression analysis of citric acid accumulation-related genes during fruit development of yellow (passiflora edulis f. Flavicarpa) and purple (passiflora edulis f. Edulis) Passion Fruits. Int. J. Mol. Sci 22(11):5765. doi: 10.3390/ijms22115765.
- Ziobroń, M., A. Kopeć, J. Skoczylas, K. Dziadek, and J. Zawistowski. 2021. Basic chemical composition and concentration of selected bioactive compounds in Leaves of Black, red and white currant. Appl. Sci. 11(16):7638. doi: 10.3390/app11167638.
- Zorenc, Z., R. Veberic, D. Koron, S. Miosic, O.S. Hutabarat, H. Halbwirth, and M. Mikulic-Petkovsek. 2017. Polyphenol metabolism in differently colored cultivars of red currant (ribes rubrum L.) through fruit ripening. Planta 246(2):217–226. doi: 10.1007/s00425-017-2670-3.