
ABSTRACT
Oxidative stress-induced granulosa cell (GCs) death represents a common reason for follicular atresia. Follicle-stimulating hormone (FSH) has been shown to prevent GCs from oxidative injury, although the underlying mechanism remains to be elucidated. Here we first report that the suppression of autophagic cell death via some novel signaling effectors is engaged in FSH-mediated GCs protection against oxidative damage. The decline in GCs viability caused by oxidant injury was remarkably reduced following FSH treatment, along with impaired macroautophagic/autophagic flux under conditions of oxidative stress both in vivo and in vitro. Blocking of autophagy displayed similar levels of suppression in oxidant-induced cell death compared with FSH treatment, but FSH did not further improve survival of GCs pretreated with autophagy inhibitors. Further investigations revealed that activation of the phosphoinositide 3-kinase (PI3K)-AKT-MTOR (mechanistic target of rapamycin [serine/threonine kinase]) signaling pathway was required for FSH-mediated GCs survival from oxidative stress-induced autophagy. Additionally, the FSH-PI3K-AKT axis also downregulated the autophagic response by targeting FOXO1, whereas constitutive activation of FOXO1 in GCs not only abolished the protection from FSH, but also emancipated the autophagic process, from the protein level of MAP1LC3B-II to autophagic gene expression. Furthermore, FSH inhibited the production of acetylated FOXO1 and its interaction with Atg proteins, followed by a decreased level of autophagic cell death upon oxidative stress. Taken together, our findings suggest a new mechanism involving FSH-FOXO1 signaling in defense against oxidative damage to GCs by restraining autophagy, which may be a potential avenue for the clinical treatment of anovulatory disorders.
Introduction
In mammalian ovaries, more than 99 percent of the follicles undergo atretic degeneration before ovulation.Citation1,Citation2 Traditionally, follicular atresia was thought to occur entirely by granulosa cell (GC) apoptosis.Citation3,Citation4 However, recent literature suggests that nonapoptotic forms of programmed cell death (PCD) such as autophagy may also be involved.Citation5-Citation7 Although autophagy gene expression is detectable throughout the ovary,Citation8-Citation10 autophagosomes have been observed more frequently in the granulosa layers of atretic follicles.Citation11 In particular, autophagic signals are recognized only in GCs within antral follicles.Citation10 Importantly, observations of human ovaries reveal a close correlation between oxidized low-density lipoprotein (oxLDL)-induced autophagy and granulosa cell death, which is characterized by autophagosome accumulation in the absence of apoptotic bodies and cleaved CASP3/caspase-3.Citation5 Thus, these findings indicate a distinct role of autophagy in regulating GC viability.
Reactive oxygen species (ROS) are natural by-products of aerobic metabolism, but unlimited ROS generation leads to oxidative stress and cellular damage.Citation12 In the reproductive process, increased demands for energy and nutrients are associated with accelerated metabolic rates, and thus the cumulative ROS production. Therefore, oxidative stress represents a cost of reproduction.Citation13 Growing evidence implicates significant contributions of oxidative stress to initiate GC death via PCD during follicular atresia,Citation14 which may give rise to certain anovulatory disorders, such as polycystic ovary syndrome and premature ovarian failure.Citation15 In contrast, diminished ROS induction ameliorates PCD of GCs in atretic follicles upon oxidative stress.Citation16,Citation17 PCD generally refers to apoptotic (type I) or autophagic (type II) cell death (although this nomenclature is considered outdated).Citation18 It has been well documented that oxidative stress promotes apoptotic PCD in a variety of cell systems,Citation19 and recent studies also suggest the involvement of autophagy in cellular response to oxidative stress.Citation20 Normal mammalian cells with basal ROS production usually display low autophagic activity, whereas excessive autophagy has been reported to trigger self-destruction of cells with oxidative damage.Citation21 Moreover, various experimental data show the induction of apoptosis-independent autophagic cell death under oxidative stress conditions.Citation22,Citation23 However, whether autophagy is correlated with oxidative injury remains to be investigated in GCs.
Follicle-stimulating hormone (FSH) serves as the major survival factor for antral follicles by maintaining the well being of GCs.Citation24,Citation25 Although our previous data implicate a potential function for FSH in suppressing stress-induced GC injury,Citation26 current understanding regarding the defense mechanisms of FSH is mostly confined to its apoptosis regulation in GCs.Citation25 Particularly, few reports describe whether autophagy has a role in FSH-mediated GC protection from oxidative injury. In fact, emerging evidence from GCs indicates that autophagy may act predominantly as a prodeath pathway, exacerbating cellular damage upon noxious stimuli.Citation5,Citation6 Additionally, oxidative stress-activated autophagy initiates PCD without apoptosis induction in multiple types of mammalian cells.Citation22,Citation23 Therefore, the inhibition of autophagy, which is associated with enhanced GC viability, might be a novel mechanism underlying the protective effects of FSH against oxidative stress.
Several signaling cascades have been implicated as downstream mediators of FSH in maintaining GC survival, though their relative contributions to autophagy in response to oxidative stress remain uncovered.Citation27-Citation29 MTOR (mechanistic target of rapamycin [serine/threonine kinase]) is an evolutionarily conserved serine-threonine kinase that acts as a major repressor of autophagy.Citation30 MTOR activity is mainly regulated by growth factors or insulin-signaling components such as the class I phosphoinositide 3-kinase (PI3K)-AKT (In this study, unless otherwise specified, AKT refers to the total AKT1/2/3) pathway.Citation31 Indeed, the induction of AKT via an enhanced PI3K-AKT pathway facilitates phosphorylation of MTOR,Citation32,Citation33 leading to MTOR activation and subsequent autophagy suppression.Citation34,Citation35 Therefore, PI3K-AKT-MTOR represents a critical pathway in the downregulation of cellular autophagy. Recent studies indicate the induction of PI3K-AKT signaling upon gonadotropin treatment, which also activates MTOR in GCs.Citation36,Citation37 Moreover, as gonadotropins inhibit GC autophagy during follicular atresia,Citation10,Citation38 we wonder whether the suppression of autophagy via the PI3K-AKT-MTOR pathway is involved in FSH-mediated GC protection against oxidative damage.
As a member of the forkhead box O (FOXO) family, FOXO1/FKHR modulates diverse cellular and physiological processes, including cell cycle arrest, proliferation, differentiation, cell death, metabolism, stress response and aging.Citation39-Citation43 The specific functions of FOXO1 are achieved by post-translational modifications and subcellular localization in response to environmental stimuli, such as growth factors, hormones and oxidative stress.Citation44,Citation45 Mounting evidence in recent years suggests that FOXO1 plays an essential role in autophagy regulation upon stress conditions, not only because FOXO1 upregulates the expression of several autophagy-related genes,Citation46,Citation47 but also FOXO1 post-translational modifications can promote the autophagic flux.Citation48 FOXO1 has been identified as a critical downstream effector of FSH signaling.Citation27 Although FOXO1 is abundant in GCs, FSH significantly blocks its induction at transcriptional, translational and post-translational levels.Citation26,Citation49-Citation52 Therefore, we hypothesized that the downregulation of FOXO1-induced autophagy may correlate with FSH-mediated GC protection from oxidative stress.
In this study, we investigated the defense mechanisms of FSH against oxidative injury in GCs. Our findings suggest a primary role for autophagy suppression in FSH-induced GC survival via coordinating the PI3K-AKT-MTOR axis, PI3K-AKT-FOXO1 signaling cascades, and a FOXO1 acetylation-dependent pathway.
Results
Suppression of autophagy by FSH protects ovarian granulosa cells (GCs) from oxidative injury
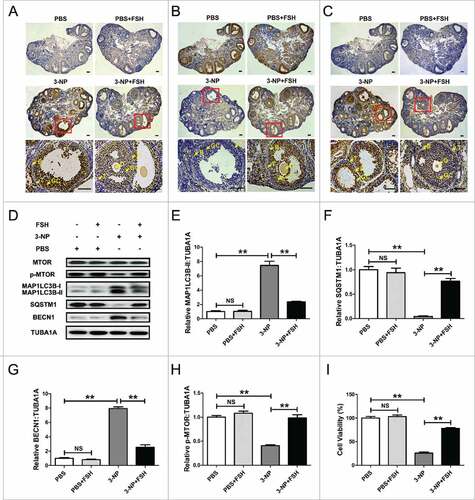
Using an established in vivo oxidative stress model targeted to mouse ovarian GCs,Citation53 we first examined the effects of FSH on GC autophagy upon oxidant stimulation. Immunohistochemical staining with autophagy biomarkers (including MAP1LC3B, SQSTM1/p62 and BECN1/Beclin 1) showed that the autophagic signals were markedly enhanced in ovaries harvested from mice subjected to 3-NP administration (, upper panels). In particular, the regulation of autophagy-activated marker protein levels was concentrated in the granulosa layers of antral follicles (, lower panels). In contrast, it implied impaired autophagic activity in follicular GCs following FSH injection (). These data thus indicated a potential role of FSH in regulating the GCs-specific distribution of autophagy-related proteins upon oxidative stress. Consistent with this, western blot analysis of total MAP1LC3B production, MAP1LC3B-II accumulation, SQSTM1 degradation, BECN1 expression, and MTOR dephosphorylation, further confirmed that the oxidant 3-NP-activated autophagy within ovarian GCs is repressed by FSH ( and Fig. S1). Moreover, using the CCK-8 assay, we found that FSH injection remarkably restored the viability of ovarian GCs collected from mice pretreated with 3-NP (). Therefore, our in vivo findings raised the possibility that the suppression of autopahgy by FSH might contribute to GC survival from oxidative damage.
Figure 1. The inhibitory effects of FSH on autophagy represses oxidative injury in mouse follicular GCs. Mice were injected i.p. with PBS or oxidant 3-NP (50 mg/kg) twice daily for 5 d. FSH was then injected i.p. (10 IU per mouse) 1.5 h before ovary collection. Immunohistochemical staining of GCs in ovary sections was detected using anti-MAP1LC3B (A), anti-SQSTM1 (B), and anti-BECN1 (C). Bar: 100 μm. O, oocyte; GC, granulosa cells; B, basement membrane; T, theca cells. Areas outlined in red are enlarged in lower panels. (D) Immunoblot analysis of MAP1LC3B, SQSTM1, BECN1 and p-MTOR in ovarian GCs retrieved from mice subjected to the indicated treatments. (E to H) Quantification of MAP1LC3B-II accumulation, SQSTM1 degradation, BECN1 expression and MTOR dephosphorylation. TUBA1A (tubulin, α 1A) served as the control for loading. Data represent mean ± S.E; n = 3. **P < 0.01; NS, not significant, P > 0.05. (I) Viability of ovarian GCs harvested from mice with the indicated administration was assessed using CCK-8 assay. Data represent mean ± S.E; n = 3 in each group. **P < 0.01; NS, not significant, P > 0.05.
FSH reduces oxidative injury in cultured GCs via inhibiting autophagic PCD
Considering the adverse effects of 3-NP on ATP production,Citation54 which is also responsible for autophagy induction, we suspected that the autophagic responses in ovarian GCs following 3-NP treatment might not be entirely caused by oxidative stress. On the other hand, GC survival is affected by multiple ovarian steroids and pituitary gonadotropins under physiological conditions.Citation55 To further verify whether autophagy is correlated with FSH-mediated GC protection against oxidative injury, as well as rule out the possible side actions of ATP reduction and other endocrine factors on autophagy or GC viability, we thus performed our subsequent experiments with H2O2 treatment in primary cultured GCs harvested from ovarian follicles. As shown in Fig. S2, the extent of cell damage was exacerbated by the increasing level of H2O2 (from 50 μM to 1 mM). In particular, GCs subjected to ≥ 200 μM of H2O2 exposure exhibited significant cell viability loss compared with the control group. Therefore, incubation with 200 μM H2O2 for 1 h was applied in the following experiments to provide a maximum dynamic range for quantifying protective versus harmful responses. Fig. S3 showed the intracellular reactive oxygen species (ROS) levels in H2O2-treated GCs. As assessed by oxidation of hydroethidium bromide, the red fluorescence intensity in ROS positive cells was markedly increased after H2O2 treatment. To investigate whether H2O2 induced autophagy in cultured GCs, protein lysates were collected for immunoblot analysis of MAP1LC3B, a hallmark of autophagy. As shown in and , the conversion of MAP1LC3B-I to MAP1LC3B-II was significantly promoted in GCs pretreated with H2O2. These data thus indicated that in vitro oxidative stress driven by H2O2 incubation triggers autophagy in GCs. To evaluate whether H2O2-induced cell injury was dependent on autophagy, cell viability was then determined in GCs treated with the autophagy inhibitor chloroquine following H2O2 exposure. As shown in , the level of H2O2-induced cell death was remarkably decreased in the presence of chloroquine, suggesting that oxidative stress may facilitate the autophagic death in cultured GCs.
Figure 2. FSH inhibits H2O2-triggered autophagy in cultured GCs. (A) Primary cultured GCs incubated with or without 200 μM H2O2 for 1 h were then rinsed in PBS, and cultured under normal conditions for another 2 h. The expression of MAP1LC3B was determined by western blotting. (B) Quantification of the conversion of MAP1LC3B-I to MAP1LC3B-II. TUBA1A served as the control for loading. Data represent mean ± S.E; n = 3. *Represents P < 0.05 compared with the control group. ** Represents P < 0.01 compared with the control group. (C) GCs exposed to 200 μM H2O2 for 1 h were then treated with 50 μM chloroquine for 2 h. Cell viability was examined using the CCK-8 assay. Data represent mean ± S.E; n = 3. ** P < 0.01 compared with the control group. ## P < 0.01 compared with H2O2-only-treated cells. CL, chloroquine. (D) GCs with 1 h of H2O2 (200 μM) exposure were treated with 7.5 IU/ml FSH for 2 h. The acidic vesicular organelles (AVOs, red) were detected using acridine orange staining. Bar: 10 μm. (E) GCs transfected with GFP-MAP1LC3B plasmid for 48 h were incubated with 200 μM H2O2 for 1 h and cultured for another 2 h in the presence or absence of FSH (7.5 IU/ml), pepstatin A (10 μg/ml) and E64 (10 μg/ml). The formation of autophagosomes was assessed by quantifying the GFP-MAP1LC3B puncta per cell. Experiments were repeated in triplicate, and 3 fields of each coverslip were selected in random for counting. Data represent mean ± S.E; n = 3 in each group. *P < 0.05, **P < 0.01; NS, not significant, P > 0.05. (F) GCs cultured with or without 200 μM H2O2 for 1 h were then treated with FSH for 0.5 to 3 h. The expression of MAP1LC3B, p-MTOR, SQSTM1 and BECN1 in GCs was determined by western blotting. (G to J) The conversion of MAP1LC3B-I to MAP1LC3B-II, MTOR dephosphorylation, SQSTM1 degradation and BECN1 expression were quantified by densitometric analysis. TUBA1A served as the control for loading. Data represent mean ± S.E; n = 3. * Represents P < 0.05 compared with the control group. ** Represents P < 0.01 compared with the control group. # Represents P > 0.05 compared with the control group.
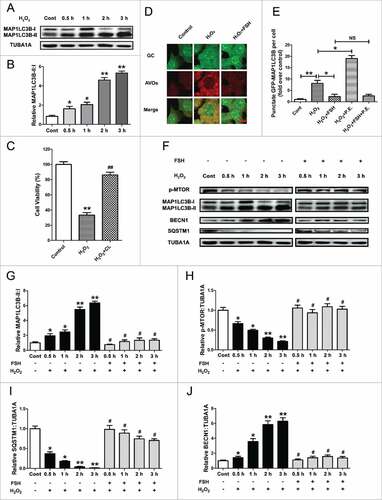
To test whether a nonspecific effect of FSH addition might influence autophagy by antagonizing oxidative stress, we measured the ROS production in FSH-treated GCs after H2O2 incubation. As shown in Fig. S3, no significant alteration in ROS levels was observed in cells exposed to FSH treatment, indicating that FSH may directly modulate oxidative stress-induced autophagy in cultured GCs. To validate this speculation, the formation of acidic vesicular organelles (AVOs), a morphological characteristic of autophagy,Citation56 was detected using acridine orange staining. As shown in and S4, GCs pretreated with H2O2 displayed a marked decrease in the amount of AVOs after FSH incubation. To acquire a better estimation of FSH-mediated inhibition on autophagy, we next monitored the autophagic flux by following MAP1LC3B in the absence or presence of pepstatin A and E64 (P.E; both are lysosomal protease inhibitors) ( and Fig. S5). It was found that H2O2 significantly improved the formation of GFP-MAP1LC3B puncta and MAP1LC3B blots. Notably, the green puncta and MAP1LC3B-II blots were further accumulated in cells treated with P.E, indicating that the autophagic flux was enhanced upon oxidative stimulation. In contrast, FSH blocked the generation of autophagic puncta and MAP1LC3B-II blots in H2O2-incubated cells despite P.E administration, implying a possible connection between FSH and autophagosome formation. Additionally, western blot assays showed that the conversion of MAP1LC3B-I to MAP1LC3B-II, MTOR dephosphorylation, SQSTM1 degradation, and BECN1 expression following H2O2 exposure were remarkably inhibited by FSH (), further confirming the role of FSH in suppressing oxidative stress-induced GC autophagy.
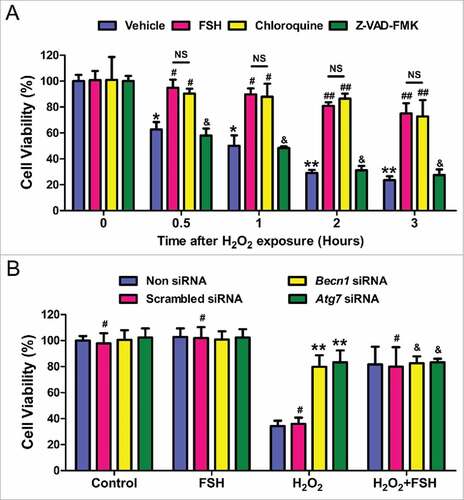
We next determined whether the downregulation of autophagy by FSH or inhibitors affected H2O2-triggered oxidative damage to cultured GCs. As shown in , both FSH and the autophagy inhibitor chloroquine markedly restored the viability of cells within 3 h after H2O2 incubation. Given the fact that continuing H2O2 stimulation (for 24 h) is able to induce GC apoptosis,Citation53 we asked whether the apoptotic death might also contribute to cell injury in GCs suffering short-term oxidative stress. However, the pancaspase inhibitor Z-VAD-FMK failed to inhibit H2O2-induced cell death. Moreover, no significant induction of CASP3 was observed in the early stages of H2O2-induced cell death.Citation57 These results thus suggested the involvement of apoptosis-independent autophagic PCD in FSH-mediated GC survival upon acute oxidative stress. Since autophagosome formation requires the participation of several autophagy-related genes such as Becn1 and Atg7,Citation58,Citation59 we then tested whether blocking autophagy with small interfering RNA (siRNA) against Becn1 and Atg7 exerted any influence on FSH-mediated GC protection. As shown in and S6, both the cell viability loss and the autophagic induction during oxidative stress were significantly reversed by silencing the expression of Becn1 and Atg7. Correspondingly, FSH displayed similar level of suppression in H2O2-induced cell death and autophagy, but no additional restoration of cell viability or autophagic signals were detected in FSH-treated GCs following siRNAs transfection. These data thus further supported the role of FSH in GCs protection via repressing autophagic cell death.
Figure 3. FSH preferentially suppresses the autophagic death to prevent oxidative stress-induced GC injury. (A) GCs with 1 h of H2O2 (200 μM) incubation were treated with FSH (7.5 IU/ml), the autophagy inhibitor chloroquine (50 μM), or the apoptosis inhibitor Z-VAD-FMK (50 μM) for 0.5 to 3 h. Cell viability was then determined using the CCK-8 assay. Data represent mean ± S.E; n = 3 in each group. *Represents P < 0.05 compared with vehicle group at 0 h. **Represents P < 0.01 compared with vehicle group at 0 h. #Represents P<0.05 compared with H2O2-only-treated cells. ##Represents P < 0.01 compared with H2O2-only-treated cells. &Represents P > 0.05 compared with H2O2-only-treated cells. NS, not significant, P > 0.05. (B) GCs remained as an untreated control or were transfected with Becn1 siRNA, Atg7 siRNA or scrambled control siRNA for 24 h. After 1 h of H2O2 (200 μM) exposure, GCs were washed with PBS, grown in medium containing FSH for 2 h, and then processed for examining cell viability using the CCK-8 assay. Data represent mean ± S.E; n = 3. ** Represents P < 0.01 compared with ‘Non siRNA’ conditions. # Represents P > 0.05 compared with ‘Non siRNA’ conditions. & Represents P > 0.05 compared with ‘H2O2+FSH’ conditions.
FSH protects against oxidative stress-induced autophagic GC death through the PI3K-AKT pathway
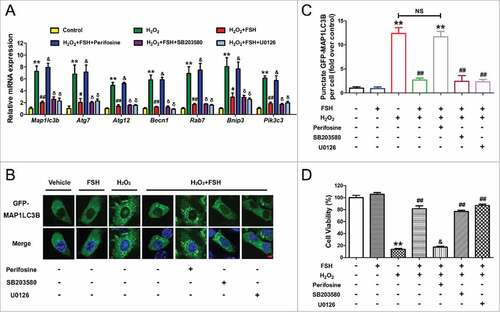
FSH-mediated GC survival involves the activation of several downstream signaling cascades, such as MAPK1/ERK2-MAPK3/ERK1, PI3K-AKT, and MAPK14/p38 α.27 To further investigate the mechanisms of autophagy regulation by FSH following oxidative stress, we examined the roles of these pathways in the suppression of autophagy and cell death in primary cultured GCs. qRT-PCR analysis showed that perifosine (AKT inhibitor) abolished FSH-mediated transcriptional inhibition of several significant autophagy-associated genes as indicated (), whereas SB203580 (MAPK14 inhibitor) and U0126 (MAPK1/3 inhibitor) had no effect. The inhibition of autophagy via the FSH-PI3K-AKT axis was also demonstrated by monitoring GCs transfected with GFP-MAP1LC3B expressing vector. As shown in , and Fig. S7, compared with SB203580 and U0126, treatment with perifosine restored the H2O2-triggered formation of GFP-MAP1LC3B puncta in the presence of FSH. Correspondingly, CCK-8 assay indicated that the preventive effects of FSH on H2O2-derived GC injury were blocked by perifosine, but not SB203580 or U0126 (). These data suggested that the downregulation of autophagic death through the PI3K-AKT pathway might contribute to FSH-induced GC protection.
Figure 4. FSH protects GCs from H2O2-induced autophagic PCD through the PI3K-AKT pathway. Primary cultured GCs incubated with or without 200 μM H2O2 for 1 h were then rinsed in PBS, and grown in serum-free medium containing 7.5 IU/ml FSH for 2 h. Perifosine (AKT inhibitor, 10 μM), SB203580 (MAPK14 inhibitor, 20 μM), U0126 (MAPK1/3 inhibitor, 3 μM) was added 30 min before FSH treatment. (A) qRT-PCR was performed to measure the mRNA levels of autophagy-related (Atg) genes in GCs. Expression data were normalized to that of Actb. ** Represents P < 0.01 compared with the control group. # Represents P < 0.05 compared with H2O2-only-treated cells. ## Represents P < 0.01 compared with H2O2-only-treated cells. & Represents P>0.05 compared with H2O2-only-treated cells. δ Represents P > 0.05 compared with H2O2+FSH group. (B) Formation of GFP-MAP1LC3B vacuoles (puncta) was determined as described above. Bar: 5 μm. (C) Quantification of GFP-MAP1LC3B puncta per cell. Experiments were repeated in triplicate, and 3 fields of each coverslip were selected in random for counting. Data represent mean ± S.E; n = 3 in each group. ** Represents P < 0.01 compared with the control group. ## Represents P < 0.01 compared with H2O2-only-treated cells. NS, not significant, P > 0.05. (D) The determination of cell viability using the CCK-8 assay. Data represent mean ± S.E; n = 3. ** Represents P < 0.01 compared with the control group. ## Represents P < 0.01 compared with H2O2-only-treated cells. & Represents P > 0.05 compared with H2O2-only-treated cells.
Inhibition of autophagy through the FSH-PI3K-AKT-MTOR axis preserves GC viability upon oxidative stress
To further probe this pathway, we examined AKT activation. As shown in , FSH markedly repressed H2O2-induced dephosphorylation of AKT without altering total AKT protein level. Consistently, our previous work showed that both PI3K and AKT were induced by FSH treatment, but the inhibition of PI3K activity blocked FSH-induced AKT activation.Citation26 These results were in agreement with earlier reports suggesting that the PI3K-AKT pathway acts downstream of FSH signaling in GCs.Citation27 To obtain a better assessment of the cellular autophagic response to the FSH-PI3K-AKT axis during oxidative stress, we then performed transmission electron microscopy (TEM) in FSH-treated GCs supplemented with or without AKT inhibitor following H2O2 incubation. Autophagic structures were characterized by the sequestration of cytosol or cytoplasmic organelles into double-membrane vesicles.Citation60 As shown in and , perifosine restored H2O2-induced accumulation of autophagic vacuoles in GCs despite FSH administration. In accordance with this, FSH failed to restrain H2O2-triggered MAP1LC3B-II accumulation and MTOR dephosphorylation in the presence of AKT inhibitor or Akt1/2 siRNA (, Fig. S8A and B), further confirming the involvement of the PI3K-AKT pathway in FSH-mediated autophagy suppression.
Figure 5. Activation of the AKT-MTOR axis by FSH inhibits oxidative stress-triggered GC autophagy. (A) After incubation with 200 μM H2O2 for 1 h, GCs were washed in PBS, and then cultured in serum-free medium containing 7.5 IU/ml FSH for 1 or 2 h. The expression of phosphorylated AKT (p-AKT) and total AKT was determined by western blotting. (B to D) The relative expression of total AKT, p-AKT, and the ratio of p-AKT to total AKT were quantified using densitometric analysis. TUBA1A served as the control for loading. Data represent mean ± S.E; n = 3. * Represents P < 0.05 compared with the control group. ** Represents P < 0.01 compared with the control group. # Represents P > 0.05 compared with the control group. (E) GCs pretreated with 200 μM H2O2 for 1 h were rinsed with PBS and cultured in serum-free medium containing 7.5 IU/ml FSH for another 2 h. Perifosine (AKT inhibitor, 10 μM) was added 30 min before FSH treatment. Cells were then collected for TEM imaging of the autophagic structures. Bar: 1 μm. Enlarged images (below) show clearer autophagic vacuoles (red arrows). (F) Number of autophagic vacuoles per cell section in GCs. Bar graphs are mean ± S.E of results from 10 cell sections. **P < 0.01; NS, not significant, P > 0.05. (G) GCs cultured with or without 200 μM H2O2 for 1 h were washed in PBS, and then grown in serum-free medium containing 7.5 IU/ml FSH for 2 h. Perifosine (10 μM) was added 30 min before FSH treatment. The expression of MAP1LC3B and p-MTOR in GCs was determined by western blotting. (H and I) Quantification of the MAP1LC3B-II accumulation and MTOR dephosphorylation. TUBA1A served as the control for loading. Data represent mean ± S.E; n = 3. **P < 0.01; NS, not significant, P > 0.05.
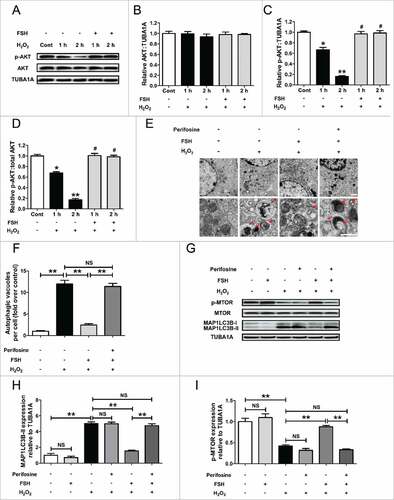
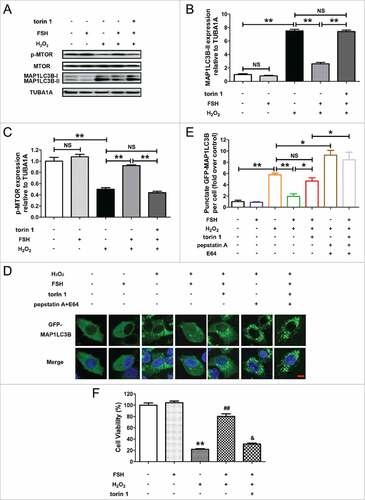
Given an anti-autophagic role of MTOR downstream of PI3K-AKT signaling,Citation30,Citation31 we next investigated the potent functions of MTOR in FSH-modulated GC protection against autophagic PCD. As shown in and Fig. S8A and C, the treatments with MTOR inhibitor torin 1 or Mtor siRNA abrogated the downregulation of H2O2-induced MAP1LC3B-II expression and MTOR dephosphorylation in GCs, induced by FSH. Correspondingly, the inhibitory effects of FSH on autophagosome formation were abolished in torin 1-treated cells, which displayed a significant enhancement in the punctate GFP-MAP1LC3B signals under oxidative stress ( and ). In addition, it implied that torin 1 blocked FSH-mediated inhibition on H2O2-triggered autophagic flux in GCs (, and Fig. S9). To further clarify whether the AKT-MTOR axis affected the prosurvival action of FSH upon oxidative stress, we then examined the cell viability of H2O2-treated GCs in the presence of FSH, torin 1, Mtor siRNA, or Akt1/2 siRNA. As shown in and Fig. S8D and E, the inhibition of MTOR or AKT both blocked FSH-induced cell survival following H2O2 exposure, consistent with the observations from autophagy determination under the same conditions ( and ). Collectively, these data suggested that the suppression of autophagy induction through the PI3K-AKT-MTOR axis is an important mechanism of FSH-mediated GCs protection against oxidative injury.
Figure 6. Suppression of autophagic death via the FSH-PI3K-AKT-MTOR axis improves GC survival upon oxidative stress. (A) Primary cultured GCs were exposed to 200 μM H2O2 for 1 h, washed with PBS, and then plated in serum-free medium containing FSH (7.5 IU/ml) and/or the MTOR inhibitor torin 1 (100 nM) for 2 h. The expression of MAP1LC3B and p-MTOR in GCs was determined by western blotting. (B and C), The MAP1LC3B-II accumulation and MTOR dephosphorylation were quantified by densitometric analysis. TUBA1A served as the control for loading. Data represent mean ± S.E; n = 3. **P < 0.01; NS, not significant, P > 0.05. (D) GCs transfected with GFP-MAP1LC3B plasmid for 48 h were incubated with 200 μM H2O2 for 1 h, rinsed in PBS, and cultured with serum-free medium in the presence or absence of 7.5 IU/ml FSH, 100 nM torin 1 and/or 10 μg/ml of autolysosome inhibitors (pepstatin A and E64) as indicated. Laser confocal-scanning microscopy was used to observe the GFP fluorescent puncta in GCs. Bar: 10 μm. (E) Quantification of the GFP-MAP1LC3B puncta per cell. Experiments were performed in triplicate, and cells were counted in 3 randomly selected fields in each coverslip. Data represent mean ± S.E; n = 3. *P < 0.05, **P < 0.01; NS, not significant, P > 0.05. (F) GCs were incubated for 1 h in 200 μM H2O2, washed with PBS, grown in serum-free medium containing FSH (7.5 IU/ml) and/or Torin 1 (100 nM) for 2 h, and then processed for determining cell viability using the CCK-8 assay. Data represent mean ± S.E; n = 3 in each group. ** Represents P < 0.01 compared with the control group. ## Represents P < 0.01 compared with H2O2-only-treated cells. & Represents P > 0.05 compared with H2O2-only-treated cells.
FSH attenuates FOXO1-dependent autophagy in H2O2-treated GCs
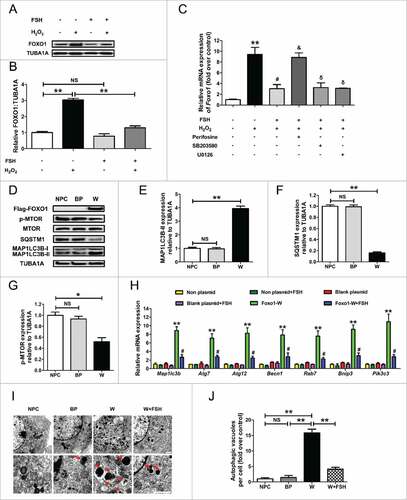
A series of recent studies have reported that FOXO1 (also known as FKHR), the key downstream effector of the FSH-PI3K-AKT axis,Citation27 plays an essential role in autophagy regulation.Citation61 We thus tested whether FOXO1 correlates with FSH-mediated autophagy suppression during oxidative stress. As shown in and , the elevation of FOXO1 protein was evident 2 h after H2O2 exposure, which was markedly reduced by FSH treatment. Consistently, the level of Foxo1 mRNA was remarkably inhibited (). Notably, blocking of the PI3K-AKT pathway reversed the inhibition of Foxo1 by FSH, whereas SB203580 (MAPK14 inhibitor) and U0126 (MAPK1/3 inhibitor) did not significantly affect Foxo1 induction in FSH-treated GCs following H2O2 exposure. Evidence from various types of mammal cells indicates that stress-activated FOXO1 triggers the expression of autophagy-related genes, such as Map1lc3b, Atg7, Atg12, Becn1, Rab7, Bnip3 and Pik3c3.Citation47,Citation61,Citation62 As shown in and , a strong correlation between the expression patterns of these genes and Foxo1 (Pearson test, P < 0.01) in response to FSH and the PI3K-AKT inhibitor treatment was observed, indicating a possible modulation of FOXO1-dependent autophagy by FSH through the PI3K-AKT pathway. To confirm this assumption, we overexpressed wild-type (WT) FOXO1 (FOXO1-WT) in cultured GCs. Western blot assays demonstrated a successful induction of FOXO1 expression after transfection, followed by elevated MAP1LC3B-II accumulation, SQSTM1 degradation and MTOR dephosphorylation (). Correspondingly, qRT-PCR analysis showed that FOXO1 (WT) significantly upregulated the transcription of downstream autophagy-related genes as tested (). Additionally, the activation of autophagy by overexpressed FOXO1 (WT) was also confirmed by electron microscopy ( and ). To further clarify whether FOXO1 is required for FSH-mediated autophagy suppression under oxidative stress, we blocked FOXO1 expression using RNA interference (Fig. S10A). As shown in Fig. S10B, knocking down FOXO1 also prevented the induction of autophagy upon H2O2 stimulation. Immunoblotting analysis of MAP1LC3B-II accumulation, SQSTM1 degradation showed that both FOXO1 knockdown and FSH treatment significantly repressed the autophagic response following oxidative stress. However, Foxo1 siRNA failed to further inhibit autophagy in GCs pretreated with FSH (Fig. S10C and D), indicating that the inhibition of FOXO1 by FSH blocked H2O2-triggered autophagy. Moreover, by examining cell viability under the same conditions (Fig. S10E), we further confirmed that FSH-induced FOXO1 suppression is essential for GC protection against oxidative injury. Taken together, these data suggested that the regulation of autophagy by FOXO1 through the PI3K-AKT axis might be involved in FSH-mediated GC survival upon oxidative stress.
Figure 7. FSH represses autophagy induction by oxidative stress through a FOXO1-dependent mechanism in GCs. (A) Primary cultured GCs with 1 h of H2O2 (200 μM) exposure were rinsed in PBS, and grown in serum-free medium containing 7.5 IU/ml FSH for 2 h. The cell lysates were then collected for immunoblot analysis of FOXO1 expression. (B) Quantification of the FOXO1 protein level with densitometry. TUBA1A was used as the control for loading. Data represent mean ± S.E; n = 3. **P < 0.01; NS, not significant, P > 0.05. (C) GCs incubated with or without 200 μM H2O2 for 1 h were then rinsed in PBS, and grown in serum-free medium containing 7.5 IU/ml FSH for 2 h. Perifosine (AKT inhibitor, 10 μM), SB203580 (MAPK14 inhibitor, 20 μM), U0126 (MAPK1/3 inhibitor, 3 μM) was added 30 min before FSH treatment. qRT-PCR was performed to assess the effects of the FSH signaling antagonists on Foxo1 transcription. The relative expression level was normalized to that of Actb. (D) A Flag-tagged WT FOXO1 (FOXO1-WT) was transfected into cultured GCs. 24 h later, the protein levels of MAP1LC3B, SQSTM1 and p-MTOR in GCs was determined by western blotting. (E to G) Quantification of the MAP1LC3B-II accumulation, SQSTM1 degradation and MTOR dephosphorylation. TUBA1A served as the control for loading. Data represent mean ± S.E; n = 3. *P < 0.05, **P < 0.01; NS, not significant, P > 0.05. (H) GCs remained as an untreated control or were transfected with FOXO1-WT expression vector or blank control plasmid for 24 h. Cells were treated with or without FSH (7.5 IU/ml) during transfection. qRT-PCR was performed to measure the expression of autophagy-related (Atg) genes in GCs. The relative expression level was normalized to that of Actb. Data represent mean ± S.E; n = 3 in each group. ** Represents P < 0.01 compared with the non-plasmid control. # Represents P < 0.05 compared with FOXO1-WT group. (I) TEM imaging of the autophagic structures in GCs transfected with FOXO1-expressing plasmid in the presence or absence of FSH (7.5 IU/ml) as mentioned above. Bar: 1 μm. Enlarged images (below) show clearer autophagic vacuoles (red arrows). (J) Number of autophagic vacuoles per cell section in GCs. Bar graphs are mean ± S.E of results from 10 cell sections. **P < 0.01; NS, not significant, P > 0.05.
Inhibition of FOXO1 transcriptional activity through the FSH-PI3K-AKT axis promotes GC survival against autophagic PCD
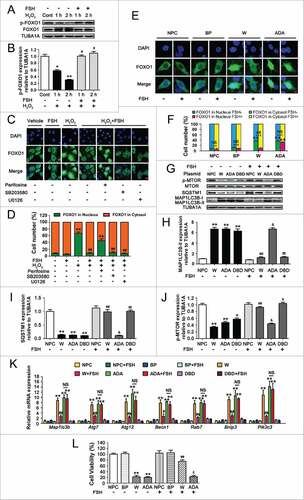
Considering that the suppression of FOXO1 by PI3K-AKT might also be attributed to its phosphorylation and nuclear export, we next investigated whether the subcellular localization of FOXO1 in GCs affected FSH-directed autophagy regulation upon oxidative stress. As shown in and , the H2O2 incubation facilitated FOXO1 activation as suggested by decreased phosphorylation, which was blocked after FSH treatment. Correspondingly, the nuclear localization of FOXO1 was markedly inhibited ( and ). Conversely, the AKT inhibitor perifosine led to a significant redistribution of FOXO1 from the cytoplasm to the nucleus in FSH-treated GCs following H2O2 exposure ( and ). We also examined a possible involvement of MAPK14 and MAPK1/3. However, their inhibitors SB203580 and U0126 had little effect on FSH-induced nuclear exclusion of FOXO1 in response to oxidative stress. To further specify the negative influence of FSH-PI3K-AKT on FOXO1 activity without differences in total FOXO1 level, as well as simulate the upregulation of FOXO1 expression under oxidative stress conditions, we transfected GCs with FOXO1-WT and a constitutively active FOXO1 mutant (FOXO1T24A,S253D,S316A/FOXO1-ADA; the 3 mutations were Threonine 24 to Alanine, and Serine 253 to Aspartate, and Serine 316 to Alanine). As shown in and , the amount of total FOXO1 protein was significantly increased both in the cytoplasm and nucleus during enforced expression of FOXO1-WT or FOXO1T24A,S253D,S316A. However, GCs treated with FSH for 2 h displayed a remarkable repression of FOXO1 nuclear localization in the FOXO1-WT group. Meanwhile, expression of FOXO1T24A,S253D,S316A abolished FSH-induced nuclear export of FOXO1, consistent with the effects of AKT inhibitor perifosine as described above ( and ). To test whether the nuclear and cytoplasmic shuttling of FOXO1 is correlated with FSH-mediated autophagy suppression, we transfected GCs with the expressing vectors of FOXO1, including FOXO1-WT (WT), FOXO1T24A,S253D,S316A, and FOXO1N208A,H212R/FOXO1-DBD (a FOXO1 mutant without DNA-binding activity). Immunoblotting assays showed that FSH suppressed the induction of MAP1LC3B-II accumulation, SQSTM1 degradation and MTOR dephosphorylation following enforced FOXO1 expression (). Accordingly, the formation of autophagic vacuoles was remarkably inhibited by FSH ( and ). However, the constitutively active form of FOXO1 (FOXO1T24A,S253D,S316A) restored overexpression-triggered autophagy in the presence of FSH (), indicating that FSH-induced FOXO1 phosphorylation and nuclear exclusion via PI3K-AKT might contribute to the prohibition of autophagy in GCs. This assumption was further confirmed by monitoring the expression of several proautophagic genes. As shown in , all of the tested transcripts were significantly increased after overexpression of FOXO1-WT and FOXO1T24A,S253D,S316A, compared with levels in cells transfected with FOXO1N208A,H212R or empty vector (). In contrast, FSH counteracted FOXO1-induced transcriptional activation of autophagy in the FOXO1-WT group ( and ), but not in the FOXO1T24A,S253D,S316A group (). Moreover, GCs with enforced FOXO1 expression exhibited significant cell viability loss, which was markedly reduced by FSH treatment in the FOXO1-WT group. Conversely, the FOXO1 mutant without AKT phosphorylation sites (FOXO1T24A,S253D,S316A) abrogated FSH-induced GC survival (). These observations were consistent with the results from autophagy determination under the same conditions (). Thus, it was concluded that the repression of FOXO1 transcriptional activity by phosphorylation and nuclear exclusion via the FSH-PI3K-AKT axis might inhibit oxidative stress-induced autophagic death in GCs.
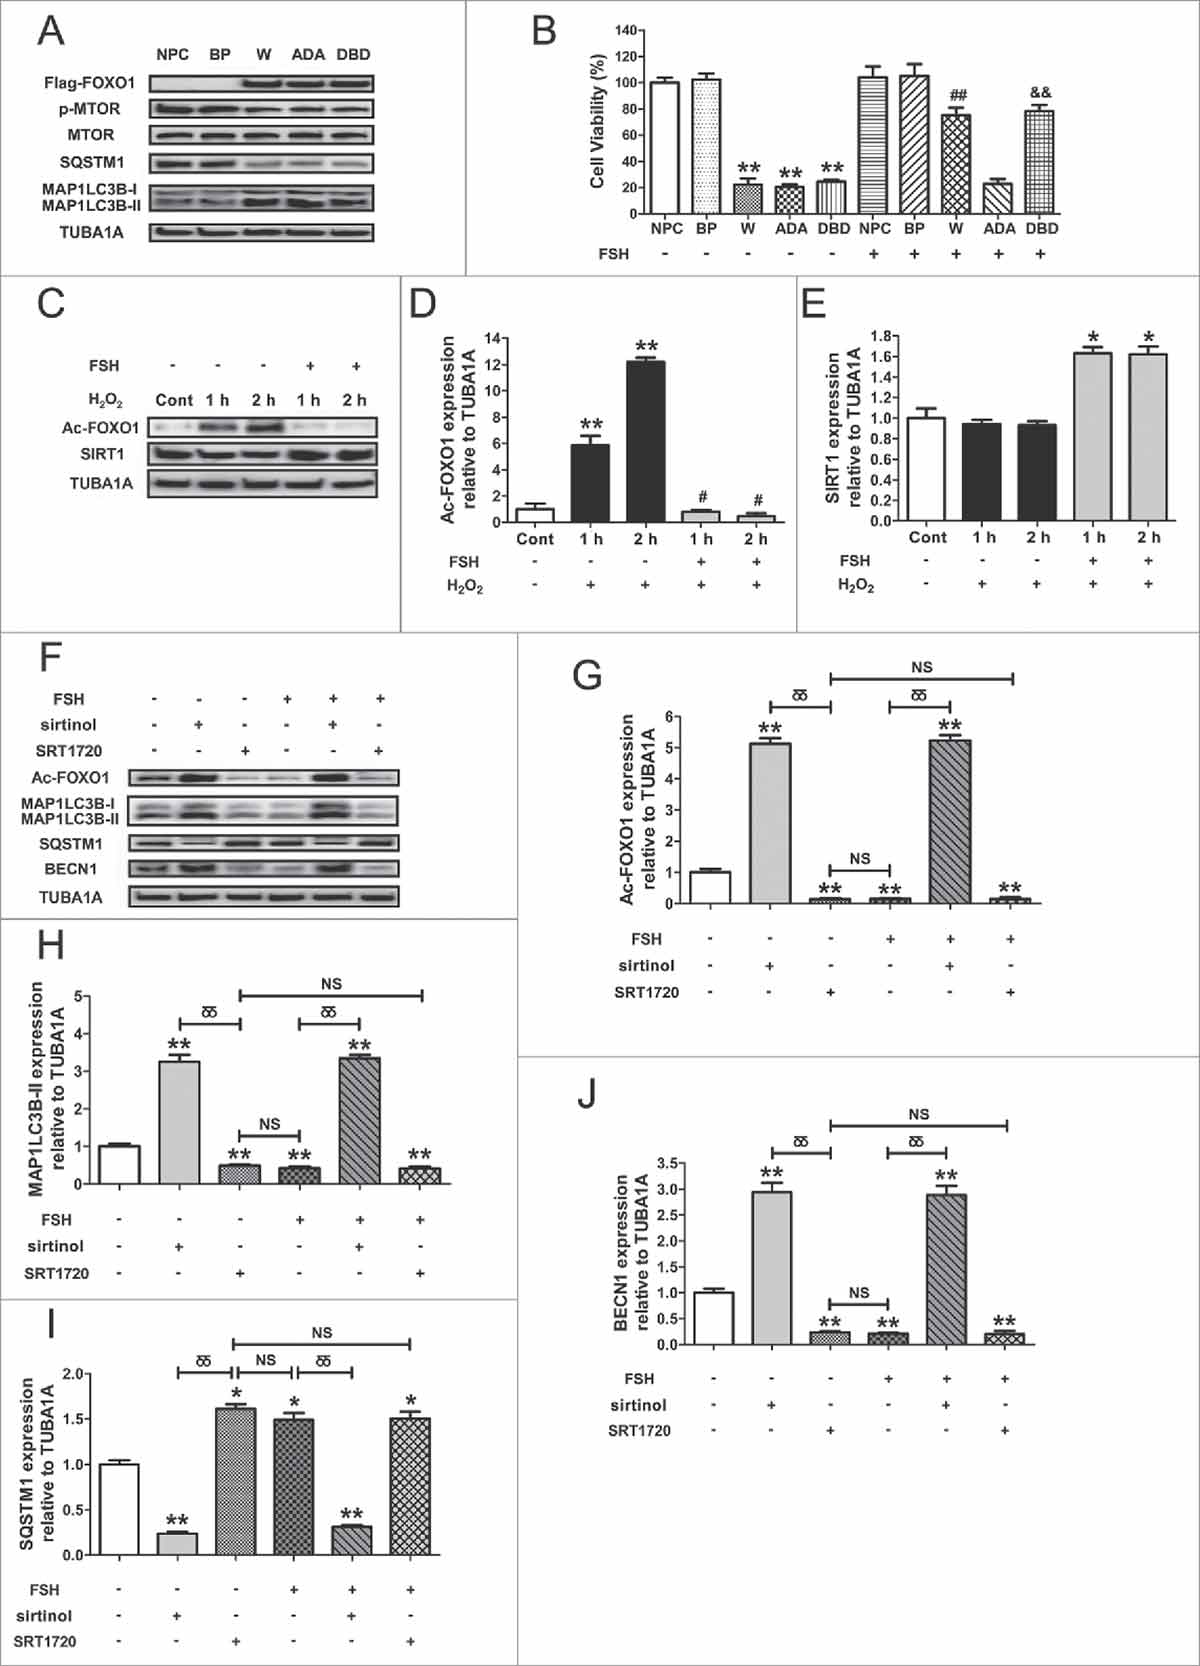
Figure 8. Suppression of FOXO1 transcriptional activity via the FSH-PI3K-AKT axis attenuates autophagic death in H2O2-treated GCs. (A) Primary cultured GCs incubated with or without 200 μM H2O2 for 1 h were washed in PBS, and then grown in serum-free medium containing FSH (7.5 IU/ml) for 1 or 2 h. The expression of phosphorylated FOXO1 (p-FOXO1) was determined by western blotting. (B) The phosphorylation level of FOXO1 was quantified by densitometric analysis. TUBA1A served as the control for loading. Data represent mean ± S.E; n = 3. * Represents P < 0.05 compared with the control group. ** Represents P < 0.01 compared with the control group. # Represents P > 0.05 compared with the control group. (C) GCs treated with or without 200 μM H2O2 for 1 h were then rinsed in PBS, and cultured with serum-free medium for 2 h in the presence or absence of FSH (7.5 IU/ml). Perifosine (AKT inhibitor, 10 μM), SB203580 (MAPK14 inhibitor, 20 μM), U0126 (MAPK1/3 inhibitor, 3 μM) was added 30 min before FSH treatment. Subcellular localization of FOXO1 in response to the indicated FSH signaling inhibitors was detected using anti-FOXO1 (green), and the nuclei were counterstained with DAPI (blue). Bar: 10 μm. (D) The percentage of cells with FOXO1 in the nucleus (green bars) and in the cytosol (orange bars). Experiments were repeated in triplicate, and 3 fields of each coverslip were selected in random for counting. Data represent mean ± S.E; n = 3. ** Represents P < 0.01 compared with the control group. ## Represents P < 0.01 compared with H2O2-only-treated cells. and& Represents P < 0.01 compared with H2O2+FSH group. (E) A Flag-tagged FOXO1 (WT), FOXO1T24A,S253D,S316A (ADA), or an empty control plasmid (BP) was individually transfected into GCs. Cells were treated with or without FSH (7.5 IU/ml) during transfection. Immunofluorescence microscopy was performed to visualize subcellular localization of FOXO1 (green). The nuclei were counterstained with DAPI (blue). Bar: 5 μm. (F) The percentage of cells with FOXO1 in the nucleus or the cytosol under the indicated treatments. NPC, non-plasmid control; BP, blank plasmid; W, FOXO1-WT plasmid; ADA, FOXO1T24A,S253D,S316A plasmid; DBD, FOXO1N208A,H212R plasmid. ** Represents P < 0.01 compared with the non-plasmid control; NS, not significant, P > 0.05; ##, P < 0.01. (G) Immunoblot analysis of MAP1LC3B, SQSTM1 and p-MTOR in GCs transfected with FOXO1-expressing vectors (FOXO1-WT, FOXO1T24A,S253D,S316A, and FOXO1N208A,H212R) in the presence or absence of FSH (7.5 IU/ml) as mentioned above. (H-J) Quantification of MAP1LC3B-II accumulation, SQSTM1 degradation, and MTOR dephosphorylation. TUBA1A served as the control for loading. *P < 0.05 (** P < 0.01) vs. the non-plasmid control without FSH treatment. ## P < 0.01 vs. FOXO1-WT-transfected group without FSH treatment. & P>0.05 vs. FOXO1T24A,S253D,S316A (ADA)-transfected group without FSH treatment. δ Represents P<0.05 (δδ Represents P < 0.01) vs. FOXO1N208A,H212R (DBD)-transfected group without FSH treatment. (K) qRT-PCR was performed to measure the mRNA levels of autophagy-related (Atg) genes in GCs with the indicated treatments as described above. Data represent mean ± S.E; n = 3 in each group. ** Represents P<0.01 compared with nonplasmid control. # Represents P < 0.05 (## Represents P < 0.01) compared with FOXO1-WT (W) group. NS Represents P > 0.05 compared with the FOXO1T24A,S253D,S316A (ADA) group. (L) Cell viability was determined by CCK-8 assay in GCs with enforced expression of FOXO1-WT or FOXO1T24A,S253D,S316A upon FSH (7.5 IU/ml) treatment. ** Represents P < 0.01 compared with the non-plasmid control without FSH treatment. ## Represents P < 0.01 compared with the FOXO1-WT (W)-transfected group without FSH treatment. δ Represents P > 0.05 compared with the FOXO1T24A,S253D,S316A (ADA)-transfected group without FSH treatment.
FSH antagonizes oxidative injury in GCs by inhibiting FOXO1-acetylation-dependent autophagy
Using immunoblotting of the autophagy-specific markers, including MAP1LC3B-II accumulation, SQSTM1 degradation, and MTOR dephosphorylation, we found that the FOXO1 mutant lacking DNA-binding capacity (FOXO1N208A,H212R) also led to a significant autophagic induction in GCs, which was blocked by FSH treatment (, 9A and Fig. S11A to C). Correspondingly, cell death triggered by FOXO1N208A,H212R was remarkably reduced in the presence of FSH (). These results indicated that FOXO1-induced autophagic death might be suppressed by FSH via an extra mechanism that is independent of FOXO1 transcriptional activity. Indeed, emerging evidence suggests that acetylated FOXO1 might facilitate the process of autophagy.Citation48 We thus tested the effects of FSH on FOXO1 acetylation upon oxidative stress. As shown in , cells with 1 or 2 h of H2O2 incubation displayed an evident increase in acetylated FOXO1, which was maintained at significantly lower levels following FSH treatment. By contrast, enhanced expression of the deacetylase SIRT1 was observed in GCs treated with FSH, consistent with an earlier report in which FSH increased SIRT1 expression in porcine ovarian cells.Citation63 To investigate the role of FOXO1 acetylation in FSH-mediated regulation of FOXO1 transcription independent autophagy, we treated GCs with either sirtinol (SIRT1 inhibitor) or SRT1720 (SIRT1 activator) during enforced expression of FOXO1N208A,H212R. As shown in , sirtinol-induced acetylation of FOXO1 promoted MAP1LC3B-II accumulation, SQSTM1 degradation, and BECN1 expression. Conversely, inhibition of FOXO1 acetylation by SRT1720 blocked the autophagic induction. Notably, FSH and SRT1720 revealed a similar level of suppression in both FOXO1 acetylation and autophagy, but FSH could not further decrease the autophagic signals in GCs pretreated with the deacetylase activator. In contrast, FSH failed to inhibit autophagy when FOXO1 were constitutively acetylated following sirtinol treatment. Thus, these data further demonstrated that FSH represses FOXO1 acetylation-dependent autophagy in GCs.
Figure 9. FSH inhibits oxidative stress-induced GC autophagy by regulating the acetylation status of FOXO1. (A) Different Flag-tagged FOXO1-expressing vectors, including FOXO1-WT (WT), FOXO1T24A,S253D,S316A (ADA), and FOXO1N208A,H212R (DBD), were transfected into GCs. 24 h later, cell lysates were collected to determine the protein levels of MAP1LC3B, SQSTM1 and p-MTOR using western blotting. TUBA1A served as the control for loading. (B) Cell viability was measured by CCK-8 assay in GCs transfected with FOXO1 expression plasmids upon FSH (7.5 IU/ml) treatment. Data represent mean ± S.E; n = 3. ** Represents P < 0.01 compared with the non-plasmid control. ## Represents P < 0.01 compared with the FOXO1-WT group. and& Represents P < 0.01 compared with the FOXO1N208A,H212R (DBD) group. NPC, non-plasmid control; BP, blank plasmid. (C) After incubation with 200 μM H2O2 for 1 h, GCs were washed in PBS, and then cultured in serum-free medium containing 7.5 IU/ml FSH for 1–2 h. The protein level of acetylated FOXO1 (Ac-FOXO1) and the deacetylase SIRT1 was determined by western blotting. (D and E) The relative expression of Ac-FOXO1 and SIRT1 were quantified using densitometric analysis. Data represent mean ± S.E; n = 3. **Represents P < 0.01 compared with the control group. # Represents P > 0.05 compared with the control group. (F) GCs transfected with FOXO1N208A,H212R plasmid for 24 h were incubated with 200 μM H2O2 for 1 h, rinsed in PBS, and cultured with serum-free medium in the presence or absence of 7.5 IU/ml FSH, 100 μM sirtinol or 100 μM SRT1720 as indicated. The expression of Ac-FOXO1, MAP1LC3B, SQSTM1 and BECN1 was then detected by western blotting. (G to J) Quantification of FOXO1 acetylation, MAP1LC3B-II accumulation, SQSTM1 degradation, and BECN1 expression. TUBA1A served as a loading control. Data represent mean ± S.E; n = 3. *Represents P < 0.05 (**Represents P<0.01) compared with the nontreatment control. δδ, P < 0.01; NS, not significant, P > 0.05.
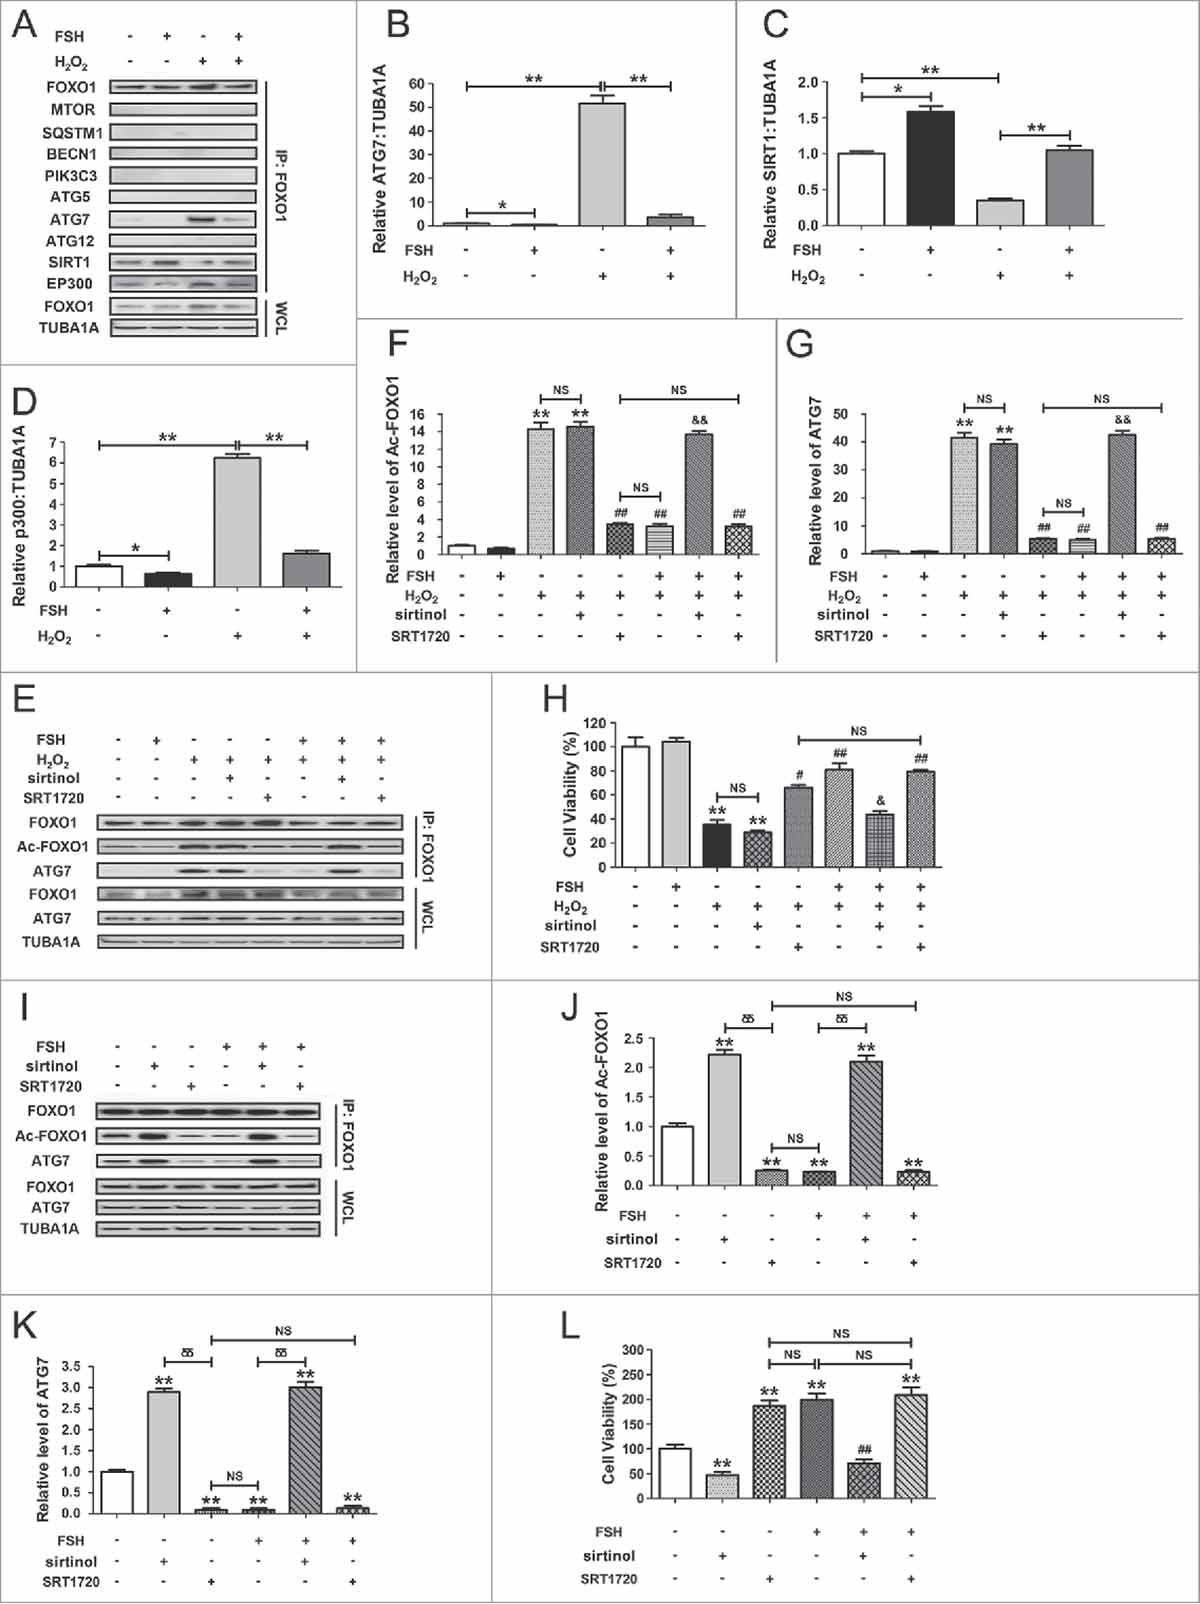
We next examined whether acetylated FOXO1 interacted with autophagy-associated proteins, SIRT1 or the acetyltransferase EP300/p300. GCs exposed to FSH after H2O2 incubation were collected for coimmunoprecipitation with MTOR, SQSTM1, BECN1, PIK3C3, ATG5, ATG7, ATG12, SIRT1 and EP300. As shown in , of the 7 autophagy-related (ATG) proteins, only ATG7 interacted with FOXO1 upon oxidative stimulation. Conversely, FSH markedly repressed ATG7-FOXO1 interaction following H2O2 exposure. Meanwhile, FSH blocked H2O2-induced FOXO1 acetylation as suggested by increased binding affinity of FOXO1 to SIRT1 in contrast with EP300, indicating that the acetylation status of FOXO1 modified via the deacetylase and acetyltransferase might be required for FSH-modulated interaction between FOXO1 and ATG7 during oxidative stress. Using coimmunoprecipitation, we further confirmed the effects of FOXO1 acetylation and deacetylation on FOXO1-ATG7 interaction in FSH-treated GCs after H2O2 incubation. As shown in , inhibition of H2O2-induced FOXO1 acetylation by FSH blocked the formation of FOXO1-ATG7 complex. Compared with FSH treatment, antagonizing FOXO1 acetylation with SRT1720 displayed a similar level of suppression in FOXO1-ATG7 interaction, which could not be further impaired by FSH in SRT1720-pretreated GCs. However, FSH failed to prohibit the interaction between constitutively acetylated FOXO1 and ATG7 in the presence of sirtinol. In accordance with this, both FSH and SRT1720 significantly restrained the downregulation of GC viability by oxidative stress, whereas enforced FOXO1 acetylation by sirtinol abolished FSH-induced GC survival (). Considering that the H2O2-triggered upregulation of endogenous FOXO1 and ATG7 might also affect their binding capacity, we transfected GCs with FOXO1N208A,H212R. Equal amounts of FOXO1 and/or ATG7 protein levels were observed in each treatment group (), enabling us to specify the effects of FOXO1-ATG7 interaction without differences in their expression. Using coimmunoprecipitation (), we obtained very similar results as mentioned in , indicating that FSH directly blocked the binding of FOXO1 and ATG7 via inhibiting FOXO1 acetylation. Moreover, by determining cell viability under the same conditions (), we further demonstrated that FSH-mediated FOXO1 deacetylation and the resulting disassembly of the FOXO1-ATG7 complex might be required for GC protection against oxidative stress-induced autophagic death.
Figure 10. Inhibition of FOXO1 acetylation by FSH reduces autophagic GC death under oxidative stress conditions. (A) Primary cultured GCs treated with or without H2O2 (200 μM) for 1 h were then washed in PBS, and grown in serum-free medium supplemented with or without FSH (7.5 IU/ml). 2 h later, the cell lysates were collected for coimmunoprecipitation with anti-FOXO1, followed by probing with anti-MTOR, SQSTM1, BECN1, PIK3C3, ATG5, ATG7, ATG12, SIRT1, and EP300. WCL, whole-cell lysates. IP, immunoprecipitation. (B to D) The amount of coimmunoprecipitated ATG7, SIRT1 and EP300 for each IP reaction was normalized to TUBA1A content in the whole-cell lysates (input). Data represent mean ± S.E; n = 3. *P < 0.05; **P < 0.01. (E to H) GCs were exposed to 200 μM H2O2 for 1 h, rinsed in PBS, and cultured for 2 h with serum-free medium in the presence or absence of 7.5 IU/ml FSH, 100 μM sirtinol or 100 μM SRT1720 as indicated. Cells were then processed for coimmunoprecipitation (E to G) or CCK-8 assay (H). For immunoprecipitation, the cell lysates were precipitated with anti-FOXO1, and probed with anti-Ac-FOXO1 or anti-ATG7. The protein levels of Ac-FOXO1 and ATG7 in the immunoprecipitates were quantified as described above. Data represent mean ± S.E; n = 3. **Represents P < 0.01 compared with the control group. # Represents P < 0.05 (## Represents P < 0.01) compared with H2O2-only-treated cells. & Represents P < 0.05 (and& Represents P < 0.01) compared with the H2O2+FSH group. NS, not significant, P > 0.05. (I) GCs transfected with FOXO1N208A,H212R plasmid for 24 h were treated with or without 7.5 IU/ml FSH in the presence or absence of 100 μM sirtinol or 100 μM SRT1720 as indicated. 2 h later, cell lysates were extracted for co-immunoprecipitation with anti-FOXO1, followed by probing with anti-Ac-FOXO1 or anti-ATG7. (J and K) The amount of Ac-FOXO1 and ATG7 in the immunoprecipitates was quantified as mentioned above. ** Represents P < 0.01 compared with non treatment control. δδ, P < 0.01; NS, not significant, P > 0.05. (L) Cell viability was determined by CCK-8 assay in GCs treated with FSH (7.5 IU/ml), sirtinol (100 μM) or SRT1720 (100 μM) following enforced expression of FOXO1N208A,H212R. Data represent mean ± S.E; n = 3. ** Represents P < 0.01 compared with the FOXO1N208A,H212R (DBD) group. ## Represents P < 0.01 compared with the FOXO1N208A,H212R (DBD)+FSH group. NS, not significant, P > 0.05.
Discussion
Accelerated metabolism occurs in rapidly proliferating GCs within developing follicles, leading to increased ROS production.Citation64 Alcohol, radiation, and smoking, as well as pathologic conditions including malnutrition and obesity, also generate high ROS levels in follicular GCs.Citation15 ROS accumulation induces oxidative damage to ovarian GCs, hence prompting the onset of follicular atresia and relevant anovulatory disorders, such as polycystic ovary syndrome and premature ovarian failure.Citation15 FSH, a major survival factor for antral follicles, has been suggested to improve GC resistance to oxidative stress during follicular atresia.Citation26 In this study, we proposed a novel role of FSH in protecting ovarian GCs from oxidative injury via suppressing autophagy. As reported, basal autophagy facilitates cellular homeostasis by eliminating and recycling misfolded proteins or defective organelles, whereas overstimulated autophagy triggers extensive degradation of the required components for cell survival.Citation65 Our findings showed that FSH restrains a detrimental autophagic response to protect the GCs.
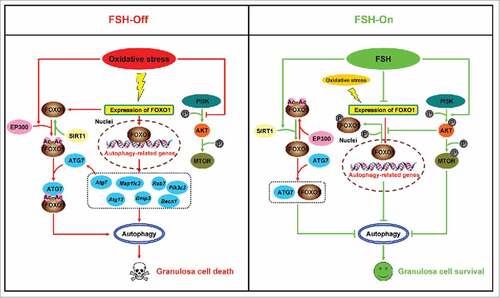
Based on our data from in vivo and in vitro models, the present study demonstrated that FSH (1) activates the PI3K-AKT-MTOR signaling cascade to suppress autophagy, (2) inhibits FOXO1 expression and its nuclear translocation via the PI3K-AKT pathway, which in turn blocked the induction of downstream proautophagic genes, and (3) protects GCs from autophagic death by blocking acetylation of FOXO1 and its binding to ATG7 under oxidative stress conditions. Collectively, repression of autophagy, downregulation of FOXO1 transcriptional activity, and deacetylation of FOXO1 by FSH might represent an essential adaptive strategy for maintaining GC survival against oxidative injury ().
Figure 11. A schematic model of autophagy regulation by FSH in GCs suffering oxidative stress.
There is accumulating evidence that altered autophagy contributes to cell survival or cell death upon stress stimuli,Citation66 but few studies have investigated its role in FSH-induced GC protection during oxidative stress. In this study, we assessed whether cell death repressed by FSH was dependent on the inhibition of autophagy using autophagy inhibitors and small interfering RNAs against Becn1 and Atg7, all of which can abrogate autophagic induction. Markedly, treatment with both inhibitors, and RNAi treatment restored the viability of H2O2-treated GCs. Consistently, FSH revealed the approximate level of suppression in oxidative stress-induced cell death. Notably, FSH failed to further improve GC survival when cellular autophagy was blocked. Considering that chronic H2O2 incubation triggers apoptosis in GCs,Citation53 we also determined whether the preventive effects of FSH on oxidative injury correlated with apoptosis inhibition in the early stages of H2O2-induced GC death. However, according to the current study together with our previous results,Citation57 no obvious involvement of apoptotic PCD had been detected in these processes. Nevertheless, our data suggest that FSH preferentially inhibits a lethal form of autophagy, which might be independent of apoptosis in GCs suffering short-term oxidative stress.
It remains inconclusive whether FSH affects the antioxidant capacity of GCs. Work from others indicates that FSH might increase GSH content and reduce ROS production in cultured rat follicles.Citation67 However, as suggested by our previous data, the level of oxidative stress was not significantly altered in mouse ovarian GCs following FSH treatment.Citation26 In accordance with this, the current study also showed that FSH did not decrease H2O2-induced ROS accumulation in primary cultured GCs (Fig. S3). Thus, our findings implicate a specific regulation of GC autophagy by FSH without scavenging oxidative stress.
Both the MAPKs and PI3K-AKT have been identified as downstream pathways of FSH signaling in promoting GC survival,Citation27 although their relative contributions to FSH-modulated autophagy are not well understood. Our results showed that the PI3K-AKT pathway was activated by FSH in GCs to protect against autophagic PCD via inhibiting the expression of several representative Atg genes, which was correlated with impaired formation of autophagasomes, as well as relieved GC injury upon oxidative stress. MAPK-related kinases, such as MAPK8/9/10, MAPK1/3 and MAPK14, regulate autophagy activity,Citation68,Citation69 stress resistance,Citation70 and FSH response.Citation71 However, no definitive evidence for the involvement of either MAPK1/3 or MAPK14 was observed in the autophagic response following FSH treatment. Taken together, this work first demonstrates the role of FSH-PI3K-AKT axis in antagonizing oxidative stress-induced autophagic GC death.
In some types of mammalian cells, the PI3K-AKT pathway inhibits autophagy via activating MTOR, a major negative regulator of autophagy.Citation72-Citation74 However, there is no report about what response MTOR will take when FSH treated GCs experience oxidative stress. Here, we found that the suppression of MTOR activity by FSH deprivation or inhibitors against PI3K-AKT and MTOR, both promoted autophagy induction, followed by a significant restoration of GC death upon oxidative stress. Thus, these findings suggested that the inhibition of autophagic death through the PI3K-AKT-MTOR axis is responsible for FSH-mediated GC protection from oxidative injury.
FSH influences ovarian functions in part through repressing FOXO1.Citation49,Citation50 Previous studies show that FSH attenuates the inhibitory effects of FOXO1 on GC proliferation and estrogen secretion, whereas enforced FOXO1 activation in GCs blocks FSH-induced upregulation of genes required for sterol or steroid and lipid production.Citation49,Citation50 Further investigations suggest the role of FOXO1 in preventing GC differentiation by downregulating the expression of CCND2 (cyclin D2), EREG (epiregulin), NR5A1/steroidogenic factor-1, CYP19A1/aromatase cytochrome P-450, and INHA/inhibin-α.Citation51 These results indicate that the suppression of FOXO1 by FSH might be essential for triggering GC differentiation or proliferation.Citation27 However, it remains unclear whether FOXO1 contributes to FSH-mediated regulation of GC autophagy during oxidative stress. In this study, we observed that the FSH-PI3K-AKT axis significantly restrained autophagy and/or oxidative injury in mouse ovarian GCs, which was associated with dampened Foxo1 expression. To our knowledge, this is the first evidence showing that FSH inhibits autophagic GC death in a FOXO1-dependent manner.
The transcriptional activity and subcellular localization of FOXO1 are tightly controlled by its posttranslational modifications, including phosphorylation, acetylation and ubiquitination.Citation44 FOXO1 reveals distinct functions in the cellular response to different environmental stimuli, and directs tissue or cell-specific expression of target genes.Citation61 Particularly, in vascular endothelial cells, the translocation of FOXO1 from the cytoplasm to the nucleus triggered by oxidative stress, promotes cell death.Citation75 Conversely, the starvation-induced FOXO1 nuclear transportation maintains cardiomyocyte survival by upregulating the expression of several Atg genes.Citation46 However, the specific function of FOXO1 in the defense mechanisms of FSH against oxidative injury (particularly the autophagic death), has previously not been described in GCs. Here, we showed that FSH signaling deactivates FOXO1 via the PI3K-AKT pathway, leading to phosphorylation and nuclear exclusion of FOXO1, thus preventing the induction of its downstream Atg genes as suggested,,Citation47,Citation61,Citation62 and thereby protecting GCs from oxidative stress-induced autophagic death. These findings might provide the first evidence involving FOXO1 transcriptional activity in the FSH-modulated autophagic response within GCs.
Previous studies have implicated the transcriptional activator FOXO1 in the regulation of transcription-independent autophagy.Citation48,Citation76,Citation77 Particularly, acetylation of FOXO1 might be essential for the induction of autophagy.Citation48 Stresses such as nutrient deprivation and oxidative stimulation not only attenuate AKT-mediated phosphorylation of FOXO1, but also induce its dissociation from sirtuin proteins and subsequent acetylation by the acetyltransferase EP300.Citation78,Citation79 SIRT1, a mammalian ortholog of the NAD-dependent protein deacetylase Sir2, catalyzes the deacetylation of FOXO1 protein under stress conditions,Citation80 as overexpressed SIRT1 efficiently decreases FOXO1 acetylation upon oxidative stress.Citation81 However, few further clues exist regarding the inactivation of FOXO1 in response to FSH signaling via an acetylation-dependent manner. According to our data, FSH diminished H2O2-triggered FOXO1 acetylation as indicated by the enhanced interaction between FOXO1 and SIRT1 in contrast with EP300. In other words, our results first demonstrate that the FSH-modulated acetylation of FOXO1 might be attributed to the counterbalance of deacetylase and acetyltransferase in GCs suffering oxidative stress.
We also showed that ATG7, which is required for the conversion of MAP1LC3-I to MAP1LC3-II,Citation82 plays an important role in the modulation of FOXO1-dependent autophagy by FSH. Under the oxidative stress conditions that facilitated autophagic induction, FSH downregulated the expression of Atg7 via repressing FOXO1 transcriptional activity ( and ). In addition, we confirmed that ATG7 interacted with acetylated FOXO1, which was correlated with enhanced autophagic activity in response to oxidative stress. This result was consistent with an earlier report that increased binding affinity of ATG7 to acetylated FOXO1 accelerates the autophagic process.Citation48 In contrast, FSH blocked the formation of the FOXO1-ATG7 complex by inhibiting FOXO1 acetylation, followed by decreased autophagy as well as the restoration of GC viability upon oxidative stimulation. To our knowledge, these data might represent the first evidence demonstrating that impaired acetylation of FOXO1 and its dissociation from ATG7 contribute to FSH-mediated GC protection against oxidative stress-induced autophagic death. As for this study, these findings perfectly explain that when FOXO1 DNA binding activity was blocked, there was still a significant induction of autophagy, which should have been attenuated by FSH-mediated transcriptional inhibition of Atg genes.
Our previous work has suggested that FOXO1 plays a critical role in triggering apoptosis when mouse GCs are exposed to chronic oxidative stimulation.Citation53 However, the present study showed that FOXO1 is also required for the induction of apoptosis-independent autophagic death in the early stages of oxidative stress-induced GC injury. Further research should be conducted to investigate the key functions of FOXO1 in the switch mechanisms of autophagic and apoptotic GC death. Moreover, it remains to be determined whether, among the diverse cellular responses to FOXO1, there are specific subsets of target effectors under different circumstances. These studies might provide novel insights into the exact regulation modes of FOXO1-dependent GC injury upon FSH stimulation during oxidative stress-induced follicular atresia.
In summary, by examining the FSH-FOXO1 signaling mechanism in suppressing oxidative stress-induced autophagic GC death, we reveal a potential therapeutic target for the clinical treatment of oxidative injury-related anovulatory disorders, such as polycystic ovarian syndrome and premature ovarian failure.
Materials and methods
Animals and collection of ovaries
All mice procedures were performed in accordance with the guidelines of the Animal Research Institute Committee at Nanjing Agricultural University. Three-wk-old female ICR mice (Qing Long Shan Co., Animal Breeding Center) were injected intraperitoneally (i.p.) with 10 IU of pregnant mare serum gonadotropin (PMSG; Ningbo Second Hormone Factory). After 48 h, all mice were killed by cervical dislocation, and their ovaries were harvested for in vitro experiments. During the course before killing the animals, 5 mice were housed per cage in a temperature-controlled (22 ± 2°C) room with a 12/12 h light/dark cycle (lights on from 7:00 a.m. to 7:00 p.m.), and had ad libitum access to water and food. The induction of oxidative stress in ovarian GCs was achieved by a well-established in vivo model.Citation53 Briefly, female ICR mice were injected i.p. with PBS (Gibco, 20012) or 3-nitropropionic acid (3-NP; Sigma-Aldrich, N5636). 3-NP was dissolved in PBS to a concentration of 10 mg/ml (pH 7.4) and administered by i.p. injection twice daily for 5 d at a dose of 50 mg/kg. FSH (Ningbo Second Hormone Factory) was then injected i.p. (10 IU per mouse) 1.5 h before ovary collection. The protocols of all animal experiments were approved by the Committee of Animal Research Institute, Nanjing Agricultural University, China. In this study, unless otherwise specified, GCs equal to GCs from ovarian follicles.
Cell culture and treatments
Primary GCs were isolated from ovarian follicles and cultured as described previously.Citation53 Briefly, superovulated mouse ovaries were harvested and individually transferred into 35-mm Petri dishes containing PBS, and GCs were collected by follicle puncture under a surgical dissecting microscope (Olympus, SZ51, Tokyo, Japan). The cells were cultured in DMEM/F-12 (1:1) medium (Life Technologies, 11330–057) supplemented with 10% fetal bovine serum (Gibco, 10270) and 100 units/ml penicillin plus 100 μg/ml streptomycin (Gibco, 15140) for 4 d at 37°C with 5% CO2. For FSH treatment, GCs exposed to 200 μM H2O2 (Sigma-Aldrich, 216763–100ML) for 0 h (none) or 1 h were washed in PBS, and cultured with serum-free DMEM/F-12 containing 7.5 IU/ml FSH (Sigma-Aldrich, F4021) in the presence or absence of pepstatin A and E64 (10 μg/ml; Selleck, S7381 and S7379, respectively), perifosine (10 μM; Selleck, S1037), SB203580 (20 μM; Selleck, S1077), U0126 (3 μM; Selleck, S1102), torin 1 (100 nM; Selleck, S2827), sirtinol (100 μM; Selleck, S2804) or SRT1720 (100 μM; Selleck, S1129) for 0.5, 1, 2, or 3 h as indicated. In some experiments, GCs were treated with chloroquine (50 μM; Sigma-Aldrich, C6628) or Z-VAD-FMK (50 μM; Selleck, S7023) for 0.5, 1, 2, or 3 h following 1 h of H2O2 incubation. For RNA interference, GCs were transfected with Becn1 siRNA (Santa Cruz Biotechnology, sc-29798), Atg7 siRNA (Santa Cruz Biotechnology, sc-41448), Akt1/2 siRNA (Santa Cruz Biotechnology, sc-43610), Mtor siRNA (Santa Cruz Biotechnology, sc-35410), Foxo1 siRNA (Santa Cruz Biotechnology, sc-35383), or scrambled control siRNA (Santa Cruz Biotechnology, sc-37007) for 24 h. After incubation with 200 μM H2O2 for 0 (none) or 1 h, GCs were rinsed using PBS, and cultured in medium with or without 7.5 IU/ml FSH for another 2 h. For an overexpression experiment, the Flag-tagged FOXO1 plasmids or an empty control plasmid were individually transfected into GCs, and the cells were then cultured for 24 h before they were used for the next assay.
Antibodies
Antibodies against MTOR (2983), phospho-MTOR (5536), AKT1/2/3 (9272), phospho-AKT (4060), FOXO1 (2880), phospho-FOXO1 (9461), FLAG (2908) and PIK3C3 (phosphoinositide-3-kinase, class 3; 4263) were obtained from Cell Signaling Technology. SQSTM1 antibody (ab101266) was purchased from Abcam. Anti-MAP1LC3B (L7543) and anti-TUBA1A (T5168) were bought from Sigma-Aldrich. Antibodies against BECN1 (sc-11427), ATG5 (sc-133158), ATG7 (sc-33211), ATG12 (sc-68884), SIRT1 (sc-74465), EP300/p300 (sc-585) and acetylated FOXO1 (sc-49437) were purchased from Santa Cruz Biotechnology.
Enforced expression of FOXO1 plasmids
Because the induction of endogenous FOXO1 within GCs is affected by both oxidative stress and FSH treatment, several resistant forms of exogenous FOXO1 were overexpressed in some experiments. Plasmids for FLAG-tagged FOXO1, including a wild-type (WT) FOXO1 (FOXO1-WT; Addgene, 12148), a constitutively active FOXO1 (FOXO1-ADA/FOXO1T24A,S253D,S316A, the 3 mutations were Threonine 24 to Alanine, and Serine 253 to Aspartate, and Serine 316 to Alanine; Addgene, 12149), and a FOXO1 mutant without DNA-binding activity (FOXO1-DBD/FOXO1N208A,H212R; Addgene, 17555) were kindly provided by Prof. Domenico Accili (Columbia University Medical Center). The transfection was performed using Lipofectamine 3000 reagent (Invitrogen, L3000015) according to the manufacturer's instructions.
The AddGene description of the DBD mutant FOXO1N208A,H212R (AddGene Catalog ID, Plasmid #17555) suggests that the plasmid includes only the DBD mutations. However, the reference that AddGene quotes (Kitamura et al. 2007 JCI, also attached) seems to indicate a DBD-FOXO1-ADA mutant. Thus we contacted the depositing lab and the AddGene website. They replied that the ADA mutations are not present in this plasmid. The Addgene QC sequencing results further confirmed that this plasmid is a “wild-type” version plus only the 2 DBD mutations. To prevent any confusion in the future, we provide a clarifying statement that the wild-type FOXO1 is used for the DBD mutations in Plasmid #17555.
Cell viability analysis
Cell viability was determined by WST-8 assay using Cell Counting Kit-8 (CCK-8; Dojindo, CK04). This colorimetric strategy is based on the reduction of tetrazolium salt (WST-8) to a colored formazan product by active dehydrogenases in viable cells. The amount of formazan is therefore directly proportional to the percentage of living cells. Our experimental procedures were performed according to the manufacturer's instructions. Briefly, GCs seeded in 96-well plates were grown to 90% confluency following 4 d of culture, and exposed to the indicated treatments as mentioned above. To measure cell viability, 10 μL of CCK-8 assay solution was added to each well containing 100 μL medium, and incubated at 37°C in a humid atmosphere containing 5% CO2 for 2 h. Living cells promoted the formation of formazan, which was detectable at 450 nm under a microplate reader (Bio-Rad, Hercules, CA, USA).
Detection of intracellular ROS
Levels of ROS (reactive oxygen species) in GCs were determined by measuring the oxidative conversion of dihydroethidium bromide into ethidium bromide, which emits red fluorescence when bound to DNA within the nuclei. The experiments were performed using the GENMED Intracellular ROS Red Fluorescence Determination Kit (GENMED, GMS10111.1) according to the manufacturer's instructions. Images were captured using a laser-scanning confocal microscope (Carl Zeiss, Zeiss LSM 710 META, need address). The fluorescence intensity was evaluated in each GC with ImageJ 1.42q software (NIH).
Visualization of acidic vesicular organelles with acridine orange staining
The autophagic process involves the sequestration of cytoplasmic components into double-membrane vacuoles, which is represented by the formation of acidic vesicular organelles (AVOs).Citation56 To detect AVOs formation, a vital staining with acridine orange (Sigma-Aldrich, A8097) was performed as described previously.Citation83 Briefly, after the desired treatments, GCs were incubated with 1 μg/ml acridine orange at 37°C for 15 min. Acridine orange-stained cells fluoresce bright green, whereas the acidic compartments appear bright red.Citation60 The green (510 to 530 nm) and red (650 nm) fluorescence emission from representative fields were visualized using a Zeiss LSM 710 laser-scanning confocal microscope.
RNA interference
siRNA specific for Becn1 (sc-29798), Atg7 (sc-41448), Akt1/2 (sc-43610), Mtor (sc-35410), Foxo1 (sc-35383) or scrambled control siRNA (sc-37007) were purchased from Santa Cruz Biotechnology. Transfection of siRNA was performed with Lipofectamine 3000 reagent (Invitrogen, L3000015) according to the manufacturer's directions.
Measurement of autophagosome formation
GCs were seeded on coverslips in 12-well plates, and grown to 70% to 80% confluency before a Lipofectamine 3000-mediated transfection with the green fluorescent protein (GFP)-tagged microtubule-associated protein 1 light chain 3 β (MAP1LC3B) expression plasmid (GFP-MAP1LC3B), which was a gift from Prof. Jiyong Zhou (Zhejiang University). Forty-eight h later, cells were exposed to the desired treatments, and the cytoplasmic GFP-MAP1LC3B puncta were then observed under a laser-scanning confocal microscope (Carl Zeiss, Zeiss LSM 710 META). Experiments were performed in triplicate, and the punctate GFP-MAP1LC3B was counted in 3 randomly selected fields in each coverslip.
Quantitative RT-PCR (qRT-PCR)
Total RNA and cDNA were prepared from cultured GCs as described.Citation53 Real-time PCR was performed with SYBR Premix Ex Taq (Takara, DRR420A) and gene specific primers (see Table S1 for primer sequences) on the ABI StepOne PCR system (Applied Biosystems, Foster City, CA, USA). Expression data were normalized to the amount of Actb expressed. Melting curves were analyzed to verify amplification specificity.
Immunofluorescence
GCs grown on coverslips were processed following a standard protocol. Briefly, the cell climbing sheets were rinsed using PBS, and fixed with 4% paraformaldehyde (Sigma-Aldrich, P-6148) for 1 h. After washing in PBS, cells were permeabilized with 0.5% Triton X-100 (Sigma-Aldrich, T8787) for 10 min at 4°C, and blocked with 1% BSA (Sigma-Aldrich, A3059) for 1 h at room temperature. The coverslips were then incubated with anti-FOXO1 (Cell Signaling Technology, 2880) at 1:100 dilutions for 1 h at 37°C, and stained for another 1 h with a diluted (1:200) goat anti-rabbit IgG conjugated with Alexa Fluor 488 (Invitrogen, A-11008). After the cell nuclei were counterstained with DAPI (Sigma-Aldrich, D8417) for 20 min, the coverslips were mounted on glass slides, and observed under a laser-scanning confocal microscope (Carl Zeiss, Zeiss LSM 710 META).
Transmission electron microscopy
Cultured GCs were collected using a cell scraper and then centrifuged at 1300 g for 15 min. Specimens for transmission electron microscopy were prepared under the supervision from the Biological Electron Microscope Facility of Nanjing Agricultural University. Briefly, the cell pellets (∼1 mm3) were fixed with 2.5% (vol/vol) glutaraldehyde (Sigma-Aldrich, 49626) in PBS (4°C, pH 7.4, 0.1 M) for 24 h. Samples were then postfixed with 1% OsO4 (Sigma-Aldrich, 75632) for 1.5 h, washed, and stained in 3% aqueous uranyl acetate for 1 h. After washing, specimens were dehydrated with a graded alcohol series, embedded in Araldite (Sigma-Aldrich, A3183), sectioned to approximately 50 nm, and mounted on Formvar-coated grids (Ted Pella, 01700-F). The ultrathin sections were contrasted with 0.3% lead citrate, examined and photographed under a transmission electron microscope (Hitachi, Hitachi H-7650, Tokyo, Japan).
Immunohistochemistry
Paraformaldehyde (4%)-fixed mice ovaries were embedded in paraffin, sectioned with a microtome onto glass slides, deparaffinized, and rehydrated before antigen unmasking by microwave heating of the tissue in citrate buffer (10 mM sodium citrate [R&D Systems, 3161500G], 0.05% Tween-20 [Sigma-Aldrich, P1379], pH 6.0) for 0.5 h. After 10 min of H2O2 (3%; Sigma-Aldrich, 216763–100ML) incubation to quench intracellular peroxidase activity, sections of the ovaries were blocked in 1% BSA, probed with the indicated primary antibodies and corresponding secondary antibodies with biotin labeling. The immunoreactivity was visualized using diaminobenzidine (Sigma-Aldrich, D8001) staining. The cell nuclei were counterstained with hematoxylin (Sigma-Aldrich, H9627) before dehydration.
Western blotting
An equal amount of total protein (15 μg) was fractionated by electrophoresis on a 12% Express Plus™ PAGE gel (Genscript, M01210) and transferred to polyvinylidene difluoride membrane (Millipore, HATF09025) by electroblotting. The nonspecific binding sites were blocked for 1 h with TBST (Solarbio, T1085) containing 5% BSA, followed by incubation with the indicated primary antibodies diluted (1:1000) in blocking solution overnight at 4°C. After washing in TBST 3 times, the membranes were incubated at room temperature for 1 h with a diluted (1:2000) secondary antibody against rabbit (Cell Signaling Technology, 7074) or mouse (Cell Signaling Technology, 7076). Protein bands were visualized by exposure to an enhanced chemiluminescence detection system imager (Fujifilm, LAS-4000, Tokyo, Japan) using the West Dura Duration substrate reagent (Thermo, 34080). The relative intensity of each band was normalized to that of TUBA1A respectively.
Coimmunoprecipitation assay
After washing with PBS, GCs were lysed in 1 ml cold IP lysis buffer (Pierce, 26149) containing a complete protease inhibitor cocktail (Roche, 04693132001). Whole-cell lysates were used for immunoprecipitation with anti-FOXO1 (Cell Signaling Technology, 2880). We added 2 to 4 μg of antibody to 1 mL of cell lysate, which was incubated at 4°C overnight. After the addition of Protein A/G Plus Agarose beads (Beyotime, P2012), the incubation was continued for 1 h. Immunoprecipitates were extensively washed with lysis buffer, eluted with SDS loading buffer (SunShineBio, SN336–2) by boiling for 5 min, and then processed for immunoblotting with the indicated antibodies. The amount of coimmunoprecipitated proteins for each IP reaction was normalized to TUBA1A content in the whole-cell lysates (input).
Statistical analysis
All experiments were performed at least 3 times. Data were presented as means ± SE. Statistical significance was analyzed using the SPSS version 16.0 software (SPSS, IL, USA). The pairwise comparisons were assessed by the Student t test, and values of P < 0.05 were considered significant.
Abbreviations
| Ac | = | acetylated |
| ADA | = | the 3 AKT phosphorylation sites of FOXO1 are mutated |
| AKT/protein kinase B | = | thymoma viral proto-oncogene |
| ATG | = | autophagy related |
| ATG7 | = | autophagy-related 7 |
| ATG12 | = | autophagy-related 12 |
| AVOs | = | acidic vesicular organelles |
| BECN1 | = | Beclin 1 |
| BP | = | blank plasmid |
| CCK-8 | = | Cell Counting Kit-8 |
| CL | = | chloroquine |
| DBD | = | a FOXO1 mutant without DNA-binding activity, FOXO1N208A,H212R |
| EP300 | = | E1A binding protein p300 |
| FOXO1 | = | forkhead box O1 |
| FSH | = | follicle-stimulating hormone |
| GCs | = | granulosa cell |
| i.p. | = | intraperitoneal |
| IP | = | immunoprecipitation |
| MAP1LC3B | = | microtubule-associated protein 1 light chain 3 β |
| MTOR | = | mechanistic target of rapamycin (serine/threonine kinase) |
| MAPK1,/3 | = | mitogen-activated protein kinase 1/3 |
| MAPK14 | = | mitogen-activated protein kinase 14 |
| NPC | = | non-plasmid control |
| 3-NP | = | 3-nitropropionic acid |
| oxLDL | = | oxidized low-density lipoprotein |
| PBS | = | phosphate-buffered saline |
| PCD | = | programmed cell death |
| P.E | = | pepstatin A and E64 |
| PIK3C3 | = | phosphoinositide-3-kinase, class 3 |
| PMSG | = | pregnant mare serum gonadotropin |
| PI3K | = | class I phosphoinositide 3-kinase |
| ROS | = | reactive oxygen species |
| siRNA | = | small interfering RNA |
| SQSTM1 | = | sequestosome 1 |
| TEM | = | transmission electron microscopy |
| WCL | = | whole-cell lysates |
Disclosure of potential conflicts of interest
The authors declare that they have no conflicts of interest.
Supplemental_Material.doc
Download MS Word (10.8 MB)Acknowledgments
We thank Prof. Domenico Accili (Columbia University Medical Center) for provision of the FOXO1 expression vectors FLAG-FOXO1-WT (pCMV5), FLAG-FOXO1-ADA (pCMV5), and FLAG-FOXO1-DBD (pCMV5). The green fluorescent protein (GFP)-tagged microtubule-associated protein 1 light chain 3 β (MAP1LC3B) expression plasmid was kindly provided by Prof. Jiyong Zhou (Zhejiang University). We also thank the Biological Electron Microscope Facility of Nanjing Agricultural University for their technical assistance in the transmission electron microscopy.
Funding
This work was supported by the National Natural Science Foundation of China (No. 31601939), the Fundamental Research Funds for the Central Universities (No. KJQN201705), Key Program of National Natural Science Foundation of China (No. 31630072), Natural Science Foundation of Jiangsu Province (No. BK20150664), the key Project of Chinese National Programs for Fundamental Research and Development (973 program no. 2014CB138502), China Postdoctoral Science Special Foundation (No. 2016T90476), China Postdoctoral Science Foundation (No. 2015M581818), Postdoctoral Fund in Jiangsu Province (No. 1501047A).
Related Research Data
References
- Baker TG. A Quantitative and Cytological Study of Germ Cells in Human Ovaries. Proc R Soc Lond B Biol Sci 1963; 158:417-33
- Faddy MJ, Gosden RG, Gougeon A, Richardson SJ, Nelson JF. Accelerated disappearance of ovarian follicles in mid-life: implications for forecasting menopause. Hum Reprod 1992; 7:1342-6; PMID:1291557; https://doi.org/10.1093/oxfordjournals.humrep.a137570
- Matsuda-Minehata F, Inoue N, Goto Y, Manabe N. The regulation of ovarian granulosa cell death by pro- and anti-apoptotic molecules. J Reprod Dev 2006; 52:695-705; PMID:16926526; https://doi.org/10.1262/jrd.18069
- Tilly JL, Tilly KI, Kenton ML, Johnson AL. Expression of members of the bcl-2 gene family in the immature rat ovary: equine chorionic gonadotropin-mediated inhibition of granulosa cell apoptosis is associated with decreased bax and constitutive bcl-2 and bcl-xlong messenger ribonucleic acid levels. Endocrinology 1995; 136:232-41; PMID:7828536; https://doi.org/10.1210/endo.136.1.7828536
- Duerrschmidt N, Zabirnyk O, Nowicki M, Ricken A, Hmeidan FA, Blumenauer V, Borlak J, Spanel-Borowski K. Lectin-like oxidized low-density lipoprotein receptor-1-mediated autophagy in human granulosa cells as an alternative of programmed cell death. Endocrinology 2006; 147:3851-60; PMID:16690797; https://doi.org/10.1210/en.2006-0088
- Serke H, Vilser C, Nowicki M, Hmeidan FA, Blumenauer V, Hummitzsch K, Lösche A, Spanel-Borowski K. Granulosa cell subtypes respond by autophagy or cell death to oxLDL-dependent activation of the oxidized lipoprotein receptor 1 and toll-like 4 receptor. Autophagy 2009; 5:991-1003; PMID:19730000; https://doi.org/10.4161/auto.5.7.9507
- Vilser C, Hueller H, Nowicki M, Hmeidan FA, Blumenauer V, Spanel-Borowski K. The variable expression of lectin-like oxidized low-density lipoprotein receptor (LOX-1) and signs of autophagy and apoptosis in freshly harvested human granulosa cells depend on gonadotropin dose, age, and body weight. Fertil Steril 2010; 93:2706-15; PMID:19342029; https://doi.org/10.1016/j.fertnstert.2009.02.038
- D'Herde K, De Prest B, Roels F. Subtypes of active cell death in the granulosa of ovarian atretic follicles in the quail (Coturnix coturnix japonica). Reprod Nutr Dev 1996; 36:175-89; PMID:8663915; https://doi.org/10.1051/rnd:19960203
- Escobar ML, Echeverria OM, Ortiz R, Vazquez-Nin GH. Combined apoptosis and autophagy, the process that eliminates the oocytes of atretic follicles in immature rats. Apoptosis 2008; 13:1253-66; PMID:18690537; https://doi.org/10.1007/s10495-008-0248-z
- Choi JY, Jo MW, Lee EY, Yoon BK, Choi DS. The role of autophagy in follicular development and atresia in rat granulosa cells. Fertil Steril 2010; 93:2532-7; PMID:20149359; https://doi.org/10.1016/j.fertnstert.2009.11.021
- Choi J, Jo M, Lee E, Choi D. Induction of apoptotic cell death via accumulation of autophagosomes in rat granulosa cells. Fertil Steril 2011; 95:1482-6; PMID:20630503; https://doi.org/10.1016/j.fertnstert.2010.06.006
- Uttara B, Singh AV, Zamboni P, Mahajan RT. Oxidative stress and neurodegenerative diseases: a review of upstream and downstream antioxidant therapeutic options. Curr Neuropharmacol 2009; 7:65-74; PMID:19721819; https://doi.org/10.2174/157015909787602823
- Stier A, Reichert S, Massemin S, Bize P, Criscuolo F. Constraint and cost of oxidative stress on reproduction: correlative evidence in laboratory mice and review of the literature. Front Zool 2012; 9:37; PMID:23268929; https://doi.org/10.1186/1742-9994-9-37
- Murdoch WJ. Inhibition by oestradiol of oxidative stress-induced apoptosis in pig ovarian tissues. J Reprod Fertil 1998; 114:127-30; PMID:9875164; https://doi.org/10.1530/jrf.0.1140127
- Agarwal A, Aponte-Mellado A, Premkumar BJ, Shaman A, Gupta S. The effects of oxidative stress on female reproduction: a review. Reprod Biol Endocrinol 2012; 10:49; PMID:22748101; https://doi.org/10.1186/1477-7827-10-49
- Tilly JL, Tilly KI. Inhibitors of oxidative stress mimic the ability of follicle-stimulating hormone to suppress apoptosis in cultured rat ovarian follicles. Endocrinology 1995; 136:242-52; PMID:7828537; https://doi.org/10.1210/endo.136.1.7828537
- Gupta RK, Miller KP, Babus JK, Flaws JA. Methoxychlor inhibits growth and induces atresia of antral follicles through an oxidative stress pathway. Toxicol Sci 2006; 93:382-9; PMID:16807286; https://doi.org/10.1093/toxsci/kfl052
- Bras M, Queenan B, Susin SA. Programmed cell death via mitochondria: different modes of dying. Biochemistry (Mosc) 2005; 70:231-9; PMID:15807663; https://doi.org/10.1007/s10541-005-0105-4
- Sinha K, Das J, Pal PB, Sil PC. Oxidative stress: the mitochondria-dependent and mitochondria-independent pathways of apoptosis. Arch Toxicol 2013; 87:1157-80; PMID:23543009; https://doi.org/10.1007/s00204-013-1034-4
- Lee J, Giordano S, Zhang J. Autophagy, mitochondria and oxidative stress: cross-talk and redox signalling. Biochem J 2012; 441:523-40; PMID:22187934; https://doi.org/10.1042/BJ20111451
- Dadakhujaev S, Jung EJ, Noh HS, Hah YS, Kim CJ, Kim DR. Interplay between autophagy and apoptosis in TrkA-induced cell death. Autophagy 2009; 5:103-5; PMID:19115484; https://doi.org/10.4161/auto.5.1.7276
- Pan X, Liu D, Wang J, Zhang X, Yan M, Zhang D, Zhang J, Liu W. Peneciraistin C induces caspase-independent autophagic cell death through mitochondrial-derived reactive oxygen species production in lung cancer cells. Cancer Sci 2013; 104:1476-82; PMID:23952056; https://doi.org/10.1111/cas.12253
- Chen Y, McMillan-Ward E, Kong J, Israels SJ, Gibson SB. Oxidative stress induces autophagic cell death independent of apoptosis in transformed and cancer cells. Cell Death Differ 2008; 15:171-82; PMID:17917680; https://doi.org/10.1038/sj.cdd.4402233
- Peluso JJ, Steger RW. Role of FSH in regulating granulosa cell division and follicular atresia in rats. J Reprod Fertil 1978; 54:275-8; PMID:722676; https://doi.org/10.1530/jrf.0.0540275
- Chun SY, Eisenhauer KM, Minami S, Billig H, Perlas E, Hsueh AJ. Hormonal regulation of apoptosis in early antral follicles: follicle-stimulating hormone as a major survival factor. Endocrinology 1996; 137:1447-56; PMID:8625923; https://doi.org/10.1210/endo.137.4.8625923
- Shen M, Liu Z, Li B, Teng Y, Zhang J, Tang Y, Sun SC, Liu H. Involvement of FoxO1 in the effects of follicle-stimulating hormone on inhibition of apoptosis in mouse granulosa cells. Cell Death Dis 2014; 5:e1475; PMID:25321482; https://doi.org/10.1038/cddis.2014.400
- Hunzicker-Dunn M, Maizels ET. FSH signaling pathways in immature granulosa cells that regulate target gene expression: branching out from protein kinase A. Cell Signal 2006; 18:1351-9; PMID:16616457; https://doi.org/10.1016/j.cellsig.2006.02.011
- Sasson R, Dantes A, Tajima K, Amsterdam A. Novel genes modulated by FSH in normal and immortalized FSH-responsive cells: new insights into the mechanism of FSH action. FASEB J 2003; 17:1256-66; PMID:12832290; https://doi.org/10.1096/fj.02-0740com
- Grieshaber NA, Ko C, Grieshaber SS, Ji I, Ji TH. Follicle-stimulating hormone-responsive cytoskeletal genes in rat granulosa cells: class I beta-tubulin, tropomyosin-4, and kinesin heavy chain. Endocrinology 2003; 144:29-39; PMID:12488327
- Jung CH, Ro SH, Cao J, Otto NM, Kim DH. mTOR regulation of autophagy. FEBS Lett 2010; 584:1287-95; PMID:20083114
- Hay N, Sonenberg N. Upstream and downstream of mTOR. Genes Dev 2004; 18:1926-45; PMID:15314020
- Reynolds THt, Bodine SC, Lawrence JC, Jr. Control of Ser2448 phosphorylation in the mammalian target of rapamycin by insulin and skeletal muscle load. J Biol Chem 2002; 277:17657-62; PMID:11884412
- Sekulic A, Hudson CC, Homme JL, Yin P, Otterness DM, Karnitz LM, Abraham RT. A direct linkage between the phosphoinositide 3-kinase-AKT signaling pathway and the mammalian target of rapamycin in mitogen-stimulated and transformed cells. Cancer Res 2000; 60:3504-13; PMID:10910062
- Codogno P, Meijer AJ. Autophagy and signaling: their role in cell survival and cell death. Cell Death Differ 2005; 12(Suppl 2):1509-18; PMID:16247498
- Ravikumar B, Stewart A, Kita H, Kato K, Duden R, Rubinsztein DC. Raised intracellular glucose concentrations reduce aggregation and cell death caused by mutant huntingtin exon 1 by decreasing mTOR phosphorylation and inducing autophagy. Hum Mol Genet 2003; 12:985-94; PMID:12700167
- Alam H, Maizels ET, Park Y, Ghaey S, Feiger ZJ, Chandel NS, Hunzicker-Dunn M. Follicle-stimulating hormone activation of hypoxia-inducible factor-1 by the phosphatidylinositol 3-kinase/AKT/Ras homolog enriched in brain (Rheb)/mammalian target of rapamycin (mTOR) pathway is necessary for induction of select protein markers of follicular differentiation. J Biol Chem 2004; 279:19431-40; PMID:14982927
- Hunzicker-Dunn ME, Lopez-Biladeau B, Law NC, Fiedler SE, Carr DW, Maizels ET. PKA and GAB2 play central roles in the FSH signaling pathway to PI3K and AKT in ovarian granulosa cells. Proc Natl Acad Sci U S A 2012; 109:E2979-88; PMID:23045700
- Choi J, Jo M, Lee E, Choi D. AKT is involved in granulosa cell autophagy regulation via mTOR signaling during rat follicular development and atresia. Reproduction 2014; 147:73-80; PMID:24131573; https://doi.org/10.1530/REP-13-0386
- Nemoto S, Finkel T. Redox regulation of forkhead proteins through a p66shc-dependent signaling pathway. Science 2002; 295:2450-2; PMID:11884717; https://doi.org/10.1126/science.1069004
- Accili D, Arden KC. FoxOs at the crossroads of cellular metabolism, differentiation, and transformation. Cell 2004; 117:421-6; PMID:15137936; https://doi.org/10.1016/S0092-8674(04)00452-0
- Barthel A, Schmoll D, Unterman TG. FoxO proteins in insulin action and metabolism. Trends Endocrinol Metab 2005; 16:183-9; PMID:15860415; https://doi.org/10.1016/j.tem.2005.03.010
- Greer EL, Brunet A. FOXO transcription factors at the interface between longevity and tumor suppression. Oncogene 2005; 24:7410-25; PMID:16288288; https://doi.org/10.1038/sj.onc.1209086
- Salih DA, Brunet A. FoxO transcription factors in the maintenance of cellular homeostasis during aging. Curr Opin Cell Biol 2008; 20:126-36; PMID:18394876; https://doi.org/10.1016/j.ceb.2008.02.005
- Huang H, Tindall DJ. Dynamic FoxO transcription factors. J Cell Sci 2007; 120:2479-87; PMID:17646672; https://doi.org/10.1242/jcs.001222
- Lam EWF, Shah K, Brosens JJ. The diversity of sex steroid action: the role of micro-RNAs and FOXO transcription factors in cycling endometrium and cancer. Journal of Endocrinology 2012; 212:13-25; PMID:21382987; https://doi.org/10.1530/JOE-10-0480
- Sengupta A, Molkentin JD, Yutzey KE. FoxO transcription factors promote autophagy in cardiomyocytes. J Biol Chem 2009; 284:28319-31; PMID:19696026; https://doi.org/10.1074/jbc.M109.024406
- Hariharan N, Maejima Y, Nakae J, Paik J, Depinho RA, Sadoshima J. Deacetylation of FoxO by Sirt1 Plays an Essential Role in Mediating Starvation-Induced Autophagy in Cardiac Myocytes. Circ Res 2010; 107:1470-82; PMID:20947830; https://doi.org/10.1161/CIRCRESAHA.110.227371
- Zhao Y, Yang J, Liao W, Liu X, Zhang H, Wang S, Wang D, Feng J, Yu L, Zhu WG. Cytosolic FoxO1 is essential for the induction of autophagy and tumour suppressor activity. Nat Cell Biol 2010; 12:665-75; PMID:20543840; https://doi.org/10.1038/ncb2069
- Liu Z, Rudd MD, Hernandez-Gonzalez I, Gonzalez-Robayna I, Fan HY, Zeleznik AJ, Richards JS. FSH and FOXO1 regulate genes in the sterol/steroid and lipid biosynthetic pathways in granulosa cells. Mol Endocrinol 2009; 23:649-61; PMID:19196834; https://doi.org/10.1210/me.2008-0412
- Fan HY, O'Connor A, Shitanaka M, Shimada M, Liu Z, Richards JS. Beta-catenin (CTNNB1) promotes preovulatory follicular development but represses LH-mediated ovulation and luteinization. Mol Endocrinol 2010; 24:1529-42; PMID:20610534; https://doi.org/10.1210/me.2010-0141
- Park Y, Maizels ET, Feiger ZJ, Alam H, Peters CA, Woodruff TK, Unterman TG, Lee EJ, Jameson JL, Hunzicker-Dunn M. Induction of cyclin D2 in rat granulosa cells requires FSH-dependent relief from FOXO1 repression coupled with positive signals from Smad. J Biol Chem 2005; 280:9135-48; PMID:15613482; https://doi.org/10.1074/jbc.M409486200
- Li X, Jiang Y, Wang Z, Liu G, Hutz RJ, Liu W, Xie Z, Shi F. Regulation of FoxO1 transcription factor by nitric oxide and cyclic GMP in cultured rat granulosa cells. Zoolog Sci 2005; 22:1339-46; PMID:16462106; https://doi.org/10.2108/zsj.22.1339
- Shen M, Lin F, Zhang J, Tang Y, Chen WK, Liu H. Involvement of the up-regulated FoxO1 expression in follicular granulosa cell apoptosis induced by oxidative stress. J Biol Chem 2012; 287:25727-40; PMID:22669940; https://doi.org/10.1074/jbc.M112.349902
- Liot G, Bossy B, Lubitz S, Kushnareva Y, Sejbuk N, Bossy-Wetzel E. Complex II inhibition by 3-NP causes mitochondrial fragmentation and neuronal cell death via an NMDA- and ROS-dependent pathway. Cell Death Differ 2009; 16:899-909; PMID:19300456; https://doi.org/10.1038/cdd.2009.22
- Wang XN, Greenwald GS. Synergistic effects of steroids with FSH on folliculogenesis, steroidogenesis and FSH- and hCG-receptors in hypophysectomized mice. J Reprod Fertil 1993; 99:403-13; PMID:8107022; https://doi.org/10.1530/jrf.0.0990403
- Paglin S, Hollister T, Delohery T, Hackett N, McMahill M, Sphicas E, Domingo D, Yahalom J. A novel response of cancer cells to radiation involves autophagy and formation of acidic vesicles. Cancer Res 2001; 61:439-44; PMID:11212227
- Shen M, Jiang Y, Guan Z, Cao Y, Sun SC, Liu H. FSH protects mouse granulosa cells from oxidative damage by repressing mitophagy. Sci Rep 2016; 6:38090; PMID:27901103; https://doi.org/10.1038/srep38090
- Marino G, Lopez-Otin C. Autophagy: molecular mechanisms, physiological functions and relevance in human pathology. Cell Mol Life Sci 2004; 61:1439-54; PMID:15197469; https://doi.org/10.1007/s00018-004-4012-4
- Levine B, Yuan J. Autophagy in cell death: an innocent convict? J Clin Invest 2005; 115:2679-88; PMID:16200202; https://doi.org/10.1172/JCI26390
- Klionsky DJ, Abdelmohsen K, Abe A, Abedin MJ, Abeliovich H, Acevedo Arozena A, Adachi H, Adams CM, Adams PD, Adeli K, et al. Guidelines for the use and interpretation of assays for monitoring autophagy (3rd edition). Autophagy 2016; 12:1-222; PMID:26799652; https://doi.org/10.1080/15548627.2015.1100356
- Webb AE, Brunet A. FOXO transcription factors: key regulators of cellular quality control. Trends Biochem Sci 2014; 39:159-69; PMID:24630600; https://doi.org/10.1016/j.tibs.2014.02.003
- van der Vos KE, Coffer PJ. The Extending Network of FOXO Transcriptional Target Genes. Antioxid Redox Signal 2011; 14:579-92; https://doi.org/10.1089/ars.2010.3419
- Sirotkin AV, Alexa R, Dekanová P, Kádasi A, Štochmalová A, Grossmann R, Alwasel SA, Harrath AH. The mTOR system can affect basic porcine ovarian cell functions and mediate the effect of ovarian hormonal regulators. Int J Pharmacol 2015; 11:570-578; https://doi.org/10.3923/ijp.2015.570.578
- Agarwal A, Gupta S, Sharma RK. Role of oxidative stress in female reproduction. Reprod Biol Endocrinol 2005; 3:28; PMID:16018814; https://doi.org/10.1186/1477-7827-3-28
- Levine B, Kroemer G. Autophagy in the pathogenesis of disease. Cell 2008; 132:27-42; PMID:18191218; https://doi.org/10.1016/j.cell.2007.12.018
- Kroemer G, Levine B. Autophagic cell death: the story of a misnomer. Nat Rev Mol Cell Biol 2008; 9:1004-10; PMID:18971948; https://doi.org/10.1038/nrm2529
- Tsai-Turton M, Luderer U. Opposing effects of glutathione depletion and follicle-stimulating hormone on reactive oxygen species and apoptosis in cultured preovulatory rat follicles. Endocrinology 2006; 147:1224-36; PMID:16339198; https://doi.org/10.1210/en.2005-1281
- Corcelle E, Djerbi N, Mari M, Nebout M, Fiorini C, Fenichel P, Hofman P, Poujeol P, Mograbi B. Control of the autophagy maturation step by the MAPK ERK and p38: lessons from environmental carcinogens. Autophagy 2007; 3:57-9; PMID:17102581; https://doi.org/10.4161/auto.3424
- Shimizu S, Konishi A, Nishida Y, Mizuta T, Nishina H, Yamamoto A, Tsujimoto Y. Involvement of JNK in the regulation of autophagic cell death. Oncogene 2010; 29:2070-82; PMID:20101227; https://doi.org/10.1038/onc.2009.487
- Chang L, Karin M. Mammalian MAP kinase signalling cascades. Nature 2001; 410:37-40; PMID:11242034; https://doi.org/10.1038/35065000
- Cottom J, Salvador LM, Maizels ET, Reierstad S, Park Y, Carr DW, Davare MA, Hell JW, Palmer SS, Dent P, et al. Follicle-stimulating hormone activates extracellular signal-regulated kinase but not extracellular signal-regulated kinase kinase through a 100-kDa phosphotyrosine phosphatase. J Biol Chem 2003; 278:7167-79; PMID:12493768; https://doi.org/10.1074/jbc.M203901200
- Li C, Liu H, Sun Y, Wang H, Guo F, Rao S, Deng J, Zhang Y, Miao Y, Guo C, et al. PAMAM nanoparticles promote acute lung injury by inducing autophagic cell death through the Akt-TSC2-mTOR signaling pathway. J Mol Cell Biol 2009; 1:37-45; PMID:19516051; https://doi.org/10.1093/jmcb/mjp002
- Qin L, Wang Z, Tao L, Wang Y. ER stress negatively regulates AKT/TSC/mTOR pathway to enhance autophagy. Autophagy 2010; 6:239-47; PMID:20104019; https://doi.org/10.4161/auto.6.2.11062
- Zha X, Hu Z, He S, Wang F, Shen H, Zhang H. TSC1/TSC2 inactivation inhibits AKT through mTORC1-dependent up-regulation of STAT3-PTEN cascade. Cancer Lett 2011; 313:211-7; PMID:22055460; https://doi.org/10.1016/j.canlet.2011.09.006
- Han J, Pan XY, Xu Y, Xiao Y, An Y, Tie L, Pan Y, Li XJ. Curcumin induces autophagy to protect vascular endothelial cell survival from oxidative stress damage. Autophagy 2012; 8:812-25; PMID:22622204; https://doi.org/10.4161/auto.19471
- Zhao Y, Wang L, Yang J, Zhang P, Ma K, Zhou J, Liao W, Zhu WG. Anti-neoplastic activity of the cytosolic FoxO1 results from autophagic cell death. Autophagy 2010; 6:988-90; PMID:20798610; https://doi.org/10.4161/auto.6.7.13289
- Medema RH, Jaattela M. Cytosolic FoxO1: alive and killing. Nat Cell Biol 2010; 12:642-3; PMID:20596046; https://doi.org/10.1038/ncb0710-642
- Brunet A, Bonni A, Zigmond MJ, Lin MZ, Juo P, Hu LS, Anderson MJ, Arden KC, Blenis J, Greenberg ME. Akt promotes cell survival by phosphorylating and inhibiting a Forkhead transcription factor. Cell 1999; 96:857-68; PMID:10102273; https://doi.org/10.1016/S0092-8674(00)80595-4
- Daitoku H, Sakamaki J, Fukamizu A. Regulation of FoxO transcription factors by acetylation and protein-protein interactions. Biochim Biophys Acta 2011; 1813:1954-60; PMID:21396404; https://doi.org/10.1016/j.bbamcr.2011.03.001
- Brunet A, Sweeney LB, Sturgill JF, Chua KF, Greer PL, Lin Y, Tran H, Ross SE, Mostoslavsky R, Cohen HY, et al. Stress-dependent regulation of FOXO transcription factors by the SIRT1 deacetylase. Science 2004; 303:2011-5; PMID:14976264; https://doi.org/10.1126/science.1094637
- Salminen A, Kaarniranta K, Kauppinen A. Crosstalk between Oxidative Stress and SIRT1: Impact on the Aging Process. Int J Mol Sci 2013; 14:3834-59; PMID:23434668; https://doi.org/10.3390/ijms14023834
- Kabeya Y, Mizushima N, Yamamoto A, Oshitani-Okamoto S, Ohsumi Y, Yoshimori T. LC3, GABARAP and GATE16 localize to autophagosomal membrane depending on form-II formation. J Cell Sci 2004; 117:2805-12; PMID:15169837; https://doi.org/10.1242/jcs.01131
- Kanzawa T, Kondo Y, Ito H, Kondo S, Germano I. Induction of autophagic cell death in malignant glioma cells by arsenic trioxide. Cancer Res 2003; 63:2103-8; PMID:12727826