
ABSTRACT
In the advanced stages of cancer, autophagy is thought to promote tumor progression through its ability to mitigate various cellular stresses. However, the details of how autophagy is homeostatically regulated in such tumors are unknown. Here, we report that NUPR1 (nuclear protein 1, transcriptional regulator), a transcriptional coregulator, is aberrantly expressed in a subset of cancer cells and predicts low overall survival rates for lung cancer patients. NUPR1 regulates the late stages of autolysosome processing through the induction of the SNARE protein SNAP25, which forms a complex with the lysosomal SNARE-associated protein VAMP8. NUPR1 depletion deregulates autophagic flux and impairs autolysosomal clearance, inducing massive cytoplasmic vacuolization and premature senescence in vitro and tumor suppression in vivo. Collectively, our data show that NUPR1 is a potent regulator of autolysosomal dynamics and is required for the progression of some epithelial cancers.
Abbreviations
| ACTB | = | actin beta |
| AO | = | acridine orange |
| Atg | = | autophagy related |
| BafA1 | = | bafilomycin A1 |
| BECN1 | = | Beclin 1 |
| BoNT/A LC | = | botulinum neurotoxin serotype A light chain |
| BrdU | = | 5-bromodeoxyuridine |
| CDKN1A/p21Cip1 | = | cyclin dependent kinase inhibitor 1A |
| CDKN1B/p27Kip1 | = | cyclin dependent kinase inhibitor 1B |
| CDKN2A/p16INK4a | = | cyclin dependent kinase inhibitor 2A |
| ChIP | = | chromatin immunoprecipitation |
| CQ | = | chloroquine |
| DAPI | = | 4’,6-diamidino-2-phenylindole |
| ER | = | endoplasmic reticulum |
| FBS | = | fetal bovine serum |
| GAPDH | = | glyceraldehyde-3-phosphate dehydrogenase |
| GFP | = | green fluorescent protein |
| GLB1 | = | galactosidase beta 1 |
| H&E | = | hematoxylin and eosin |
| IHC | = | immunohistochemistry |
| MAP1LC3B/LC3B | = | microtubule-associated protein 1 light chain 3 B |
| MTOR | = | mechanistic target of rapamycin |
| NUPR1 | = | nuclear protein 1, transcriptional regulator |
| NSCLC | = | non-small cell lung cancer |
| PBS | = | phosphate-buffered saline |
| PLA | = | proximity ligation assay |
| Rluc | = | Renilla reniformis luciferase |
| RT | = | room temperature |
| SCID | = | severe combined immunodeficient |
| shRNA | = | short hairpin RNA |
| SNAP25 | = | synaptosome associated protein 25 |
| SNARE | = | soluble N-ethylmaleimide-sensitive factor attachment protein receptor |
| SQSTM1/p62 | = | sequestosome 1 |
| TEM | = | transmission electron microscopy |
| TORC1 | = | TOR complex 1 |
| VAMP8 | = | vesicle associated membrane protein 8 |
Introduction
Cancer cells live under conditions of continual environmental and metabolic stress because of their deregulated growth, abnormal mitochondrial function, loss of matrix anchorage, and unreliable energy and biosynthetic substrate supply. Macroautophagy (referred to throughout as autophagy) is a tightly regulated lysosome-mediated degradation process, and the products of this process are exported from autolysosomes for cellular recycling in response to such stresses [Citation1-3]. When this recycling process fails to clear degraded products, the resultant disordered autophagic flux can disrupt cellular homeostasis and redirect cell fate in tumor cells. Despite considerable efforts to determine the mechanisms of autolysosome regulation, it is unclear how dysregulation of autolysosomes affects cell fate decisions in cancer cells within such hostile microenvironments [Citation4-6].
NUPR1/p8/Com-1 (Nuclear protein 1, transcriptional regulator) is a pleiotropic transcriptional cofactor strongly induced by several cellular stresses, and it has the ability to mediate both tumor suppression and tumor development [Citation7-9]. For example, NUPR1 is implicated in drug resistance mechanisms in pancreatic ductal adenocarcinoma and breast cancer, and genetic inactivation of NUPR1 results in KRASG12D-induced senescence in a mouse model [Citation10,Citation11]. Silencing of NUPR1 in pancreatic or hepatocellular cancer cells decreases migration and invasion, presumably through its target genes, ATF4 (activating transcription factor 4), DDIT3/CHOP (DNA damage inducible transcript 3) and TRIB3 (tribbles pseudokinase 3), acting via endoplasmic reticulum (ER) stress activation [Citation12-14]. Conversely, NUPR1 also acts as a putative tumor suppressor in prostate cancer, ovarian cancer and synovial sarcoma [Citation15-17]. Recent studies have also demonstrated that this multifunctional protein influences cell fate determination, which implicates it as a potential therapeutic target [Citation18,Citation19] Although substantial information exists regarding NUPR1 in the setting of gene regulation, the role of NUPR1 in the autolysosomal process is uncharacterized. We hypothesized that NUPR1 may facilitate the ability of cancer cells to survive in a stressful state. Here, we investigate the molecular and clinical consequences of NUPR1 activity as a critical transcriptional regulator controlling autolysosomal dynamics in lung cancers.
Results
NUPR1 expression is correlated with low overall survival rates in human NSCLC
Using immunohistochemistry (IHC), we studied NUPR1 expression in 118 clinical non-small cell lung cancer (NSCLC) specimens and their adjacent tissues. Variable expressions of NUPR1 were found in lung tumor tissues, whereas cancer-adjacent lung tissues did not express significant levels of NUPR1 (A). Quantification of staining on a scale of 0 to 10 showed that high NUPR1 expression correlated significantly with poor overall survival rates (P = 0.00025) (B). Subjects whose tumors had low NUPR1 expression had strikingly longer survival time than those whose tumors had high NUPR1 expression levels, with median survivals of 28 mo (high NUPR1) versus more than 80 mo (low NUPR1) (B). NUPR1 staining intensity did not correlate with TNM status, smoking history, age, or gender (Table S1). Consistent with this observation, lung cancer cell lines also showed different expression of NUPR1 both at the mRNA and protein levels (C and D, respectively). Normal human bronchial epithelial cells expressed undetectable levels of NUPR1 (C and D, respectively). These differential expression levels of NUPR1 may correlate with its context-specific induction, as previously reported [Citation8].
Figure 1. NUPR1 depletion induces autolysosomal vacuolization. (A) IHC staining with anti-NUPR1 was performed on 118 NSCLC samples and their adjacent tissues. Representative images show moderate (case #1) and strong (case #2) NUPR1 staining. Scale bars: 10 µm. (B) Kaplan-Meier overall survival rates for 118 NSCLC subjects with low (0 to 5.0 staining scores, blue lines; n = 68) versus high (5.1 to 10.0 staining scores, green lines; n = 50) NUPR1 expression. Median survival was more than 80 mo for the low NUPR1 expression group versus 28 mo for the high NUPR1 expression group (P = 0.00025). (C and D) Relative NUPR1 transcript levels determined by quantitative RT-PCR shown as fold differences relative to GAPDH in a normal lung epithelial cell line (NHBE) and cancer cell lines as indicated in (C), and the NUPR1 level determined by western blotting is shown with ACTB as a loading control in (D). (E) Western blot confirming the knockdown efficiency of 3 shRNAs against human NUPR1, with fire fly luciferase as a negative control (con) and GAPDH as an internal control. (F) Representative phase-contrast micrographs of cell morphological changes following the expression of NUPR1 shRNA in A549 cells. Large and small vacuoles can be seen scattered throughout the cytoplasm in NUPR1-knockdown cells (arrows). The right graph shows the quantification of the number of vacuoles per cell from 3 different experiments (mean ± SEM). Lower panels show transmission electron micrographs (TEM) images of A549 control and A549-NUPR1 shRNA cells at the indicated magnifications. NUPR1 depletion leads to accumulation of dilated autolysosomes (arrows). The right image is a higher magnification of the indicated portion, showing electron-dense material within autolysosomes. (G) Light micrographs and electron micrographs of cell morphology following NUPR1 depletion in H1299, H460 and H1155 cells. Arrows show the vacuole membrane location.
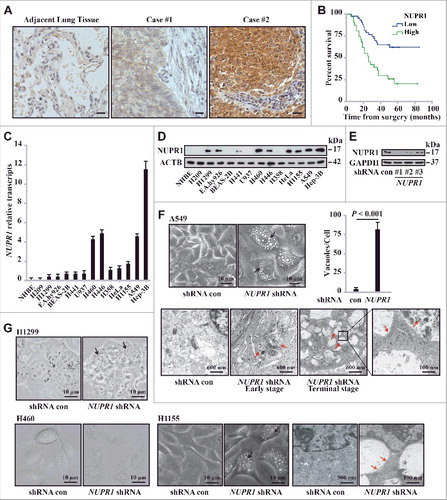
NUPR1 depletion induces autolysosomal vacuolization
To assess the role of NUPR1 in lung cancer cells, we stably transduced lung adenocarcinoma A549 cells with lentiviral particles encoding 3 independent small hairpin RNAs (shRNAs) targeting NUPR1 or an irrelevant firefly luciferase shRNA (hereafter referred to as control, con, Table S2). The efficiency of these shRNAs in repressing this protein was assessed by western blotting (E). Intriguingly, extensive perinuclear accumulation of phase-lucent vacuoles after NUPR1 depletion, but not in the shRNA control, was observed in A549 cells (F) as well as in H460 and H1155 lung cancer cells (G). These changes were confirmed by transmission electron microscopy, which revealed that NUPR1-depleted cells exhibited a typical appearance of pronounced vacuolization of the cytoplasm (F and G). These vacuoles typically contain electron-dense cytoplasmic remnants, consistent with the features of degradative structures within late autolysosomes.
NUPR1 regulates autophagic flux and autolysosomal efflux
To determine whether the vacuoles induced by NUPR1 depletion originate from autolysosome dysfunction, we stably transfected GFP-LC3B (hereafter referred to as GFP-LC3) or tandem-tagged mCherry-GFP-LC3 plasmid into A549 cells to monitor the subcellular localization of LC3. In GFP-LC3 A549 cells, NUPR1 depletion led to the formation of massive vacuoles as well as increased LC3 puncta in a time-dependent manner (A, lower panels and 2B), indicating that autophagic flow is impaired. In mCherry-GFP-LC3 A549 cells, NUPR1 depletion dramatically increased the transition of mCherry-GFP-LC3-positive autophagosomes (yellow puncta) to mCherry-positive, GFP fluorescence-negative autolysosomes (red puncta) (B; see also Movies S1 and S2). The total number of LC3 puncta (yellow and red) in NUPR1-depleted cells per field was almost 3-fold higher than that in control cells and was due entirely to the accumulation of red puncta (B), indicating interference with autolysosomal clearance. Moreover, the movement of vacuoles in the NUPR1-knockdown cells was less active than in the controls (Movies S1 and S2), suggesting that NUPR1 depletion also affects the trafficking of intracellular components.
Figure 2. NUPR1 regulates autophagic flux and autolysosomal efflux. (A) Representative fluorescence images of A549 cells transiently expressing GFP-LC3B, with NUPR1 knockdown as described in the Materials and Methods. Arrows indicate autolysosomes, whereas arrowheads indicate autophagosomes. Bar graph on the right shows the number of GFP-LC3 puncta and vacuoles per cell. Scale bars: 5 µm. (B) Representative images adapted from time-lapse movies of A549-mCherry-GFP-LC3 cells treated with the indicated shRNA. Autophagosomes (arrowheads), yellow puncta; autolysosomes (arrows), red-only puncta. Quantification of the number of LC3 puncta per cell in NUPR1-depleted and control A549 cells (10 cells per group). Scale bars: 10 µm. (C) Immunoblot analysis of LC3B and SQSTM1 levels in A549 and H460 cells expressing shRNAs against NUPR1 used in E, with ACTB/β-actin as a loading control. (D) Cellular morphology after sequential knockdown of ATG5 and/or NUPR1 in A549 cells. The right bar graph shows the number of vacuoles per cell. Error bars represent the SD (n = 10). Scale bars: 10 µm. (E) Immunoblot analysis was performed as in (C) by knockdown of ATG5 and/or NUPR1. The left upper panel shows ATG5 knockdown efficiency. Graph depicts densitometric analysis of protein intensity as indicated, normalized to ACTB levels and expressed as fold change from untreated control (right panel). (F) Representative morphological changes in cellular vacuolization by NUPR1 depletion with or without 5 nM BafA1 treatment as indicated. The right panel is the quantification of the vacuoles per cell shown in the left panel. Scale bars: 5 µm. (G) Cells were sequentially infected with NUPR1 shRNA and treated with 10 nM BafA1. The graph shows the quantification of the LC3B-II:ACTB and SQSTM1:ACTB ratios in the lower panel from 3 different immunoblots (mean ± SEM). (H) Cellular morphology after sequential knockdown of NUPR1 and/or reintroduction of NUPR1 in A549 cells. Reintroduction of NUPR1 after NUPR1 depletion did not rescue the autolysosomal vacuolization phenotype. The right bar graph shows the number of vacuoles per cell. Error bars represent the SD (n = 10). N.S., not significant. Scale bars: 10 µm. (I) Immunoblot analysis of LC3B and SQSTM1 levels in A549 cells as indicated. The right bar graph depicts the densitometric analysis of protein intensity. N.S., not significant.
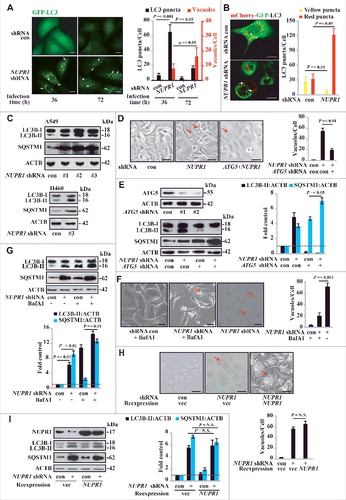
To confirm the dysfunctional accumulation of autolysosomes by NUPR1 depletion, we stained the cells with acridine orange (AO), a lysosomotropic metachromatic fluorochrome, which is used in live cells to monitor the functional status of lysosomes [Citation20]. We found that the autolysosomal process was consistently associated with dotted accumulation of lysosomal AO upon NUPR1 depletion (Figure S1A). Consistent with this scenario, NUPR1 depletion led to increased processing of LC3B-I to LC3B-II and accumulation of SQSTM1 as shown by western blotting (C). Notably, ATG5 depletion to restrain autophagy initiation significantly decreased autolysosomal vacuolization by NUPR1 knockdown (D), indicating that an increased autophagic flux is required for autolysosomal vacuolization by NUPR1 depletion. ATG5 knockdown also significantly mitigated LC3B-I to LC3B-II conversion and increased SQSTM1 accumulation in NUPR1-depleted A549 cells (E).
The morphological changes in NUPR1-knockdown cells were reminiscent of those induced by defects in autolysosomal processing, either an increase in autophagosome-lysosome flow or a decrease in autolysosomal clearance. For simplicity, we refer to autophagic flux as all flow/flux through the autophagic pathway up through the formation of the autolysosome, and autolysosomal efflux as the subsequent release or breakdown of products through complete autolysosomal degradation for recycling. Indeed, in the presence of chloroquine (CQ), a lysosomotropic agent that disturbs lysosomal stability by increasing lysosomal pH, LC3B-II increased and more SQSTM1 accumulated in NUPR1-depleted cells (Figure S1B), supporting an increase in autophagic flux under these conditions. To determine whether the observed accumulation of LC3B-II and SQSTM1 was due solely to an autolysosomal defect, we pretreated cells with bafilomycin A1 (BafA1), an inhibitor of autophagosomal and lysosomal fusion that acts by blocking the activity of the vacuolar-type H+-ATPase required for acidification of autolysosomes [Citation2]. In agreement with the accumulation of LC3B-II and SQSTM1, BafA1 treatment significantly decreased autolysosomal vacuole formation upon NUPR1 depletion (F) and increased GFP-LC3B puncta accumulation (Figure S1C) and LC3B-I to LC3B-II conversion (G). This result suggests that NUPR1 is required for a critical step in late-stage autolysosomal processing. Together, these data indicate that the accumulation of LC3B-II and SQSTM1 upon NUPR1 depletion is due to impaired autolysosomal processing, presumably through increased autophagic flux and decreased autolysosomal efflux.
To test whether the changes upon NUPR1 depletion are irreversible, we reexpressed Flag-tagged NUPR1 following NUPR1 depletion by shRNA (#1), which targets the 3’-UTR of NUPR1 mRNA. Reexpression of NUPR1 did not rescue the phenotype of autolysosomal vacuolization (H), LC3B turnover, or SQSTM1 accumulation in A549 cells (I). Furthermore, in an assay using a Tet-on inducible shRNA targeting NUPR1, NUPR1 expression was fully restored upon withdrawal of doxycycline, but it still did not rescue the vacuolization caused by NUPR1 depletion (Figure S1D). These data indicate that NUPR1 depletion irreversibly impairs the autolysosomal process, suggesting that even transient targeted disruption of this pathway may cause durable effects on cancer cells.
NUPR1 depletion causes premature senescence in vitro and represses tumorigenesis in vivo
Extensive cytoplasmic vacuolization has been associated with the induction of cellular senescence in other contexts [Citation21]. As our data suggested that NUPR1 depletion induces cytoplasmic vacuolization, we subsequently focused on characterizing molecular mechanisms underlying that effect on cell fate decision. In this regard, NUPR1 depletion in A549 or H460 cells caused a marked increase in the number of GLB1 (galactosidase beta 1)-positive cells (A). Consistent with the induction of GLB1, NUPR1 depletion induced G0/G1 cell cycle arrest (B), with significant upregulation of the key cell cycle inhibitors CDKN1A/p21Cip1 and CDKN1B/p27Kip1, but not CDKN2A/p16INK4a (C). NUPR1 knockdown also inhibited cell growth, as evidenced by BrdU incorporation and colony formation assays (D, E and S2C). Importantly, the induction of cellular senescence by NUPR1 depletion was not accompanied by caspase-dependent apoptosis, confirmed by the lack of significant CASP3, CASP7 and CASP9 cleavage (F). Significantly, NUPR1 reexpression following depletion did not decrease CDKN1B levels (G), which is consistent with the permanent effects of NUPR1 depletion. Moreover, NUPR1 depletion mitigated cell migration in a wound-healing assay (Figure S2A). Notably, NUPR1 depletion did not alter cellular ATP content compared to control cells (Figure S2B). These in vitro data showed that NUPR1 depletion resulted in cellular senescence with cell cycle arrest associated with upregulation of CDKN1A and CDKN1B.
Figure 3. NUPR1 depletion causes premature senescence in vitro and represses tumorigenesis in vivo. (A) Representative images of GLB1 activity in NUPR1-depleted and control cells as indicated (left panels). Quantification of GLB1-positive cells was determined in 10 different fields from 3 independent experiments (mean ± SEM) (right panel). Scale bars: 10 µm. (B) NUPR1-depleted A549 cells were collected for cell cycle analysis by flow cytometry. The percentage of cells in G0/G1, S, and G2/M phases from 3 independent experiments is shown (right panel, mean ± SEM). (C) Western blot analysis of the indicated proteins in A549 and H460 cells infected with NUPR1 shRNA, with ACTB as a loading control. (D) Cellular proliferation of control and NUPR1-shRNA A549 cells was assessed using a 5-bromodeoxyuridine (BrdU) assay. The data are represented as the mean ± SEM of 6 experiments. (E) Clonogenic assays performed with control and NUPR1-shRNA A549 cells. A total of 1,500 cells were seeded in 24-well plates and grown for 2 wk. The graph shows the quantification of the mean number of colonies at different time point as indicated. ** P < 0.01 compared to control. (F) Western blot analysis of CASP3, cleaved CASP3, CASP7, CASP9, and ACTB in NUPR1-depleted A549 cells. (G) Western blot analysis of CDKN1B in A549 cells by NUPR1 depletion and/or its reexpression, with ACTB as a loading control. (H) A549 cells with lentivirus-delivered NUPR1 knockdown were subcutaneously implanted into female athymic nude mice (n = 6 for each experimental condition). The tumor image (left panel) on d 24 and tumor growth curve (right panel, mean ± SEM) are shown. ** P < 0.01 compared to control.
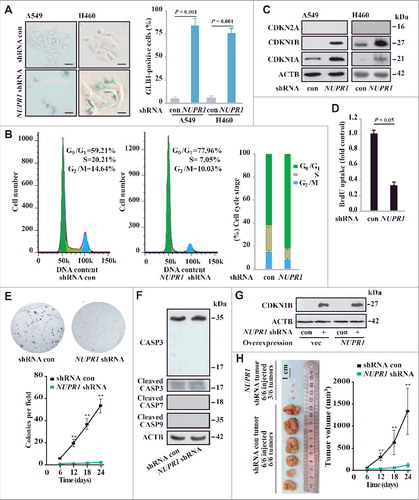
To examine the effect of NUPR1 on tumorigenesis in vivo, we injected NUPR1-depleted lung cancer cells subcutaneously into athymic nude mice. Twenty-four d later, all of the control shRNA cells formed visible xenograft tumors; conversely, NUPR1-depleted cells showed significantly delayed xenograft tumor growth, with only 3 out of 6 tumors detectable (H and S2D). The mean tumor weight of the NUPR1-knockdown tumors was significantly decreased compared to that of controls (0.014 ± 0.002 g, n = 3 versus 1.326 ± 0.598 g, n = 6, P = 0.001) (H). Notably, these knockdown tumors had a more differentiated appearance (Figure S2E) and contained fewer proliferating cell nuclear antigen (PCNA)-positive cells (Figure S2F), which was consistent with the results of an in vitro BrdU incorporation assay. Therefore, in parallel with cellular senescence in vitro, NUPR1 depletion suppresses tumorigenesis in vivo. Our results delineate a previously unrecognized function for autolysosomes in regulating cell cycle progression through a NUPR1-dependent process.
SNAP25 is required for NUPR1-mediated autolysosomal processes
To gain mechanistic insight into the role of NUPR1 in autophagy-lysosomal processing, particularly in autolysosomal efflux, we next assessed the transcriptional profile of the genes involved using RNA sequencing. Knockdown of NUPR1 and subsequent RNA-seq analysis revealed 310 NUPR1-dependent differentially expressed genes, of which 137 were upregulated and 173 were downregulated (A, Tables S3, Table S4, and GSE68873). According to the Gene Ontology project classification, these genes are involved in autophagy and lysosomal processes (ATG9B, LCN2, TPPP3, SNAP25, and SQSTM1), transcription (KLF17, CUX2, ALX4, TCF21, PAX6, HDAC9, and LHX8), signal transduction (GABRG3, GABRQ, IGFBP1, SPTLC3, CA8, TMEM74, and CTGF), and calcium transport (CALB2, CAMK4, and CLIC5) (A). Moreover, intracellular calcium level modulators, such as CALB2 and CAMK4, are associated with the functional autolysosome pathway, similar to the role of CAMKK2 (calcium/calmodulin-dependent kinase kinase 2) in the autophagy pathway [Citation22]. Changes in the expression of genes involved in the autolysosome pathway (RAB26, BECN1, SQSTM1, ATG9B, MTOR, CTSS, and CTSD) were also confirmed by real-time PCR (B) (Table S5), suggesting that NUPR1 performs a unique role in autolysosomal events.
Figure 4. NUPR1 regulates autolysosomal processes through SNAP25. (A) Functional profiling of genes differentially expressed in control A549 cells and NUPR1-knockdown A549 cells. Double-headed arrows indicate 137 genes upregulated (red) and 173 genes downregulated (green) due to NUPR1 depletion. Representative related genes are listed vertically (left) and under each molecular pathway (right). (B) Quantitative RT-PCR was performed to confirm transcriptional changes of the indicated genes identified in the RNA-seq data. RNA levels were normalized to GAPDH and represent the relative fold change compared to the control shRNA samples. The mean ± SEM of 3 replicates is shown. (C) Representative phase-contrast micrographs of cell morphological changes from the indicated treatments in A549 cells. The top left panel shows SNAP25 knockdown efficiency, and the lower left bar graph shows the number of vacuoles per cell. Error bars represent the SD (n = 10). Scale bars: 10 µm. (D) Representative images of GLB1 staining in SNAP25-knockdown and control A549 cells (left 2 panels). Quantification of GLB1-positive cells was determined from 10 different fields, from 3 independent experiments (mean ±SEM) (right panel). Scale bars: 10 µm. (E) Immunoblot analysis of LC3B, SQSTM1, and ACTB in SNAP25-knockdown A549 cells.
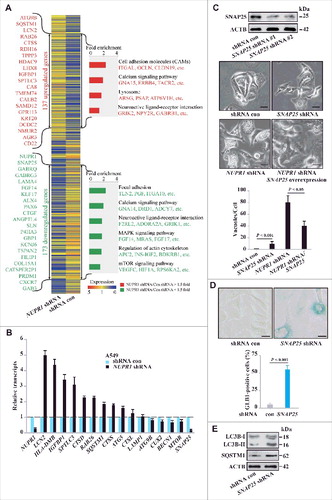
Notably, NUPR1 knockdown caused prominent downregulation of SNAP25 (synaptosome associated protein 25). SNAP25, a member of the soluble N-ethylmaleimide-sensitive factor attachment protein receptor (SNARE) complex, is thought to be required for exocytosis of synaptic vesicles in neurons [Citation23] and control of intracellular vesicular trafficking in cancer cells [Citation24]. Thus, SNAP25 is potentially important for lysosomal trafficking and fusion. We further studied the biological function of SNAP25 in autolysosomal dynamics in A549 cells. Knockdown of SNAP25 induced cytoplasmic vacuolization similar to that observed with NUPR1 knockdown but to a lesser extent (C). Notably, reexpression of SNAP25 rescued the defects in the autolysosome from NUPR1 depletion (C), consistent with a role of SNAP25 downstream of NUPR1 in mediating autolysosomal clearance. SNAP25 depletion also led to cellular senescence in A549 cells (D), again similar to the effect of NUPR1 depletion. Moreover, SNAP25 depletion led to a further accumulation of LC3B-II and SQSTM1, albeit to much lower levels than those following NUPR1 depletion (E), indicating that NUPR1 may be involved in broad regulatory control of autolysosomal dynamics.
SNAP25 mediates autolysosomal efflux through VAMP8
To gain further insight into the biological function of SNAP25, we employed affinity purification and mass spectrometry to identify the binding partners associated with this protein. Flag-tagged SNAP25 was stably expressed in A549 cells, and the cellular lysates were subjected to affinity purification using an anti-Flag M2 affinity gel. The bound proteins were eluted with 3xFLAG peptides, resolved, and visualized by silver staining on gradient SDS-PAGE gels. These proteins were further identified by mass spectrometry as VAMP8 (vesicle associated membrane protein 8), STX4 (syntaxin 4), ANXA2 (annexin A2), CAT (catalase), and VPS45 (vacuolar protein sorting 45 homolog) (A). Additional binding partners from the mass spectrometry analysis are provided in Table S6.
Figure 5. SNAP25 mediates autolysosomal efflux through VAMP8. (A) Immunopurification of SNAP25-containing protein complexes. Cellular extracts from A549 cells stably expressing Flag (empty vector, control) or Flag-SNAP25 were immunopurified with an M2 anti-Flag affinity gel and eluted with 3xFLAG peptide. The eluates were resolved by SDS-PAGE, and interesting bands were analyzed by mass spectrometry. *, non-specifically bound protein bands. (B) Coimmunoprecipitation results for VAMP8 and SNAP25, as well as the N- or C-terminal truncated forms, in HEK293 cells. (C) Physical interaction between SNAP25 and VAMP8 in A549 cells. Shown is the Duolink assay with the interaction between VAMP8 and STX3 as a positive control. Nuclei are counterstained with DAPI (blue). Scale bars: 10 µm. (D) Immunoblot of LC3B and SQSTM1 in SNAP25-depleted and control A549 cells, with ACTB as a loading control. (E) GLB1 staining images in VAMP8-depleted and control A549 cells. Scale bars: 10 µm. (F) Immunoblot of CTSB and CTSD in NUPR1-, SNAP25-, and VAMP8-depleted and control A549 cells, with ACTB as a loading control. (G) SNAP25 was monitored by immunoblotting after recombinant BoNT/A LC treatment at the indicated concentrations for 16 h, with ACTB as the loading control. (H) BrdU-incorporation assay in A549 cells treated with the indicated concentrations of recombinant BoNT/A LC for 24 h. (I) Representative images of GLB1 staining in BoNT/A LC-treated and control A549 cells (left panels). Quantification of GLB1-positive cells was determined from 10 different fields, from 3 independent experiments (mean ± SEM) (right panel). Scale bars: 30 µm. (J) Representative cell images of SNAP25 or VAMP8 knockdown A549 cells following 50 mM trehalose or 10 µm torin 1 treatment for 24 h. Scale bars: 10 µm. (K) Representative images of GLB1 staining in A549-knockdown cells following the indicated treatment for 24 h (left panels). Quantification of GLB1-positive cells (right panel) was determined as in (I). Scale bars: 10 µm.
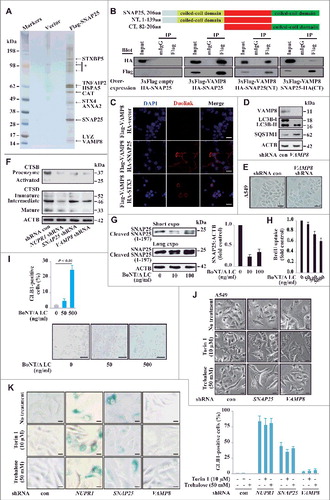
Among the SNAP25 binding partners, VAMP8, another member of the SNARE complex, mediates autophagosome membrane fusion with the lysosome membrane through the SNARE complex [Citation25]., [Citation26] HA-tagged SNAP25 was efficiently coimmunoprecipitated with Flag-tagged VAMP8, and the N-terminal coiled-coil domain of SNAP25 showed higher binding affinity to VAMP8 than the C-terminal coiled-coil domain (B). Next, we examined the in situ colocalization of SNAP25 and VAMP8 in single cells using a proximity ligation assay (PLA) [Citation27]. This assay also demonstrated a strong interaction between Flag-tagged VAMP8 and HA-tagged SNAP25 in A549 cells compared to the vector control, which was significantly more pronounced along the plasma membrane (C). Consistent with a previous report, an intracellular STX3 (syntaxin 3) association with VAMP8 was also confirmed (C) [Citation28]. VAMP8 depletion caused a similar accumulation of LC3B-II and SQSTM1 (D), indicating that both VAMP8 and SNAP25 are involved in the same functional regulation of the autolysosomal process. However, VAMP8 knockdown did not alter GLB1 activity, and heavy vacuolization was not observed (E), indicating that functional redundancy may exist between VAMP8 and other SNARE proteins in controlling autolysosomal processing.
Another potential mechanism for NUPR1 is the activation of autolysosomal degradation enzymes. However, the processing of the lysosomal proteases cathepsins B and D into their fully active forms was also not significantly changed in NUPR1-, SNAP25-, and VAMP8- knockdown cells (F). These findings indicate that the primary effects of NUPR1 depletion are not due to defective lysosomal cathepsin processing. Overall, these data suggest that NUPR1-regulated autolysosome processing in cancer cells requires SNAP25 activity, which involves an interaction with VAMP8 but not cathepsin processing.
To confirm the role of SNAP25 in autolysosomal processing, we employed the light chain of botulinum neurotoxin type A (BoNT/A LC), a Zn2+-dependent endoprotease that exclusively cleaves and inactivates SNAP25Citation29,30 and decreases vesicle-associated membrane mobilization due to SNAP25's role in endocytosis and exocytosis [Citation31]. BoNT/A LC cleaves SNAP25 to generate a truncated SNAP25 (residues 1 to 197), which is nonfunctional for membrane fusion [Citation32]. We electroporated recombinant 6xHis-tagged BoNT/A LC into A549 cells and confirmed its SNAP25 cleavage activity in a dose-dependent fashion (G). BoNT/A LC consistently inhibited cell proliferation and enhanced GLB1 activity after 24 h of recombinant BoNT/A LC treatment (H and I) but not in SNAP25-negative HBEC cells (data not shown).
Finally, we sought independent evidence that autolysosomal vacuolization caused by NUPR1 depletion is related to increased autophagic flux. Trehalose, a disaccharide of glucose, is reported to induce autophagic flux [Citation33]. Indeed, after sequential treatment with SNAP25 or VAMP8 shRNA followed by trehalose or torin 1 (an MTOR inhibitor) treatment for 24 h, A549 cells showed increased autolysosomal vacuoles, which were similar to the vacuoles found in NUPR1 knockdown cells (J). However, trehalose or torin 1 treatment did not enhance GLB1 activity in NUPR1-, SNAP25- or VAMP8-depleted A549 cells (K), which indicates their unique roles in these processes. More generally, these data suggest that NUPR1-expressing lung cancer cells share an acquired vulnerability in their autolysosomal processing that, in theory, may be exploited using synthetic lethal approaches.
SNAP25 expression is positively correlated with NUPR1 in human NSCLC
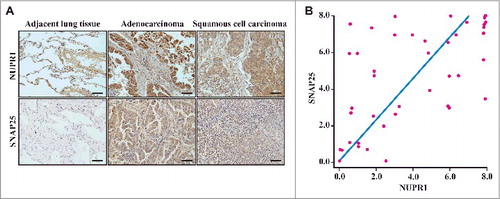
Because overexpression of SNAP25 rescued the defects in the autolysosome after NUPR1 depletion (C), we determined the expression of NUPR1 in a cohort of subjects with NSCLC, with particular emphasis on its relationship with SNAP25 expression status. A cohort of lung tumors (n = 42) with matched adjacent non-neoplastic lung tissues was investigated. We conducted IHC staining with an antibody specifically recognizing NUPR1 protein as well as an antibody specific for SNAP25. We observed that normal epithelial cells in tumor-adjacent lung tissue did not express detectable NUPR1 or SNAP25 (A). By contrast, 48% of the lung squamous cell carcinomas and 41% of the lung adenocarcinomas exhibited NUPR1-positive nuclear localization (A and Table S7). When intratumoral staining was quantified, a highly significant positive correlation was observed between NUPR1 and SNAP25 staining in these NSCLC tissues (r2 = 0.332, P = 0.000066; B), suggesting specific regulation of SNAP25 by NUPR1. Notably, high levels of NUPR1 staining were consistently associated with significant SNAP25 staining, which drove the association. However, lower levels of NUPR1 staining were associated with variable SNAP25 staining, indicating that SNAP25 likely responds to other inducers. This interpretation is consistent with our observations that a significant number of NSCLC cell lines evade senescence in the absence of NUPR1 expression.
Figure 6. Histological properties of patient-derived lung NSCLC specimens. (A) Representative distribution of NUPR1 and SNAP25 determined by IHC in clinical squamous cell carcinoma and lung adenocarcinoma specimens. IHC staining with anti-NUPR1 was performed on 25 lung squamous cell carcinomas and 17 adenocarcinoma specimens compared with their adjacent tissues from the patient of origin (IHC, brown). Scale bars: 50 μm. (B) The protein level of SNAP25 was positively correlated with NUPR1 in NSCLC tissues with low (0 to 5.0 staining scores, blue lines; n = 68) versus high (5.1 to 10.0 staining scores, green lines; n = 50) NUPR1 expression (r2 = 0.332, P < 0.0001). Each red dot represents 1 tumor tissue.
NUPR1 directly activates SNAP25 transcription
To further substantiate a correlation between SNAP25 and NUPR1, the protein levels of SNAP25 were examined using some cell lines as those used for C and D. Indeed, we found that SNAP25 positively correlated with the NUPR1 protein level in all cancer cell lines with the exception of Hep-3B (A and D). NUPR1 depletion also decreased the SNAP25 protein level (B). Interestingly, NUPR1 depletion also modestly increased the protein levels of the autophagy inducer BECN1/Beclin 1 (B), although its mRNA level did not show consistent changes (B), indicating that additional mechanisms such as post-transcriptional modifications of BECN1 may be involved. Although inhibition of the MTOR pathway activates autophagy [Citation34], NUPR1 depletion did not alter phosphorylation of MTOR (B). These data suggest that NUPR1 increases SNAP25 expression independent of the MTOR pathway.
Figure 7. NUPR1 directly activates SNAP25 transcription. (A) Western blot of SNAP25, LC3B, and SQSTM1 in the indicated cell lines with ACTB as a loading control. (B) Western blot of SNAP25, BECN1/Beclin 1, MTOR, and p-MTOR (Ser2448) in A549 NUPR1-depleted cells, with ACTB as a loading control. (C) ChIP was performed to assess the association of Flag-NUPR1 with regions 4 and 5 of the SNAP25 promoter in transfected A549 cells. Stars mark ChIP primer positions. Bar graphs show fold enrichment of NUPR1 binding. Relative enrichment compared to region 1 is shown. The mean ± SEM of 3 replicates is shown. (D) The diagram shows serial deletions of the luciferase reporter upstream of the SNAP25 transcription start site (TSS); bar graphs show luciferase activity. (E) Schematic showing the balance between autophagic flux and autolysosomal efflux mediated by NUPR1 in lung cancer cells.
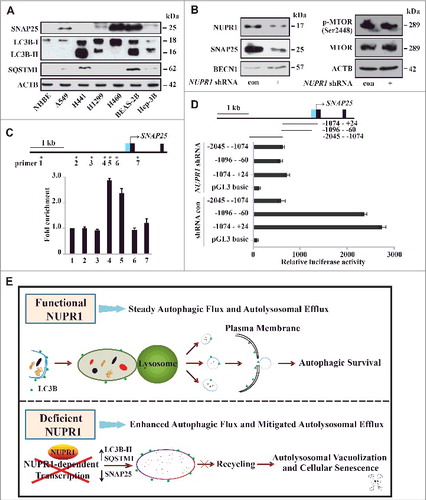
Next, we explored the mechanism by which NUPR1 activates SNAP25. Chromatin immunoprecipitation (ChIP) targeting Flag-NUPR1 was performed to investigate the occupancy of NUPR1 at putative regulatory sites of SNAP25 in A549 cells. The results showed that a genomic site approximately 1 kb upstream of the SNAP25 transcriptional start site (TSS) was occupied by NUPR1 (C). A luciferase reporter assay also confirmed that this upstream region is necessary for full activation of SNAP25 (D). Collectively, these results suggest that NUPR1 may transactivate SNAP25 in cancer cells through binding of an upstream cis-active site, underscoring the specific association between NUPR1 and the vesicular trafficking protein.
Taken together, as illustrated in E, our data indicate that the transcriptional regulator NUPR1 maintains steady autophagic flux and autolysosomal efflux in cancer cells. When inactivated, NUPR1 loses its cytoprotective function through SNAP25-VAMP8 interaction and enhances autophagic flux, accompanied by a persistent reduction in autolysosomal clearance, triggering autolysosomal vacuolization and cellular senescence.
Discussion
It is generally accepted that autophagy is an important mechanism for the maintenance of intracellular homeostasis in basal as well as in stressful conditions [Citation6,Citation35] In this study, we found that NUPR1 negatively regulates autophagic flux and positively regulates autolysosomal efflux, controlling autophagosomal and autolysosomal dynamics. In this regard, loss of NUPR1 impairs these 2 processes and induces autolysosomal vacuolization and premature senescence (E). Moreover, pharmacologic targeting of the SNAP25-mediated autolysosomal efflux process promotes premature senescence of NUPR1- and SNAP25-expressing cancer cells, without significant effects on the degradation activity within autolysosomes. These findings may, therefore, represent a previously unrecognized mechanism by which endogenous NUPR1 may rescue an intrinsic imbalance between autophagic flux and autolysosomal efflux.
The fine-tuning of the autophagic process is an obligate requirement for tumor progression that relies on specific transcription programs [Citation36-38]. Currently, autophagy in mammals is understood to be mediated by phylogenetically conserved autophagy-related genes, as previously shown for ATG genes [Citation39-41], and transcription factors, such as TFEB (transcription factor EB) and its homolog TFE3 [Citation42,Citation43] members of the forkhead box protein class O (FOXOs) [Citation44], and ZKSCAN3/ZNF306 [Citation38]. The autophagic response to stress may proceed sequentially in 2 phases: a rapid increase in the autophagic flux mediated by posttranslational protein modifications, followed by a delayed autophagic response that relies on the activation of specific transcription programs [Citation36-38]. NUPR1 may coordinately take part in such transcriptional regulation of the autolysosomal process. We noted that the transcriptional levels of ATG9B, SQSTM1 and SNAP25 are involved in the balance between autophagic flux and autolysosomal efflux by NUPR1. Autolysosomal vacuolization caused by NUPR1 depletion is not due to alterations in autophagy initiation or autophagosome-lysosome degradation activity, but rather occurs because of inefficient autolysosomal clearance. Cytosolic vacuolization is also induced by SNAP25 depletion, leading to cellular senescence, similar to the effects observed following NUPR1 depletion. However, it is not clear how NUPR1-negative cancer cells restore autophagic homeostasis, but this presumably occurs through alternative pathways. Our work indicates that such putative alternative pathways do not operate in NUPR1-expressing cancers, revealing a novel addiction to NUPR1 in these tumors.
Recently, the term “autosis” has been used to describe a form of autophagic cell death that depends on cellular Na+, K+-ATPases, as determined by Tat-Beclin1 peptide treatment [Citation45,Citation46]. This type of cell death is characterized by enhanced autophagic flux, including accelerated LC3B turnover and degradation of SQSTM1, and is also a noncaspase-mediated form of cell destruction. Nevertheless, our data indicated that the accelerated autophagic flux and the impaired autolysosomal efflux caused by NUPR1 depletion resulted in premature senescence rather than cell death. Cellular senescence is now widely considered to be an integrated and common phenotype that is potentially important for tumor development, tumor suppression, and response to therapy [Citation47]. The core aspect of the senescent phenotype is an irreversible cell cycle arrest caused by cyclin-dependent kinase inhibitors, as indicated by GLB1 activation [Citation48]. One unifying theme linking senescence and autophagy with tumor suppression is the absence of caspase activation accompanied by elevated autophagy activity [Citation49]. Of clinical relevance, our data indicate that even transient interference with NUPR1-mediated transcriptional regulation can lead to irreversible autolysosomal vacuolization and cellular senescence. These findings suggest that in NUPR1-expressing tumors, the NUPR1-SNAP25 pathway may offer an effective target for pharmacological intervention, such as blocking autolysosomal efflux by BoNT/A LC treatment to induce tumor-specific premature senescence.
One key step in the late autophagic process is the fusion between the completed autophagosome and the lysosome, leading to the formation of the autolysosome [Citation2,Citation50]. However, the late events of autolysosomal efflux are less well understood except for autophagic lysosome reformation [Citation51]. The SNARE complex is central to a mechanism whereby regulatory components of SNARE-mediated membrane fusion regulate the late autolysosomal process in cancer biology [Citation24,Citation52]. Indeed, SNARE proteins are required for autophagy [Citation53,Citation54] and formation of the SNARE complex prompts vesicles to fuse with the plasma membrane [Citation50,Citation55] Our data indicate that the SNAP25-mediated autolysosomal process plays an unexpectedly broad role in the biogenesis of autolysosomes as well as their efflux. Because of its prosurvival role under unfavorable conditions, it is not surprising that autophagy protects cancer cells from stresses, such as nutrient deprivation or chemotherapy [Citation56,Citation57]. NUPR1-depleted as well as SNAP25-depleted cells displayed a complete absence of fast, synchronized vacuole release, resulting in the accumulation of large and visible vacuoles (C and Movies S1 and S2), which often appeared as mature autolysosomes under electron microcopy analysis. Moreover, VAMP8 is another SNARE protein involved in autophagy through the direct control of autophagosome membrane fusion with the lysosome membrane [Citation25,Citation26]. Therefore, disturbance of the autophagosome-lysosome pathway is likely to occur as a consequence of lysosomal dysfunction, presumably via an impaired SNAP25-VAMP8 interaction pathway. Moreover, altered processing of autolysosomal efflux, along with the clear effect on SNAP25-mediated autolysosomal efflux that we observed in NUPR1-depleted cells, strongly suggests that SNAP25 has a role in trafficking autolysosomal components to the plasma membrane. It is noteworthy that reexpression of SNAP25 rescues autolysosomal vacuolization by NUPR1 depletion, indicating that NUPR1 is a direct and primary regulator of SNAP25. Thus, our findings identify a context-dependent biological function for NUPR1 in modulating autophagic processes, thereby linking autolysosomal control with autolysosome-dependent senescence and suggesting that the NUPR1-SNAP25 axis could be a fruitful target for anticancer therapeutic interventions. However, SNAP25 does not seem to be the only effecter operating downstream of autolysosomal efflux. In neurons, deletion of SNAPIN (SNAP associated protein), a dynein motor adaptor, results in aberrant accumulation of immature lysosomes and autolysosomes in the soma [Citation58]. These data suggest that the overall structure of SNARE complexes is similar, but with distinct functions between neuronal and autophagic membrane fusion [Citation59]. Further investigations are warranted to determine whether the deficiency of NUPR1 causes feedback that facilitates the autolysosomal process in various cancer types, which may reveal unappreciated levels of complexity in the regulation of autophagic flux and autolysosomal efflux.
In summary, our findings suggest that the transcriptional regulator NUPR1 maintains autophagic flux and autolysosomal efflux through a SNAP25-VAMP8 interaction in cancer cells. NUPR1 depletion impairs this balance and leads to irreversible autolysosome-dependent cellular senescence and suppression of tumor progression. We speculate that targeting the activity of NUPR1 in the autolysosomal clearance pathway may pave the way for novel approaches to induce premature senescence selectively in cancer cells.
Materials and Methods
Patients and ethics statement
The use of human lung cancer specimens and the database was approved by the institutional review board of Tianjin Medical University. Human tissues used in this study were obtained from lung cancer patients after lobectomy/pnemonectomy and systematic lymph node dissection from Tianjin Medical University Cancer Institute and Hospital. All patients received standard adjuvant radiotherapy after surgery, followed by treatment with cisplatin combined with taxol or vinorelbine in most cases.
Chemicals and antibodies
The following reagents were used: 4,6-diamidino-2-phenylindole (DAPI; Sigma-Aldrich, D9542), chloroquine (CQ; Sigma-Aldrich, C6628), bafilomycin A1 (BafA1; Sigma-Aldrich, B1793), Apoptosis Sampler Kit (Cell Signaling Technology, 9915), ECL Western Blotting Detection Reagents (GE Healthcare, RPN2106), and horseradish peroxidase-conjugated secondary antibodies (Bio-Rad, 1662408 and 1706516). Antibodies used in this study are listed in . mCherry-GFP-LC3 construct was a kind gift of Dr. Quan Chen (Institute of Zoology, Chinese Academy of Sciences, Beijing, China). LAMP1-mCherry was a kind gift of Dr. Li Yu (Tsinghua University, Beijing, China). Additional plasmids used for transfections include BoNT/A-LC (Addgene, 31602; Axel Brunger Lab), and Tet-on inducible shRNA knockdown system (Addgene, 21915; Dmitri Wiederschain Lab) [Citation61]. Restriction enzyme digestion and DNA sequencing were used to verify each construct. DNA sequences for shRNA are listed in Table S2.
Table 1. Primary antibodies used in this study.
Cell lines, tissue culture conditions, and viral infection
Phoenix-AMPHO, A549, H209, H441, H446, H460, H1299, EA.hy926, U937, HeLa, H358, H1155 and Hep-3B were obtained from American Type Culture Collection (CRL-3213, CCL-185, HTB-172, HTB-174, HTB-171, HTB-177, CRL-5803, CRL-2922, CRL-1593.2, CCL-2, CRL-5807, CRL-5818, and HB-8064, respectively) and were cultured according to the recommended protocols. BEAS-2B cells were kind gift of Dr. Wen Ning (Nankai University, Tianjin, China). For lentiviral transduction, Phoenix-293 cells were cotransfected with the transfer constructs and the third-generation packaging plasmids pMD2.VSVG, pMDLg/pRRE, and pRSV-REV, and fresh supernatant was used for infection as described before [Citation62]. After 8 h infection, A549 cells were washed and allowed to recover for 24 h prior to further procedure.
Western blot analysis
Whole-cell lysates (in RIPA buffer; Thermo Fisher Scientific, 89900) were generated by sonication followed by centrifugation to remove insoluble material and protein content was measured using Micro BCA™ protein assay kit (Thermo Fisher Scientific, 23235). Total protein in 1xLaemmli buffer (Bio-Rad, 1610737) was resolved by SDS-PAGE and transferred to nitrocellulose membrane. Immunoblot analysis was performed with the indicated antibodies and visualized on Kodak X-ray film using the enhanced chemiluminescence (ECL) Detection Substrate (Thermo Fisher Scientific, 32106).
Immunoprecipitation
Cellular extracts were incubated with appropriate primary antibodies or normal control immunoglobin G (IgG; Merck-Calbiochem, NI04) at 4°C overnight, followed by addition of protein A/G Sepharose CL-4B beads (Sigma-Aldrich, P9424 and P3296, respectively) for 2 hr at 4°C. Beads were then washed 5 times with lysis buffer (50 mM Tris-Cl, pH 7.4, 150 mM NaCl, 1 mM EDTA, 1% NP-40 (Amresco, E109), 0.25% sodium deoxycholate (Sigma-Aldrich, 30970) and protease inhibitors cocktail tablet (Roche, 04693116001). The immune complexes were subjected to SDS-PAGE followed by western blotting with corresponding antibodies.
RNA isolation, qRT-PCR, ChIP, and luciferase assays
RNA isolation, reverse transcription, qRT-PCR, and ChIP were performed as previously described using an iQ™ SYBR® Green Supermix (Bio-Rad, 170–8882) and an iQ™ 5 Real Time PCR Detection System (Bio-Rad, 170–9750, California, USA) [Citation60]. DNA fragments upstream of SNAP25 promoter were amplified from A549 genomic DNA using primers listed in Table S9. DNA fragments were then cloned into the KpnI and the XhoI site of the polylinker region pGLbasic. The constructs were transiently cotransfected either in triplicate or in duplicate with pRL-CMV Renilla luciferase reporter. Luciferase activity was examined 24 h post transfection with its internal control for normalization according to the manufacturer's instruction (Duol-Luciferase Reporter Assay System; Promega Corporation, E1910). Primer sequences are listed in Tables S5, S8, and S9, respectively.
RNA-Seq and accession number
Expression profiling was performed with total RNA extracted from cultured control shRNA against fire fly luciferase and NUPR1 shRNA in A549 cells using the Agilent Sure Print G3 Human Gene Expression 8 × 60K v2 Microarray (Agilent Technologies, Palo Alto, CA, USA) chip by ABlife Inc. (Wuhan, China). The Gene Expression Omnibus (GEO) accession number for the RNA-seq data reported in this paper is GSE68873. The upregulated genes and downregulated genes (>1.5-Fold) by NUPR1 knockdown are listed in Tables S3 and S4, respectively.
GLB1 staining
GLB1 (galactosidase beta 1) staining was performed using a Senescence β-Galactosidase Staining Kit (Cell Signaling Technology, 9860) according to the manufacturer's protocol. The number of GLB1-positive cells in randomly-selected fields was expressed as a percentage of all cells counted. Cells were photographed under a light microscope (Nikon Eclipse Ti-U, Nikon Instruments, Kanagawa, Japan).
ATP content measurement
Measurement of cellular ATP content was performed using a luminescence ATP assay kit according to the vendor's suggestion (Promega Corporation, G7570). Briefly, cells (1 × 10⁴) were cultured in 96-well plates at 37°C and 5% CO2. After 24 h, ATP assay reagent was added to each well and the supernatant was handpicked and delivered into white 96-well microplates (Corning Costar, 3688) for luminescence measurement. Absorbance was normalized for cell number.
Proliferation assay
Cells were plated on cell culture-treated 96-well plates (1 × 10⁴ cells per well) (Sigma-Aldrich, CLS3595-50EA). After 16 h, 5-bromodeoxyuridine (BrdU; 10 μg/mL, Roche, 11647229001) was added to each well. Two h later, the culture media were removed, and the BrdU incorporation was measured using a BrdU incorporation enzyme-linked immunosorbent assay (Roche, 11647229001). Absorbance was normalized for cell number.
Clonogenic assay in soft agar
A total of 1,500 cells were seeded into 24-well plates in triplicates. Fresh medium was replaced every 3 d thereafter. On d 14 after colonies were formed, the cells were fixed with 4% (wt/vol) paraformaldehyde and stained with crystal violet for 45 min. The colonies with diameters of more than 1.5 mm were counted. Colonies were counted and photographed using Image Processing and Analysis in Java (ImageJ, Research Service Branch, NIH).
Tumor xenografts
All animal studies were approved by Tianjin Medical University, and carried out in accordance with the Institutional Animal Care and Use Committee guidelines (Tianjin Medical University). All experiments were carried out with male FOX CHASE severe combined immunodeficient (SCID) mice. A549 or H460 cells (106) were mechanically dissociated to obtain single cell suspensions, diluted in Matrigel™ (BD Biosciences, 354234) at a ratio of 1:1, and 100 μl of shRNA control cells and NUPR1 shRNA cells were injected into the right and left flank of SCID mice, respectively. Mice were monitored to check for the appearance of signs of disease, such as subcutaneous tumors or weight loss due to potential tumor growth in internal sites. When diameters of tumor in right flank of mice reached at least 5 mm in size, mice were killed and tumor tissue was collected, fixed in buffered formalin and subsequently analyzed by immunohistochemistry. Hematoxylin and eosin (H&E) staining followed by immunohistochemical analysis were performed to analyze tumor histology.
Fluorescence microscopy and confocal microscopy
Multiple NSCLC cells were infected with a lentivirus expressing mCherry-GFP-LC3 fusion protein. After knockdown of NUPR1 or luciferase, samples were examined using an epifluorescent microscope (Olympus BX61, Tokyo, Japan). For confocal microscopy, cells (105) were seeded on a coverslip coated with poly-lysine (Sigma-Aldrich, P6282) in 24-well plates. After being fixed with 4% paraformaldehyde for 15 min at room temperature (RT), the cells were washed 2 times in phosphate-buffered saline (PBS, pH 7.4; Invitrogen, 10010023). The coverslips were mounted on glass slides using Vectashield with 4’, 6-diamidino-2-phenylindole (DAPI; Thermo Scientific, 62248) and examined using a Zeiss LSM510 laser scanning confocal microscope (Carl Zeiss, Jena, Germany).
Transmission electron microscopy
Cells were trypsinized, washed with 0.1 M PBS, and fixed with a solution containing 3% glutaraldehyde, 2% paraformaldehyde (Sigma-Aldrich, 340855 and P6148, respectively) in 0.1 M PBS for 2 h at RT. After fixation, the cells were washed with 0.1 M PBS and postfixed with 1% buffered osmium tetroxide (Sigma-Aldrich, 75632) for 45 min at RT, and stained with 1% uranyl acetate (Ted Pella, Inc., 19481). After dehydration in graded series ethanol, the cells were embedded in EMbed 812 medium (Electron Microscopy Sciences, 14120) and were polymerized at 70°C for 2 d. Ultrathin sections were cut on a Leica Ultra cut microtome (Leica, Vienna, Austria) and stained with uranyl acetate and lead citrate in a Leica EM Stainer. Digital TEM images were acquired from thin sections using a JEM 1010 transmission electron microscope (JEOL, Peabody, MA, USA) at an accelerating voltage of 80 kV equipped with AMT Imaging System (Advanced Microscopy Techniques, Danvers, MA, USA).
Immunohistochemistry
All tumors were grade III in World Health Organization histologic classification. Histological sections (5-µm thick) were mounted on poly-L-lysine-coated slides. Slides were baked at 55°C overnight, deparaffinized in xylenes (2 treatments, 30 min each), rehydrated sequentially in ethanol (5 min in 100%, 5 min in 95%, and 5 min in 75%), and washed for 5 min in 0.3% Triton X-100 (Sigma-Aldrich, V900502) in PBS (PBST) and 5 min in water. Sections were pretreated with citrate buffer (10 mM citric acid, pH 6.0) for 20 min at 95°C, rinsed 3 times with PBST, incubated for 10 min with 3% H2O2 at RT to block endogenous peroxidase activity, washed 3 times with PBST, and blocked with 5% goat serum (Sigma, G9023) in PBST for 1 h. Then the tissue sections were incubated at 4°C overnight with anti-Nupr1, Abcam, 1:100. Sections were then washed 5 times for 3 min each in PBST and incubated with biotinylated secondary antibody in blocking solution for 1 h at RT. Sections were then washed five times in PBST and stained for peroxidase for 5 min with the DAB (diaminebenzidine) substrate kit (Vector Laboratories, SK-4100), washed with water and counterstained with haematoxylin. Images were obtained with a CCD camera (Coolsnap ES, Roper Scientific, Tucson, AZ, USA) using Metamorph software (Molecular Devices). At least 50 cells from more than 10 fields were counted for statistical analysis. Semiquantitative evaluation of NUPR1 staining was based on the intensity of the strain and the percentage of malignant cells staining positive as previously defined [Citation63]. Scores were compared with overall survival, defined as the time from date of diagnosis to death. Sections were counterstained with hematoxylin. Staining was evaluated using the H-score (*, intensity percentage), with intensity ranging from 0 to 10.
Duolink assay
Duolink assay was performed using the Duolink In Situ Red Starter Kit Mouse/Rabbit following the manufacturer's instructions (Sigma-Aldrich, DUO92101) and its basic protocols can be found in previous reports [Citation27]. Briefly, cells were seeded at low density on glass coverslips and left to attach for 24 h. Cells were then fixed with 3.7% formaldehyde in PBS and permeabilized for 10 min in TBS (25 mM Tris-HCl, pH 8.0, 150 mM NaCl, 0.1% Tween-20 [Sigma-Aldrich, P1379]) containing 0.5% Triton X-100. Samples were incubated with 3% BSA for 1 h at 37ºC in a humidity chamber and then overnight at 4ºC with an anti-HA mouse monoclonal antibody or anti-NUPR1 mouse monoclonal antibody and rabbit monoclonal HA antibody. Slides were then incubated for 1 h at 37ºC with a mix of the MINUS (anti-mouse) and PLUS (anti-rabbit) PLA probes. Hybridized probes were ligated using the Ligation-Ligase solution for 30 min at 37ºC and then amplified utilizing the Amplification-Polymerase solution for 100 min at 37ºC. Slides were finally mounted using Duolink II Mounting Medium with DAPI and imaged using a Zeiss Axiovert 200M microscope enclosed in a full environmental chamber (Solent Scientific, Portsmouth, UK).
Cellular migration assay
A549 cells were infected with NUPR1 shRNA lentiviral particles. Migration into wounds was examined by plating infected A549 cells on fibronectin-coated coverslips (Electron Microscopy Sciences, 72198-10). At least 5 wounded fields per coverslip were analyzed on 6 coverslips per condition, and identical fields were photographed under phase at 0 and 36 h using Metamorph software.
Mass spectrometry analysis and sequence database processing
A549 cells stably expressing Flag-SNAP25 were lysed with 50 mM Tris-HCl, pH 7.4, 150 mM NaCl, 0.2 mM EDTA, and 1% Triton X-100 containing protease inhibitors cocktail tablet (Roche, 04693132001), and insoluble material was removed by centrifugation (30 min, 15,000 x g). Equal amounts of protein from control and Flag-SNAP25 cells were incubated with anti-Flag M2 affinity beads (Sigma-Aldrich, A2220) overnight at 4ºC. After binding, the beads were washed 5 times with lysis buffer before elution with 5 1-column volumes of a solution containing 100 μg/ml FLAG peptide (Sigma-Aldrich, F3290) in TBS containing 0.1% NP-40 for 5 min at RT. Eluates were concentrated using trichloroacetic acid precipitation prior to loading on SDS-PAGE. The proteins were resolved on SDS-PAGE and visualized by silver staining (Pierce Silver Stain Kit; Thermo Fisher Scientific, 24612). The corresponding bands were further excised and subjected to in-gel digestion as previously described [Citation64]. Each tryptic digestion was reconstituted in 7 µl of HPLC buffer A (0.1% [v:v] formic acid in water), and 5 µl was injected into a Nano-LC system (Thermo Fisher Scientific, EASY-nLC 1000, Waltham, MA, USA). Each sample was separated by a C18 column (50 μm inner-diameter × 15 cm, 2 μm C18) with a 50 min HPLC-gradient at a flow rate of 200 nl/min (linear gradient from 2 to 35% HPLC buffer B (0.1% formic acid in acetonitrile) in 40 min, and then to 90% buffer B in 10 min). The HPLC elution was electrosprayed directly into an Orbitrap Q-Exactive mass spectrometer (Thermo Fisher Scientific, Waltham, MA). The source was operated at 1.8 kV. The mass spectrometric analysis was carried out in a data-dependent mode with an automatic switch between a full MS scan and 10 MS/MS scans in the Orbitrap. For full MS survey scan, automatic gain control (AGC) target was 1e6, scan range was from 350 to 1750 with the resolution of 70,000. The 10 most intense peaks with charge state 2 and above were selected for fragmentation by higher-energy collision dissociation (HCD) with normalized collision energy of 27%. The MS2 spectra were acquired with 17,500 resolution. The exclusion duration for the data-dependent scan was 10 sec, the repeat count was 2, and the exclusion window was set at 2.2 Da. The resulting MS/MS data were searched against UniProt Human database (downloaded July, 9, 2014) using Proteome Discoverer software (v1.4) with an overall false discovery rate (FDR) for peptides of less than 1%. Peptide sequences were searched using trypsin specificity and allowing a maximum of 2 missed cleavages. Carbamidomethylation on Cys was specified as fixed modification. Oxidation of methionine and acetylation on the protein N-terminal region were fixed as variable modifications. Mass tolerances for precursor ions were set at ± 10 ppm for precursor ions and ± 0.02 Da for MS/MS. The detailed information of SNAP25 binding proteins is listed in Table S6.
Recombinant BoNT/A LC expression and purification
DNA fragments encoding botulinum neurotoxin serotype A light chain (BoNT/A LC) was amplified by PCR using a plasmid of BoNT/A LC (Addgene plasmid #31602) [Citation65,Citation66] as the template, cloned individually into an in-house modified version of the pET-32a (Novagen, 69015-3) vector and confirmed by DNA sequencing. Recombinant proteins were expressed in Escherichia coli BL21 cells at 25ºC. 6xHis-tagged BoNT/A LC expressed in bacterial cells were purified by Ni2+-NTA agarose (Qiagen, 30210) affinity chromatography followed by passing through a size-exclusion chromatography column.
FACS PI staining
A549 cells (105) infected with shRNA control or NUPR1 shRNA were seeded in 12-well cell culture plates in 0.5 mL cell culture medium, respectively. After 24 h, the cells were detached with trypsin, stained with propidium iodide (PI; Sigma-Aldrich, P4170) and measured with a BD FACS-Calibur (BD Biosciences, Heidelberg, Germany). The percentage of PI positive cells was determined for each group.
Statistical analysis
The association of immunocytochemical staining for NUPR1 and SNAP25 with clinicopathological characteristics was analyzed using the X2 test. Comparisons of sex were by Fisher exact test. Comparison of age was by unpaired, 2-tailed Student t test. Statistical software SPSS version 22.0 (IBM Corporation, Armonk, New York, USA) was used to evaluate the data in this study and differences were considered to be statistically significance at P < 0.05. The variables of patients included age, gender, histological examination, tumor size, metastasis and pathological grade are listed in Table S1 and S7.
Disclosure of potential conflicts of interest
No potential conflicts of interest were disclosed.
1338556_Supplemental_Material.zip
Download Zip (18 MB)Acknowledgments
We thank Drs. Chenghao Xuan and Lei Shi (Tianjin Medical University, Tianjin, China) for helpful discussions and critical reading of the manuscript.
Additional information
Funding
Related Research Data
References
- Chen Y, Klionsky DJ. The regulation of autophagy – unanswered questions. J Cell Sci. 2011;124:161–170. doi:10.1242/jcs.064576. PMID:21187343.
- Klionsky DJ, Abdelmohsen K, Abe A, et al. Guidelines for the use and interpretation of assays for monitoring autophagy (3rd edition). Autophagy. 2016;12:1–222. doi:10.1080/15548627.2015.1100356. PMID:26799652.
- Mizushima N, Levine B, Cuervo AM, et al. Autophagy fights disease through cellular self-digestion. Nature. 2008;451:1069–1075. doi:10.1038/nature06639. PMID:18305538.
- White E. Deconvoluting the context-dependent role for autophagy in cancer. Nat Rev Cancer. 2012;12:401–410. doi:10.1038/nrc3262. PMID:22534666.
- Yang Z, Klionsky DJ. Mammalian autophagy: core molecular machinery and signaling regulation. Curr Opin Cell Biol. 2010;22:124–131. doi:10.1016/j.ceb.2009.11.014. PMID:20034776.
- Galluzzi L, Pietrocola F, Bravo-San Pedro JM, et al. Autophagy in malignant transformation and cancer progression. Embo J. 2015;34:856–880. doi:10.15252/embj.201490784. PMID:25712477.
- Cano CE, Hamidi T, Sandi MJ, et al. Nupr1: the Swiss-knife of cancer. J Cell Physiol. 2011;226:1439–1443. doi:10.1002/jcp.22324. PMID:20658514.
- Goruppi S, Iovanna JL. Stress-inducible protein p8 is involved in several physiological and pathological processes. J Biol Chem. 2010;285:1577–1581. doi:10.1074/jbc.R109.080887. PMID:19926786.
- Guo X, Wang W, Hu J, et al. Lentivirus-mediated RNAi knockdown of NUPR1 inhibits human nonsmall cell lung cancer growth in vitro and in vivo. Anat Rec (Hoboken). 2012;295:2114–2121. doi:10.1002/ar.22571. PMID:22961798.
- Grasso D, Garcia MN, Hamidi T, et al. Genetic inactivation of the pancreatitis-inducible gene Nupr1 impairs PanIN formation by modulating Kras(G12D)-induced senescence. Cell Death Differ. 2014;21:1633–1641. doi:10.1038/cdd.2014.74. PMID:24902898.
- Vincent AJ, Ren S, Harris LG, et al. Cytoplasmic translocation of p21 mediates NUPR1-induced chemoresistance: NUPR1 and p21 in chemoresistance. FEBS Lett. 2012;586:3429–3434. doi:10.1016/j.febslet.2012.07.063. PMID:22858377.
- Carracedo A, Lorente M, Egia A, et al. The stress-regulated protein p8 mediates cannabinoid-induced apoptosis of tumor cells. Cancer cell. 2006;9:301–312. doi:10.1016/j.ccr.2006.03.005. PMID:16616335.
- Emma MR, Iovanna JL, Bachvarov D, et al. NUPR1, a new target in liver cancer: implication in controlling cell growth, migration, invasion and sorafenib resistance. Cell Death Dis. 2016;7:e2269. doi:10.1038/cddis.2016.175. PMID:27336713.
- Sandi MJ, Hamidi T, Malicet C, et al. p8 expression controls pancreatic cancer cell migration, invasion, adhesion, and tumorigenesis. J Cell Physiol. 2011;226:3442–3451. doi:10.1002/jcp.22702. PMID:21344397.
- Ishida M, Miyamoto M, Naitoh S, et al. The SYT-SSX fusion protein down-regulates the cell proliferation regulator COM1 in t(x;18) synovial sarcoma. Mol Cell Biol. 2007;27:1348–1355. doi:10.1128/MCB.00658-06. PMID:17101797.
- Jia Q, Zhou W, Yao W, et al. Downregulation of YAP-dependent Nupr1 promotes tumor-repopulating cell growth in soft matrices. Oncogenesis. 2016;5:e220. doi:10.1038/oncsis.2016.29. PMID:27089143.
- Jiang WG, Davies G, Martin TA, et al. Com-1/p8 acts as a putative tumour suppressor in prostate cancer. Int J Mol Med. 2006;18:981–986. doi:10.3892/ijmm.18.5.981. PMID:17016631.
- Hamidi T, Algul H, Cano CE, et al. Nuclear protein 1 promotes pancreatic cancer development and protects cells from stress by inhibiting apoptosis. J Clin Invest. 2012;122:2092–2103. doi:10.1172/JCI60144. PMID:22565310.
- Gironella M, Malicet C, Cano C, et al. p8/nupr1 regulates DNA-repair activity after double-strand gamma irradiation-induced DNA damage. J Cell Physiol. 2009;221:594–602. doi:10.1002/jcp.21889. PMID:19650074.
- Boya P, Andreau K, Poncet D, et al. Lysosomal membrane permeabilization induces cell death in a mitochondrion-dependent fashion. J Exp Med. 2003;197:1323–1334. doi:10.1084/jem.20021952. PMID:12756268.
- Cagnol S, Chambard JC. ERK and cell death: mechanisms of ERK-induced cell death–apoptosis, autophagy and senescence. Febs J. 2010;277:2–21. doi:10.1111/j.1742-4658.2009.07366.x. PMID:19843174.
- Hoyer-Hansen M, Bastholm L, Szyniarowski P, et al. Control of macroautophagy by calcium, calmodulin-dependent kinase kinase-beta, and Bcl-2. Mol Cell. 2007;25:193–205. doi:10.1016/j.molcel.2006.12.009. PMID:17244528.
- Wu LG, Hamid E, Shin W, et al. Exocytosis and endocytosis: modes, functions, and coupling mechanisms. Annu Rev Physiol. 2014;76:301–331. doi:10.1146/annurev-physiol-021113-170305. PMID:24274740.
- Meng J, Wang J. Role of SNARE proteins in tumourigenesis and their potential as targets for novel anti-cancer therapeutics. Biochim Biophys Acta. 2015;1856:1–12. doi:10.1016/j.bbcan.2015.04.002. PMID:25956199.
- Jean S, Cox S, Nassari S, et al. Starvation-induced MTMR13 and RAB21 activity regulates VAMP8 to promote autophagosome-lysosome fusion. EMBO Rep. 2015;16:297–311. doi:10.15252/embr.201439464. PMID:25648148.
- Itakura E, Kishi-Itakura C, Mizushima N, et al. The hairpin-type tail-anchored SNARE syntaxin 17 targets to autophagosomes for fusion with endosomes/lysosomes. Cell. 2012;151:1256–1269. doi:10.1016/j.cell.2012.11.001. PMID:23217709.
- Soderberg O, Gullberg M, Jarvius M, et al. Direct observation of individual endogenous protein complexes in situ by proximity ligation. Nat Methods. 2006;3:995–1000. doi:10.1038/nmeth947. PMID:17072308.
- Behrendorff N, Dolai S, Hong W, et al. Vesicle-associated membrane protein 8 (VAMP8) is a SNARE (soluble N-ethylmaleimide-sensitive factor attachment protein receptor) selectively required for sequential granule-to-granule fusion. J Biol Chem. 2011;286:29627–29634. doi:10.1074/jbc.M111.265199. PMID:21733851.
- Dickerson TJ, Smith GR, Pelletier JC, et al. 8-Hydroxyquinoline and hydroxamic acid inhibitors of botulinum neurotoxin BoNT/A. Curr Top Med Chem. 2014;14:2094–2102. doi:10.2174/1568026614666141022095114. PMID:25335884.
- Eubanks LM, Hixon MS, Jin W, et al. An in vitro and in vivo disconnect uncovered through high-throughput identification of botulinum neurotoxin A antagonists. Proc Natl Acad Sci U S A. 2007;104:2602–2607. doi:10.1073/pnas.0611213104. PMID:17293454.
- Xu J, Luo F, Zhang Z, et al. SNARE proteins synaptobrevin, SNAP-25, and syntaxin are involved in rapid and slow endocytosis at synapses. Cell Rep. 2013;3:1414–1421. doi:10.1016/j.celrep.2013.03.010. PMID:23643538.
- Binz T, Blasi J, Yamasaki S, et al. Proteolysis of SNAP-25 by types E and A botulinal neurotoxins. J Biol Chem 1994;269:1617–20. PMID:8294407.
- Sarkar S, Davies JE, Huang Z, et al. Trehalose, a novel mTOR-independent autophagy enhancer, accelerates the clearance of mutant huntingtin and alpha-synuclein. J Biol Chem. 2007;282:5641–5652. doi:10.1074/jbc.M609532200. PMID:17182613.
- He C, Klionsky DJ. Regulation mechanisms and signaling pathways of autophagy. Annu Rev Genet. 2009;43:67–93. doi:10.1146/annurev-genet-102808-114910. PMID:19653858.
- Levine B, Kroemer G, et al. Autophagy in the pathogenesis of disease. Cell. 2008;132:27–42. doi:10.1016/j.cell.2007.12.018. PMID:18191218.
- Pietrocola F, Izzo V, Niso-Santano M, et al. Regulation of autophagy by stress-responsive transcription factors. Semin Cancer Biol. 2013;23:310–322. doi:10.1016/j.semcancer.2013.05.008. PMID:23726895.
- Fullgrabe J, Klionsky DJ, Joseph B. Histone post-translational modifications regulate autophagy flux and outcome. Autophagy. 2013;9:1621–1623. doi:10.4161/auto.25803. PMID:23934085.
- Fullgrabe J, Klionsky DJ, Joseph B, et al. The return of the nucleus: transcriptional and epigenetic control of autophagy. Nat Rev Mol Cell Biol. 2014;15:65–74. doi:10.1038/nrm3716. PMID:24326622.
- Boya P, Gonzalez-Polo RA, Casares N, et al. Inhibition of macroautophagy triggers apoptosis. Mol Cell Biol. 2005;25:1025–1040. doi:10.1128/MCB.25.3.1025-1040.2005. PMID:15657430.
- Kabeya Y, Mizushima N, Ueno T, et al. LC3, a mammalian homologue of yeast Apg8p, is localized in autophagosome membranes after processing. Embo J. 2000;19:5720–5728. doi:10.1093/emboj/19.21.5720. PMID:11060023.
- Yue Z, Jin S, Yang C, et al. Beclin 1, an autophagy gene essential for early embryonic development, is a haploinsufficient tumor suppressor. Proc Natl Acad Sci U S A. 2003;100:15077–15082. doi:10.1073/pnas.2436255100. PMID:14657337.
- Settembre C, Di Malta C, Polito VA, et al. TFEB links autophagy to lysosomal biogenesis. Science. 2011;332:1429–1433. doi:10.1126/science.1204592. PMID:21617040.
- Settembre C, Fraldi A, Medina DL, et al. Signals from the lysosome: a control centre for cellular clearance and energy metabolism. Nat Rev Mol Cell Biol. 2013;14:283–296. doi:10.1038/nrm3565. PMID:23609508.
- Chauhan S, Goodwin JG, Chauhan S, et al. ZKSCAN3 is a master transcriptional repressor of autophagy. Mol Cell. 2013;50:16–28. doi:10.1016/j.molcel.2013.01.024. PMID:23434374.
- Shoji-Kawata S, Sumpter R, Leveno M, et al. Identification of a candidate therapeutic autophagy-inducing peptide. Nature. 2013;494:201–216. doi:10.1038/nature11866. PMID:23364696.
- Liu Y, Shoji-Kawata S, Sumpter RM, Jr., et al. Autosis is a Na+,K+-ATPase-regulated form of cell death triggered by autophagy-inducing peptides, starvation, and hypoxia-ischemia. Proc Natl Acad Sci U S A. 2013;110:20364–20371. doi:10.1073/pnas.1319661110. PMID:24277826.
- Perez-Mancera PA, Young AR, Narita M. Inside and out: the activities of senescence in cancer. Nat Rev Cancer. 2014;14:547–558. doi:10.1038/nrc3773. PMID:25030953.
- Mathon NF, Lloyd AC. Cell senescence and cancer. Nat Rev Cancer. 2001;1:203–13. doi:10.1038/35106045. PMID:11902575.
- Young AR, Narita M, Ferreira M, et al. Autophagy mediates the mitotic senescence transition. Genes Dev. 2009;23:798–803. doi:10.1101/gad.519709. PMID:19279323.
- Shen HM, Mizushima N. At the end of the autophagic road: an emerging understanding of lysosomal functions in autophagy. Trends Biochem Sci. 2014;39:61–71. doi:10.1016/j.tibs.2013.12.001. PMID:24369758.
- Rong Y, Liu M, Ma L, et al. Clathrin and phosphatidylinositol-4,5-bisphosphate regulate autophagic lysosome reformation. Nat Cell Biol. 2012;14:924–934. doi:10.1038/ncb2557. PMID:22885770.
- Zhao M, Wu S, Zhou Q, et al. Mechanistic insights into the recycling machine of the SNARE complex. Nature. 2015;518:61–67. doi:10.1038/nature14148. PMID:25581794.
- Nair U, Jotwani A, Geng J, et al. SNARE proteins are required for macroautophagy. Cell. 2011;146:290–302. doi:10.1016/j.cell.2011.06.022. PMID:21784249.
- Wu Y, Gu Y, Morphew MK, et al. All three components of the neuronal SNARE complex contribute to secretory vesicle docking. J Cell Biol. 2012;198:323–330. doi:10.1083/jcb.201106158. PMID:22869597.
- Winkle CC, McClain LM, Valtschanoff JG, et al. A novel Netrin-1-sensitive mechanism promotes local SNARE-mediated exocytosis during axon branching. J Cell Biol. 2014;205:217–232. doi:10.1083/jcb.201311003. PMID:24778312.
- Amaravadi RK, Yu D, Lum JJ, et al. Autophagy inhibition enhances therapy-induced apoptosis in a Myc-induced model of lymphoma. J Clin Invest. 2007;117:326–336. doi:10.1172/JCI28833. PMID:17235397.
- Degenhardt K, Mathew R, Beaudoin B, et al. Autophagy promotes tumor cell survival and restricts necrosis, inflammation, and tumorigenesis. Cancer Cell. 2006;10:51–64. doi:10.1016/j.ccr.2006.06.001. PMID:16843265.
- Cai Q, Lu L, Tian JH, et al. Snapin-regulated late endosomal transport is critical for efficient autophagy-lysosomal function in neurons. Neuron. 2010;68:73–86. doi:10.1016/j.neuron.2010.09.022. PMID:20920792.
- Diao J, Liu R, Rong Y, et al. ATG14 promotes membrane tethering and fusion of autophagosomes to endolysosomes. Nature. 2015;520:563–566. doi:10.1038/nature14147. PMID:25686604.
- Li X, Xu Z, Du W, et al. Aiolos promotes anchorage independence by silencing p66Shc transcription in cancer cells. Cancer cell. 2014;25:575–589. doi:10.1016/j.ccr.2014.03.020. PMID:24823637.
- Wiederschain D, Wee S, Chen L, et al. Single-vector inducible lentiviral RNAi system for oncology target validation. Cell Cycle. 2009;8:498–504. doi:10.4161/cc.8.3.7701. PMID:19177017.
- Ma Z, Liu Z, Wu RF, et al. p66(Shc) restrains Ras hyperactivation and suppresses metastatic behavior. Oncogene. 2010;29:5559–5567. doi:10.1038/onc.2010.326. PMID:20676142.
- Allred DC, Harvey JM, Berardo M, et al. Prognostic and predictive factors in breast cancer by immunohistochemical analysis. Mod Pathol 1998;11:155–168. PMID:9504686.
- Zhang K, Chen Y, Zhang Z, et al. Identification and verification of lysine propionylation and butyrylation in yeast core histones using PTMap software. J Proteome Res. 2009;8:900–906. doi:10.1021/pr8005155. PMID:19113941.
- Zuniga JE, Schmidt JJ, Fenn T, et al. A potent peptidomimetic inhibitor of botulinum neurotoxin serotype A has a very different conformation than SNAP-25 substrate. Structure. 2008;16:1588–1597. doi:10.1016/j.str.2008.07.011. PMID:18940613.
- Tsai YC, Maditz R, Kuo CL, et al. Targeting botulinum neurotoxin persistence by the ubiquitin-proteasome system. Proc Natl Acad Sci U S A. 2010;107:16554–16559. doi:10.1073/pnas.1008302107. PMID:20823219.