
ABSTRACT
Impaired macroautophagy/autophagy and high levels of glycolysis are prevalent in liver cancer. However, it remains unknown whether there is a regulatory relationship between autophagy and glycolytic metabolism. In this study, by utilizing cancer cells with basal or impaired autophagic flux, we demonstrated that glycolytic activity is negatively correlated with autophagy level. The autophagic degradation of HK2 (hexokinase 2), a crucial glycolytic enzyme catalyzing the conversion of glucose to glucose-6-phosphate, was found to be involved in the regulation of glycolysis by autophagy. The Lys63-linked ubiquitination of HK2 catalyzed by the E3 ligase TRAF6 was critical for the subsequent recognition of HK2 by the autophagy receptor protein SQSTM1/p62 for the process of selective autophagic degradation. In a tissue microarray of human liver cancer, the combination of high HK2 expression and high SQSTM1 expression was shown to have biological and prognostic significance. Furthermore, 3-BrPA, a pyruvate analog targeting HK2, significantly decreased the growth of autophagy-impaired tumors in vitro and in vivo (p < 0.05). By demonstrating the regulation of glycolysis by autophagy through the TRAF6- and SQSTM1-mediated ubiquitination system, our study may open an avenue for developing a glycolysis-targeting therapeutic intervention for treatment of autophagy-impaired liver cancer.
Abbreviations
| 2-DG | = | 2-deoxy-D-glucose |
| 3-BrPA | = | 3-bromopyruvate |
| ATG | = | autophagy-related |
| Baf A1 | = | bafilomycin A1 |
| BECN1 | = | Beclin 1 |
| BTRC/β-TRCP | = | beta-transducin repeat containing E3 ubiquitin protein ligase |
| CALCOCO2/NDP52 | = | calcium binding and coiled-coil domain 2 |
| CDH1 | = | cadherin 1 |
| CHX | = | cycloheximide |
| CMA | = | chaperone-mediated autophagy |
| CQ | = | chloroquine |
| ECAR | = | extracellular acidification rate |
| EGFP | = | enhanced green fluorescent protein |
| FBXW7/FBW7 | = | F-box and WD repeat domain containing 7 |
| GAPDH | = | glyceraldehyde-3-phosphate dehydrogenase |
| HK2 | = | hexokinase 2 |
| HSPA8/Hsc70 | = | heat shock protein family A (Hsp70) member 8 |
| LAMP2A | = | lysosomal associated membrane protein type 2A |
| LDHA | = | lactate dehydrogenase A |
| MAP1LC3B | = | microtubule associated protein 1 light chain 3 beta |
| MTOR | = | mechanistic target of rapamycin |
| NBR1 | = | autophagy cargo receptor |
| NFE2L2/NRF2 | = | nuclear factor, erythroid 2 like 2 |
| OCR | = | oxygen consumption rate |
| PB1 | = | phox and bem1 |
| PFKP | = | phosphofructokinase, platelet |
| PKM | = | pyruvate kinase, muscle |
| shRNA | = | short hairpin RNA |
| siRNA | = | small interfering RNA |
| SKP2 | = | s-phase kinase associated protein 2 |
| SQSTM1 | = | sequestosome 1 |
| TMA | = | tissue microarray |
| TRAF6 | = | TNF receptor associated factor 6 |
| UBA | = | ubiquitin association domain |
Introduction
Autophagy is a conserved process of intracellular lysosomal degradation occurring in chronic liver diseases including viral hepatitis, alcoholic liver disease and fatty liver disease [Citation1–3]. Evidence suggests that autophagy may serve as a tumor suppressor in chronic liver disease and liver cirrhosis and that a deficiency in autophagy may lead to liver cancer [Citation4]. The physiological importance of autophagy is illustrated by the involvement of autophagy-related proteins in eliminating damaged organelles such as mitochondria and unfolded proteins. For example, the heterozygous deletion of BECN1 (beclin 1) increases the frequency of spontaneous malignancies and accelerates the development of hepatitis B virus-induced premalignant lesions [Citation5]. Systemic or liver-specific deletion of either the Atg5 or Atg7 gene in mice results in benign liver adenomas [Citation6]. Growing evidence suggests that the accumulation of SQSTM1/p62 [Citation7,8], oxidative stress [Citation9], and increased DNA damage response [Citation10] contribute to tumorigenesis in autophagy-impaired liver cancer. However, it is unknown whether impaired autophagy regulates different physiological processes through additional mechanisms in liver cancer.
Aerobic glycolysis was first described by Otto Warburg to explain the unconventional metabolism exhibited by cancer cells even in the presence of oxygen [Citation11,12]. In glycolysis, glucose is broken down into pyruvate, and the intermediates are utilized for other branch point synthesis, thereby providing cancer cells with an abundant supply of macromolecules such as proteins, lipids, and nucleotides to satisfy their heightened metabolic needs [Citation12–14]. Glycolysis has been generally associated with the proliferation of hepatocarcinoma [Citation15,16]. Thus, the mechanisms regulating glycolysis and protein components of glycolytic pathways have recently gained much attention. HK2/hexokinase II, is one such attractive target in glucose metabolism, that catalyzes the irreversible rate-limiting step in the glycolytic pathway [Citation17]. Previous reports have revealed that HK2 is frequently upregulated in liver cancer tissues and is associated with poor patient outcomes [Citation16,18]. Moreover, HK2 is increasingly being recognized to play an important role not only in glycolysis but also in autophagy [Citation19].
Here, we provide the first demonstration that impaired autophagy contributes to the substantial concomitant enhancement of glycolysis in liver cancer. We provide evidence that autophagy modulates the level of glycolysis through ubiquitin-mediated selective degradation of HK2.
Results
Identification of autophagy as a negative regulator of glycolysis in liver cancer cells
To investigate the relationship between autophagy and glycolysis, we disrupted the autophagic flux to analyze potential changes in glycolysis. Autophagic flux was investigated in Bel7402 human liver cancer cells by introducing the autophagy activator rapamycin, which inhibits the MTOR (mechanistic target of rapamycin) complex, and the autophagy inhibitor bafilomycin A1 (Baf A1), which is an inhibitor of the vacuolar-type H+-translocating ATPase and blocks fusion between autophagosomes and lysosomes. As shown in , Baf A1 treatment enhanced glucose consumption and lactate production, whereas rapamycin treatment suppresssed them. To further elucidate the role of autophagy in glycolysis, we stably expressed retrovirus shRNAs against 2 autophagy related (ATG) genes ATG5 or ATG7 in SMMC7721 cell lines. As shown in and , knocking down ATG5 or ATG7 enhanced the glucose consumption and lactate production, indicating that the autophagy-impaired cells acquired a higher glycolysis phenotype. Next, we measured the extracellular acidification rate (ECAR), in the presence or absence of ATG5 or ATG7 knockdown. The results showed increased glycolytic activity (glycolysis and glycolytic capacity) in ATG5 or ATG7 knockdown cells when compared with control cells (, Figure S1A, Figure S1B).
Figure 1. Glycolysis level in different autophagicflux liver cancer cells. (A-C) The glycolysis level is inversely related to autophagic flux. (A) Relative glucose consumption and lactate (Lac) production in control versus rapamycin (20 μM)- or Baf A1 (100 nM)-treated Bel7402 cells after 24h treatment. P values were calculated using an unpaired t test. The values are presented as the means ± SEM, n = 3, *p<0.05, ***p<0.001. (B and C) SMMC7721 cells silenced with control, ATG5 or ATG7 shRNAs were subjected to measurement of glucose consumption and lactate production. The values are presented as the means ± SEM, n = 3, *p<0.05, **p<0.01. (D) ATG5 or ATG7 knockdown increases glycolysis. ECAR measured in SMMC7721 cells with control, ATG5 or ATG7 silencing using shRNAs. G, 10 mM glucose; O, 1 μM oligomycin; D, 50 mM 2-DG injection. Bar graph represents glycolysis and glycolytic capacity. The values are presented as the means ± SEM, n = 3, *p<0.05, **p<0.01.
To specifically address the role of autophagy in glycolysis, we sought to evaluate glycolysis differences in a cell population of different basal autophagy. To accomplish this, we generated HepG2 cells stably expressing this reporter denoted as “mCherry-EGFP-MAP1LC3B” and used flow cytometry to sort the cells into high- and low-flux populations according to the mCherry:EGFP ratio (Figure S1C). This reporter allowed us to monitor the autophagic flux by analyzing 2 fluorenscent proteins, mCherry and EGFP. Owing to the high sensitivity of EGFP fluorescence to the acidic environment of the autolysosome, when autophagosomes fuse with lysosomes, the mCherry:EGFP ratio increased. Successful sorted cells were observed by laser-scanning confocal microscopy assessing the MAP1LC3B puncta to corroborate this method (Figure S1D). We found that high autophagic flux cells exhibited a low-glycolysis phenotype, and low-autophagic flux cells exhibited a high glycolysis phenotype, confirming that autophagy was a negative regulator of glycolysis (Figure S1E). These results indicated that glycolysis was negatively regulated by autophagy.
HK2 is required for the regulation of glycolysis by autophagy
We next attempted to identify the possible proteins responsible for the regulation of glycolysis by autophagy. To validate which proteins in glycolytic pathways were affected by autophagy, we examined 5 enzyme kinases, HK2, PKM (pyruvate kinase, muscle), LDHA (lactate dehydrogenase A), PFKP (phosphofructokinase, platelet) and GAPDH (glyceraldehyde-3-phosphate dehydrogenase) between control and autophagy-deficient cells, and found that knockdown of ATG5 increased the levels of HK2 but not those of the other enzymes (), suggesting that autophagy affects the expression level of HK2, whereas it has no effect on other glycolytic kinases.
Figure 2. HK2 is required for the regulation of glycolysis by autophagy. (A) Depletion of the autophagy essential gene ATG5 has no effect on the expression levels of genes encoding glycolytic proteins except HK2. Normalized quantification of mean gray intensity was determined from 3 separate experiments. The values are presented as the means ± SEM, *p<0.05. n.s., not significant. (B) HK2 is essential for glycolytic capacity. Relative glucose consumption and lactate (Lac) production in control versus HK2 knockdown cells. The values are presented as the means ± SEM, n = 3, *p<0.05, **p<0.01. The knockdown effect of the shRNA was examined by immunoblot. (C and D) HK2 is essential for the regulation of glycolysis by autophagy. (C) Relative glucose consumption and lactate production in SMMC7721 cells expressing control siRNA or siHK2 in the presence or absence of treatment with rapamycin (20 μM) or Baf A1 (100 nM). (D) SMMC7721 cells silenced with HK2 were re-expressed with exogenous HK2, and relative glucose consumption and lactate production were measured 16 h after treatment with rapamycin or Baf A1. The values are presented as the mean ± SEM, n = 3, *p<0.05, **p<0.01, n.s., not significant. (E) Impaired glycolysis activation in autophagy-deficient cells after HK2 knockdown. SMMC7721 cells with stable transfection of ATG5 shRNA were transfected with HK2 siRNA, After 48 h, the cells were subjected to ECAR analysis. (F) Ectopic expression of HK2 rescues the effect of HK2 silencing on glycolysis. SMMC7721 cells silenced with HK2 were re-expressed with exogenous HK2, then ECAR was measured. G, 10 mM glucose; O, 1 μM oligomycin; D, 50 mM 2-DG injection. Bar gragh represents glycolysis and glycolytic capacity. The values are presented as the means ± SEM, n = 3, *p<0.05, N.S., not significant.
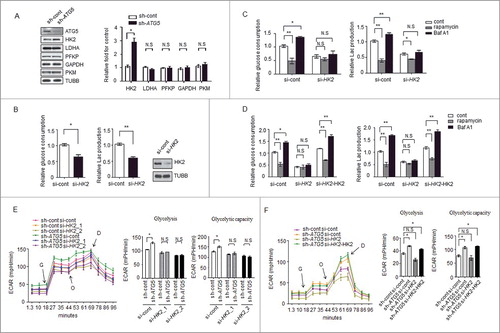
To validate the role of HK2 in controlling glycolysis, siRNAs targeting HK2 were used to evaluate the glycolytic activity. We found that the decrease in the levels of HK2 led to a significant decrease in lactate production and glucose consumption (), a result consistent with previously published observations [Citation16,20]. Next, we reasoned that HK2 would be required for the regulation of glycolysis by autophagy. We used a small interfering RNA (siRNA) approach to decrease the expression of HK2 in SMMC7721 cells and found that rapamycin and Baf A1 had much milder effects on the lactate production and glucose consumption in the siRNA-expressing cells compared with the cells expressing control siRNA (). Interestingly, when re-introduced a plasmid carrying HK2 into the knockdown cells, a significant increase of glucose consumption and lactate production upon Baf A1 treatment was observed again. We also observed a significant decrease of glucose consumption and lactate production upon rapamycin treatment in these cells ().
To further reveal the potential function of HK2 in the regulation of glycolysis by autophagy, glycolysis was measured in SMMC7721 cells with stable ATG5 knockdown and transfected with siRNAs against HK2 (HK2_1, HK2_2). The results showed the ATG5-deficient cells lost the ability to maintain high glycolytic activity (glycolysis and glycolytic capacity) when HK2 was knocked down (, Figure S2A). Furthermore, ectopic expression of HK2 rescued the effect of HK2 silencing on glycolytic activity in SMMC7721 cells, as shown in , S2B. These results suggested that HK2 mediates the modulation of glycolysis in response to autophagic flux.
Selective autophagic degradation of HK2 via the autophagic receptor SQSTM1
The increase of HK2 protein level in autophagy-deficient cells led us to determine if it occurred at the trascription level or through protein stability. We examined the mRNA levels corresponding to glycolytic proteins in cells transfected with control shRNA or ATG5 shRNA. We found that most of the genes encoding glycolytic proteins, including HK2, had similar levels of mRNA in the 2 groups (). Moreover, rapamycin and Baf A1 treatment had no significant effect on HK2 mRNA levels (). Therefore, autophagy did not affect HK2 at the transcriptional level.
Figure 3. Autophagy selectively degrades HK2 via the autophagic receptor SQSTM1. (A) The mRNA levels of glycolytic genes in the control and ATG5 knockdown cells. The values are presented as the means ± SEM, n = 3. (B) The levels of HK2 mRNA in the cells subjected to rapamycin and Baf A1 treatment. The values are presented as the means ± SEM, n = 3. (C) Autophagy promotes the degradation of HK2. Immunoblot analysis of HK2 in SMMC7721 cells with rapamycin (10 μM, 20 μM) and Baf A1 (100 nM, 200 nM) treatment for 16 h. (D) HK2 is stabilized in ATG5 or ATG7 knockdown cells. SMMC7721 cells silenced with control, ATG5 or ATG7 shRNA were then treated with CHX for the indicated time. HK2 protein stability was determined by immunoblot analysis. (E) SQSTM1 is an autophagic receptor of HK2. Immunoblot analysis of HK2 from SMMC7721 cells bearing siRNA against SQSTM1, treated with Baf A1. (F) The interaction between HK2 and wild-type SQSTM1 but not UBA-deficient SQSTM1. SMMC7721 cells were transfected with GFP-tagged HK2 and FLAG-tagged wild-type SQSTM1 or its UBA domain deletion mutant. Immunoprecipitation assays were performed with antibodies against GFP and Flag.
Next we tested whether autophagy would affect protein stability of HK2. Rapamycin was used to induce, and Baf A1 was used to inhibit, autophagy in another liver cancer cell line, Huh7. As shown in , we observed a decrease of HK2 protein levels upon rapamycin treatment and a considerable increase of HK2 protein levels upon Baf A1 treatment. Moreover, the levels of HK2 rapidly increased within 3 h of Baf A1 treatment (Figure S3A). This finding suggested that autophagy might affect the protein stability of HK2, and probably through the degradation pathway. To directly test the effect of autophagy on the degradation of endogenous HK2 protein, we first blocked protein synthesis using cycloheximide (CHX) in ATG5 or ATG7 knockdown cells and pulse-chased the HK2 protein in SMMC7721 cells. The stable level of HK2 protein was found to be quickly decreased within 12 h in control cells, whereas, HK2 protein was strongly increased after ATG5 or ATG7 knockdown and degraded more slowly ().
Next, we analyzed HK2 protein expression in the cells with high- or low-basal autophagy sorted by flow cytometry as in Figure S1C. We found that the cells with low autophagic flux exhibited high expression of HK2, and HK2 showed obvious evidence of increase after the treatment with Baf A1 in high-flux cells in contrast to the ones with low flux (Figure S3B). Furthermore, treatment of the cells with the proteasome inhibitor MG132 did not affect the HK2 protein level (Figure S3C). These results demonstrated that HK2 was degraded through autophagy. Autophagic degradation can be categorized as nonselective or selective. In nonselective autophagy, cytoplasmic contents are randomly engulfed into phagophores, the precursors to autophagosomes, the latter of which fuse with lysosomes, resulting in cargo degradation. In contrast, in selective autophagy, cargos such as proteins, and organelles are specifically recognized by autophagy receptors and subsequently degraded [Citation21]. Nonselective autophagy is primarily a starvation response, whereas selective autophagy occurs in cells for a variety of purposes, including remodeling to adapt to changing environmental/nutritional conditions and elimination of damaged organelles [Citation22]. In selective autophagy, autophagy receptors, such as SQSTM1, NBR1 and CALCOCO2/NDP52, bind their cytosolic substrates and MAP1LC3B (or related Atg8-family members) proteins that are attached to the membranes of phagophores. Accordingly, autophagy receptors may confer cargo recognition [Citation23].
To elucidate how HK2 is degraded through autophagy, we first sought to identify the autophagy receptors for HK2. SQSTM1 is an autophagy receptor and a signaling scaffold with an N-terminal oligomerization domain (PB1) and a ubiquitin-association domain (UBA) at its C terminus, which is involved in the process of selective autophagy [Citation24,25]. As illustrated in , cells treated with SQSTM1-siRNA exhibited high levels of HK2 compared with the control levels, and HK2 did not further accumulate in the cells after Baf A1 treatment. On the basis of these data, we examined the capacity of HK2 to associate with wild-type SQSTM1. HK2 can interact with SQSTM1; however, the HK2-SQSTM1 interaction did not occur with SQSTM1 lacking the C-terminal UBA domain (), thus suggesting that SQSTM1 is the autophagic receptor of HK2. These data indicated that HK2 is degraded by selective autophagy through recognition by the autophagy receptor SQSTM1.
TRAF6 promotes lys63-linked ubiquitination of HK2 for autophagic degradation
Prompted by the above findings, we analyzed the molecular events involved in this regulation. The most prevalent autophagy-targeting signal in mammals is the ubiquitination of cargos [Citation26,27]. To ascertain whether the interaction of HK2-SQSTM1 is associated with ubiquitination, we performed a coimmunoprecipitation assay and found that the Baf A1-treated cells showed a significantly high HK2 ubiquitination level (). Next we asked which kind of ubiquitin chain targets HK2 for degradation. Expression of a K63R ubiquitin mutant (unable to form K63-linked chains) impaired HK2 polyubiquitination, whereas a K48R mutant (unable to form K48-linked chains) did not (). Meanwhile, the K63-linked polyubiquitination accumulated significantly when autophagy was inhibited upon Baf A1 treatment and ATG5 knockdown, but remained upon MG132 treatment (). These observations demonstrate that HK2 with lysine 63 (K63)-linked poly-ubiquitin chains might be targeted for autophagy-dependent degradation.
Figure 4. TRAF6 promotes Lys63-linked ubiquitination of HK2 for autophagic degradation. (A) HK2 ubiquitination is stabilized after inhibition of autophagy. HEK293T cells were transfected with an HA-ubiquitin (HA-Ub) plasmid and treated with Baf A1 or left untreated. The cell lysates were subjected to immunoprecipitation using antibody against HK2. (B) HK2 ubiquitination with Lys63 ubiquitin linkages. HEK293T cells were cotransfected with plasmids expressing GFP-HK2 together with either wild-type, Lys63-mutated, or Lys48-mutated HA-Ub. The cell lysates were immunoprecipitated to affinity isolate the exogenous HK2 protein, and the polyubiquitinated linkage site was detected using an anti-HA antibody. (C) HK2 with Lys63-linked poly-ubiquitin chains is stabilized after inhibition of autophagy. HK2-expressing SMMC7721 cells cotransfected with or without shATG5 and treated as indicated for 12 h. (D) Immunoprecipitation analysis of the lysed HEK293T cells transfected with siRNAs against various E3 ligases. (E) Direct interaction between HK2 and TRAF6. Immunoprecipitation analysis of the interaction between endogenous HK2 and endogenous TRAF6.(F) Knockdown of TRAF6 results in accumulation of ubiquitinated HK2 associated with autophagic degradation. SMMC7721 cells were infected with control siRNA or TRAF6 siRNA, and this was followed by Baf A1 treatment for 12 h. Immunoprecipitation analysis of HK2 ubiquitination with the indicated antibodies. (G) HK2 is stabilized in TRAF6 knockdown cells. SMMC7721 cells silenced with control, TRAF6 siRNA were then treated with CHX for the indicated time. HK2 protein stability was determined by immunoblot analysis.
Next, we attempted to identify potential E3 ligase candidates for HK2. We used siRNAs to screen a panel of E3 ubiquitin ligases for HK2. Among the 5 common ligases, only the knockdown of TRAF6 decreased the abundance of HK2 ubiquitination, but decreases in BTRC/β-TRCP, FBXW7/FBW7, CDH1 and SKP2 did not elicit this effect (). Given these facts, we focused on TRAF6, an E3 ubiquitin ligase that catalyzes the autologous synthesis of K63-linked polyubiquitin chains. Interaction of endogenous HK2 with endogenous TRAF6 was detected (). We then examined the functional significance of TRAF6 enzyme activity in HK2 ubiquitination. In the presence of wild-type TRAF6, we found that HK2 ubiquitination was considerably upregulated, whereas the inactive TRAF6C70A harboring Cys-to-Ala substitution on Cys70 abolished this enhancement (Figure S4A). In contrast, downregulation of TRAF6 decreased HK2 ubiquitination (Figure S4B). This result suggested that TRAF6 might be the major E3 ligase ubiquitinating HK2.
To directly test the functional role of TRAF6 on endogenous HK2 protein ubiquitination, we transfected 293T cells with siRNA targeting TRAF6 and treated the cells with Baf A1 for 16 h to block autophagic degradation. A significant increase of K63-linked poly-Ub was observed in response to Baf A1 treatment, and this response was blunted in TRAF6 knockdown cells (). In addition, the capacity of SQSTM1 to interact with HK2 was also determined, and decreased binding was observed when TRAF6 was knocked down (), suggesting that TRAF6 is essential for the K63-linked ubiquitination of HK2 and the interaction between HK2 and SQSTM1. Based on the observations above, we next sought to test whether TRAF6 mediates the autophagic degradation of HK2. As shown in , knocking down endogenous TRAF6 in SMMC7721 cells with siRNA slowed down the degradation of HK2. Collectively, these results demonstrated that TRAF6 might be the major E3 ligase ubiquitinating HK2, and the Lys63-linked poly-ubiquitin chains target HK2 for autophagic degradation.
Lys41 in HK2 is the major site for ubiquitination and autophagic removal of HK2
We then sought to determine which of the lysine residues in HK2 might be the major ubiquitination sites that target HK2 for autophagic degradation. First, we identified the HK2 domains responsible for TRAF6-mediated ubiquitination. HK2 is composed of 2 domains [Citation28]. Its catalytic activity is associated with the C terminus, and its regulatory function is associated with the N terminus, and both domains have a molecular weight of 50 kDa (). To this end, we used the full-length form of HK2 and 2 deletion mutants (HK2[Δ1–475] and HK2[Δ476–917]). We found that the ubiquitination level at the N-terminal domain was much higher than that at the C-terminal domain, which was scarcely detected (). In addition, the ectopic expression of TRAF6 increased the ubiquitination of the N-terminal domain but not the C-terminal domain of HK2 (). Thus, the ubiquitination site of HK2 is functionally located in the N-terminal domain.
Figure 5. Ubiquitinated Lys41 in HK2 promotes the autophagic removal of HK2. (A) Schematic representation of HK2 protein structure and the deletion mutants generated to map the domains. (B) Vector control, wild-type HK2 and HK2 truncation mutants were cotransfected with a plasmid expressing HA-ubiquitin (HA-Ub) into HEK293T cells; immunoprecipitation analysis of HK2 ubiquitination was carried out with the indicated antibodies. (C) TRAF6 promotes the ubiquitination of N-terminal but not C-terminal truncation mutants. Wild-type HK2 and HK2 truncation mutants were cotransfected with FLAG-TRAF6 into HEK293T cells; immunoprecipitation was then performed and was followed by immunoblotting using the indicated antibodies. N, N-terminal truncation; C, C-terminal truncation; FL, full-length. (D) Identification of HK2 ubiquitination at K41 using mass spectrometry. GFP-HK2 and HA-Ub plasmids were cotransfected into HEK293T cells. At 24 h after transfection, Baf A1 (100 nM) was added for another 16 h. HK2 was purified by immunoprecipitation with an anti-GFP antibody and then analyzed using mass spectrometry. (E) HEK293T cells were transfected with the indicated plasmids then subjected to immunoprecipitation for the mutational assessment of the HK2 ubiquitination site. (F) Immunoblot assessment of HK2 stability in SMMC7721 cells transfected with either wild-type HK2 or K41-mutated HK2.
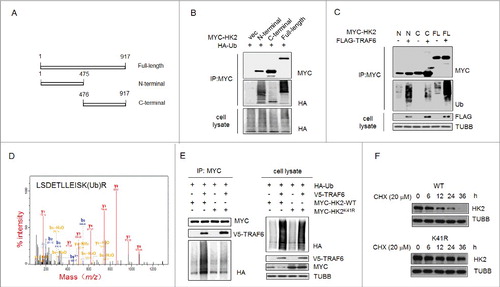
A mass spectrometric (MS) analysis was used to identify the ubiquitination site. The cells transfected with MYC-tagged HK2 and HA-ubiquitin were treated with Baf A1, and then the ubiquitinated HK2 was affinity isolated. On the basis of the results of mass spectrometry, a total of 4 lysine residues were found to be potential ubiquitination sites, and Lys41 was the only one in the N-terminal domain (). To further test the effects of Lys41 on the degradation of HK2, we generated HK2 mutants bearing a single Lys-to-Arg substitution at Lys41 to disrupt the ubiquitination. The HK2 mutant with the Lys41-to-Arg substitution demonstrated that TRAF6 was unable to promote its ubiquitination (). In addition, wild-type HK2 or the ubiquitination-disrupted K41R mutant expression vectors were transfected into HEK293T cells, and a CHX pulse-chase experiment was performed. We found that exogenously expressed HK2K41R was much more stable than exogenously expressed wild-type HK2 after exposure to cycloheximide (). Together, these results indicated that the ubiquitination on Lys41 might be functionally important for the selective degradation of HK2.
Correlation of HK2 and SQSTM1 in clinical liver cancer samples
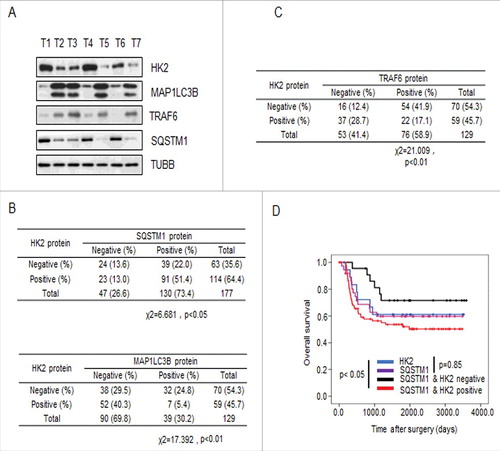
Previous work has shown that the function of SQSTM1 is primarily to deliver poly-ubiquitinated proteins and organelles for autophagosomal degradation. SQSTM1 is also one of the selective substrates for autophagy. Interference with autophagic flux attenuates the degradation of SQSTM1 [Citation29,30]. In addition, one of the common methods used to detect autophagy is to measure the microtubule associated protein 1 light chain 3-I lipidation product MAP1LC3B-II. MAP1LC3B-II is commonly used as a marker of autophagosomes and, therefore, used to monitor autophagy. To investigate whether HK2 functions as a autophagic substrate and bona fide glycolytic enzyme that relates to autophagy, we first validated the correlation between the expression of HK2 and SQSTM1 or MAP1LC3B. The expression of HK2, SQSTM1, and MAP1LC3B was analyzed in 7 liver cancer samples by immunoblotting.
As shown in , increased levels of HK2 protein were concomitantly accompanied by increased SQSTM1 expression and decreased MAP1LC3B expression. Next we confirmed that the glycolytic enzymes LDHA, PFKP, GAPDH and PKM had no correlation with SQSTM1 or MAP1LC3B in the same liver cancer samples (Figure S5A). We then performed immunohistochemical analysis to evaluate the potential association between HK2 and SQSTM1, MAP1LC3B, and TRAF6 in a tissue microarray (TMA) of liver cancer samples collected from the liver cancer patients who had not received any drug treatment before surgery. First, we tested the correlation between HK2 and SQSTM1 or MAP1LC3B expression. We observed a positive correlation between HK2 and SQSTM1, and a strong negative correlation between HK2 and MAP1LC3B (; χ2 = 6.681, p < 0.05; χ2 = 17.392, p < 0.01). Next, we tested the possible correlation between HK2 and TRAF6 and observed a strong negative correlation between HK2 and TRAF6 expression (; χ2 = 21.009, p < 0.01). Finally, we assessed the effects of HK2 and SQSTM1 expression on disease prognosis. The patients with tumors that were double positive for HK2 and SQSTM1 had significantly shorter overall survival than those with tumors that were either HK2-positive or SQSTM1-positive (, p < 0.05). Altogether, our results demonstrated that as the substrates of autophagy-dependent degradation, HK2 is negatively correlated with MAP1LC3B and TRAF6, and positively correlated with SQSTM1, and the expression level of HK2 and SQSTM1 are upregulated in liver cancer patients with poor prognoses.
Figure 6. HK2 is correlated with SQSTM1 in clinical samples. (A) Immunoblot analysis of HK2, SQSTM1, MAP1LC3B and TRAF6 expression in tumors from 7 patients. (B) Correlation study of HK2, SQSTM1, and MAP1LC3B expression in the liver cancer TMA consisting of 129 samples. (C) Correlation study of HK2 and TRAF6 expression in the liver cancer TMA. (D) Kaplan-Meier plots of the overall survival of patients, stratified by expression of HK2 and SQSTM1. The data were obtained from the Sun Yat-sen University Cancer Center liver cancer dataset.
Inhibition of glycolysis provides better therapeutic effects in autophagy-impaired liver cancer
Previous studies have demonstrated that impaired autophagy plays a causal role in liver cancer: the liver-specific deletion of the autophagy gene ATG7 results in severe hepatomegaly accompanied by hepatocyte hypertrophy and chronic liver injury [Citation6,31]. Because we confirmed the upregulation of glycolysis upon impaired autophagy in liver cancer, we reasoned that the inhibition of HK2 might serve as a critical and clinically actionable therapy to treat autophagy-impaired liver cancer. To test this possibility, we examined the effect of the pharmacological inhibition of HK2 on autophagy-impaired tumors in vitro. 3-bromopyruvate (3-BrPA), 2-deoxy-D-glucose (2-DG), and lonidamine, 3 distinct compounds are well-documented inhibitors of HK2. We observed a marked suppression of proliferation in ATG5 knockdown cells treated with 3-BrPA in comparison with the control group (). Similarly, 2-DG or lonidamine treatment in ATG5 knockdown cells resulted in a greater decrease of cell viability than seen with the control group. This finding indicated that ATG5 knockdown rendered cells more vulnerable to HK2 inhibition.
Figure 7. Autophagy-impaired liver cancers are more sensitive to glycolysis inhibition. (A) MTT assay showing SMMC7721 cells silenced with ATG5 shRNA were more sensitive to glycolysis inhibition in vitro. SMMC7721 cells transfected with control or ATG5 shRNA were then treated with the indicated doses of lonidamine, 2-DG and 3-BrPA for 24 h. Results are mean±SEM for experiments performed in triplicate. (B) The glycolysis inhibitor 3-BrPA inhibits the growth of autophagy-deficient xenograft tumors. SMMC7721 cells with stable knockdown of control or ATG5 were injected subcutaneously into the right flanks of nude mice. Two wk after the cells were injected, the mice in 2 groups were randomly separated into 4 groups. The mice were treated with either saline or 3-BrPA (5 mg/kg) by intraperitoneal administration every 3 d. When the tumor volume reached 450 mm3, the tumors were excised and photographed. The values are presented as the means ± SEM (n = 7–12). *p<0.05, **p<0.01. (C) Tumor volume curves on the indicated days. Tumor diameters were measured at fixed timepoints, and the tumor volumes were calculated. The values are presented as the means ± SEM, n = 7–12, *p<0.05 (Student t test). (D) Representative immunohistochemical staining results for MKI67 from tumor xenografts in nude mice. Scale bar: 50 μm. (E) A model depicting how autophagy might suppress glycolysis through the selective degradation of HK2. HK2 is subjected to K63-linked ubiquitination by TRAF6 at the K41 residue. Under high autophagic flux, SQSTM1 binds to and forms aggregates with the ubiquitinated HK2, then SQSTM1 recognizes MAP1LC3B and leads the aggregates to phagophores. Lysosomes fuse with the completed autophagosome and subsequently HK2 is degraded. In contrast, under low autophagic flux, the formation of a complex containing ubiquitinated HK2, SQSTM1, and MAP1LC3B is limited, and HK2 fails to be degraded in autolysosomes.
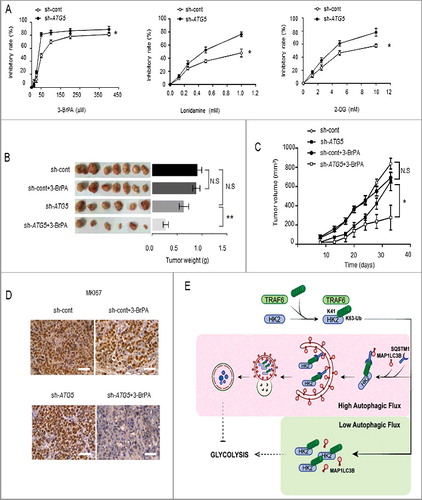
Subsequently, a tumorigenicity model of nude mice was used to further evaluate the tumor-suppressive effect of 3-BrPA on autophagy-impaired cancer in vivo. Stable SMMC7721 cell line derivates expressing empty vector or shRNA against ATG5 were subcutaneously inoculated into nude mice. Then, the mice were treated with intraperitoneal injections of either 3-BrPA or 0.9% saline every 3 d. The efficiency of tumorigenicity of the cancer cells in each group was assessed 7 d after the injection. We found that SMMC7721 cells transfected with ATG5 shRNA grew at a slower rate than those in the control group (no statistical significance), and 3-BrPA showed a more significant inhibitory effect on ATG5-deficient tumor growth (p < 0.01, , ). This result suggested a more potent tumor-suppressive role of 3-BrPA in autophagy-impaired tumors. In addition to the aforementioned features, we employed immunohistochemical analysis to detect the expression of MKI67/Ki67, which is a cellular marker for proliferation. The results revealed that although the xenografts with control or ATG5 knockdown both showed high MKI67 staining, 3-BrPA treatment exerted stronger inhibition on xenografts with ATG5 knockdown that displayed the weakest MKI67 staining, while the control xenografts still showed high MKI67 staining (). These findings demonstrated that the autophagy-impaired tumors following 3-BrPA treatment were less proliferative than the controls. Our results suggested that autophagy-impaired tumors were more sensitive to HK2 inhibition.
In conclusion, our study revealed a functional post-translational control mechanism for HK2. Our results suggested a model in which the HK2 protein is ubiquitinated by the E3 ligase TRAF6 at the Lys41 residue. The ubiquitinated HK2 protein is then recognized by the autophagic receptor SQSTM1 for selective degradation, thereby facilitating the suppressive regulation of glycolysis by autophagy.
Discussion
In this study, we identified autophagy as a regulator of glycolysis. We also identified a novel role for HK2 as a key regulator of glycolysis through autophagy, in which HK2 was Lys63 ubiquitinated by the E3 ligase TRAF6, particularly taking place on Lys41, thus promoting its recognition by the autophagy receptor SQSTM1 and leading to its selective degradation (). Thus, we report an HK2-dependent modulation of glycolysis in response to an elevated or a decreased autophagic flux.
There are 3 mechanisms by which autophagy monitors and regulates cellular metabolism: it provides the essential components for energy needs, it regulates the supply of energy by controlling the quality and dynamics of the mitochondria, and it modulates the levels of enzymes in metabolic pathways [Citation32]. In light of the critical role of enzymes in metabolic pathways, it is not surprising that autophagy participates in controlling metabolism through modulation of these enzymes. The following 3 types of autophagy stand out among the different post-translational regulatory mechanisms: macroautophagy, microautophagy and chaperone-mediated autophagy (CMA). CMA, a selective form of autophagy, mediates cargo delivery by substrates (individual proteins) binding with the chaperone HSPA8/Hsc70 and the interaction with LAMP2A (lysosomal associated membrane protein 2A) to lysosomes, not requiring the formation of autophagosomes. CMA has been described as being involved in metabolism by degrading glycolytic enzymes, such as HK2, PKM, and LDHA [Citation33–36]. In our research, we first found ATG5 or ATG7 knockdown upregulates HK2 expression; these genes both encode critical components of the macroautophagy pathway involved in the elongation and closure of the phagophore membrane and/or later steps in the pathway. Further results demonstrated that knockdown of endogenous SQSTM1 and mutation of the ubiquitination site on HK2, particularly Lys41, blocked the degradation of HK2 and stablized it. Thus, our findings provide novel evidence for a critical role of macroautophagy-mediated selective degradation of HK2 in stopping glycolysis. Meanwhile, we also examined the CMA-mediated degradation of HK2 in liver cancer cells. We knocked down endogenous LAMP2 in SMMC7721 cells by small interfering RNAs (Figure S3D). Immunoblot analysis revealed a mild upregulation of HK2 protein after knockdown of LAMP2, which suggested that not only macroautophagy but also CMA takes part in the degradation of HK2 in liver cancer cells. Overall, our study helps extend the role of macroautophagy in the regulation of metabolism.
This leads us to ask what is the physiological significance of the negative regulation of glycolysis by autophagy? As we know, autophagy is a conserved intracellular recycling process that maintains the balance of metabolites and biosynthetic intermediates in cells under conditions of starvation or other forms of cellular stress, such as growth factor withdrawal or oxidative stress. Our results are consistent with the established functional role of autophagy in maintaining cellular homeostasis. Under stress conditions, cancer cells will not proliferate excessively, in order to survive. In this circumstance, cells with high autophagy flux will downregulate glycolysis by selectively degrading HK2. In this way, depressed glycolysis contributes to slowing down cell proliferation. Autophagy thereby serves as a key process for metabolic adaptation in cancer cells.
SQSTM1 has multiple roles in tumorigenesis. It functions as a receptor for autophagy cargo [Citation37,38] or an activator of the NFE2L2/NRF2 pathway [Citation39,40], and participates in the development of cancer-related disease [Citation41]. Accumulation of SQSTM1 after autophagy failure is partly responsible for the tumorigenesis in liver tumors [Citation32]. Given its central role in targeting autophagy cargos to autophagosomes for degradation, it is likely that SQSTM1 mediates the degradation of HK2. Here our results identified SQSTM1 as an autophagic receptor of HK2 and demonstrated that the expression of HK2 and SQSTM1 was positively correlated, on the basis of immunohistochemical analysis of human liver cancer through microarrays (p < 0.05) and immunoblotting of liver cancer tumors. Most importantly, we found that patients with positive staining for HK2 and SQSTM1 in the tumors had shorter overall survival than those with negative staining for either of the 2 markers, indicating the combination of high HK2 expression and high SQSTM1 expression has biological and prognostic significance.
Of note, our study provides several insights into the therapeutic treatment of liver cancer depending on the manipulation of glycolysis and autophagy. First, our work attributes the pro-tumorigenic aspect of impaired autophagy in liver cancer to elevated glycolysis. Several genetic links between defects in autophagy and cancer have been previously reported. The ATG gene BECN1 is mono-allelically deleted in a high percentage of breast, ovarian and prostate cancers [Citation5,42,43]. Given the clear role of BECN1 in initiating autophagy, these cancers probably have decreased autophagic flux. In our experimental system, glycolysis was activated in response to the suppression of autophagy; autophagy-impaired tumors were more sensitive to a glycolysis inhibitor. Therefore, glycolysis may be responsible for increasing cancer risk by providing energy and supporting the survival of autophagy-impaired cancers. Second, we suggest that the tumors treated with autophagy inhibitors should be monitored closely and may need additional interventions against glycolysis. Autophagy has been recognized to function as a protective regulator in some cancers [Citation44–46], and inhibitors of autophagy, such as 3-methyladenine, wortmannin, chloroquine and Baf A1, may be beneficial in some circumstances. We now show that the inhibition of autophagy is compatible with upregulated glycolytic features. We also demonstrate dramatic upregulation of glycolysis after ATG5 ablation. Hence, the results indicate that the patients who receive autophagy inhibitors as therapy may not have a full response to the autophagy inhibitor treatment alone but may benefit from cotreatment with glycolysis inhibitors.
In conclusion, our data identify HK2 as a substrate for selective autophagy, and establish crosstalk between autophagy and glycolysis through the TRAF6- and SQSTM1-mediated ubiquitination and recognition system, thus providing a mechanism for the selective degradation of HK2. Our investigation also indicates that impaired autophagy contributes to substantial concomitant enhancement of glycolysis. These results reveal the previously unrecognized concept that the elevated glycolysis may be attributed to the failure of autophagy inhibitors in blocking cell proliferation and growth; in this situation liver cancer development is largely dependent on glycolysis. Our results indicate that a combined therapy targeting both autophagy and glycolysis may be effective for the treatment of liver cancer, as well as other cancers.
Materials and methods
Antibodies and reagents
All antibodies were used at a dilution of 1:1000 unless otherwise specified. Antibodies to the following proteins or epitope tags HK2 (2867), ATG5 (2630), TRAF6 (8028), LDHA (36671), PKM (4053), PFKP (12746), TUBB/beta-tubulin (2128), GAPDH (5174), HA (3724), K63-linked ubiquitin (5621), MYC (2276), MKI67/Ki67 (9449) were purchased from Cell Signaling Technology. Anti-MAP1LC3B (NB100-2220) antibody was obtained from Novus. Anti-SQSTM1 (28359) and anti-GFP (5385) antibodies were purchased from Santa Cruz Biotechnology. Anti-FLAG (F1804) was obtained from Sigma Aldrich. The XF24 Glycolysis Stress Test Kit (102194-100) was obtained from Agilent Seahorse. Baf A1 (S1413) was obtained from Selleck Chemicals. Rapamycin (37094), 3-bromopyruvic acid (16490), MG132 (M7449) and chloroquine diphosphate salts (C6628) were obtained from Sigma Aldrich.
Cell culture and transfection
HEK293T (CRL-11268) and HepG2 (HB-8065) cell lines were obtained from the American Type Culture Collection. SMMC7721, Bel7402 and Huh7 cell lines were kindly given by Prof. Xinyuan Guan, The University of Hong Kong, Hong Kong, China. All the cell lines are grown in DMEM supplemented with 10% fetal bovine serum. All plasmids were transfected into the cell lines with Lipofectamine 2000 (Life Technology, 11668500), according to the manufacturer's instructions.
DNA constructs and mutagenesis
pBABE-EGFP-mCherry-MAP1LC3B (22418, deposited by Jayanta Debnath) and pGFPN3-HK2 (21920, deposited by Hossein Ardehali) plasmids were obtained from Addgene. Plasmid pcDNA3.1-FLAG-TRAF6 (T0134) was obtained from GeneCopoeia. Plasmid pENTER-FLAG/HIS-SQSTM1 (CH858197) was purchased from Vigene. The constructs coding for full-length HK2 and its fragment with the MYC tag were cloned into the pcDNA3.1 vector (addgene, 52535, deposited by Adam Antebi) between BamHI and EcoRI restriction sites. The constructs coding for TRAF6 with the V5 tag were cloned into the pcDNA3.1 vector between BamHI and EcoRI restriction sites. Site-directed mutations in pcDNA3.1-MYC-HK2, pcDNA3.1-FLAG-TRAF6 and HA-Ub (addgene, 18712, deposited by Edward Yeh) plasmids were generated by using the ClonExpress II One Step Cloning Kit (C112-01) from Vazyme.
shRNA and siRNA
For stable ATG5 siRNA expression, the retroviral vector (pSUPER. puro, a gift of Professor Musheng Zeng, Cancer Center, Sun Yat-sen University, Guangzhou, China) encoding hairpin RNA sequences was constructed. Short hairpin RNA (shRNA) sequence against ATG5 [Citation47] was generated and cloned into the expression vector. All siRNAs were produced by GenePharma and transfected with Lipofectamine RNAiMAX (Life Technology, 13778-150) according to the manufacturer's protocol. The target sequences for siRNA against the human HK2, TRAF6 and SQSTM1 genes were as follows:
HK2 no.1 (5′-GGAGGAUGAAGGUAGAAAUTT-3′)
HK2 no.2 (5′-GUCGCUUUGAGACC AAAGATT-3′)
TRAF6 no.1 (5′-GGGUACAAUACGCCUUACATT-3′)
TRAF6 no.2 (5′-GCAGUGCAAUGGAAUUUAUTT-3′)
SQSTM1 no.1 (5′- ACAGAUGCCAGAAUCGGAA)
SQSTM1 no.2 (5′- GCAUUGAAGUUGAUAUCGAUU)
Metabolite measurements
Glucose and lactate concentrations in the culture supernatants were measured using colorimetric kits (BioVision, K686, K627) according to the manufacturer's instructions. The absorbance was measured at 450 nm using a Multiskan MK3 microplate-reader (Thermo Fisher Scientific). All experiments were performed in triplicate as described previously.
Metabolic assays
Glycolysis and glycolytic capacity (extracellular acidification rate, ECAR) were measured with the Seahorse Extracellular Flux (Seahorse Biosciences, XF-96) analyzer according to the manufacturer's protocol (Seahorse Biosciences, 102194-100). Briefly, cells were transfected with siRNA and 48 h after transfection, 50,000 cells per well were plated into XFe 24-well plates (Seahorse Biosciences, 09516) and incubated for 16 h at 37˚C in a 5% CO2 humidified atmosphere. For ECAR, cells were washed in XF assay medium (Seahorse Biosciences, 30815011). Cells were then kept in XF assay medium at 37˚C, in a non-CO2 incubator for 1 h. After the incubation time, 10 mM glucose (Seahorse Biosciences, 9710846), 1 μM oligomycin (Seahorse Biosciences, 9710846) and 50 mM 2-DG (Seahorse Biosciences, 9710846) were loaded into the injection ports in the XFe 96 sensor cartridge in sequence. Specifically, glucose was added for glycolysis assessment, and glycolytic capacity was assessed following the oligomycin injection, which inhibits oxidative phosphorylation. After injection of 2-DG, which inhibits glycolysis, nonglycolytic acidification is dominant. The experiment was performed 3 times.
Tissue microarray
Paraffin-embedded microarrays of liver cancer tissues were obtained from Sun Yat-Sen University Cancer Center. Immunohistochemical staining was performed as previously described to analyze the expression of HK2, SQSTM1, MAP1LC3B, and TRAF6. A pathologist scored the cores, and tumor staining intensity was compared to staining in normal liver tissue.
Proliferation assays
Cell growth inhibition by 3-BrPA (Sigma Aldrich, 16490) was determined by MTT assay (Sigma Aldrich, M5655). Cells at the volume of 180 μl were seeded into 96-well plates and incubated overnight at 37°C in a humidified atmosphere of 5% CO2, then the cells were exposed to 10 μl 3-BrPA for another 24 h. Following treatment, 10 μl MTT was added to each well for another 4 h at 37°C. After that, MTT solution was removed and replaced with 100 μl DMSO. The absorbance was measured using a microplate reader (Bio-Rad) at 570 nm to estimate cell viability.
Immunoblot and immunoprecipitation
Cell extracts were generated using lysis buffer (Cell Signaling Technology, 9803) supplemented with protease inhibitor cocktail (Roche Applied Science, 4693159001) immediately before use. Proteins were denatured by adding 6 × SDS sample buffer and boiled at 100°C for 10 min, then separated by SDS-PAGE. For immunoprecipitation, cells were prepared in E1A lysis buffer (250 mM NaCl, 50 mM HEPES, pH 7.5, 0.1% NP-40 [Roche Applied Science, 9016-45-9], 5 mM EDTA) supplemented with protease inhibitor cocktail before use. Immunoprecipitation was carried out either by incubating anti-MYC agarose affinity gel antibodies (Biotool, B23402) with cell lysates overnight at 4°C or by incubating appropriate antibody with lysates for 2–3 h, followed by further incubation with protein-A/G agarose beads (Roche Applied Science, 11134515001) overnight.
Real-time PCR
Total RNA was extracted by the use of TRIZOL reagent (Life Technology, 15596018). Equal amount of total RNA from each sample was subjected to reverse transcription using PrimeScript RT reagent Kit with gDNA Eraser (TAKARA, RR047A) to synthesize cDNA. Real-time PCR was performed with SYBR Green (Roche Applied Science, 4913914001) on a real-time PCR CFX96 (Bio-Rad) following the manufacturer's instructions.
Mass spectrometry
HEK293T cells were transfected with GFP-HK2 expression plasmids and cultured for 24 h, then the transfected HEK293T cells were treated with 100 nM Baf A1 for 16 h before being harvested. Cells were collected and lysed with E1A lysis buffer (250 mM NaCl, 50 mM HEPES, pH 7.5, 0.1% NP-40 [Roche Applied Science, 9016-45-9], 5 mM EDTA) and the cell extracts were immunoprecipitated with the anti-GFP monoclonal antibody and protein G-agarose beads (Thermo, 20399). The GFP-eluted material was separated by 6% SDS-PAGE. The HK2 bands and the above regions were excised from the gel and subjected to mass spectrometry for the ubiquitination analysis. Protein and modification identification was performed with the database search, and peptide identifications were validated with Peptide Prophet.
Animal studies
Nude mice (female, 4 wk old, and 16–20 g) were randomly divided into 4 groups (n = 15 for each group), and 3 × 10⁶ SMMC7721 cells constitutively expressing control or ATG5 shRNA constructs were inoculated subcutaneously into the flanks of nude mice. 3-BrPA was injected intraperitoneally every 3 d at the concentration of 5 mg/kg/d, 0.9% saline as control. The presence or absence of a visible or palpable tumor was evaluated and tumor growth was monitored each time. Tumor volume (V) was calculated by the formula 0.5 × length × width [Citation2]. The mice were then sacrificed until the tumor volume exceeded 800 mm3 and the tumors were excised and embedded in paraffin. All animal experiments were conducted in accordance with the institutional guidelines and approved by the Animal Care and Use Committee of Sun Yat-sen University Cancer Center.
Immunohistochemistry
Xenograft tumors were fixed in 4% paraformaldehyde overnight, embedded in paraffin, sectioned and stained with primary antibody to MKI67 (1:200 dilution). Each sample was scored by an H-score method that combines the values of immunoreaction intensity and the percentage of tumor cell staining.
Statistical analysis
Unpaired Student t tests were performed to compare the differences. Error bars represent SEM unless otherwise noted, and statistical significance is indicated as *p < 0.05,**p < 0.01, and ***p < 0.001. Clinical correlation between HK2, SQSTM1, MAP1LC3B and TRAF6 was also determined by using a χ2 test.
Disclosure of potential conflicts of interest
No potential conflicts of interest are disclosed.
Grant support
This work was supported by the Natural Science Foundation of China under grants 81572732, 81630079, 81572493, 81572605, 81702288 and 81772624; the Science and Technology project of Guangdong Province under grants 2014B050504004, 2015B050501005 and 2017A020215032; the Natural Science Foundation of Guangdong in China under grant 2014A030313010, 2014A030313017, the Major Science and Technology Project of Guangzhou under grants 201504010038 and 201707010086; the Fundamental Research Funds for the Central Universities 17ykjc25.
supp-data-1381804.pptx
Download MS Power Point (7.6 MB)Acknowledgments
We thank Dr. Minshan Chen and Dr. Keli Yang (Department of Hepatobiliary Surgery, Sun Yat-sen University Cancer Center) for providing the microarrays of liver cancer tissues, Dr. Peng Huang (MD Anderson Cancer Center) for providing helpful and intensive discussions, Dr. Xinke Zhang (Department of Pathology, Sun Yat-sen University Cancer Center) for support with immunohistochemical scoring and Dr. Xinxing Lei for the excellent graphical abstract.
Additional information
Funding
Related Research Data
References
- Eskelinen EL, Saftig P. Autophagy: a lysosomal degradation pathway with a central role in health and disease. Biochim Biophys Acta. 2009;1793(4):664–673. doi:10.1016/j.bbamcr.2008.07.014.
- Hidvegi T, Ewing M, Hale P, et al. An autophagy-enhancing drug promotes degradation of mutant alpha1-antitrypsin Z and reduces hepatic fibrosis. Science. 2010;329(5988):229–232. doi:10.1126/science.1190354. PMID:20522742.
- Lin CW, Zhang H, Li M, et al. Pharmacological promotion of autophagy alleviates steatosis and injury in alcoholic and non-alcoholic fatty liver conditions in mice. J Hepatol. 2013;58(5):993–999. doi:10.1016/j.jhep.2013.01.011. PMID:23339953.
- Czaja MJ, Ding WX, Donohue TM, Jr., et al. Functions of autophagy in normal and diseased liver. Autophagy. 2013;9(8):1131–1158. doi:10.4161/auto.25063. PMID:23774882.
- Qu X, Yu J, Bhagat G, et al. Promotion of tumorigenesis by heterozygous disruption of the beclin 1 autophagy gene. J Clin Invest. 2003;112(12):1809–1820. doi:10.1172/JCI20039. PMID:14638851.
- Takamura A, Komatsu M, Hara T, et al. Autophagy-deficient mice develop multiple liver tumors. Genes Dev. 2011;25(8):795–800. doi:10.1101/gad.2016211. PMID:21498569.
- Inami Y, Waguri S, Sakamoto A, et al. Persistent activation of Nrf2 through p62 in hepatocellular carcinoma cells. J Cell Biol. 2011;193(2):275–284. doi:10.1083/jcb.201102031. PMID:21482715.
- Komatsu M. Potential role of p62 in tumor development. Autophagy. 2014;7(9):1088–1090. doi:10.4161/auto.7.9.16474.
- Tian Y, Kuo CF, Sir D, et al. Autophagy inhibits oxidative stress and tumor suppressors to exert its dual effect on hepatocarcinogenesis. Cell Death Differ. 2015;22(6):1025–1034. doi:10.1038/cdd.2014.201. PMID:25526090.
- Qiang L, Zhao B, Shah P, et al. Autophagy positively regulates DNA damage recognition by nucleotide excision repair. Autophagy. 2016;12(2):357–368. doi:10.1080/15548627.2015.1110667. PMID:26565512.
- Vander Heiden MG, Cantley LC, Thompson CB. Understanding the Warburg effect: the metabolic requirements of cell proliferation. Science. 2009;324(5930):1029–1033. doi:10.1126/science.1160809. PMID:19460998.
- Dang CV. Links between metabolism and cancer. Genes Dev. 2012;26(9):877–890. doi:10.1101/gad.189365.112. PMID:22549953.
- Gatenby RA, Gillies RJ. Why do cancers have high aerobic glycolysis? Nat Rev Cancer. 2004;4(11):891–899. doi:10.1038/nrc1478. PMID:15516961.
- Lunt SY, Vander Heiden MG. Aerobic glycolysis: meeting the metabolic requirements of cell proliferation. Annu Rev Cell Dev Biol. 2011;27441–27464. doi:10.1146/annurev-cellbio-092910-154237.
- Zeng Q, Chen J, Li Y, et al. LKB1 inhibits HPV-associated cancer progression by targeting cellular metabolism. Oncogene. 2017;36(9):1245–1255. doi:10.1038/onc.2016.290. PMID:27546620.
- Guo W, Qiu Z, Wang Z, et al. MiR-199a-5p is negatively associated with malignancies and regulates glycolysis and lactate production by targeting hexokinase 2 in liver cancer. Hepatology. 2015;62(4):1132–1144. doi:10.1002/hep.27929. PMID:26054020.
- Ros S, Schulze A. Glycolysis back in the limelight: systemic targeting of HK2 blocks tumor growth. Cancer Discov. 2013;3(10):1105–1107. doi:10.1158/2159-8290.CD-13-0565. PMID:24124231.
- Kwee SA, Hernandez B, Chan O, et al. Choline kinase alpha and hexokinase-2 protein expression in hepatocellular carcinoma: association with survival. PLoS One. 2012;7(10):e46591. doi:10.1371/journal.pone.0046591. PMID:23071593.
- Roberts DJ, Tan-Sah VP, Ding EY, et al. Hexokinase-II positively regulates glucose starvation-induced autophagy through TORC1 inhibition. Mol Cell. 2014;53(4):521–533. doi:10.1016/j.molcel.2013.12.019. PMID:24462113.
- Viticchie G, Agostini M, Lena AM, et al. p63 supports aerobic respiration through hexokinase II. Proc Natl Acad Sci U S A. 2015;112(37):11577–11582. doi:10.1073/pnas.1508871112. PMID:26324887.
- Johansen T, Lamark T. Selective autophagy mediated by autophagic adapter proteins. Autophagy. 2011;7(3):279–296. doi:10.4161/auto.7.3.14487. PMID:21189453.
- Jin M, Liu X, Klionsky DJ. SnapShot: Selective autophagy. Cell. 2013;152(1-2):368–e2. doi:10.1016/j.cell.2013.01.004. PMID:23332767.
- Gibbings D, Mostowy S, Jay F, et al. Selective autophagy degrades DICER and AGO2 and regulates miRNA activity. Nat Cell Biol. 2012;14(12):1314–1321. doi:10.1038/ncb2611. PMID:23143396.
- Gao C, Chen YG. Selective removal of dishevelled by autophagy: a role of p62. Autophagy. 2011;7(3):334–335. doi:10.4161/auto.7.3.14072. PMID:21079413.
- Ichimura Y, Kominami E, Tanaka K, et al. Selective turnover of p62/A170/SQSTM1 by autophagy. Autophagy. 2008;4(8):1063–1066. doi:10.4161/auto.6826. PMID:18776737.
- Kirkin V, McEwan DG, Novak I, et al. A role for ubiquitin in selective autophagy. Mol Cell. 2009;34(3):259–269. doi:10.1016/j.molcel.2009.04.026. PMID:19450525.
- Pankiv S, Clausen TH, Lamark T, et al. p62/SQSTM1 binds directly to Atg8/LC3 to facilitate degradation of ubiquitinated protein aggregates by autophagy. J Biol Chem. 2007;282(33):24131–24145. doi:10.1074/jbc.M702824200. PMID:17580304.
- Wyatt E, Wu R, Rabeh W, et al. Regulation and cytoprotective role of hexokinase III. PLoS One. 2010;5(11):e13823. doi:10.1371/journal.pone.0013823. PMID:21072205.
- Komatsu M, Kageyama S, Ichimura Y. p62/SQSTM1/A170: physiology and pathology. Pharmacol Res. 2012;66(6):457–462. doi:10.1016/j.phrs.2012.07.004. PMID:22841931.
- Bao L, Chandra PK, Moroz K, et al. Impaired autophagy response in human hepatocellular carcinoma. Exp Mol Pathol. 2014;96(2):149–154. doi:10.1016/j.yexmp.2013.12.002. PMID:24369267.
- Komatsu M, Waguri S, Ueno T, et al. Impairment of starvation-induced and constitutive autophagy in Atg7-deficient mice. J Cell Biol. 2005;169(3):425–434. doi:10.1083/jcb.200412022. PMID:15866887.
- Madrigal-Matute J, Cuervo AM. Regulation of Liver Metabolism by Autophagy. Gastroenterology. 2016;150(2):328–339. doi:10.1053/j.gastro.2015.09.042. PMID:26453774.
- Lv L, Li D, Zhao D, et al. Acetylation targets the M2 isoform of pyruvate kinase for degradation through chaperone-mediated autophagy and promotes tumor growth. Mol Cell. 2011;42(6):719–730. doi:10.1016/j.molcel.2011.04.025. PMID:21700219.
- Zhao D, Zou SW, Liu Y, et al. Lysine-5 acetylation negatively regulates lactate dehydrogenase A and is decreased in pancreatic cancer. Cancer Cell. 2013;23(4):464–476. doi:10.1016/j.ccr.2013.02.005. PMID:23523103.
- Xia HG, Najafov A, Geng J, et al. Degradation of HK2 by chaperone-mediated autophagy promotes metabolic catastrophe and cell death. J Cell Biol. 2015;210(5):705–716. doi:10.1083/jcb.201503044. PMID:26323688.
- Lu W, Zhang Y, McDonald DO, et al. Dual proteolytic pathways govern glycolysis and immune competence. Cell. 2014;159(7):1578–1590. doi:10.1016/j.cell.2014.12.001. PMID:25525876.
- Moscat J, Diaz-Meco MT. p62 at the crossroads of autophagy, apoptosis, and cancer. Cell. 2009;137(6):1001–1004. doi:10.1016/j.cell.2009.05.023. PMID:19524504.
- Komatsu M. Potential role of p62 in tumor development. Autophagy. 2011;7(9):1088–1090. doi:10.4161/auto.7.9.16474. PMID:21617386.
- Ichimura Y, Waguri S, Sou YS, et al. Phosphorylation of p62 activates the Keap1-Nrf2 pathway during selective autophagy. Mol Cell. 2013;51(5):618–631. doi:10.1016/j.molcel.2013.08.003. PMID:24011591.
- Fujita K, Maeda D, Xiao Q, et al. Nrf2-mediated induction of p62 controls Toll-like receptor-4-driven aggresome-like induced structure formation and autophagic degradation. Proc Natl Acad Sci U S A. 2011;108(4):1427–1432. doi:10.1073/pnas.1014156108. PMID:21220332.
- Umemura A, He F, Taniguchi K, et al. p62, Upregulated during Preneoplasia, Induces Hepatocellular Carcinogenesis by Maintaining Survival of Stressed HCC-Initiating Cells. Cancer Cell. 2016;29(6):935–948. doi:10.1016/j.ccell.2016.04.006. PMID:27211490.
- Liang XH, Jackson S, Seaman M, et al. Induction of autophagy and inhibition of tumorigenesis by beclin 1. Nature. 1999;402(6762):672–676. doi:10.1038/45257. PMID:10604474.
- Yue Z, Jin S, Yang C, et al. Beclin 1, an autophagy gene essential for early embryonic development, is a haploinsufficient tumor suppressor. Proc Natl Acad Sci U S A. 2003;100(25):15077–15082. doi:10.1073/pnas.2436255100. PMID:14657337.
- Rosenfeldt MT, O'Prey J, Morton JP, et al. p53 status determines the role of autophagy in pancreatic tumour development. Nature. 2013;504(7479):296–300. doi:10.1038/nature12865. PMID:24305049.
- Alderton GK. Autophagy: Surviving stress in pancreatic cancer. Nat Rev Cancer. 2015;15(9):513. doi:10.1038/nrc4005. PMID:26299587.
- Karsli-Uzunbas G, Guo JY, Price S, et al. Autophagy is required for glucose homeostasis and lung tumor maintenance. Cancer Discov. 2014;4(8):914–927. doi:10.1158/2159-8290.CD-14-0363. PMID:24875857.
- Lum JJ, Bauer DE, Kong M, et al. Growth factor regulation of autophagy and cell survival in the absence of apoptosis. Cell. 2005;120(2):237–248. doi:10.1016/j.cell.2004.11.046. PMID:15680329.