
ABSTRACT
Sulfonylurea (SU) herbicides inhibit branched-chain amino acid (BCAA) biosynthesis by targeting acetolactate synthase. Plants have evolved target-site resistance and metabolic tolerance to SU herbicides; the GCN2 (general control non-repressible 2) pathway is also involved in SU tolerance. Here, we report a novel SU tolerance mechanism, autophagy, which we call ‘homeostatic tolerance,’ is involved in amino acid signaling in Arabidopsis. The activation and reversion of autophagy and GCN2 by the SU herbicide tribenuron-methyl (TM) and exogenous BCAA, respectively, confirmed that TM-induced BCAA starvation is responsible for the activation of autophagy and GCN2. Genetic and biochemical analyses revealed a lower proportion of free BCAA and more sensitive phenotypes in atg5, atg7, and gcn2 single mutants than in wild-type seedlings after TM treatment; the lowest proportion of free BCAA and the most sensitive phenotypes were found in atg5 gcn2 and atg7 gcn2 double mutants. Immunoblotting and microscopy revealed that TM-induced activation of autophagy and GCN2 signaling do not depend on the presence of each other, and these 2 pathways may serve as mutually compensatory mechanisms against TM. TM inhibited the TOR (target of rapamycin), and activated autophagy in an estradiol-induced TOR RNAi line, suggesting that TM-induced BCAA starvation activates autophagy, probably via TOR inactivation. Autophagy and GCN2 were also activated, and independently contributed to TM tolerance in plants conferring metabolic tolerance. Together, these data suggest that autophagy is a proteolytic process for amino acid recycling and contributes to GCN2-independent SU tolerance, probably by its ability to replenish fresh BCAA.
Abbreviations
| ACTB | = | actin beta |
| ALS | = | acetolactate synthase |
| ATG/atg | = | autophagy-related |
| BCAA | = | branched-chain amino acid |
| CSR1 | = | chlorsulfuron resistant 1 |
| EIF2A/eIF2α | = | α subunit of eukaryotic translation initiation factor 2 |
| EIF2AK4 | = | eukaryotic translation initiation factor 2 alpha kinase 4 |
| GCN2 | = | general control non-repressible 2 |
| GFP | = | green fluorescent protein |
| PCR | = | polymerase chain reaction |
| RT | = | reverse transcription |
| RNAi | = | RNA interference |
| S6K1 | = | ribosomal S6 kinase 1 |
| SU | = | sulfonylurea herbicides |
| TEM | = | transmission electron microscopy |
| TM | = | tribenuron-methyl |
| TOR | = | target of rapamycin |
| tor-es | = | estradiol-induced TOR RNA interference line |
Introduction
Weeds are among the greatest threats to food production [Citation1]. Sulfonylurea (SU) herbicides are widely used because they have low application rates, broad spectrum of weed control, and low mammalian toxicity [Citation2]. ALS (acetolactate synthase, also known as acetohydroxyacid synthase) catalyzes the first step in branched-chain amino acid (BCAA; valine, leucine, and isoleucine) biosynthesis [Citation3]. Sulfonylurea herbicides bind at the ALS active site channel blocking the path of substrates to the active site [Citation4], which results in BCAA deficiency (starvation) in plant cells and ultimately in plant death [Citation5]. The addition of exogenous BCAA reverses the herbicidal effects of SU [Citation6], suggesting that BCAA starvation is the primary cause of SU-induced plant death.
With the extensive application of SU herbicides in the past few decades, weeds have evolved 2 primary mechanisms of herbicide resistance or tolerance: target-site resistance and nontarget-site (or metabolic) tolerance [Citation7-9]. Target-site resistance evolves by mutations in the target sites of the herbicide. In the Arabidopsis dominant mutant csr1-1D (chlorsulfuron resistant 1), a Pro197Ser amino acid substitution in the catalytic subunit of ALS confers SU resistance by reducing the herbicide-binding capacity [Citation4,Citation10]. In contrast, metabolic tolerance evolves by the activation of cytochrome P450 monooxygenases and other enzymes, which have the capacity of herbicide metabolism. For example, CYP81A6/Bel from rice (Oryza sativa) [Citation11,Citation12] and CYP81A12 and CYP81A21 from Echinochloa phyllopogon [Citation13] confer SU tolerance when expressed in Arabidopsis.
Amino acids are important metabolic intermediates that not only support the availability of nutrients for cellular function, but also serve as building blocks for the synthesis of new proteins to regulate cellular growth and proliferation [Citation14]. Therefore, amino acid availability as a signal is involved in many biological processes, and eukaryotic cells employ a number of mechanisms to ensure amino acid homeostasis. Amino acid availability is sensed and regulated by the TOR (target of rapamycin) protein kinase, which in turn controls autophagy and amino acid homeostasis [Citation15,Citation16]. Amino acids are both necessary and sufficient to activate TOR via the RAG GTPase complex in mammals and the EGO complex in yeast [Citation17,Citation18] and subsequently the activated TOR regulates the ULK1 or yeast Atg1 complex to repress autophagy [Citation19,Citation20] As a conservative proteolytic process in eukaryotic cells [Citation21–24], autophagy (specifically macroautophagy) is characterized by the sequestration of damaged proteins and organelles (cargos) within double-membrane vesicles termed autophagosomes. The outer membrane of the autophagosomes then fuses with the vacuole or lysosome, where the sequestered cargos are degraded and recycled into cellular building blocks, including amino acids. Under amino acid deprivation conditions, TOR inactivation leads to the activation of autophagy [Citation16], which is required for maintaining intracellular amino acid concentrations in starved cells [Citation25,Citation26].
In yeast and mammals, amino acid deprivation also activates Gcn2/EIF2AK4 (eukaryotic translation initiation factor 2 alpha kinase 4) by increasing uncharged-tRNAs [Citation15,Citation27] Gcn2/EIF2AK4 phosphorylates the EIF2A/Sui2 (eukaryotic translation initiation factor 2 subunit alpha). The phosphorylation of EIF2A not only causes a general reduction in protein synthesis, but also induces the expression of amino acid biosynthetic genes through Gcn4/ATF4, resulting in the restoration of intracellular levels of amino acids [Citation15]. Furthermore, pioneering studies in yeast and mammals have demonstrated that Gcn2/EIF2AK4 is essential for amino acid-induced autophagy [Citation28–30] and inhibition of TOR by rapamycin induces Gcn2/EIF2AK4-dependent EIF2A phosphorylation [Citation31], suggesting that crosstalk exists between TOR and Gcn2/EIF2AK4 in the regulation of autophagy during amino acid deprivation.
In Arabidopsis, SU-caused BCAA starvation can also induce GCN2-dependent EIF2A phosphorylation, and the activation of GCN2 results in a strong reduction in global protein synthesis [Citation32], which may explain the more sensitive phenotype of the gcn2 mutant than that of wild-type plants after SU treatment [Citation33]. Although significant progress has been made in understanding the mechanisms of amino acid signaling in yeast and mammals, little is known in plants. In this study, we report that autophagy, which is activated by the SU herbicide tribenuron-methyl (TM), indeed plays an essential role in the maintenance of BCAA levels, and contributes to TM tolerance in a GCN2-independent way in Arabidopsis under TM-induced BCAA starvation conditions. Our study not only reveals that autophagy serves as a novel mechanism for SU tolerance, but also facilitates future investigations into the molecular mechanisms underlying amino acid signaling in plants.
Results
TM-Induced BCAA starvation activates the autophagy and GCN2 pathways in Arabidopsis seedlings
We have previously reported that autophagy can be activated by TM in the anthers of rapeseed (Brassica napus) [Citation34]. To investigate the involvement of autophagy in plant seedlings subjected to TM treatment, we examined autophagic activity in TM-treated Arabidopsis seedlings. After TM treatment, the transcript levels of almost all ATG genes detected, including ATG3, ATG5, ATG6, ATG7, ATG8A to ATG8I, ATG9, ATG18A, and VPS34 (encoding the class III phosphatidylinositol 3-kinase catalytic subunit), were significantly elevated in wild-type (Col-0) seedlings (A). We then used transmission electron microscopy (TEM) to monitor the autophagic activity after TM treatment. We observed massive classic double-membrane autophagosomes in the cytoplasm and autophagic bodies with a single membrane in the vacuoles of TM-treated seedlings (B). Quantification of autophagic activity by the TEM method showed that autophagic activity in the leaves increased 3.2-fold after TM treatment (C). Furthermore, we monitored the occurrence of autophagy by assessing the behavior of ATG8 proteins and green fluorescent protein (GFP)-ATG8E reporter after TM treatment [Citation35-37]. The accumulation and modification of ATG8, as indicated by the faster-migrating gel band, was detected 6 h after TM treatment, and ATG8 processing increased to its maximum 24 h after the treatment (D). Because GFP-ATG8E can be digested during autophagic turnover to release free GFP in a relatively stable form, free GFP accumulates to high levels when autophagy is activated [Citation36]. In agreement with the behavior of the ATG8 proteins, the free GFP started to accumulate 12 h after TM treatment, and reached a maximum 48 h after the treatment (D). Taken together, these data confirm that autophagy is activated by TM in Arabidopsis seedlings.
Figure 1. Tribenuron-methyl (TM)-induced branched-chain amino acid (BCAA) starvation activates autophagy and EIF2A phosphorylation in Arabidopsis seedlings. (A) Transcript analyses of autophagy-related genes in Arabidopsis seedlings after 0.1 mg/LTM treatment. Quantitative reverse transcription-polymerase chain reaction analysis was performed using total RNA extracted from Arabidopsis seedlings treated with TM for 24 h. Expression data relative to the control were normalized to that of ACT7. Error bars show mean ± standard error of the mean (s.e.m.) (n = 3 biological replicates). *P < 0.05; **P < 0.01 (Student t test). (B) Representative transmission electron microscopy (TEM) images of autophagic structures. In contrast to the control plants, many autophagic bodies were observed in the vacuoles (V) of mesophyll cells of the seedlings treated with 0.1 mg/LTM for 24 h (top right). The arrowhead shows 1 classic double-membrane autophagosome (ap) in the cytoplasm (bottom left), and the arrows indicate the autophagic bodies (ab) inside the vacuoles of mesophyll cells after TM treatment (bottom right). Cp, chloroplast. Bars: 1 ?m. (C) Relative autophagic activity of TM-treated seedlings normalized to the activity of control plants. Quantification of the electron microscopy-investigated autophagic structures in plants treated with 0.1 mg/L TM for 24 h was performed to calculate the autophagic activity relative to that of control plants, which was set to 1. Approximately 20 cells were used for quantification. Error bars show mean ± s.e.m. (n = 3 biological replicates). **P < 0.01 (Student t test). (D) Immunoblot analyses of ATG8 and GFP-ATG8E accumulation and modification and EIF2A phosphorylation following TM treatment. Total proteins extracted at the indicated times after 0.1 mg/L TM treatment were subjected to immunoblot analyses with anti-ATG8A, GFP, and phosphorylated EIF2A (p-EIF2A ) antibodies, as indicated. Processed ATG8 (ATG8-PE), free GFP, and p-EIF2A are indicated by arrowheads. ACTB and total EIF2A served as loading controls. (E and F) Exogenous BCAA reversed the TM-induced accumulation of processed ATG8, free GFP, and p-EIF2A (E), and plant death (F). Ten-day-old seedlings were transferred onto 1/2 Murashige and Skoog medium with or without 0.1 mg/L TM and/or BCAA (2.5 mM) for 1 (E) or 5 (F) days.
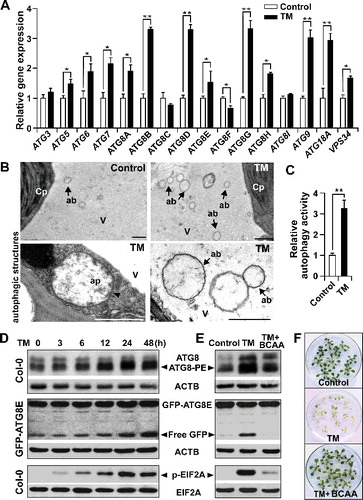
As ALS is the sole target of TM and a key enzyme of BCAA biosynthesis [Citation34], we further investigated whether BCAA starvation is the primary cause of TM-induced seedling death and the activation of autophagy. We first examined BCAA biosynthesis in wild-type seedlings after TM treatment. Compared to the control, both the in vivo ALS activity and the proportion of BCAA in the total free amino acid pool were reduced after TM treatment (; ). In addition, application of exogenous BCAA almost reversed TM-induced plant death (F), consistent with previous reports [Citation6,Citation34] We next examined the autophagic activity of seedlings treated with TM and fed with exogenous BCAA. As expected, immunoblot analysis of both ATG8 proteins and the GFP-ATG8E reporter indicated that the TM-induced accumulation of processed forms of ATG8 proteins and free GFP returned to basal levels after adding exogenous BCAA (E), suggesting that TM-induced BCAA starvation is responsible for TM-activated autophagy.
Figure 2. Analyses of in vivo acetolactate synthase (ALS) activity in different genotypes treated with or without TM. Ten-day-old seedlings were used to determine in vivo ALS activity in different genotypes treated with or without 0.25 mg/L TM for 1 day. All data are relative to those in control wild-type plants. Error bars show mean ± s.e.m. Different letters above the bars indicate significant differences (P < 0.05).
Table 1. Effects of TM on the branched-chain amino acid contents of Arabidopsis seedlings with different genotypes.
A previous study reported that another SU herbicide (chlorsulfuron) could induce GCN2-dependent EIF2A phosphorylation [Citation32], and we observed that EIF2A phosphorylation occurred 3 h after TM treatment (D). In addition, TM-induced EIF2A phosphorylation completely depended on the presence of GCN2, because no phosphorylated EIF2A was detected in the TM-treated gcn2 mutant (Figure S1); therefore, GCN2 activity could be monitored using the phosphorylation level of EIF2A, as described previously [Citation32]. Moreover, the application of exogenous BCAA eliminated TM-induced EIF2A phosphorylation (E), suggesting that BCAA starvation is the primary cause of the TM-activated GCN2 pathway.
Autophagy contributes to GCN2-independent TM tolerance
To assess the role of autophagy in TM tolerance, several autophagy-defective mutants were tested for their herbicide responses. Ten-d-old wild-type, atg5, and atg7 seedlings were germinated on 1/2 Murashige and Skoog medium and transferred onto fresh medium with or without (control) 0.05 mg/L TM for an additional 5 d (A). In the control medium, all lines had similar biomass and morphology (A), reaching approximately 190 to 200 mg fresh biomass (B). TM application decreased the fresh weight of the wild-type plants to 150 mg biomass (B). The growth of the atg5 and atg7 mutants was more inhibited than that of the wild-type plants after TM treatment (A), and only produced 110 mg biomass (B). The atg5 and atg7 mutants consistently exhibited a greater decrease in chlorophyll content (approximately 60%) than the wild-type plants after TM treatment (B). The chlorophyll contents of 2 other autophagy-defective mutants, atg2 and atg9, were also analyzed after TM treatment. These mutants did not differ from wild-type plants when grown in the control medium, but exhibited more sensitive phenotypes than wild-type plants after TM application (Figure S2). Considering that atg mutants showed the leaf necrosis phenotype under various environmental stress conditions [Citation38], trypan blue staining was used to detect dead cells in plants treated with TM or not (control). No cell death was detected in control wild-type and atg mutants (C). After TM treatment, only a small amount of dead mesophyll cells along the vascular tissue was detected in wild-type leaves, while the cell-death regions in atg5 and atg7 mutants were obviously larger than that in wild-type plants (C). These results suggested that autophagy contributes to SU herbicide tolerance.
Figure 3. Autophagy and GCN2 independently contribute to TM tolerance. (A) Ten-day-old wild-type, atg5, atg7, gcn2, atg5 gcn2, and atg7 gcn2 seedlings were transferred onto fresh medium with or without (control) 0.05 mg/L TM for an additional 5 days. Representative photographs of each genotype are shown. (B) Effects of TM on the growth of Arabidopsis seedlings with different genotypes. Fresh weights and chlorophyll contents of seedlings treated with or without 0.05 mg/L TM for 5 days were determined. Error bars show mean ± s.e.m. Different letters above the bars indicate significant differences (P < 0.05). (C) Representative trypan blue staining images of leaves from ten-day-old seedlings treated with or without (control) 0.05 mg/L TM for 5 days. Dark blue staining detects dead cells (dc). The experiments were repeated 3 times with similar results. v, vascular tissue. Bars: 500 ?m. (D) Similar accumulation patterns of processed ATG8 and free GFP in wild-type and gcn2 seedlings treated with 0.1 mg/L TM for 24 h. Immunoblot analyses were performed as described above. (E) Similar levels of EIF2A phosphorylation in wild-type and atg mutants after 0.1 mg/L TM treatment for 24 h. Immunoblot analyses were performed as described above. (F) Processed ATG8 and free GFP in 0.1 mg/L TM-treated wild-type and gcn2 seedlings for the indicated times. ACTB served as a loading control. (G) Representative TEM images of autophagic structures at different time points in TM-treated wild-type and gcn2 seedlings. In contrast to the wild-type plants, more autophagic bodies (arrows) appeared in the central vacuole of mesophyll cells of gcn2 mutant after 3 and 6 h of 0.1 mg/L TM treatment. Cp, chloroplast; V, vacuole; ab, autophagic body. Bars: 1 ?m. (H) Relative autophagic activity normalized to the activity of wild-type plants at the beginning of TM treatment (0 h as control). Quantification of the autophagic structures by electron microscopy in plants at each time point was performed to calculate the autophagic activity relative to the activity of control plants, which was set to 1. Approximately 20 cells were used for the quantification. Error bars show mean ± s.e.m. (n = 3 biological replicates). **P < 0.01 (Student t test). (I) EIF2Aphosphorylation in wild-type and atg mutants treated with 0.1 mg/L TM for the indicated times. Total EIF2A served as a loading control.
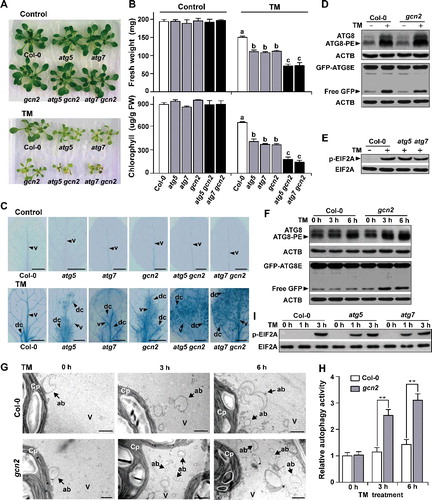
Besides autophagy, GCN2-EIF2A pathway activated by SU herbicides, also contributes to SU herbicide (chlorsulfuron) tolerance [Citation33]. How these 2 pathways interact is unclear. To investigate this, we analyzed the performance of gcn2 mutants after TM application and constructed atg5 gcn2 and atg7 gcn2 double mutants (Figure S3A). Similar to the performance of atg5 and atg7 single mutants and previous results, the gcn2 mutant exhibited greater growth retardation, less chlorophyll, and more dead cells than wild-type plants after TM application (A to C). Notably, both the growth rate and the chlorophyll content were more strongly reduced in the atg5 gcn2 and atg7 gcn2 double mutants than in the gcn2, atg5, and atg7 single mutants after TM treatment (A and B). Similarly, the cell-death regions stained with trypan blue in atg5 gcn2 and atg7 gcn2 double mutants, which were distributed almost through the whole leaves, were obviously larger than those in gcn2, atg5, and atg7 single mutants after TM application (C). These genetic analyses indicated that autophagy contributes to SU herbicide tolerance in a pathway parallel to GCN2.
To further confirm this conclusion, we used immunoblot to investigate whether TM-activated autophagy and GCN2 depend on each other. We first examined autophagic activity in TM-treated gcn2 mutants (D). Similar to wild-type plants, increased accumulations of processed ATG8 proteins, and free GFP were observed after TM treatment in the gcn2 mutant and the gcn2 mutant expressing GFP-ATG8E (Figure S4), respectively (D), suggesting that GCN2 is not essential for the activation of autophagy when plants are subjected to TM-induced BCAA starvation. We next examined GCN2 activity using the phosphorylation level of EIF2A in atg mutants (E). As expected, phosphorylated EIF2A still existed in both TM-treated atg5 and atg7 mutants (E), suggesting that autophagic components are not essential for the activation of GCN2 by TM. These results, combined with those obtained by the genetic analyses, suggested that autophagy and GCN2 may employ different mechanisms for SU herbicide tolerance.
We used immunoblot and TEM methods to investigate autophagic activity in the gcn2 mutant and wild-type plants over varying time points after TM treatment. Autophagy was not activated in wild-type plants 3 h after TM treatment, but processed ATG8 proteins and free GFP accumulation were detected in the gcn2 mutant at this time point (F). This is consistent with the massive autophagic bodies that were observed at the same time point after TM treatment (G) in the gcn2 mutant. Quantification of autophagic activity by the TEM method showed that higher levels of autophagic activity were detected in the gcn2 mutant than in wild-type plants 3, 6, and 12 h after TM treatment (G and H; Figure S5), suggesting that autophagy is more rapidly induced by BCAA starvation while the GCN2 pathway was blocked. We also investigated the GCN2 activity in atg mutants under TM treatment over time, and found that TM-induced EIF2A phosphorylation occurred after 1 h in atg mutants, whereas no phosphorylated EIF2A was detected in wild-type plants at this time point (I). High levels of EIF2A phosphorylation occurred both in wild-type plants and atg mutants 3 h after TM treatment (I). The greater magnitude or speed of autophagy induction in the gcn2 mutant, and of GCN2-dependent p-EIF2A in the atg mutants, than in wild-type plants after TM treatment, suggested that autophagy and GCN2 pathways are mutually compensatory mechanisms in response to BCAA deficiency.
TM induces the inactivation of TOR, a negative regulator of autophagy
In yeast and mammals, TOR/MTOR protein kinase represses autophagy under nutrient-rich conditions; in contrast, nutrient deficiency induces TOR inactivation, which results in autophagy activation [Citation16,Citation19,Citation20] In Arabidopsis, TOR reduction via RNA interference (RNAi) can also activate autophagy [Citation39], suggesting that TOR is a conserved negative regulator of autophagy in eukaryotes. Although the roles and regulatory mechanisms of the amino acids involved in TOR activation have been well-characterized in yeast and mammals [Citation16-18], the role of TOR in amino acid starvation-induced autophagy is still unknown in plants. Based on the phosphorylation of T449 in ribosomal S6K1 (S6 kinase 1) as a conserved indicator of endogenous TOR kinase activity [Citation40], we revealed that TOR was inactivated after TM application (A). In addition, autophagy greatly increased in the estradiol-induced TOR RNAi line (tor-es) (B), which is consistent with that previously reported [Citation39]. These results indicate that TM-induced BCAA starvation probably activates autophagy by TOR inactivation.
Figure 4. TM caused TOR (target of rapamycin) inactivation, which induced autophagy, not activation of the GCN2 pathway. (A) TM-induced TOR inactivation. TOR activity was based on the phosphorylation level of S6K1 (p-S6K1). Total proteins extracted from 10-day-old seedlings expressing HA-tagged S6K1 were treated without (control) or with TM (0.1 mg/L) for 24 h, and analyzed by immunoblot with anti-p-S6K1 and anti-HA (S6K1) antibodies. S6K1 was used as a loading control. (B) Determination of autophagy after TOR inhibition. Autophagy was measured as the accumulation of processed ATG8 (ATG8-PE) in estradiol-induced TOR RNAi line (tor-es), and free GFP in the tor-es line expressing GFP-ATG8E, both of which were treated without or with estradiol (20 ?M) for 24 h. ACTB served as loading controls. (C) Determination of GCN2 activity after TOR inhibition. GCN2 activity was measured as the amount of phosphorylated EIF2A in the tor-es seedlings, which were untreated (control), treated with estradiol (20 ?M), or treated with TM (0.1 mg/L) for 24 h. Total EIF2A served as a loading control.
In yeast and mammals, Gcn2/EIF2AK4-dependent EIF2A phosphorylation increases following the use of the TOR inhibitor rapamycin, suggesting that TOR plays a regulatory role in the Gcn2/EIF2AK4 pathway [Citation31,Citation41] To investigate if this was the case in plants, we analyzed the EIF2A phosphorylation level in the tor-es line. In contrast to the high level of EIF2A phosphorylation observed in the TM-treated plants, no phosphorylated EIF2A was detected in the tor-es line treated with estradiol (C). Therefore, in contrast to that found in yeast and mammals, BCAA starvation-induced EIF2A phosphorylation does not depend on TOR inactivation, or no crosstalk exists between the TOR-autophagy and GCN2 pathways, in Arabidopsis.
Autophagy and GCN2 maintain BCAA levels under BCAA starvation conditions
As confirmed above, after TM treatment, BCAA starvation is the primary cause for the activation of autophagy, which is a well-known proteolytic process that recycles amino acids. To investigate whether autophagy plays an essential role in the maintenance of the BCAA level and therefore acquires tolerance to SU herbicides, we determined the free amino acid pools of wild-type, atg5, and atg7 seedlings treated with or without (control) TM at 0.1 mg/L for 12 h. Under the control condition, all lines had similar BCAA contents (Table S1), suggesting that autophagy is not essential to maintain amino acid homeostasis under normal conditions. In contrast, after TM treatment, we observed larger decreases in the proportion of BCAA in the free amino acid pool and smaller increases in total free amino acids in both the atg5 and atg7 mutants than in wild-type plants (), suggesting that autophagy is essential for maintaining the BCAA level under BCAA starvation conditions. In addition, in vivo ALS activity was almost completely inhibited in the wild-type and mutant plants after TM treatment (). These observations, combined with the role that autophagy plays in protein degradation and amino acid recycling, are consistent with the notion that the greater accumulation of BCAA in wild-type plants than in atg mutants probably resulted from autophagy-mediated protein degradation rather than enhanced de novo BCAA biosynthesis.
Compared to wild-type plants, greater decreases in the proportion of BCAA in the free amino acid pool and smaller increases in total free amino acids were observed in the gcn2 mutant after TM treatment (), which is consistent with a previous observation that GCN2 acts as a negative regulator of protein synthesis during amino acid starvation [Citation32]. Therefore, the greater accumulation of BCAA in wild-type plants than in the gcn2 mutant probably resulted from a reduction in global protein synthesis. Furthermore, the atg5 gcn2 and atg7 gcn2 double mutants had a lower proportion of BCAA than the atg5, atg7, and gcn2 single mutants after TM treatment (), suggesting that different mechanisms exist between autophagy and GCN2 in maintaining amino acid homeostasis during BCAA starvation. Autophagy and GCN2 in the maintenance of BCAA levels are probably the primary causes of autophagy- and GCN2-dependent TM tolerance, respectively.
Autophagy and GCN2 are required in plants overexpressing Bel, not csr1-1D, in response to TM
Our results suggest that both autophagy and GCN2 contribute to SU herbicide tolerance, in addition to classic mechanisms of target-site resistance (csr1-1D) and metabolic tolerance (Bel) (Figure S6). It is unclear whether the autophagy and GCN2 pathways play essential roles in plants conferring classic resistance/tolerance when subjected to SU herbicide application. To investigate this, we examined autophagy and GCN2 in the csr1-1D mutant, csr1-1D-overexpressing lines (pEF::csr1-1D), and Bel-overexpressing lines (pEF::Bel) [Citation34] (A). After TM application at 0.25 mg/L, processed ATG8 proteins, free GFP, and phosphorylated EIF2A accumulated in the Bel-overexpression lines but not in the csr1-1D mutant or the csr1-1D-overexpression lines (A), suggesting that both the autophagy and GCN2 pathways were only activated by TM in the Bel-overexpression plants. This observation is consistent with the analyses of in vivo ALS activity in these 2 kinds of overexpression lines after TM treatment (). Compared with wild-type plants (untreated), a minor decrease of ALS activity was observed in csr1-1D-overexpression lines than in Bel-overexpression lines treated with TM (). These results indicate that autophagy- and GCN2-mediated tolerance may also occur in Bel- but not in csr1-1D-overexpression lines subjected to TM treatment.
Figure 5. Roles of autophagy and GCN2 in Bel- and csr1-1D-overexpression plants subjected to TM application. (A) Activation of autophagy and GCN2 in transgenic lines overexpressing Bel, not csr1-1D, after TM treatment. Autophagy and GCN2 activity were measured as the accumulation of processed ATG8 (ATG8-PE) and free GFP, and phosphorylated EIF2A, respectively, in seedlings with different genotypes treated with 0.25 mg/L TM for 24 h. (B) Effects of TM on the growth of Arabidopsis seedlings with different genotypes as indicated in Bel- and csr1-1D-overexpression lines. Chlorophyll contents of seedlings treated with or without (control) 0.25 mg/L TM for 5 days were determined. Error bars show mean ± s.e.m. Different letters above the bars indicate significant differences (P < 0.05).
To confirm this, we crossed csr1-1D- and Bel-overexpression lines with atg5, atg7, and gcn2 mutants to generate csr1-1D- and Bel-overexpression lines in atg and/or gcn2 mutant backgrounds (Figure S3B and S3C), and measured their chlorophyll contents after TM treatment. Ten-d-old seedlings from these lines were treated with 0.25 mg/L TM for 5 d (B). The Bel atg5, Bel atg7, and Bel gcn2 lines had lower chlorophyll content than the Bel line, but higher chlorophyll content than the Bel atg5 gcn2 and Bel atg7 gcn2 lines, after TM treatment (B). Therefore, there were TM-sensitive phenotypes in the atg5, atg7, and gcn2 single mutants and TM-supersensitive phenotypes in the atg5 gcn2 and atg7 gcn2 double mutants (A to C). These results suggest that both the autophagy and GCN2 pathways independently contributed to TM tolerance, even though plants confer metabolic tolerance. In contrast, no significant differences in chlorophyll content were observed between the csr1-1D-overexpression line and the csr1-1D-overexpression line in the atg and/or gcn2 mutant background after TM treatment (B), indicating that the autophagy and GCN2 pathways may not be required if plants exhibit target-site resistance.
Discussion
Amino acid availability as a signal is involved in many biological processes, and cells employ sophisticated mechanisms to sense and maintain its homeostasis [Citation15,Citation16]. To investigate these mechanisms, yeast and mammalian cells, which mainly acquire amino acids from dietary intake, are usually grown in media without amino acids to induce amino acid deprivation. Because plants are autotrophic, mutations that cause amino acid deficiency, such as csr1-7, an ALS null mutant [Citation42], are usually embryo-lethal. This embryo lethality limits the molecular investigation of amino acid signaling in plants, which, consequently, is poorly understood. Fortunately, SU and other kinds of herbicides (such as glyphosate) target key enzymes of amino acid biosynthesis, leading to specific amino acid starvation and, ultimately, plant death. The herbicidal effects can be almost entirely reversed by feeding plants appropriate amino acids (F) [Citation33], suggesting that amino acid starvation is a primary and direct effect of herbicide application. Therefore, we propose that these herbicides could be used as specific inhibitors of amino acid biosynthesis, in order to investigate the molecular basis of amino acid signaling in plants. The inhibition of ALS activity () and reduction in the proportion of BCAA in the free amino acid pool () in TM-treated Arabidopsis seedlings, and reversions in the TM-induced activation of autophagy, GCN2 pathways, and plant death by adding exogenous BCAA (E and F), suggest that TM (and other SU herbicides) can be regarded as a specific inducer of BCAA starvation, and can be used to study the molecular mechanisms of amino acid signaling in plants.
In contrast to the great progress that has been made in understanding the mechanisms of amino acid signaling in yeast and mammals [Citation15,Citation16] little is known in plants. Here, we report 2 conservative transduction pathways of amino acid signaling in Arabidopsis, the TOR-autophagy and GCN2-EIF2A pathways, both of which contributed to the maintenance of amino acid homeostasis during TM-induced BCAA starvation (). In the TOR-autophagy pathway, TM as a specific BCAA starvation inducer caused the inactivation of TOR, which was indicated by an obvious reduction in S6K1 phosphorylation (A). The reduction in TOR expression caused by estradiol treatment (B) or RNA interference [Citation39] leads to the activation of autophagy. Autophagy is a proteolytic process in amino acid recycling via protein degradation, and plays an essential role in maintaining BCAA homeostasis after TM treatment (). Our results suggest that TOR acts as a negative regulator of autophagy, and TM-induced BCAA starvation probably activates autophagy through TOR inhibition in plants. In addition, TM-induced BCAA starvation activated the GCN2 pathway (D). After TM application, gcn2 mutants had a lower proportion of BCAA in the free amino acid pool than wild-type seedlings, indicating that GCN2 plays an important role in amino acid homeostasis (); GCN2 probably restores BCAA levels by causing a general reduction in protein synthesis [Citation32]. Together, the TOR-autophagy and GCN2-EIF2A pathways are essential in ensuring amino acid homeostasis, and function as a survival mechanism for plants subjected to TM application. It appears that these 2 pathways may be conserved in amino acid signaling in eukaryotes, including plants. However, the molecular mechanisms of amino acids in TOR regulation, TOR in autophagy inhibition, and GCN2 in the maintenance of amino acid homeostasis in plants are presently unknown, and require further investigation.
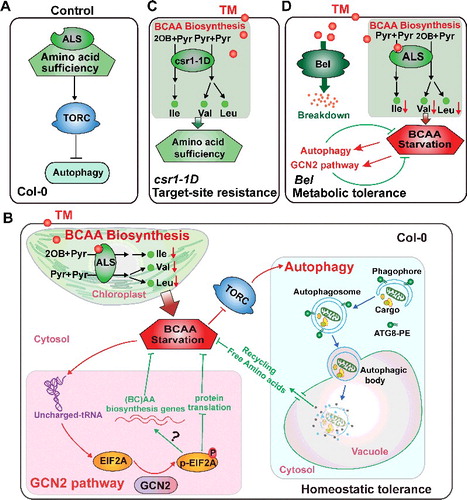
Figure 6. Proposed model for the roles of autophagy and GCN2 in TM-induced BCAA starvation and TM tolerance. (A) The TOR-autophagy pathway in wild-type plants. As in the wild-type plants (control), the availability of BCAA was sufficient; TOR, a sensor and regulator of amino acid availability, repressed autophagy; and the cells maintained autophagy at its basal level. TORC, TOR complex. (B) Roles of autophagy and GCN2 in TM-treated wild-type plants. TM targeted the first enzyme (ALS) in BCAA biosynthesis, resulting in BCAA starvation in cells. Subsequently, both the autophagy and GCN2 pathways were activated by TM-induced BCAA starvation. BCAA starvation probably activates autophagy through inhibition of TOR. Autophagy degrades proteins and organelles to recycle amino acids and other building blocks, which contribute to the replenishment of free BCAA. In parallel, GCN2 is also activated by BCAA starvation through uncharged-tRNAs to phosphorylate EIF2A. GCN2 probably plays a role in the maintenance of BCAA levels, by its ability to reduce global protein synthesis and/or activate amino acid biosynthesis genes. Therefore, gcn2 and atg mutants were more sensitive than wild-type plants under TM-induced BCAA starvation conditions. 2OB, 2-ketobutyrate; Pyr, pyruvate; Ile, isoleucine; Val, valine; Leu, leucine. (C and D) Roles of autophagy and GCN2 in plants with classic resistance or tolerance subjected to TM treatment. In csr1-1D-overexpression lines, BCAA were sufficient even after TM treatment; autophagy and GCN2 were not activated in the TM-treated plants, suggesting that these pathways may not be required in target-site resistance plants subjected to sulfonylurea herbicide treatment (C). In contrast, BCAA starvation still occurred in TM-treated Bel- overexpression lines, and subsequently the autophagy and GCN2 pathways were activated, suggesting that the effects of TM cannot be completely reversed by metabolic tolerance, and autophagy- and GCN2-mediated TM tolerances are still required in metabolic-tolerant plants (D).
Previous studies in yeast and mammals have reported that Gcn2/EIF2AK4 is essential for amino acid deprivation-induced autophagy [Citation28-30] and TOR inhibition by rapamycin induces Gcn2/EIF2AK4-dependent EIF2A phosphorylation [Citation31], suggesting that crosstalk exists between autophagy and Gcn2/EIF2AK4-EIF2A. In contrast, the activation of autophagy is not dependent on the GCN2 pathway in Arabidopsis during BCAA starvation. The accumulation of both processed ATG8 proteins and free GFP occurred in gcn2 mutant and gcn2 expressing GFP-ATG8E, and the accumulation of phosphorylated EIF2A occurred in atg mutants after TM treatment (D and E), suggesting that neither autophagy nor GCN2 activated by BCAA starvation are dependent on the presence of each other. In addition, the greater or more rapid induction of GCN2-dependent p-EIF2A in atg mutants and autophagy in gcn2 mutant after TM treatment (F to I; Figure S5), suggest that the autophagy and GCN2 pathways are mutually compensatory mechanisms in response to BCAA deficiency. The atg5 gcn2 and atg7 gcn2 double mutants had lower proportions of BCAA in the free amino acid pool and more TM-sensitive phenotypes than the atg5, atg7, and gcn2 single mutants after TM treatment (; A to C). Therefore, the autophagy and GCN2 pathways may employ specific mechanisms to sense and regulate amino acid homeostasis, and independently contribute to SU herbicide tolerance.
In addition to finding that autophagy functions as a previously unknown mechanism in SU herbicide tolerance in a GCN2-independent way, we revealed the roles of autophagy and GCN2 in transgenic plants that conferred either target-site resistance or metabolic tolerance. In contrast to in the target-site resistance lines (csr1-1D), both autophagy and GCN2 were activated and played positive roles in TM tolerance in the metabolic-tolerant lines (Bel) after TM application (). Whether the autophagy or GCN2 pathways were activated or not depended on the availability of BCAA, regardless of genotype (). According to the proposed model, under BCAA-sufficient conditions, cells maintained autophagy at its basal level, as in control wild-type plants (A). In the TM-treated csr1-1D-overexpression lines (C), ALS activity almost recovered to its normal level few days after the treatment (Figure S6B), probably due to the csr1-1D protein; therefore, the BCAA levels were sufficient. Under BCAA starvation conditions, autophagy was activated, which degraded damaged proteins and organelles and released free amino acids, contributing to the replenishment of free BCAA to ensure cell survival. Simultaneously, GCN2 was also activated by BCAA starvation via uncharged-tRNA to phosphorylate EIF2A. Given its ability to reduce global protein synthesis and/or activate amino acid biosynthesis genes [Citation32], GCN2 probably plays a role in the maintenance of BCAA. The BCAA starvation that occurred both in the TM-treated wild-type and Bel-overexpression plants (B and D) might be explained by TM catabolism being a lengthy process; consequently, ALS inhibition occurred before the absorbed TM was completely metabolized by Bel. The primary aim of these 2 mechanisms is to ensure that free amino acids (BCAA) are at appropriate levels for promoting anabolic processes in the cells, which ultimately ensures plant survival under amino acid starvation conditions.
It is well known that target-site resistance mutants are generally isolated from wild-type plants treated with nonlethal herbicide doses. After the application of a low TM-dose (0.05 mg/L), both the autophagy and GCN2 pathways were activated in wild-type plants, and the growth of the atgs and gcn2 mutants was more inhibited, or they had lower survival, than the wild-type plants (A to C), suggesting that the autophagy and GCN2 pathways serve as survival mechanism that facilitates wild-type plants to overcome nonlethal BCAA deficiency and the emergence of target-site resistance mutants. Similarly, the Bel atg5, Bel atg7, and Bel gcn2 lines were more inhibited, or had lower survival, than the Bel line after exposure to a high TM-dose (0.25 mg/L) (), indicating that both the autophagy and GCN2 pathways contribute to TM tolerance, even though the plants themselves exhibit metabolic tolerance. In order to distinguish this tolerance from the well-studied target-site resistance and metabolic tolerance, we termed the mechanism of tolerance gained via the autophagy and GCN2 pathways as ‘homeostatic tolerance,’ which provides cytoprotection for cells subjected to nonfatal stress.
Materials and methods
Plant materials and TM application
The atg2 (SALK_006994C), atg5 (SALK_020601), and csr1-1D mutants were obtained from the Arabidopsis Biological Resource Center, Ohio State University, USA. The atg7 (SAIL_11_H07), atg9 (SALK_145980), and GFP-ATG8E lines were kindly provided by Dingzhong Tang (Institute of Genetics and Developmental Biology, Chinese Academy of Sciences, Beijing, China) [Citation35]; the gcn2 mutant [Citation32] by Jean-Marc Deragon (Université de Perpignan Via Domitia, Perpignan, France), the estradiol-inducible TOR RNA interference line (tor-es) and 35S::S6K-HA line by Jen Sheen and Yan Xiong (Harvard Medical School, Boston, Massachusetts, USA) [Citation40], and the csr1-1D-overexpression lines (pEF::csr1-1D) and Bel-overexpression lines (pEF::Bel) were obtained as previously described [Citation34]. atg5 and atg7 were crossed with gcn2 to construct the atg5 gcn2 and atg7 gcn2 double mutants; a similar method was used to generate single and double mutants in the pEF::csr1-1D or pEF::Bel backgrounds. tor-es was crossed with GFP-ATG8E to construct the tor-es/GFP-ATG8E line. T-DNA insertion homozygous mutants and transgenic lines were identified by polymerase chain reaction (PCR), and the primer sets used are listed in Table S2. All of the lines used in this study were in the Col-0 background, and grown on half-strength Murashige and Skoog (Duchefa, M0222.0050) agar medium containing 1% sucrose (Sigma-Aldrich, V900116) (pH 5.8) at 22°C under a 16 h light/8 h dark photo period. For the herbicide treatment, TM (Kangbaotai Fine-Chemicals Ltd, 101200-48-0) was added to the medium, or foliar-sprayed, at the indicated concentrations.
Gene expression analysis
Total RNA was extracted using TRIzol reagent (Invitrogen, 15596026). RNA (2 μg) was treated with RNase-free DNase I (Invitrogen, 18068015), and first-strand cDNA was synthesized by Moloney-Murine Leukemia Virus reverse transcriptase (Invitrogen, 28025013) in a volume of 20 μL followed by adding 130 uL water. For quantitative reverse transcription (qRT)-PCR analysis, 3 μL of the first-strand cDNA described above was used as a template for the PCR in a reaction volume of 20μL. ACT7 served as a control for mRNA levels. qRT-PCR was run in a total volume of 10 μL that contained 4.4 μL of the reverse-transcribed product described above, 0.3 μM of gene-specific primers, and 5 μL FastStart Universal SYBR Green Master (Rox) SuperMix (Roche, 04913914001) on a PRISM 7500 PCR instrument (Applied Biosystems, Singapore), according to the manufacturer's instructions. Actin7 was set as an internal control, and measurements were obtained using the relative quantification method. All of the primers sets used are listed in Table S2.
Western blot analysis
Total proteins were extracted with 50 mM Tris (pH 7.0) (Ambion, AM9851), 150 mM NaCl (Ambion, AM9759), 150 mM EDTA (Ambion, AM9261), and 1 × Protease inhibitor cocktail (Roche, 04693116001) from seedlings treated with or without TM for 24 h, or for the indicated time, and quantified by the Bradford method [Citation43]. Immunoblots were performed as previously described [Citation34,Citation36]. To examine free and lipidated ATG8 proteins, total protein was separated by SDS-PAGE with 6 M urea (Sigma-Aldrich, U5378), blotted and probed with an anti-APG8a (Abcam, ab77003). To examine other proteins, samples were resolved by SDS-PAGE followed by immunoblotting with antibodies directly against GFP (ABclonal Technology, AE011), p-RPS6KB1/S6K1 (Cell Signaling Technology, 9205), HA (ABclonal Technology, AE036), phosphorylated EIF2A (Cell Signaling Technology, 9721), ACTB (ABclonal Technology, AC006), and EIF2A (produced by ABclonal Technology, China, using the peptide IRRRMTPQPMKIRAD as an antigen [Citation33]). Peroxidase-conjugated goat anti-rabbit (or anti-mouse) immunoglobulin G (Abcam, ab6789, ab6721) was used as the secondary antibody. The proteins were bound to polyvinylidene fluoride membranes and detected using a SuperSignal West Dura chemiluminescent substrate kit (Thermo Scientific, 34075) according to the manufacturer's instructions.
TEM
For TEM, excised leaf discs were vacuum-infiltrated and prefixed with 2.5% glutaraldehyde (Sigma-Aldrich, G5882) in 0.1 M phosphate-buffered saline (pH 7.4) (Ambion, AM9625) for 12 h, and were then fixed in 2% OsO4 (Sigma-Aldrich, O5500) in the same buffer. Following ethanol dehydration, samples were embedded in Epon 812 (SPI Science, 90529-77-4). Ultrathin sections were obtained using a UC6 ultramicrotome (Leica, Wetzlar, Germany) and were stained with 2% (w/v) uranyl acetate (Polysciences, 21447-25) and 2.6% (w/v) lead citrate (Sigma-Aldrich, 15326). Observation and capturing of images were performed with a H-7650 transmission electron microscope (Hitachi, Tokyo, Japan) at 80 kV and a Gatan 832 digital camera (Gatan, Pleasanton, CA, USA). To quantify the autophagic structures, the numbers of autophagosomes and autophagic bodies in leaf cells were determined, similar to the previously described method [Citation44,Citation45]. Relative autophagic activity in TM-treated plants was normalized to the activity in the control plants. Approximately 20 cells were used for the quantification. Quantification of the autophagic structures in plants at each time point was performed to calculate the autophagic activity relative to that of control plants, which was set to 1.
Sample preparation and extraction
Ten-d-old seedlings that had been treated with or without TM at 0.1 mg/L for 12 h were harvested for a free amino acids analysis. The freeze-dried seedlings were crushed using a mixer mill MM 400 (Retsch, Germany) with a zirconia bead for 1.5 min at 30 Hz; 100 mg powder was weighed and extracted overnight at 4°C with 500 μL 70% aqueous methanol (Sigma-Aldrich, 34860) containing 0.1 mg/L lidocaine (Sigma-Aldrich, PHR1034) for water-soluble metabolites. Following centrifugation at 10 000 g for 10 min, the extracts were absorbed by CNWBOND Carbon-GCB SPE Cartridge (ANPEL Laboratory Technologies, SBEQ-CA1652) and filtrated with Nylon Syringe Filter (ANPEL Laboratory Technologies, SCAA-104) before liquid chromatography-mass spectrometry (LC-MS) analysis [Citation46].
LC-MS/MS analysis of free amino acids
Samples were analyzed using LC-ESI-QTRAP-MS/MS (AB Sciex, Foster City, CA, USA), and the quantification of free amino acids was conducted out in the multiple reaction monitoring (MRM) mode. The analytical conditions were as follows [Citation46], HPLC: column, shim-pack VP-ODS C18 (SHIMADZU-GL, 228-34937-94) (pore size 5.0 μm, length 2 × 150 mm); solvent system, water (0.04% acetic acid [Sigma-Aldrich, 71251]): acetonitrile (Sigma-Aldrich, 1000291000) (0.04% acetic acid); gradient program, 100:0 V/V at 0 min, 5:95 V/V at 20.0 min, 5:95 V/V at 22.0 min, 95:5 V/V at 22.1 min, 95:5 V/V at 28.0 min; flow rate, 0.25 ml min–1; temperature, 40°C; injection volume: 5 μL. Data acquisition, peak integration, and calculations were performed using Analyst 1.5 software (AB Sciex, USA). Free amino acids were quantified by calculating the area of each individual peak and comparing this to standard curves obtained from amino acid standards, including tryptophan (Sigma-Aldrich, T0254) and glutamine (Sigma-Aldrich, G3126). Calibration curves were drawn by plotting 5 different concentrations of each amino acid standard according to the peak area.
In vivo ALS assays
TM-treated and control 10-d-old seedlings were treated with 1 mM 1,1-cyclopropanedicarboxylic acid (Sigma-Aldrich, 343412) (a ketol-acid reductoisomerase inhibitor) for 24 h, so that the acetolactate produced by ALS could accumulate in the plants. Acetolactate accumulation, which was used to measure the in vivo ALS activity, was determined as previously described [Citation34]. Briefly, tissues were ground in liquid nitrogen with deionized water. The samples were incubated at 60°C for 10 min, and then at room temperature for 45 min with vortexing to facilitate acetolactate extraction. At the end of the incubation, 3 M sulfuric acid (Sinopharm Chemical Reagent Co., Ltd, 10021661) was added, and the mixture was incubated at 60°C for 30 min to convert acetolactate to acetoin. The color was developed by adding 0.5% (w/v) creatine (Aladdin, C105702) and 5% (w/v) α-naphthol (Sinopharm Chemical Reagent Co., Ltd, 30125714) in 2.5 M sodium hydroxide (Sigma-Aldrich, 306576), and then heating at 60°C for 15 min. After cooling, the absorbance at 530 nm was measured by a UVmini-1240 (Shimadzu Corporation, Kyoto, Japan). In vivo ALS activity was measured as the amount of acetoin produced, and all data were relative to that in control plants.
Chlorophyll determination
Leaves of seedlings treated with or without TM for 5 d were harvested, and the chlorophyll content was quantified as previously described [Citation47]. Briefly, chlorophyll was extracted in 80% acetone (Sigma-Aldrich, 650501) and absorbance measured at 663 and 646 nm for calculation of total chlorophyll content per gram fresh weight.
Trypan blue staining
Ten-d-old seedlings treated with or without 0.05 mg/L TM for 5 d were harvested and the trypan blue assay was performed as previously described [Citation35,Citation48]. Briefly, dead plant cells were stained after collecting leaves and boiling them for 2 min in alcoholic lactophenol trypan blue (20 mL of ethanol [Sigma-Aldrich, E7023], 10 mL of phenol [Sangon Biotech, A504195], 10 mL of water, 10 mL of lactic acid [Sangon Biotech, A100349], 10 mg of trypan blue [Sigma-Aldrich, T6146]). Stained leaves were cleared in chloral hydrate buffer (2.5 g chloral hydrate [Sangon Biotech, A600288] dissolved in 1 mL of water) overnight at room temperature. Cleared leaves were mounted under coverslips in 50% glycerol (Sangon Biotech, A100854).
Statistical analysis
A Student t test was used for the comparison between 2 sets of data. One-way analysis of variance (ANOVA) together with the Tukey post hoc test was used for variance analysis and multiple comparisons. Unless specifically stated, 3 biological replicates were used in each experiment. Experiments were performed 3 times with similar results for all the Arabidopsis experiments.
Disclosure of potential conflicts of interest
There were no potential conflicts of interest to be disclosed.
Supplemental_information_1407888.docx
Download MS Word (9 MB)supp_data_1407888.docx
Download MS Word (9 MB)Acknowledgments
We thank Dr. Xingwang Li and Dr. Changbin Gao for helpful discussions and suggestions; Mr. Shouchuang Wang, Mr. Jianbo Cao, and Mrs. Dongqin Li for technical assistance. This work was financially supported by the National Key Research and Development Program of China (grant number 2016YFD0101300), the National Natural Science Foundation of China (grant number 31271761), and the Program for Modern Agricultural Industrial Technology System (grant number CARD-12).
Related Research Data
References
- Vigueira CC, Olsen KM, Caicedo AL.. The red queen in the corn: agricultural weeds as models of rapid adaptive evolution. Heredity. 2013;110(4):303–311. doi:10.1038/hdy.2012.104.
- Mazur BJ, Falco SC. The development of herbicide resistant crops. Annu Rev Plant Physiol Plant Mol Biol. 1989;40(40):441–470. doi:10.1146/annurev.pp.40.060189.002301.
- Duggleby RG, McCourt JA, et al. Structure and mechanism of inhibition of plant acetohydroxyacid synthase. Plant Physiol Biochem. 2008;46(3):309–324. doi:10.1016/j.plaphy.2007.12.004.
- McCourt JA, Pang SS, King-Scott J, et al. Herbicide-binding sites revealed in the structure of plant acetohydroxyacid synthase. Proc Natl Acad Sci USA. 2006;103(3):569–573. doi:10.1073/pnas.0508701103.
- Rhodes D, Hogan AL, Deal L, et al. Amino acid metabolism of Lemna minor L.: II. responses to chlorsulfuron. Plant Physiol. 1987;84(3):775–780. doi:10.1104/pp.84.3.775.
- Zhao J, Williams CC, Last RL. Induction of Arabidopsis tryptophan pathway enzymes and camalexin by amino acid starvation, oxidative stress, and an abiotic elicitor. Plant Cell. 1998;10(3):359–370. doi:10.2307/3870594.
- Yu Q, Powles SB. Resistance to AHAS inhibitor herbicides: current understanding. Pest Manag Sci. 2014;70(9):1340–1350. doi:10.1002/ps.3710.
- Yuan JS, Tranel PJ, Stewart CN Jr. Non-target-site herbicide resistance: a family business. Trends Plant Sci. 2007;12(1):6–13. doi:10.1016/j.tplants.2006.11.001.
- Powles SB, Yu Q. Evolution in action: plants resistant to herbicides. Annu Rev Plant Biol. 2010;61:317–347. doi:10.1146/annurev-arplant-042809-112119.
- Haughn GW, Smith J, Mazur BM, et al. Transformation with a mutant Arabidopsis acetolactate synthase gene renders tobacco resistant to sulfonylurea herbicides. Mol Gen Genet. 1988;211(2):266–271. doi:10.1007/BF00330603.
- Pan G, Zhang X, Liu K, et al. Map-based cloning of a novel rice cytochrome P450 gene CYP81A6 that confers resistance to two different classes of herbicides. Plant Mol Biol. 2006;61(6):933–943. doi:10.1007/s11103-006-0058-z.
- Liu C, Liu S, Wang F, et al. Expression of a rice CYP81A6 gene confers tolerance to bentazon and sulfonylurea herbicides in both Arabidopsis and tobacco. Plant Cell Tiss Organ Cult. 2012;109(3):419–428. doi:10.1007/s11240-011-0106-5.
- Iwakami S, Endo M, Saika H, et al. Cytochrome P450 CYP81A12 and CYP81A21 are associated with resistance to two acetolactate synthase inhibitors in Echinochloa phyllopogon. Plant Physiol. 2014;165(2):618–629. doi:10.1104/pp.113.232843.
- Angelovici R, Lipka AE, Deason N, et al. Genome-wide analysis of branched-chain amino acid levels in Arabidopsis seeds. Plant Cell. 2013;25(12):4827–4843. doi:10.1105/tpc.113.119370.
- Carroll B, Korolchuk VI, Sarkar S. Amino acids and autophagy: cross-talk and co-operation to control cellular homeostasis. Amino Acids. 2015;47(10):2065–2088. doi:10.1007/s00726-014-1775-2.
- Jewell JL, Russell RC, Guan KL. Amino acid signalling upstream of mTOR. Nat Rev Mol Cell Biol. 2013;14(3):133–139. doi:10.1038/nrm3522.
- Sancak Y, Peterson TR, Shaul YD, et al. The Rag GTPases bind raptor and mediate amino acid signaling to mTORC1. Science. 2008;320(5882):1496–1501. doi:10.1126/science.1157535.
- Bonfils G, Jaquenoud M, Bontron S, et al. Leucyl-tRNA synthetase controls TORC1 via the EGO complex. Mol Cell. 2012;46(1):105–110. doi:10.1016/j.molcel.2012.02.009.
- Díaz-Troya S, Perez-Perez ME, Florencio FJ, et al. The role of TOR in autophagy regulation from yeast to plants and mammals. Autophagy. 2008;4(7):851–865. doi:10.4161/auto.6555.
- Kamada Y, Funakoshi T, Shintani T, et al. Tor-mediated induction of autophagy via an Apg1 protein kinase complex. J Cell Biol. 2000;150(6):1507–1513.
- Liu Y, Bassham DC. Autophagy: pathways for self-eating in plant cells. Annu Rev Plant Biol. 2012;63(63):215–237. doi:10.1146/annurev-arplant-042811-105441.
- Levine B, Klionsky DJ. Development by self-digestion: molecular mechanisms and biological functions of autophagy. Dev Cell. 2004;6(4):463–477. doi:10.1016/S1534-5807(04)00099-1.
- Klionsky DJ, Abdalla FC, Abeliovich H, et al. Guidelines for the use and interpretation of assays for monitoring autophagy. Autophagy. 2012;8(4):445–544. doi:10.4161/auto.5338.
- Nakatogawa H, Suzuki K, Kamada Y, et al. Dynamics and diversity in autophagy mechanisms: lessons from yeast. Nat Rev Mol Cell Biol. 2009;10(7):458–467. doi:10.1038/nrm2708.
- Onodera J, Ohsumi Y. Autophagy is required for maintenance of amino acid levels and protein synthesis under nitrogen starvation. J Biol Chem. 2005;280(36):31582–31586. doi:10.1074/jbc.M506736200.
- Yang Z, Huang J, Geng J, et al. Atg22 recycles amino acids to link the degradative and recycling functions of autophagy. Mol Biol Cell. 2006;17(12):5094–5104. doi:10.1091/mbc.E06-06-0479.
- Hinnebusch AG. Translational regulation of GCN4 and the general amino acid control of yeast. Annu Rev Microbiol. 2005;59(1):407–450. doi:10.1146/annurev.micro.59.031805.133833.
- Ecker N, Mor A, Journo D, et al. Induction of autophagic flux by amino acid deprivation is distinct from nitrogen starvation-induced macroautophagy. Autophagy. 2010;6(7):879–890. doi:10.4161/auto.6.7.12753.
- Talloczy Z, Jiang W, Virgin HW IV, et al. Regulation of starvation- and virus-induced autophagy by the eIF2alpha kinase signaling pathway. Proc Natl Acad Sci USA. 2002;99(1):190–195. doi:10.1073/pnas.012485299.
- Vlahakis A, Graef M, Nunnari J, et al. TOR complex 2-Ypk1 signaling is an essential positive regulator of the general amino acid control response and autophagy. Proc Natl Acad Sci USA. 2014;111(29):10586–10591. doi:10.1073/pnas.1406305111.
- Cherkasova VA, Hinnebusch AG. Translational control by TOR and TAP42 through dephosphorylation of eIF2alpha kinase GCN2. Genes Dev. 2003;17(7):859–872. doi:10.1101/gad.1069003.
- Lageix S, Lanet E, Pouch-Pelissier MN, et al. Arabidopsis eIF2alpha kinase GCN2 is essential for growth in stress conditions and is activated by wounding. BMC Plant Biol. 2008;8(1):134. doi:10.1186/1471-2229-8-134.
- Zhang Y, Wang Y, Kanyuka K, et al. GCN2-dependent phosphorylation of eukaryotic translation initiation factor-2alpha in Arabidopsis. J Exp Bot. 2008;59(11):3131–3141. doi:10.1093/jxb/ern169.
- Zhao L, Jing X, Chen L, et al. Tribenuron-methyl induces male sterility through anther-specific inhibition of acetolactate synthase leading to autophagic cell death. Mol Plant. 2015;8(12):1710–1724. doi:10.1016/j.molp.2015.08.009.
- Wang Y, Nishimura MT, Zhao T, et al. ATG2, an autophagy-related protein, negatively affects powdery mildew resistance and mildew-induced cell death in Arabidopsis. Plant J. 2011;68(1):74–87. doi:10.1111/j.1365-313X.2011.04669.x.
- Chung T, Phillips AR, Vierstra RD. ATG8 lipidation and ATG8-mediated autophagy in Arabidopsis require ATG12 expressed from the differentially controlled ATG12A and ATG12B loci. Plant J. 2010;62(3):483–493. doi:10.1111/j.1365-313X.2010.04166.x.
- Yoshimoto K, Hanaoka H, Sato S, et al. Processing of ATG8s, ubiquitin-like proteins, and their deconjugation by ATG4s are essential for plant autophagy. Plant Cell. 2004;16(11):2967–2983. doi:10.1105/tpc.104.025395.
- Zhou J, Wang J, Cheng Y, et al. NBR1-mediated selective autophagy targets insoluble ubiquitinated protein aggregates in plant stress responses. PLoS Genet. 2013;9(1):e1003196. doi: 10.1371/journal.pgen.1003196.
- Liu Y, Bassham DC. TOR is a negative regulator of autophagy in Arabidopsis thaliana. PLoS One. 2010;5(7):e11883. doi: 10.1371/journal.pone.0011883.
- Xiong Y, Sheen J. Rapamycin and glucose-target of rapamycin (TOR) protein signaling in plants. J Biol Chem. 2012;287(4):2836–2842. doi: 10.1074/jbc.M111.300749.
- Wengrod J, Wang D, Weiss S, et al. Phosphorylation of eIF2alpha triggered by mTORC1 inhibition and PP6C activation is required for autophagy and is aberrant in PP6C-mutated melanoma. Sci Signal. 2015;8(367):ra27. doi: 10.1126/scisignal.aaa0899.
- Schnell J, Labbe H, Kovinich N, et al. Comparability of imazapyr-resistant Arabidopsis created by transgenesis and mutagenesis. Transgenic Res. 2012;21(6):1255–1264. doi: 10.1007/s11248-012-9597-z.
- Bradford MM. A rapid and sensitive method for the quantitation of microgram quantities of protein utilizing the principle of protein-dye binding. Anal Biochem. 1976;72:248–254. doi:10.1006/abio.1976.9999.
- Wang Y, Yu B, Zhao J, et al. Autophagy contributes to leaf starch degradation. Plant Cell. 2013;25(4):1383–1399. doi:10.1105/tpc.112.108993.
- Liu Y, Schiff M, Czymmek K, et al. Autophagy regulates programmed cell death during the plant innate immune response. Cell. 2005;121(4):567–577. doi:10.1016/j.cell.2005.03.007.
- Chen W, Gong L, Guo Z, et al. A novel integrated method for large-scale detection, identification, and quantification of widely targeted metabolites: application in the study of rice metabolomics. Mol Plant. 2013;6(6):1769–1780. doi:10.1093/mp/sst080.
- Arnon DI. Copper enzymes in isolated chloroplasts. polyphenoloxidase in Beta vulgaris. Plant Physiol. 1949;24(1):1–15. doi:10.1104/pp.24.1.1.
- Frye CA, Innes RW. An Arabidopsis mutant with enhanced resistance to powdery mildew. Plant Cell. 1998;10(6):947–956. doi:10.1105/tpc.10.6.947.