
ABSTRACT
WNT-CTNN1B signaling promotes cancer cell proliferation and stemness. Furthermore, recent evidence indicates that macroautophagy/autophagy regulates WNT signaling. Here we investigated the impact of inhibiting WNT signaling on autophagy in glioblastoma (GBM), a devastating brain tumor. Inhibiting TCF, or silencing TCF4 or CTNNB1/β-catenin upregulated SQSTM1/p62 in GBM at transcriptional and protein levels and, in turn, autophagy. DKK1/Dickkopf1, a canonical WNT receptor antagonist, also induced autophagic flux. Importantly, TCF inhibition regulated autophagy through MTOR inhibition and dephosphorylation, and nuclear translocation of TFEB, a master regulator of lysosomal biogenesis and autophagy. TCF inhibition or silencing additionally affected GBM cell proliferation and migration. Autophagy induction followed by its blockade can promote cancer cell death. In agreement with this notion, halting both TCF-CTNNB1 and autophagy pathways decreased cell viability and induced apoptosis of GBM cells through a SQSTM1-dependent mechanism involving CASP8 (caspase 8). In vivo experiments further underline the therapeutic potential of such dual targeting in GBM.
| Abbreviations | ||
| AP | = | alkaline phosphatase |
| ACTB | = | actin beta |
| CTNNB1/β-catenin | = | catenin beta 1 |
| Baf | = | bafilomycin A1 |
| CQ | = | chloroquine |
| DKK1 | = | dickkopf WNT signaling pathway inhibitor 1 |
| DVL2 | = | disheveled segment polarity protein 2 |
| FBS | = | fetal bovine serum |
| GAPDH | = | glyceraldehyde-3-phosphate dehydrogenase |
| GBM | = | glioblastoma multiforme |
| GSK3B | = | glycogen synthase kinase 3 beta |
| LRP | = | LDL receptor related protein |
| MAPK | = | mitogen-activated protein kinase |
| MTOR | = | mechanistic target of rapamycin |
| MTT | = | 3-(4,5-dimethylthiazol-2-yl)-2,5-diphenyltetrazolium bromide |
| PBS | = | phosphate-buffered saline |
| PI | = | propidium iodide |
| SCID | = | severe combined immunodeficient |
| SQSTM1/p62 | = | sequestosome 1 |
| TCF | = | T-cell transcription factor |
| TFEB | = | transcription factor EB |
| TMA | = | tissue microarray |
| WST-1 | = | 4-[3-(4-iodophenyl)-2-(4-nitrophenyl)-2H-5-tetrazolio]-1,3-benzene disulfonate |
| WT | = | wild type |
Introduction
Gliomas are primary brain tumors classified into different malignancy grades (World Health Organization): diffuse astrocytoma (grade II), anaplastic astrocytoma (grade III) and glioblastoma multiforme (GBM; grade IV) [Citation1,Citation2] GBMs are the most common and aggressive gliomas, presenting a poor prognosis and median survival below 14 mo [Citation3]. GBM features are a high infiltrative/invasive capacity, apoptosis resistance, necrosis and angiogenesis [Citation4]. Despite treatment (extensive surgery, radiotherapy and chemotherapy with temozolomide), GBM recurrence is unfortunately very common. Therefore, there is an urgent need for novel therapies for this noncurable disease [Citation5].
Canonical WNT signaling plays important functions in development and cell proliferation, and its aberrant activation is linked to tumorigenesis [Citation6,Citation7]. The main effector of the WNT canonical pathway is CTNNB1/β-catenin [Citation8], which acts together with transcription factors of the TCF/LEF (transcription factor/lymphoid enhancer binding factor) families to control expression of WNT target genes. In the absence of WNT ligands, CTNNB1 associates with the destruction complex that includes GSK3B (glycogen synthase kinase 3 beta), a Ser/Thr kinase that phosphorylates CTNNB1, leading to its proteasomal degradation. Upon WNT binding to FZD (frizzled class receptor) and LRP (LDL receptor related protein) receptors, the destruction complex destabilizes. Unphosphorylated CTNNB1 then escapes from degradation and translocates to the nucleus [Citation8]. WNT inhibitors, such as the extracellular antagonist of LRP5 and LRP6, DKK1/Dickkopf1, control WNT signaling. Unlike other cancers, CTNNB1 mutations are infrequent in GBM, and WNT signaling activation appears to occur by upregulation of WNT ligands [Citation9] or epigenetic regulation of WNT inhibitors [Citation2,Citation10]. Additional mechanisms include control by upstream protoncogenes [Citation11], overexpression of the scaffold protein DVL2/Dishevelled2 [Citation12] and activation of CTNNB1 nuclear signaling [Citation10,Citation13].
Macroautophagy (referred to as autophagy) is a conserved adaptive response that recycles cellular components to provide nutrients under metabolic cell stress. During autophagy, double-membrane vesicles, phagophores, engulf damaged proteins and organelles. After maturation into autophagosomes, these compartments then fuse with lysosomes, where the cargo is degraded, providing biosynthetic and energy precursors, thus contributing to the survival of tumor cells in unfavorable conditions [Citation14]. Autophagy in cancer plays a dual role. In early stages of tumorigenesis, it acts as a tumor suppressor preventing accumulation of damaged proteins and organelles. However, in advanced stages, autophagy provides tolerance against metabolic stress under conditions of nutrient deprivation and confers resistance to radio and chemotherapy [Citation15]. MTOR (mechanistic target of rapamycin) regulates cell growth, proliferation and anabolic processes, and its inhibition is central to autophagy induction [Citation16].
Interestingly, autophagy and WNT-CTNNB1 signaling appear inversely regulated in cancer. The WNT pathway component DVL2 maintains GBM cell proliferation through canonical and noncanonical WNT signaling [Citation12]. In turn, autophagy negatively regulates WNT signaling by promoting DVL2 [Citation17] and CTNNB1 degradation [Citation18,Citation19]. Furthermore, the TCF-CTNNB1 complex represses SQSTM1/p62 [Citation18], which is responsible for the binding to MAP1LC3/LC3 (microtubule associated protein 1 light chain 3) that, once lipidated, associates with phagophores and is involved in cargo recognition [Citation20]. Finally, WNT signaling (involving GSK3B inhibition) activates MTOR and protein translation [Citation21].
Here we sought to elucidate the effects of inhibiting WNT-CTNNB1 signaling on autophagy in GBM cell lines and biopsy-derived cell cultures. To this end, we inhibited TCF-CTNNB1 signaling using the pharmacological inhibitor FH535, silencing TCF4 or CTNNB1 by shRNA/siRNA, or challenging the cells with the WNT receptor antagonist DKK1. We found that inhibition of WNT signaling in GBM upregulates SQSTM1 and, consequently, autophagic flux through MTOR inhibition and nuclear translocation of TFEB (transcription factor EB), a master regulator of autophagosome and lysosome biogenesis [Citation22,Citation23]. Moreover, our data show that autophagy induction renders GBM cells more sensitive to cell death by autophagy blockers, which could be exploited in future therapies.
Results
SQSTM1 levels increase in GBM and inversely correlate with CTNNB1
To test SQSTM1 protein levels in diffuse astrocytoma, anaplasic astrocytoma and GBM (grade IV) samples, we performed an immunohistochemical analysis in tissue microarrays (TMAs). SQSTM1 was detectable in grade II astrocytomas and its levels increased in GBMs (8.78 fold, GBM vs. astrocytomas; p = 0.003) (A and D). Further analysis using the GlioVis platform [Citation24] confirmed the increase of SQSTM1 mRNA levels in GBMs compared to non-tumor or astrocytoma samples (p<0.001; B).
Figure 1. SQSTM1 levels increase in GBMs and inversely correlate with CTNNB1. (A) Representative immunostainings for SQSTM1 from astrocytoma grade II and GBM (grade IV) biopsies from the TMAs. Nuclei were counterstained with haematoxylin. Bar: 100 µm. (B) SQSTM1 mRNA levels in non-tumor, astrocytomas (grade II and III) and GBM tumors as analyzed by Gliovis platform. ***p<0.001 (Turkey's statistics). (C) CTNNB1 and SQSTM1 expression correlation as analyzed by Gliovis in GBM samples (Pearson correlation). (D) Primary cultures from astrocytoma grade II and GBMs grade IV, and GBM cell lines were analyzed for SQSTM1 and CTNNB1 by WB. (E) Different GBM (grade IV) primary cultures were immunoblotted for autophagic markers, CTNNB1 and the WNT target, CCND1. CTNNB1 or CCND1 levels inversely relate with autophagic markers (SQSTM1, BECN1 or MAP1LC3A/B-II) in a number of cases. ACTB/β-actin was used as a loading control.
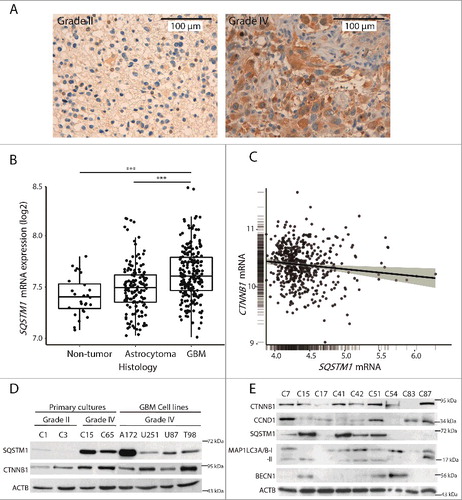
Previous studies in colorectal carcinoma cells [Citation18] described an inverse relationship between SQSTM1 and CTNNB1. Data obtained from Gliovis supported this in GBM (C; p = 0.01), which was corroborated in our GBM biopsy-derived cell cultures and established cell lines (D). A comparison of autophagic markers and the levels of CTNNB1 or CCND1 (cyclin D1; a WNT target) indicated an inverse relationship in several GBM cases (E), further suggesting a negative association between WNT-CTNNB1 signaling and autophagy or vice versa.
WNT-CTNNB1 signaling regulates SQSTM1 through TCF-dependent transcriptional regulation
To investigate how WNT-CTNNB1 signaling modulates SQSTM1, GBM cell lines were treated with WNT3A to activate WNT-CTNNB1 signaling or with FH535 (a TCF inhibitor that affects CTNNB1 recruitment) [Citation25] to inhibit it. WNT3A decreased SQSTM1 mRNA in the A172 cell line (A and see below). On the contrary, SQSTM1 expression (at both the mRNA and protein levels) increased after treatment with FH535 in U251-MG and U87-MG cell lines and in GBM primary cultures (A and B). We confirmed that WNT3A and FH535 activate or inhibit WNT signaling, respectively, by the TOP-Flash assay and expression of the target gene CCND1 (Figure S1). A172 cells displayed higher SQSTM1 protein levels than U251-MG or U87-MG cells (Figure S2), which may explain why SQSTM1 could not be further increased by FH535, but significantly decreased upon treatment with WNT3A. To validate the results obtained using a pharmacological inhibitor of TCF, we transduced cells with lentiviruses carrying a shRNA targeting TCF4. Cells expressing the shRNA against TCF4 showed a 60–80% decrease in TCF4 mRNA, compared to cells expressing a scrambled shRNA (C). Parallel to this, cells expressing the shRNA of TCF4 increased SQSTM1 mRNA (1.8–2.3 fold vs. scrambled; C) and SQSTM1 protein levels (D), consistent with the FH535 results. Thus, TCF inhibition or silencing raise SQSTM1 expression in GBM cells.
Figure 2. WNT-CTNNB1 signaling transcriptionally upregulates SQSTM1 in GBM. (A) GBM cell lines were treated with WNT3A (100 ng/ml) and FH535 (10 µM) for 24 h. SQSTM1 mRNA levels were analyzed by qPCR and data presented as fold induction vs. control normalized to GAPDH. Values are mean ± s.e.m of triplicate measurements of 3 independent experiments. (B) SQSTM1 immunoblotting analysis in A172, U251-MG and U87-MG GBM cell lines and C17 and C65 primary GBM cultures treated with FH535 (10 µM, 24 h). ACTB was used as a loading control. (C) TCF4 and SQSTM1 mRNA levels were examined by qPCR in control (scrambled shRNA; Scr) or TCF4-silenced (shRNA TCF4) U251-MG and U87-MG cell lines. (D) SQSTM1 protein levels in control cells (Scr) or TCF4-silenced GBM cell lines. (E and F) A172, U251-MG and U87-MG cells were transfected with CTNNB1 or control (GAPDH) siRNAs (E) or with WT and S37Y CTNNB1 plasmids (F) and SQSTM1 and CTNNB1 protein levels were analyzed after 48 h. *p<0.05, **p<0.01 and ***p<0.001
Because CTNNB1 acts together with TCF, we next investigated the role of CTNNB1 in SQSTM1 regulation. First, we transfected GBM cells with siRNAs against CTNNB1 or GAPDH (used as a control). We observed decreased CTNNB1 and increased SQSTM1 levels in U251-MG and U87-MG cells upon transfection of the CTNNB1 siRNA (E). By contrast, cells expressing a stabilized mutant form of CTNNB1 (S37Y) that is not degraded, presented lower levels of SQSTM1 compared to cells transfected with wild-type (WT) CTNNB1 (F). Together, these results confirm that CTNNB1-TCF signaling transcriptionally represses SQSTM1 in GBM.
Inhibition of WNT-CTNNB1 signaling increases the autophagic flux in GBM
Next, we aimed to understand the functional implications of the SQSTM1 regulation by WNT-CTNNB1 signaling. As SQSTM1 acts as a cargo receptor of phagophores, we studied the autophagic flux upon inhibition of WNT signaling. First, we reduced the activity of TCF with FH535. Analysis of autophagy markers showed an increase of MAP1LC3A/B-II in treated cells, indicative of increased autophagosome numbers. These results were paralleled by lower levels of polyubiquitinated proteins in GBM cells treated with FH535 (A), suggesting an enhancement of autophagy. To confirm whether the deregulation observed corresponds to an induction of autophagic flux, we used bafilomycin A1 (Baf), which prevents autophagosome-lysosome fusion and blocks autophagic flux. Increased autophagic flux would elevate MAP1LC3A/B-II upon addition of Baf. If the increase in MAP1LC3A/B-II in treatment plus Baf is higher than that of Baf alone, results should be interpreted as autophagic flux induction. Instead, MAP1LC3A/B-II levels unaltered by Baf should be interpreted as autophagy blockade and accumulation of autophagosomes [Citation26]. We treated GBM cells with or without FH535 for 24 h together with Baf (last 2 h). Treatment with FH535 and Baf showed higher levels of MAP1LC3A/B-II compared to Baf alone (B), indicating autophagy induction by FH535. Importantly, similar results were obtained in GBM primary cultures (B). These results showed that autophagic flux is augmented by inhibition of TCF in GBM.
Figure 3. Inhibition of WNT-CTNNB1 signaling increases the autophagic flux in GBM. (A) Total cell lysates from A172, U251-MG and U87-MG cells untreated or incubated with FH535 (10 µM, 24 h) were immunoblotted for MAP1LC3A/B and ubiquitinated (Ub) proteins. (B and C) U251-MG and U87-MG GBM cell lines and C17 and C65 primary GBM cultures (B) were treated with FH535 as above (B) or with 50 ng/ml DKK1 (C) for 24 h plus Baf (5 nM) for the last 2 h. Cell lysates were immunoblotted for MAP1LC3A/B. Values indicate the fold increase of MAP1LC3A/B-II vs. untreated control cells. ACTB was used as a loading control. (D) Representative images from U87-MG cells transfected with the ptfLC3 plasmid and treated with the indicated drugs. Pictures correspond to merge of red and green channels. Cells with red and green colocalizing (yellow) fluorescent MAP1LC3A/B puncta show autophagosomes, whereas red-only fluorescent MAP1LC3A/B dots indicate autolysosomes. Bar: 50 µm. The numbers of green and red puncta/cell were calculated and shown as a bar graph (note that whereas in CQ there is a balance between red and green puncta, the other treatments show a marked increase of red dots). Data are mean ± s.e.m of at least 40 different cells from 10 different fields from 3 independent experiments. *** p<0.001.
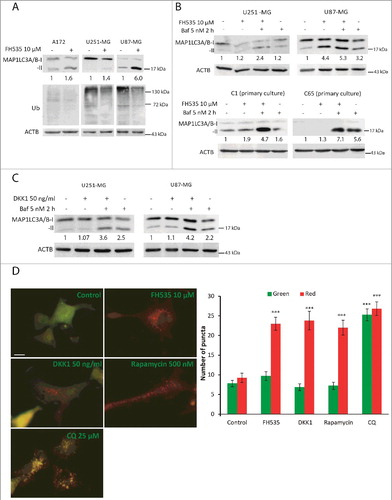
To assess the involvement of WNT signaling in autophagy regulation at an upstream level of the WNT-CTNNB1 pathway, we treated GBM cell lines with DKK1 (a WNT antagonist acting at the receptor level). We treated cells with DKK1 alone or together with Baf. Results showed increased MAP1LC3A/B-II levels in cells cotreated with DKK1 and Baf compared to cells treated with Baf alone (C), showing that DKK1 induced autophagy.
The regulation of autophagy by inhibition of WNT signaling was additionally addressed by transfecting with a tandem-fluorescent tagged MAP1LC3B plasmid (ptfLC3/mRFP-EGFP-LC3) [Citation27]. Autophagosomes formed from phagophores that incorporated ptfLC3 appear yellow (as a result of the colocalization of mRFP and EGFP fluorescence), which distinguished them from autolysosomes (presenting a red fluorescence due to quenching of EGFP in the lysosomes). Rapamycin (an MTOR inhibitor) increased the number of red puncta (D). In contrast, treatment with the autophagy blocker chloroquine (CQ) elevated the number of yellow puncta (D). FH535 or DKK1 produced a red puncta pattern, similar to that obtained with rapamacyin, demonstrating increased numbers of autolysosomes and autophagy induction (D). A comparison of the pattern obtained after FH535 plus CQ vs. FH535 alone confirmed an intact autophagic flux (data not shown).
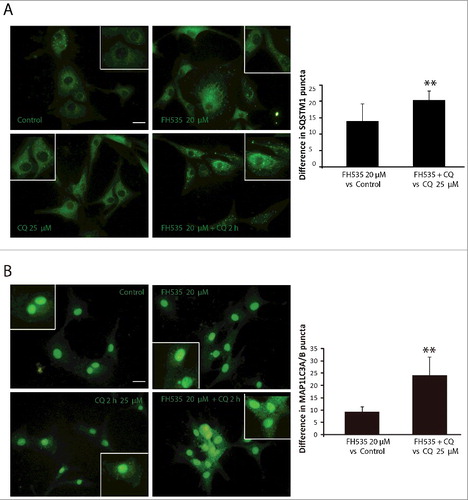
Finally, we used immunocytochemistry against SQSTM1 and MAP1LC3A proteins to study autophagy regulation upon TCF inhibition. Immunostainings from cells treated with FH535 were compared to those achieved after treatment with rapamycin or with CQ and Baf. Rapamycin moderately increased the number of MAP1LC3A and SQSTM1 puncta, as a result of elevated autolysosome numbers caused by autophagy induction. Furthermore, CQ or Baf produced a huge increase in MAP1LC3A and SQSTM1 puncta, and these appeared bigger, suggesting that they corresponded to the fusion of autophagosomes caused by autophagy blockade. Interestingly, FH535 moderately increased the number of SQSTM1 and MAP1LC3A puncta, similar to rapamycin (Figure S3). To demonstrate that the increase in SQSTM1 and MAP1LC3A puncta is due to an induction of autophagy, we also performed the MAP1LC3A and SQSTM1 immunostaining under FH535 and CQ combined treatments. Results showed higher increases in the numbers of MAP1LC3A and SQSTM1 puncta when comparing the increase in FH535 and CQ cotreatment vs. CQ alone with that obtained in FH535 vs. control (). Together, our results demonstrate that inhibition of WNT-CTNNB1 signaling, through DKK1 or TCF inhibition, promotes autophagic flux in GBM.
Figure 4. TCF inhibition increases SQSTM1 and MAP1LC3A/B puncta in GBM. SQSTM1 (A) and MAP1LC3A (B) immunostaining in the U87-MG GBM cell line. Cells were treated in the absence or presence of FH535 (10 µM, 24 h) and CQ (25 µM, last 2 h). Insets show enlarged areas. The number of puncta was counted using ImageJ. Plots show the increase in the number of MAP1LC3A (A) and SQSTM1 (B) puncta when comparing the FH535 and CQ doubly-treated cells vs. CQ-treated cells to the number of puncta obtained in FH535-treated cells vs. untreated cells. **p<0.01. Bars: 20 µm.
Inhibition of TCF diminishes MTOR signaling and produces TFEB nuclear translocation
The Ser/Thr kinase MTOR occupies a central position integrating positive and negative stimuli that trigger autophagy [Citation16,Citation28]. We asked whether TCF inhibition leads to autophagy via inhibition of MTOR. U251-MG and U87-MG cells treated with FH535 showed reduced phosphorylation of RPS6KB/p70S6K and of EIF4E, as well as reduced expression of ATF4, all established MTOR substrates (A) [Citation28,Citation29]. On the contrary, total levels of RPS6KB and EIF4E were not affected (A). These results indicate that MTOR is inhibited upon FH535 treatment. Similar results were obtained by treating the cells with the MTOR inhibitor rapamycin, which abolished RPS6KB phosphorylation (A). AKT and MAPK/ERK proteins positively regulate the activity of MTOR by phosphorylating and inhibiting TSC1/2 [Citation16]. Thus, inhibition of AKT and MAPK decreases MTOR activity and promotes autophagy. In line with this, FH535 decreased the phosphorylation of AKT and MAPK in U87-MG cells, but not in the U251-MG cell line (A). These results suggest that TCF inhibition decreases MTOR activity to induce autophagy, through AKT and MAPK in U87-MG cells.
Figure 5. Inhibition of TCF diminishes MTOR signaling and promotes TFEB nuclear translocation. (A) U251-MG and U87-MG cells were treated with 10 or 20 µM FH535 or 5 µM rapamycin for 24 h. Western blots for phosphorylated RPS6KB (Thr389), EIF4E (Ser209), total RPS6KB, total EIF4E and ATF4 levels were analyzed as MTOR targets. Phosphorylated AKT (Ser473) and MAPK (Tyr202/204) were analyzed and compared to total AKT and MAPK. ACTB was used as a loading control. Plots represent the quantification of phosphorylated RPS6KB, phosphorylated EIF4E and ATF4 levels normalized vs. ACTB (shown as percent of the control; *p <0.05 and *** p<0.001; n≥3). (B) Immunoblot for TFEB from U251-MG, U87-MG and A172 untreated cells, cells treated with FH535 or deprived of serum for 24 h. The TFEB upper band corresponds to the phosphorylated/inactive TFEB form, whereas the lower band corresponds to dephosphorylated and active TFEB, as indicated by the deprivation condition. Small panels show A172 cell lysates treated with or without AP, demonstrating the TFEB band shift towards the lower band in the presence of the enzyme. ACTB was used as a loading control. The plot represents the quantification of the dephosphorylated:phosphorylated TFEB ratio (lower:upper band) (*p <0.05 and **p<0.01; n≥3). (C) TFEB immunostaining (green) overlapped with Hoechst staining (blue) in U251-MG and U87-MG cell lines and C65 primary GBM cells, after treatment with FH535 or serum deprivation and compared to control cells. Note that in all conditions except controls (where TFEB immunostaining appears perinuclear; arrows), TFEB immunostaining is predominantly nuclear and colocalizes with Hoechst. Bar: 50 µm. Single-channel TFEB pictures can also be found Figure S4. (D) Quantification of nuclear TFEB immunostaining in U251-MG, U87-MG and C65 GBM cells treated as indicated. *** p<0.001.
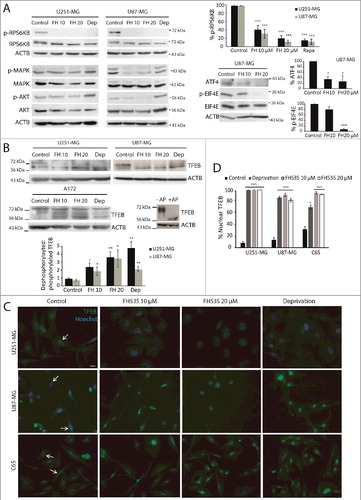
TFEB is a master regulator that controls lysosomal biogenesis by upregulating genes of the Coordinated Lysosomal Expression and Regulation network and autophagy, including SQSTM1 [Citation28,Citation30]. When nutrients are present, TFEB colocalizes with the MTOR complex on the lysosomal membrane, and phosphorylation of TFEB by MTOR inhibits TFEB activation. Nutrient starvation or pharmacological inhibition of MTOR activates TFEB (generating dephosphorylated TFEB) by promoting its nuclear translocation [Citation28,Citation31,Citation32]. We hypothesized that the mechanism by which TCF inhibition induces autophagy could involve TFEB nuclear translocation and, subsequently, SQSTM1 upregulation. To investigate the effect of TCF inhibition on TFEB, we analyzed lysates of cells treated with FH535 or deprived of serum. In basal conditions, TFEB immunoblot showed 2 bands that correspond to the phosphorylated form (upper band) and to the dephosphorylated form (lower band; as confirmed by alkaline phosphatase [AP] treatment) (B) [Citation31,Citation32]. Moreover, under deprivation the lower dephosphorylated band prevails, as expected (B). Interestingly, GBM cells treated with FH535 mostly displayed the TFEB lower band, similar to the deprivation condition (B). Quantification of the dephosphorylated:phosphorylated TFEB ratio (lower:upper bands) confirmed that TCF inhibition and deprivation significantly increased the proportion of the lower band (B). These results suggest that TCF inhibition reduces MTOR activity and promotes TFEB dephosphorylation, which has been linked to its activation [Citation22,Citation30,Citation31]. We next examined whether TFEB dephosphorylation associated with its nuclear translocation. We observed that under control conditions TFEB localized in the cytoplasm. However, interestingly, after deprivation or FH535 treatments, TFEB was markedly nuclear in GBM cell lines and primary cultures (C, D and S4). Together, these results indicate that inhibition of TCF induces autophagy through MTOR inhibition and TFEB dephosphorylation/activation. As TFEB activation controls SQSTM1 expression, these results suggest a mechanism for SQSTM1 upregulation by FH535 leading to increased autophagy.
TCF inhibition decreases GBM cell proliferation and migration
Autophagy and cell proliferation are subject to a complex regulation, whereby MTOR links both processes by positively regulating cell growth and proliferation and negatively affecting autophagy. Furthermore, oncogenic WNT-CTNNB1 signaling is involved in cell proliferation and increases MTOR activity [Citation12,Citation21,Citation33]. We examined the effects of TCF inhibition or autophagy blockade on cell proliferation by treating GBM cell lines with FH535, Baf or CQ. Trypan blue exclusion counting indicated that all treatments decreased the number of live cells (A). Next, immunostaining against the proliferation marker MKI67/Ki67 further showed a decrease in cell proliferation by the 3 treatments, compared to control cells (Figure S5A). Furthermore, we studied the effects of TCF4 gene silencing on U87-MG cell proliferation in a series of lentiviral-driven shRNA experiments. Both trypan blue assays (B) and MKI67 immunostaining (Figure S5B) showed decreased proliferation of shRNA-TCF4 cells compared to control cells (scr shRNA), in agreement with the results obtained with FH535. In addition, clonogenic assays showed a significant decrease in the capacity to form colonies of TCF4-silenced cells compared to control cells (C).
Figure 6. TCF inhibition decreases GBM cell proliferation. (A) U251-MG and U87-MG cells were treated with FH535 (10 µM), Baf (5 nM) and CQ (15 µM). After 24 and 48 h of treatment, cells were counted using trypan blue staining. (B) Control (shRNA scr) and TCF4-silenced (shRNA TCF4) U87-MG cells were counted after 24, 48 and 72 h of plating. (C) Control (shRNA scr) and TCF4-deficient U87-MG cells were grown in colony-forming assays and colony numbers counted. Representative images are shown. (D) U251-MG and U87-MG cells were treated as indicated for 48 h before cell counting. The plot shows the number of cells compared to the respective control at 48 h. The dashed line indicates the number of plated cells. FH535 and Baf/CQ treatments reduced cell proliferation, whereas the dual treatments reduced the number of cells below the line (indicating cell death; see ). (E) U251-MG and U87-MG cell viability was measured using the WST-1 reagent. Treatments were performed alone or in combination for 48 h at the indicated concentrations. * p-value compares to FH535 alone, and # p-value compares to the autophagy blocker (Baf or CQ) treatment alone; * or # p <0.05 and ** or ## p<0.01. (F) Control and TCF4-deficient U87-MG cells were treated with autophagy blockers (Baf and CQ) for 48 h and cells were subjected to the WST-1 viability assay. *p<0.05, **p<0.01.
The effect of FH535 on GBM cell migration was also explored based on the well-known involvement of WNT signaling in this process [Citation34]. The effects of FH535 were compared to those of Baf and CQ in wound-healing assays. FH535 reduced cell migration into the wound area by approximately 50% and 30% in U251-MG cells and U87-MG cells, respectively, vs. controls (Figure S6A). Consistently, similar results were obtained in TCF4-silenced U87-MG cells (Figure S6B). However, treatment with Baf or CQ did not significantly affect cell migration. Together, our results indicate that FH535 reduces GBM cell proliferation and migration.
Dual inhibition of TCF and autophagy promotes GBM cell apoptosis by a SQSTM1-dependent CASP8 activation
TCF inhibition/silencing led to autophagy induction accompanied by decreased cell proliferation. Upregulating and then blocking autophagy can induce cancer cell death. In GBM cells, treatment with FH535 or with autophagy blockers (Baf or CQ) alone reduced cell proliferation (A and D) and only modestly affected cell viability (E and S5C). Interestingly, the combined treatment (FH535 and autophagy blockers) reduced cell viability to approximately 20–40% compared to controls (E and D). Similar results were obtained when TCF4-silenced cells were treated with autophagy blockers (F).
We next sought to determine whether this decrease in cell viability was due to cell proliferation or cell death effects. We performed ANXA5 (annexin A5)-propidium iodide (PI) assays to assess cell death in GBM cells treated with FH535 or with autophagy blockers alone or in combination. Whereas single treatments did not induce major effects, the combined treatments (FH535 and Baf or CQ) notably increased the percentage of cells in late apoptosis and reduced the number of live cells (A and S7A). These results were confirmed by Hoechst staining that demonstrated the presence of condensed nuclei in combined treatments, but not in single treatments (FH535 or Baf and CQ alone; B).
Figure 7. Dual inhibition of TCF and autophagy sensitizes to cell death. (A) U251-MG and U87-MG cells were analyzed by ANXA5-PI assay to calculate live, early and late apoptotic and necrotic cell populations. Cells were treated as indicated for 48 h. *p<0.05. (B) U251-MG cells incubated with single or dual treatments as above and stained with Hoechst. Condensed apoptotic nuclei are observed after dual treatment with TCF inhibitor and CQ. Bar: 50 µm. (C) Immunoblot for CASP8 in U87-MG cells shows an active cleaved CASP8 (p18) fragment upon FH535 and Baf double treatment. p43 corresponds to a CASP8 pro-fragment [Citation36]. ACTB was used as a loading control. (D) ANXA5-PI assay performed in control (empty vector) or in CASP8-silenced cells treated with FH535 and Baf for 48 h. (E) ANXA5-PI assay from control U87-MG cells (scr shRNA) or shRNA SQSTM1 cells treated as indicated for 48 h (n.s., non significant). (F) Immunoblots showing reduced CASP8 (top) and SQSTM1 (bottom) protein levels upon expression of specific shRNAs in U87-MG cells. ACTB was used as a loading control.
![Figure 7. Dual inhibition of TCF and autophagy sensitizes to cell death. (A) U251-MG and U87-MG cells were analyzed by ANXA5-PI assay to calculate live, early and late apoptotic and necrotic cell populations. Cells were treated as indicated for 48 h. *p<0.05. (B) U251-MG cells incubated with single or dual treatments as above and stained with Hoechst. Condensed apoptotic nuclei are observed after dual treatment with TCF inhibitor and CQ. Bar: 50 µm. (C) Immunoblot for CASP8 in U87-MG cells shows an active cleaved CASP8 (p18) fragment upon FH535 and Baf double treatment. p43 corresponds to a CASP8 pro-fragment [Citation36]. ACTB was used as a loading control. (D) ANXA5-PI assay performed in control (empty vector) or in CASP8-silenced cells treated with FH535 and Baf for 48 h. (E) ANXA5-PI assay from control U87-MG cells (scr shRNA) or shRNA SQSTM1 cells treated as indicated for 48 h (n.s., non significant). (F) Immunoblots showing reduced CASP8 (top) and SQSTM1 (bottom) protein levels upon expression of specific shRNAs in U87-MG cells. ACTB was used as a loading control.](/cms/asset/4ac20ba7-a920-41da-96c8-f22af77dcdeb/kaup_a_1423439_f0007_b.gif)
Autophagy plays a role in CASP8/caspase8 activation and apoptosis [Citation35,Citation36]. To elucidate whether apoptosis induced by the dual FH535 plus Baf and CQ treatment was mediated by CASP8, cell lysates from single or dual treatments were immunoblotted for CASP8. As expected, a band compatible with a CASP8 cleavage product (p18) was obtained in combined but not in single treatments (C). To further elucidate the involvement of CASP8, U87-MG glioma cells were transduced with lentiviruses carrying a shRNA targeting CASP8. Interestingly, CASP8-silenced cells treated with FH535 and Baf showed a reduction of the percentage of apoptotic cells compared to cells expressing CASP8. These results suggest that, in part, CASP8 mediates the apoptotic cell death caused by the dual treatment with FH535 and Baf (D and S7B).
A role for SQSTM1 in the activation and cleavage of CASP8 in autophagosomes has been previously described [Citation35]. To investigate whether SQSTM1 is required for cell death, we performed ANXA5-PI staining in control and GBM cells depleted of SQSTM1 and treated with the different drugs. As expected, FH535 plus Baf caused apoptosis in control cells. However, importantly, the apoptotic population was absent in SQSTM1-silenced cells, indicating that SQSTM1 is needed for apoptosis induction (E and S7C). Finally, to confirm that both autophagy induction and blockade were needed to induce cell death by the dual treatment, experiments using ATG5-silenced cells were performed. ATG5-depleted cells showed the upregulation of SQSTM1 upon FH535 treatment, as expected (A). However, the cell death induced by the dual treatment (FH535 plus Baf) was inhibited in ATG5-depleted cells (i.e., in the absence of canonical macroautophagy; C). Together, these results indicate that, by upregulating both SQSTM1 and autophagy, FH535 sensitizes GBM cells to autophagy blocker-induced cell death. Furthermore, apoptosis appears mediated by the accumulation of active CASP8 fragments and depends on SQSTM1 and canonical autophagy.
Figure 8. The cell death induced by the dual inhibition of TCF and autophagy is reversed in ATG5-depleted cells. (A) Immunoblot for SQSTM1 from U87-MG cells transduced with control lentiviruses or carrying an shRNA against ATG5, untreated or treated as indicated. SQSTM1 is upregulated by the FH535 treatment both in control and in ATG5-deficient cells. (B) Immunoblot showing reduced ATG5 levels in cells expressing shRNA against ATG5 vs. control cells. ACTB was used as a loading control. (C) ANXA5-PI assay from control U87-MG cells or cells carrying an shRNA against ATG5, untreated or treated with the dual treatment (FH535 + Baf) for 48 h (n.s., non significant). *p<0.05
Silencing TCF4 together with CQ administration reduces tumor growth in vivo
We finally investigated the effect of TCF4-silencing together with CQ treatment in vivo. First, we evaluated the anti-tumoral effects of silencing TCF4 in tumor growth. Control or TCF4-silenced U87-MG cells were xenografted into SCID mice. TCF4-silenced cells formed tumors significantly smaller than control cells, demonstrating the important role of TCF4 in tumor growth (A). MKI67 immunostaining showed decreased numbers of MKI67-positive cells in TCF4-silenced tumors compared to controls (C). Furthermore, SQSTM1 immunostaining presented higher cytoplasmic SQSTM1 immunoreactivity in TCF4-silenced tumors than in controls, confirming in vitro results (C).
Figure 9. Dual inhibition of TCF and autophagy in vivo reduces tumor growth. (A) Representative pictures of mice xenografts formed by control or TCF4-silenced U87-MG cells. Tumors were allowed to grow for 30 d. Upon mouse sacrifice, tumors were collected and prepared for immunostaining. Left, graph of tumor growth over time of mice xenografts formed by U87-MG cells (control or TCF4-silenced). Right, representative images of tumors from each condition. (B) SCID mice were injected with control or TCF-4 silenced U87-MG cells and once tumors were formed, animals were treated daily intraperitoneally with CQ (25 mg/kg) or PBS for 15 d. Left, graph of tumor growth over time. Results are mean ± s.e.m. Right, representative images of tumors. (C) Immunostaining against MKI67 and SQSTM1 from control or TCF4-silenced U87-MG xenografted tumors treated with CQ or vehicle. Bar: 100 µm. *p<0.05, ***p<0.001. (D) Model for the induction of autophagy upon WNT signaling inhibition and GBM cell death by combined targeting of TCF-CTNNB1 and autophagy. Interfering with TCF-CTNNB1 function de-represses SQSTM1, which increases autophagic flux and decreases proliferation. DKK1 also increases autophagy flux, suggesting that autophagy can be regulated from the WNT receptor level. Elevated autophagic flux associates with decreased MTOR activity and nuclear translocation of dephosphorylated TFEB that can transcribe more SQSTM1. WNT-dependent GSK3B inhibition leads to MTOR activation [Citation21]; however, the mechanism by which TCF-CTNNB1 inhibition reduces MTOR activity is unknown (dashed arrow). Increased autophagy resulting from TCF inhibition elicits GBM cell death by autophagy blockers, through a mechanism that requires SQSTM1 and CASP8 cleavage, probably in phagophores. WNT R, WNT receptor.
![Figure 9. Dual inhibition of TCF and autophagy in vivo reduces tumor growth. (A) Representative pictures of mice xenografts formed by control or TCF4-silenced U87-MG cells. Tumors were allowed to grow for 30 d. Upon mouse sacrifice, tumors were collected and prepared for immunostaining. Left, graph of tumor growth over time of mice xenografts formed by U87-MG cells (control or TCF4-silenced). Right, representative images of tumors from each condition. (B) SCID mice were injected with control or TCF-4 silenced U87-MG cells and once tumors were formed, animals were treated daily intraperitoneally with CQ (25 mg/kg) or PBS for 15 d. Left, graph of tumor growth over time. Results are mean ± s.e.m. Right, representative images of tumors. (C) Immunostaining against MKI67 and SQSTM1 from control or TCF4-silenced U87-MG xenografted tumors treated with CQ or vehicle. Bar: 100 µm. *p<0.05, ***p<0.001. (D) Model for the induction of autophagy upon WNT signaling inhibition and GBM cell death by combined targeting of TCF-CTNNB1 and autophagy. Interfering with TCF-CTNNB1 function de-represses SQSTM1, which increases autophagic flux and decreases proliferation. DKK1 also increases autophagy flux, suggesting that autophagy can be regulated from the WNT receptor level. Elevated autophagic flux associates with decreased MTOR activity and nuclear translocation of dephosphorylated TFEB that can transcribe more SQSTM1. WNT-dependent GSK3B inhibition leads to MTOR activation [Citation21]; however, the mechanism by which TCF-CTNNB1 inhibition reduces MTOR activity is unknown (dashed arrow). Increased autophagy resulting from TCF inhibition elicits GBM cell death by autophagy blockers, through a mechanism that requires SQSTM1 and CASP8 cleavage, probably in phagophores. WNT R, WNT receptor.](/cms/asset/9f23cddb-c199-43d1-95d1-7c2ae5209810/kaup_a_1423439_f0009_oc.jpg)
Next, we assessed the synergistic anti-tumoral effects of silencing TCF4 and blocking autophagy by CQ treatment. Once tumors were formed, xenografted SCID mice were injected intraperitoneally either with CQ or vehicle. CQ treatment did not significantly affect growth of control tumors. However, CQ produced synergistic anti-tumoral effects in TCF4-silenced tumors (B), in agreement with our in vitro results. MKI67 immunostaining did not show differences with CQ treatment (C). Immunostaining against SQSTM1 in CQ-treated control tumors showed a marked punctate pattern, indicating autophagosome accumulation. Interestingly, SQSTM1 immunostaining in TCF4-silenced tumors treated with CQ showed strong cytoplasmic and punctate staining (C). Altogether, these results demonstrate that targeting TCF4 and autophagy flux reduces tumor growth, probably through cell death induction mediated by upregulated SQSTM1.
Discussion
Since aberrant activation of WNT-CTNNB1 signaling was linked to cancer, designing small molecules and strategies to target this pathway has been the focus of pharmaceutical and research teams [Citation6,Citation7,Citation37]. FH535 was identified as a TCF-CTNNB1 inhibitor with antiproliferative actions [Citation25]. Here we have addressed whether TCF inhibition could halt GBM progression. Moreover, the repression of SQSTM1 (a key autophagy gene) by TCF-CTNNB1 [Citation18] prompted us to evaluate the consequences of inhibiting TCF in autophagy. Our work shows that inhibiting WNT signaling (either using the pharmacological inhibitor FH535 or by gene silencing of TCF4 and CTNNB1) upregulates SQSTM1 in GBM. A stable mutant of CTNNB1, on the contrary, reduces SQSTM1 expression. Therefore, autophagic flux increases upon TCF-CTNNB1 inhibition because of SQSTM1 upregulation [Citation38]. Furthermore, inhibition of TCF-CTNNB1 signaling associates with decreased MTOR activity and translocates TFEB to the nucleus, further enhancing autophagy. Importantly, enhancing autophagic flux by means of TCF-CTNNB1 inhibition sensitizes GBM cells to autophagy blockers. Thus, dual targeting of TCF and autophagy induces GBM cell death and reduces tumor growth.
SQSTM1 is an essential protein in the autophagic process, acting as a cargo receptor in phagophores. Because SQSTM1 is degraded by autophagy, its levels often inversely relate with autophagic flux [Citation39]. However, multiple pathways regulate SQSTM1 expression [Citation40,Citation41] which hinders the interpretations of SQSTM1 levels. SQSTM1 increases in GBM cell lines, GBM biopsies and patient-derived cell cultures compared to low-grade gliomas. These results suggest that autophagy is higher in GBM than in astrocytoma and normal CNS tissue [Citation42]. Similarly, Gao et al. [Citation17] reported higher SQSTM1 levels in late-stage colon cancer compared to early stages of the disease. In addition, SQSTM1 and DVL correlated, indicating that autophagy negatively regulates WNT signaling through DVL and CTNNB1 clearance [Citation17,Citation18,Citation43]. Our results suggest a similar scenario: high levels of CCND1 are present in GBMs displaying low SQSTM1 and/or BECN1. By de-repressing SQSTM1 using FH535 (which affects the TCF-CTNNB1 interaction) or by silencing either TCF4 or CTNNB1 [Citation44], both SQSTM1 expression and autophagic flux increase. This conclusion is attained by the use of Baf in the analysis of SQSTM1 and MAP1LC3A/B, and by flux experiments with a MAP1LC3A tandem construct. Remarkably, autophagic flux is also enhanced by DKK1, indicating that interfering with WNT canonical receptors positively affects autophagy. Interestingly, DKK3 was identified as a biomarker elevated in supernatants of highly autophagic melanoma cell lines and in patient sera [Citation45]. Together, our results demonstrate that inhibiting WNT signaling triggers autophagy while, conversely, autophagy reduces WNT signaling [Citation17,Citation18]. This crossregulation illustrates a complex involvement of both WNT signaling and autophagy in tumor initiation, progression and recurrence.
We have examined the mechanism involved in autophagy elevation by TCF-CTNNB1 inhibition by analyzing MTOR activation. WNT signaling through GSK3B activates the MTOR pathway to stimulate protein translation [Citation21]. Consequently, inhibition of TCF decreases MTOR signaling, as indicated by different MTOR targets. TFEB has recently emerged as a master regulator of autophagy and lysosomal biogenesis, promoting the expression of SQSTM1 and LAMP1 among other targets [Citation22,Citation23,Citation28,Citation46]. Under starvation, MTOR inactivation triggers TFEB activation (dephosphorylation) and its nuclear translocation [Citation32,Citation47]. Herein, we demonstrate that autophagy induction by FH535 (like that promoted by serum deprivation) involves the dephosphorylation and nuclear translocation of TFEB in GBM cell lines and biopsy-derived cultures. These findings provide mechanistic insights into autophagy upregulation through WNT-CTNNB1 signaling inhibition.
Inhibiting/silencing TCFs reduces GBM cell proliferation and tumor growth, in agreement with the proproliferative role of the WNT-CTNNB1 pathway [Citation33,Citation48]. Tumors formed by TCF4-silenced GBM cells are smaller and display less MKI67-positive cells than those originated by control cells. In addition to the impact on cell proliferation, inhibiting TCF reduces GBM cell migration in a wound-healing assay. GBM patients present poor prognosis, in part due to recurrences that originate from highly invasive cells. Together, our findings suggest that interfering with TCF function using molecules that pass the blood-brain barrier could help in controlling GBM growth and progression. However, they also indicate that targeting WNT signaling alone in GBM could favor pro-survival/adaptative responses that underlie resistance and recurrence.
More important, dual inhibition of TCF and autophagy induces GBM cell death. In agreement with this, autophagy induction by temozolomide sensitizes to GBM cell death by autophagy blockers [Citation49-51]. The phagophore membrane can serve as a platform to mediate CASP8 activation and to initiate the cascade of caspases leading to apoptosis [Citation36]. Here we find that the dual treatment results in CASP8 cleavage. Furthermore, using SQSTM1- or CASP8-silenced cells, we demonstrate that the cell death mechanism involves the cleavage of CASP8, likely located in phagophores, in turn mediated by increased SQSTM1 [Citation35] that results from TCF-CTNNB1 inhibition. Thus, cells depleted of SQSTM1 remain protected from the cell death induced by the combined treatment (TCF inhibitor plus Baf). Moreover, cells depleted of ATG5 are also protected, indicating that both autophagy induction and blockade are required in this process. Furthermore, these experiments rule out a nonautophagic apoptotic function of SQSTM1. In vivo xenograft experiments further illustrate the critical regulation of SQSTM1. Tumors formed by TCF4-silenced cells display strong cytosolic SQSTM1 immunostaining, denoting its upregulation. Tumors formed by TCF4-silenced cells and treated with CQ show dotted SQSTM1 immunostaining, due to the blockade of a robust autophagic flux, and are smaller than their controls.
Collectively, we propose that TCF-CTNNB1 inhibition acts in 2 possible ways to increase SQSTM1 and autophagy flux in GBM: de-repressing SQSTM1 and inhibiting MTOR that leads to TFEB activation (D). According to shRNA experiments, SQSTM1 upregulation appears key to promote GBM cell death by autophagy blockers. Thus, combined inhibition of TCF-CTNNB1 and autophagy could provide novel therapeutic approaches for GBM.
Materials and methods
Reagents and antibodies
Biochemical reagents used were from the following companies: rapamycin (Sigma-Aldrich, R8781), puromycin (Sigma-Aldrich, P7255), CQ (Sigma-Aldrich, C6628), FH535 (Sigma-Aldrich, F5682), WNT3A (Peprotech, 315–20), DKK1 (Peprotech, 120–45) and Baf (Santa Cruz Biotechnology, sc-201550).
Antibodies were used against the following: CTNNB1 (BD Biosciences, 610153), CCND1 (BD Biosciences, DCS-6; 556470), MAPK (BD Biosciences, 610124), SQSTM1 (Novus Biologicals, NBP1-48320), BECN1 (Novus Biologicals, NB110-87318), MAP1LC3A/B (Novus Biologicals, NB100-2331), TFEB (Bethyl Laborathories, A303-673A), p-AKT (Cell Signaling Technology, 9271S), p-MAPK (Cell Signaling Technology, 9107), p-RPS6KB (Cell Signaling Technology, 2055), total RPS6KB (Cell Signaling Technology, 9202), ATF4 (Cell Signaling Technology, D4B8), AKT (Santa Cruz Biotechnology, sc-1618), CASP8 (Calbiochem, AM46), p-EIF4E (Millipore, 07–823), total EIF4E (GeneTex, GTX132092), ACTB (Sigma-Aldrich, A5441) and ATG5 (Sigma-Aldrich, A2859).
Cell culture
Tumor biopsies were obtained from Hospital Universitari Arnau de Vilanova (Lleida, Spain) and processed within 30 min from surgery. All patients signed informed consents prior to biopsy collection and the study was approved by the local Ethics Committee of Human Experimentation. Primary GBM cultures were established as described [Citation13]. Briefly, tissue was washed and digested in phosphate-buffered saline (PBS; 137 mM NaCl, 2.7 mM KCl, 1.47 mM KH2PO4 and 4.3 mM Na2HPO4) containing 155 U/ml of collagenase I (Worthington, LS004194) and 12 mg/ml of DNase-I (Sigma, DN25). The cell suspension was filtered and washed before plating in Dulbecco's Minimal Essential Medium (Lonza, BE12-741F) containing 10% fetal bovine serum (FBS; Gibco, 10270098).
GBM cell lines A172, U251-MG and U87-MG were obtained from CLS Cell Lines Service (300108, 300385 and 300367, respectively). Cells were maintained in Minimal Essential Medium (Lonza, BE12-125F) containing 10% FBS, penicillin/streptomycin (Gibco, 15140-122), L-glutamine (Gibco, 25030-081), 1% amino acids (Gibco, 11140-035) and 1% sodium pyruvate (Gibco, 11360-039) at 37°C and 5% CO2 atmosphere.
Transfection, MAP1LC3B tandem construct and luciferase assay
GBM cells were plated the day before transfection at 80% confluency. For knockdown with siRNA sequences, RNAimax Lipofectamine (Invitrogen, 13778075) was used. Briefly, 25 µl of Optimem (Gibco, 31985-047) containing siRNA (80 nM; Sigma VPDSIRNA2D for CTNNB1 and PDSIRNA2D for GAPDH) were mixed with 25 µl of Optimem plus 1 µl of RNAimax Lipofectamine. The mix was incubated for 15 min at room temperature (RT) and added dropwise to cells for 6 h. Then media was changed for complete media (MEM including FBS). For transfection of tandem fluorescent-tagged MAP1LC3B (ptfLC3), TOP-Flash or WT and S37Y CTNNB1 (kind gifts of Dr A. Garcia de Herreros, UPF-IMIM, Barcelona, Spain) plasmids using Lipofectamine-2000 (Invitrogen, 11668-027), the procedure was as described previously [Citation13].
The ptfLC3 plasmid, a kind gift from Dr. T. Yoshimori (University of Osaka, Japan) is a MAP1LC3B tandem construct that codes for MAP1LC3B tagged with green fluorescent protein (EGFP) and monomeric red fluorescent protein (mRFP) [Citation27]. After 24 h of transfection, cells were treated with 10 µM FH535, 25 µM CQ or 500 nM rapamycin for 24 h. At 48 h (after 24 h of transfection), cells were pictured under an epifluorescence microscope and analyzed for colocalization of green and red puncta. Quantification of red and green puncta was performed using ImageJ software and the pictures obtained from the 2 separate channels (EGFP and mRFP). Therefore, autophagy blockade is visualized by similar numbers of overlapping red and green (i.e., yellow) puncta in the plots. In contrast, autophagy induction involves the predominance of red puncta (reflecting an increase of autolysosomes).
To determine CTNNB1 transcriptional activation status, a luciferase assay was performed following transfection of the TOP-Flash plasmid that carries a synthetic promoter containing 3 copies of the TCF4 binding site upstream of a firefly luciferase reporter gene, as described elsewhere [Citation13].
Western blot
Cells were washed with PBS and lysed in 62.8 mM Tris, pH 6.8, 2% SDS. Cell lysates were resolved in 10–15% SDS-PAGE gels and transferred to a PVDF membrane (Merck-Millipore, IPVH00010). Membranes were blocked with 5% bovine serum albumin (Fisher Scientific, BP9701) or milk and incubated overnight with primary antibodies in Tris Buffer Saline (20 mM Tris, pH 8, 150 mM NaCl) containing 0.05% Tween-20 (Sigma, P1379). Blots were developed using Enhanced Chemiluminiscence (ECL; Thermo Scientific, 32106) or Luminata Forte horseradish peroxidase substrate (Merck-Millipore, WBLUF0100). Band intensities were normalized against ACTB (used as a loading control) using ImageJ software. For TFEB western blot quantification, the intensity of the lower and upper band was measured using ImageJ and the ratio represented. Quantifications were performed from at least 3 independent experiments. For AP (Promega, M282A) treatment, A172 cells were lysed in Igepal buffer (150 mM NaCl, 50 mM Tris, pH 8, 1 mM EDTA, 1 mM EGTA, 1% Igepal [Aldrich, 542334] and Complete protease inhibitors [Roche, 11873580001]). Then, cell lysates (approximately 80 µg/condition) were incubated with or without AP (40 U, 30 min, 37°C) in 50 mM Tris, pH 9.3, 1 mM MgCl2, 0.1 mM ZnCl2, 1 mM spermidine (AP buffer; Promega, M183A). The reaction was stopped with Laemmli's sample buffer.
Immunofluorescence
Cells were cultured on poly-D-lysine (Sigma, P7280) glass coverslips and fixed with 4% paraformaldehyde (Sigma, P1213; 15 min, RT), washed with PBS, blocked and permeabilized in PBS containing 5% FBS, 5% horse serum (Gibco, 26050088), 0.2% glycine, 0.1% Triton X-100 (Sigma, T8787; or 0.3% in the case of TFEB immunostaining) before incubation with primary antibodies. Secondary antibodies were coupled to Alexa Fluor 488 (Life Technologies, A11001 or A11008) or Alexa Fluor 594 (Life Technologies, A21207 or A11005). Hoechst (Sigma, B2261) was included with the secondary antibodies mix to stain nuclei. Coverslips were mounted on Mowiol (Merck, 475904). Micrographs were obtained using an inverted Olympus IX70 microscope (10x, 0.3 NA or 10x, 0.4 NA) equipped with epifluorescence optics and a camera (Olympus OM-4 Ti). Images were acquired using DPM Manager Software. Quantification of nuclear TFEB immunostaining was performed using ImageJ software by scoring the number of cells in which TFEB was colocalizing with Hoechst staining (at least 100 cells were counted for each condition from 3 independent experiments).
shRNA-induced gene silencing by lentiviral infection
Lentiviral-based vectors for RNA interference-mediated gene silencing were pLKO.1-puro (Sigma-Aldrich), containing shRNAs scrambled (against the sequence 5’ CAACAAGATGAAGAGCACCAA 3’), of TCF4 (Mission-RNA; Sigma-Aldrich, TRCN0000015037) and SQSTM1 (Mission-RNA; Sigma-Aldrich, TRCN0000007237), or FSV vector containing a shRNA of CASP8 [Citation52] and ATG5 (against the sequence 5’ CCTTTCATTCAGAAGCTGTTT 3’). Lentiviral particles were produced in HEK293T (human embryonic kidney) cells for 72 h upon transfection of the shRNA vectors together with psPAX2 and pMD2G plasmids (a kind gift of Dr D. Trono, Lausanne, Switzerland) using polyenthyleneimine (Sigma, 408727). Medium was then centrifuged (1000 x g, 5 min) and filtered through a 0.45 µm membrane (Millipore, SLHV033RS). Cells were incubated with medium containing lentiviral particles for 24 h. Then, medium was replaced to allow the knockdown for 4 or more d. pLKO.1-puro vectors contain a puromycin resistance site. Puromycin (4 µg/ml; Sigma, P7225) was added to the media to select for resistant cells and to generate stable target-deficient GBM cell lines and Polybrene (1.75 µg/ml; Sigma, H9268) to enhance viral infection.
Real-time PCR
RNA was isolated using a Nucleospin RNA isolation kit (Macherey-Nagel, 74095550). 1 µg of mRNA was reverse transcribed to cDNA (25°C for 10 min, 42°C for 1 h and 95°C for 5 min) using Superscript II reverse transcriptase (Applied Biosystems, 4308228). cDNA (1 µl) was analyzed by quantitative PCR (qPCR; ABI Prism 7000HT, Applied Biosystems). Assays were based on TaqMan hydrolysis probes labeled with FAM (Applied Biosystems, references are indicated below). Gene-specific probes for SQSTM1 (Hs00177654_m1), TCF4 (Hs01009044_m1) and GAPDH (as control, Hs99999905_m1) were selected from Applied Biosystems. Samples were assayed in triplicate for each gene and relative expression calculated by the ΔΔCT method (Applied Biosystems).
Wound healing assay
GBM cells were plated in 24-well plates and cultured to 100% confluency. A wound was created by scraping the cell monolayer with a 200-µl pipette tip. Cells were then treated as indicated. Cell migration into the wound area was recorded by picturing the wound area at 0 and 24 h in 6 selected microscopy fields for each condition and time point. The distance traveled by cells was calculated by measuring the wound width using ImageJ.
Cell viability assay
Cell viability was measured by the WST-1 (4-[3-(4-iodophenyl)-2-(4-nitrophenyl)-2H-5-tetrazolio]-1,3-benzene disulfonate; Roche, 05015944001) colorimetric assay. Cells were plated on 96-well plates (5000 cells/well), treated for 48 h and then incubated for 60–120 min with 0.5 mg⁄ml WST-1. Absorbance was measured at 440 nm using a reference filter at 620-nm wavelength in a microplate reader (Bio-Rad Laboratories). Viability assays were performed in at least 3 independent experiments, using triplicate measurements per condition.
Clonogenic assays
For clonogenic assays, 500 cells/well were plated in 6-well plates. Cells were incubated for 10 d and stained with MTT (3-(4,5-dimethylthiazol-2-yl)-2,5-diphenyltetrazolium bromide, 0.5 mg/ml; Sigma, M2128). Colony numbers were counted using the Cell Counter ImageJ plugin.
Apoptosis analysis
For nuclear staining, cells were incubated with Hoechst (5 μg/ml, 15 min) and condensed nuclei counted under an epifluorescence microscope. For ANXA5-PI staining, cells were trypsinized, washed in PBS and centrifuged (200 x g, 5 min). Cells were stained (15 min, RT) with ANXA5-FITC or -APC (Immunotools, 31490013 or 31490016) and PI (0.02 mg/ml; Sigma, P4170). The percent of apoptotic cells was evaluated using a FACSCanto II flow cytometer (BD Biosciences). For each condition 20,000 cells were recorded in 3 independent experiments.
Xenografts
Severe Combined Immunodeficient (SCID) mice (12 wk old; 20–25 g; maintained in Specific Pathogen Free conditions in the Animal House of UdL-IRBLleida) were subcutaneously injected with TCF4-deficient or control (scrambled shRNA) U87-MG cells (3 × 10⁶ cells) suspended in 50 µl of PBS. The study was approved by the local Ethics Committee of Animal Experimentation. Tumors were allowed to grow for 30 days. Xenografted mice were treated with intraperitoneal daily injections of CQ (25 mg/kg) or vehicle (PBS; approximately 150 µl) during 2 consecutive wk and tumors measured every 2 d using a caliper. Tumor size was calculated using the formula: tumor weight (mg) = (Dxd2)/2 = mm3.
Immunohistochemistry
Two tissue microarrays (TMAs) were constructed [Citation13] including a total of 74 brain tissue samples: 7 samples of grade II astrocytomas, 10 samples of grade III astrocytomas and 57 samples of GBMs, which were formalin fixed and paraffin embedded. Samples were obtained with support by IRBLleida-Biobank (B.0000682) and Plataforma Biobancos (PT13/0010/0014).
Animal and human paraffin blocks were sectioned and slides prepared for immunohistochemistry. The procedure of deparaffinization, rehydration, epitope retrieval, and staining was performed as described [Citation13]. The primary antibodies used were against SQSTM1 (1:3000 dilution; Novus Biologicals, 48320) and MKI67 (Ready to Use; DAKO, IR626). Immunoexpression was graded semi-quantitatively by considering the percentage and intensity of the staining. A histological score was obtained from each sample, ranging from 0 (no immunoreaction) to 300 (maximum immunoreactivity) [Citation13,Citation53].
Gliovis and statistical analysis
Glioma expression data of the REMBRANDT and TCGA dataset were analyzed through the GlioVis portal (http://gliovis.bioinfo.cnio.es) [Citation24]. All experiments are represented as mean ± s.e.m. Student t test was performed. * indicates p<0.05; ** p<0.01; ***p< 0.001.
Disclosure of potential conflicts of interest
The authors declare no conflict of interests.
Supp_data_1423439.docx
Download MS Word (1.3 MB)Acknowledgements
We thank the Neurosurgery Unit (Hospital Universitari Arnau de Vilanova of Lleida) for collecting GBM biopsies.
Additional information
Funding
Related Research Data
References
- Louis DN, Ohgaki H, Wiestler OD, et al. The 2007 WHO classification of tumours of the central nervous system. Acta Neuropathol. 2007;114(2):97–109. doi:10.1007/s00401-007-0243-4. PMID:17618441
- Nager M, Bhardwaj D, Cantí C, et al. β-Catenin signalling in glioblastoma multiforme and glioma-initiating cells. Chemother Res Pract. 2012;2012:192362. PMID:22400111
- Furnari FB, Fenton T, Bachoo RM, et al. Malignant astrocytic glioma: genetics, biology, and paths to treatment. Genes Dev. 2007;21(21):2683–2710. doi:10.1101/gad.1596707. PMID:17974913
- Kleihues P, Louis DN, Scheithauer BW, et al. The WHO classification of tumors of the nervous system. J Neuropathol Exp Neurol. 2002;61(3):215–225. doi:10.1093/jnen/61.3.215.
- Morokoff A, Ng W, Gogos A, et al. Molecular subtypes, stem cells and heterogeneity: implications for personalised therapy in glioma. J Clin Neurosci. 2015;22(8):1219–1226. doi:10.1016/j.jocn.2015.02.008. PMID:25957782
- Klaus A, Birchmeier W. Wnt signalling and its impact on development and cancer. Nat Rev Cancer. 2008;8:387–398. doi:10.1038/nrc2389. PMID:18432252
- Barker N, Clevers H. Mining the Wnt pathway for cancer therapeutics. Nat Rev Drug Discov. 2006;5(12):997–1014. doi:10.1038/nrd2154. PMID:17139285
- Clevers H, Nusse R. Wnt/β-catenin signaling and disease. Cell. 2012;149(6):1192–1205. doi:10.1016/j.cell.2012.05.012. PMID:22682243
- Kaur N, Chettiar S, Rathod S, et al. Wnt3a mediated activation of Wnt/beta-catenin signaling promotes tumor progression in glioblastoma. Mol Cell Neurosci. 2013;54:44–57. doi:10.1016/j.mcn.2013.01.001. PMID:23337036
- Zhang N, Wei P, Gong A, et al. FoxM1 promotes β-Catenin nuclear localization and controls Wnt target-gene expression and glioma tumorigenesis. Cancer Cell. 2011;20(4):427–442. doi:10.1016/j.ccr.2011.08.016. PMID:22014570
- Zheng H, Ying H, Wiedemeyer R, et al. PLAGL2 regulates Wnt signaling to impede differentiation in neural stem cells and gliomas. Cancer Cell. 2010;17(5):497–509. doi:10.1016/j.ccr.2010.03.020. PMID:20478531
- Pulvirenti T, Van Der Heijden M, Droms LA, et al. Dishevelled 2 signaling promotes self-renewal and tumorigenicity in human gliomas. Cancer Res. 2011;71(23):7280–7290. doi:10.1158/0008-5472.CAN-11-1531. PMID:21990322
- Náger M, Santacana M, Bhardwaj D, et al. Nuclear phosphorylated Y142 β-catenin accumulates in astrocytomas and glioblastomas and regulates cell invasion. Cell Cycle. 2015;14(22):3644–3655. doi:10.1080/15384101.2015.1104443. PMID:26654598
- Kaur J, Debnath J. Autophagy at the crossroads of catabolism and anabolism. Nat Rev Mol Cell Biol. 2015;16(8):461–472. doi:10.1038/nrm4024. PMID:26177004
- Galluzzi L, Pietrocola F, Bravo-San Pedro JM, et al, Autophagy in malignant transformation and cancer progression. EMBO J. 2015;34(7):856–880. doi:10.15252/embj.201490784. PMID:25712477
- Laplante M, Sabatini DM. mTOR signaling at a glance. J Cell Sci. 2009;122(Pt 20):3589–3594. doi:10.1242/jcs.051011. PMID:19812304
- Gao C, Cao W, Bao L, et al. Autophagy negatively regulates Wnt signalling by promoting Dishevelled degradation. Nat Cell Biol. 2010;12(8):781–790. doi:10.1038/ncb2082. PMID:20639871
- Petherick KJ, Williams AC, Lane JD, et al. Autolysosomal β-catenin degradation regulates Wnt-autophagy-p62 crosstalk. EMBO J. 2013;32(13):1903–1916. doi:10.1038/emboj.2013.123. PMID:23736261
- Zhang Y, Wang F, Han L, et al. GABARAPL1 negatively regulates Wnt/β-catenin signaling by mediating Dvl2 degradation through the autophagy pathway. Cell Physiol Biochem. 2011;27(5):503–512. doi:10.1159/000329952. PMID:21691068
- Pankiv S, Clausen TH, Lamark T, et al. p62/SQSTM1 binds directly to Atg8/LC3 to facilitate degradation of ubiquitinated protein aggregates by autophagy. J Biol Chem. 2007;282(33):24131–24145. doi:10.1074/jbc.M702824200. PMID:17580304
- Inoki K, Ouyang H, Zhu T, et al. TSC2 integrates Wnt and energy signals via a coordinated phosphorylation by AMPK and GSK3 to regulate cell growth. Cell. 2006;126(5):955–968. doi:10.1016/j.cell.2006.06.055. PMID:16959574
- Settembre C, Di Malta C, Polito VA, et al. TFEB links autophagy to lysosomal biogenesis. Science. 2011;332(6036):1429–1433. doi:10.1126/science.1204592. PMID:21617040
- Sardiello M, Palmieri M, di Ronza A, et al. A gene network regulating lysosomal biogenesis and function. Science. 2009;325:473–477. PMID:19556463
- Bowman R, Wang Q, Carro A, et al. GlioVis data portal for visualization and analysis of brain tumor expression datasets. Neuro Oncol. 2016;19(1):139–141. doi:10.1093/neuonc/now247. PMID:28031383
- Handeli S, Simon JA. A small-molecule inhibitor of Tcf/β -catenin signaling down-regulates PPARγ and PPARδ activities. Mol Cancer Ther. 2008;7(3):521–529. doi:10.1158/1535-7163.MCT-07-2063. PMID:18347139
- Klionsky DJ, Abdelmohsen K, Abe A, et al. Guidelines for the use and interpretation of assays for monitoring autophagy (3rd edition). Autophagy. 2016;12(1):1–122. doi:10.1080/15548627.2015.1100356. PMID:26799652
- Kimura S, Noda T, Yoshimori T. Dissection of the Autophagosome maturation process by a novel reporter protein, tandem fluorescent tagged LC3. Autophagy. 2007;3(5):452–460. doi:10.4161/auto.4451. PMID:17534139
- Laplante M, Sabatini DM. Regulation of mTORC1 and its impact on gene expression at a glance. J Cell Sci. 2013;126(Pt 8):1713–1719. doi:10.1242/jcs.125773. PMID:23641065
- Saxton RA, Sabatiniti DM. mTOR signaling in growth, metabolism, and disease. Cell. 2017;168(6):960–976. doi:10.1016/j.cell.2017.02.004. PMID:28283069
- Settembre C, Fraldi A, Medina DL, et al. Signals from the lysosome: a control centre for cellular clearance and energy metabolism. Nat Rev Mol Cell Biol. 2013;14(5):283–296. doi:10.1038/nrm3565. PMID:23609508
- Martina JA, Chen Y, Gucek M, et al. MTORC1 functions as a transcriptional regulator of autophagy by preventing nuclear transport of TFEB. Autophagy. 2012;8(6):903–914. doi:10.4161/auto.19653. PMID:22576015
- Roczniak-Ferguson A, Petit CS, Froehlich F, et al. The transcription factor TFEB links mTORC1 signaling to transcriptional control of lysosome homeostasis. Sci Signal. 2012;5(228):ra42. doi:10.1126/scisignal.2002790. PMID:22692423
- Niehrs C, Acebron SP. Mitotic and mitogenic Wnt signalling. EMBO J. 2012;31(12):2705–2713. doi:10.1038/emboj.2012.124. PMID:22617425
- Lamouille S, Xu J, Derynck R. Molecular mechanisms of epithelial–mesenchymal transition. Nat Rev Mol Cell Biol. 2014;15(3):178–196. doi:10.1038/nrm3758. PMID:24556840
- Huang S, Okamoto K, Yu C, et al. P62/sequestosome-1 Up-regulation promotes ABT-263-induced caspase-8 aggregation/activation on the autophagosome. J Biol Chem. 2013;288(47):33654–33666. doi:10.1074/jbc.M113.518134. PMID:24121507
- Young MM, Takahashi Y, Khan O, et al. Autophagosomal membrane serves as platform for intracellular death-inducing signaling complex (iDISC)-mediated caspase-8 activation and apoptosis. J Biol Chem. 2012;287(15):12455–12468. doi:10.1074/jbc.M111.309104. PMID:22362782
- Dihlmann S, Von Knebel Doeberitz M. Wnt/β-catenin-pathway as a molecular target for future anti-cancer therapeutics. Int J Cancer. 2005;113(4):515–524. doi:10.1002/ijc.20609. PMID:15472907
- Bjørkøy G, Lamark T, Brech A, et al. p62/SQSTM1 forms protein aggregates degraded by autophagy and has a protective effect on huntingtin-induced cell death. J Cell Biol. 2005;171(4):603–614. doi:10.1083/jcb.200507002. PMID:16286508
- Jiang P, Mizushima N. LC3- and p62-based biochemical methods for the analysis of autophagy progression in mammalian cells. Methods. 2015;75:13–18. doi:10.1016/j.ymeth.2014.11.021. PMID:25484342
- Puissant A, Fenouille N, Auberger P. When autophagy meets cancer through p62/SQSTM1. Am J Cancer Res. 2012;2(4):397–413. PMID:22860231
- Moscat J, Diaz-Meco MT. p62 at the crossroads of autophagy, apoptosis, and cancer. Cell. 2009;137(6):1001–1004. doi:10.1016/j.cell.2009.05.023. PMID:19524504
- Jennewein L, Ronellenfitsch MW, Antonietti P, et al Diagnostic and clinical relevance of the autophago-lysosomal network in human gliomas. Oncotarget. 2016;7(15):20016–20032. doi:10.18632/oncotarget.7910. PMID:26956048
- Ma B, Liu B, Cao W, et al. The Wnt signaling antagonist dapper1 accelerates dishevelled2 degradation via promoting its ubiquitination and aggregate-induced autophagy. J Biol Chem. 2015;290(19):12346–12354. doi:10.1074/jbc.M115.654590. PMID:25825496
- Chang HW, Lee YS, Nam HY, et al. Knockdown of β-catenin controls both apoptotic and autophagic cell death through LKB1/AMPK signaling in head and neck squamous cell carcinoma cell lines. Cell Signal. 2013;25(4):839–847. doi:10.1016/j.cellsig.2012.12.020. PMID:23280187
- Kraya AA, Piao S, Xu X, et al. Identification of secreted proteins that reflect autophagy dynamics within tumor cells. Autophagy. 2015;11(1):60–74. doi:10.4161/15548627.2014.984273. PMID:25484078
- Napolitano G, Ballabio A. TFEB at a glance. J Cell Sci. 2016;129:2475–2481. doi:10.1242/jcs.146365. PMID:27252382
- Settembre C, Zoncu R, Medina DL, et al. A lysosome-to-nucleus signalling mechanism senses and regulates the lysosome via mTOR and TFEB. EMBO J. 2012;31(5):1095–1108. doi:10.1038/emboj.2012.32. PMID:22343943
- Shi Z, Qian X, Li L, et al. Nuclear translocation of β-catenin is essential for glioma cell survival. J Neuroimm Pharmacol. 2012;7(4):892–903. doi:10.1007/s11481-012-9354-3.
- Lee SW, Kim HK, Lee NH, et al. The synergistic effect of combination temozolomide and chloroquine treatment is dependent on autophagy formation and p53 status in glioma cells. Cancer Lett. 2015;360(2):195–204. doi:10.1016/j.canlet.2015.02.012. PMID:25681668
- Kanzawa T, Germano IM, Komata T, et al. Role of autophagy in temozolomide-induced cytotoxicity for malignant glioma cells. Cell Death Differ. 2004;11(4):448–457. doi:10.1038/sj.cdd.4401359. PMID:14713959
- Golden EB, Cho H-Y, Jahanian A, et al. Chloroquine enhances temozolomide cytotoxicity in malignant gliomas by blocking autophagy. Neurosurg Focus. 2014;37(6):E12. doi:10.3171/2014.9.FOCUS14504. PMID:25434381
- Llobet D, Eritja N, Encinas M, et al. CK2 controls TRAIL and Fas sensitivity by regulating FLIP levels in endometrial carcinoma cells. Oncogene. 2008;27(18):2513–2524. doi:10.1038/sj.onc.1210924. PMID:17982483
- Pallares J, Martínez-Guitarte JL, Dolcet X, et al. Abnormalities in the NF-κB family and related proteins in endometrial carcinoma. J Pathol. 2004;204(5):569–577. doi:10.1002/path.1666. PMID:15481028