
ABSTRACT
Among the 3 GTPases in the DIRAS family, DIRAS3/ARHI is the best characterized. DIRAS3 is an imprinted tumor suppressor gene that encodes a 26-kDa GTPase that shares 60% homology to RAS and RAP. DIRAS3 is downregulated in many tumor types, including ovarian cancer, where re-expression inhibits cancer cell growth, reduces motility, promotes tumor dormancy and induces macroautophagy/autophagy. Previously, we demonstrated that DIRAS3 is required for autophagy in human cells. Diras3 has been lost from the mouse genome during evolutionary re-arrangement, but murine cells can still undergo autophagy. We have tested whether DIRAS1 and DIRAS2, which are homologs found in both human and murine cells, could serve as surrogates to DIRAS3 in the murine genome affecting autophagy and cancer cell growth. Similar to DIRAS3, these 2 GTPases share 40–50% homology to RAS and RAP, but differ from DIRAS3 primarily in the lengths of their N-terminal extensions. We found that DIRAS1 and DIRAS2 are downregulated in ovarian cancer and are associated with decreased disease-free and overall survival. Re-expression of these genes suppressed growth of human and murine ovarian cancer cells by inducing autophagy-mediated cell death. Mechanistically, DIRAS1 and DIRAS2 induce and regulate autophagy by inhibition of the AKT1-MTOR and RAS-MAPK signaling pathways and modulating nuclear localization of the autophagy-related transcription factors FOXO3/FOXO3A and TFEB. Taken together, these data suggest that DIRAS1 and DIRAS2 likely serve as surrogates in the murine genome for DIRAS3, and may function as a backup system to fine-tune autophagy in humans.
| Abbreviations | ||
| AKT1 | = | AKT serine/threonine kinase 1 |
| ATG12 | = | autophagy-related 12 |
| ATG5 | = | autophagy-related 5 |
| ATG7 | = | autophagy-related 7 |
| BECN1 | = | Beclin 1 |
| BNIP3/Nip3 | = | BCL2 interacting protein 3 |
| DIRAS1/RIG | = | DIRAS family GTPase 1 |
| DIRAS2 | = | DIRAS family GTPase 2 |
| DIRAS3/ARHI/NOEY2 | = | DIRAS family GTPase 3 |
| FOXO3/FOXO3A | = | forkhead box O3 |
| GABARAP | = | GABA type A receptor-associated protein |
| LAMP1 | = | lysosomal associated membrane protein 1 |
| MAP1LC3B/LC3B | = | microtubule associated protein 1 light chain 3 beta |
| MTOR | = | mechanistic target of rapamycin kinase |
| PI3K | = | phosphoinositide 3-kinase |
| qRT-PCR | = | quantitative reverse transcription-polymerase chain reaction |
| SQSTM1/p62 | = | sequestosome 1 |
| TFEB | = | transcription factor EB |
| ULK1 | = | unc-51 like autophagy activating kinase 1 |
Introduction
DIRAS3/ARHI (DIRAS family GTPase 3) is a maternally imprinted tumor suppressor gene that is downregulated in the majority of ovarian cancers and in several other tumor types, including breast, lung, prostate, thyroid cancers and glioblastoma [Citation1–4]. Re-expression of DIRAS3 activates programs that inhibit cancer cell growth and motility, induce autophagy and promote tumor dormancy. DIRAS3 is downregulated in ovarian cancer by several different mechanisms including loss of heterozygosity (∼40%), transcriptional downregulation by E2F1 (E2F transcription factor 1) and E2F4 (E2F transcription factor 4), inhibition by microRNAs (∼10%), and hypermethylation of both the paternal and maternal alleles (∼20%) [Citation5–7]. Previous work from our group and others has shown that DIRAS3 is required for autophagy, and its re-expression induces autophagy by 1) inhibiting the AKT1-MTOR signaling pathway, 2) participating directly in the autophagy initiation complex and 3) regulating the nuclear localization of the autophagy-related transcription factor FOXO3 [Citation7–10]. We also found that DIRAS3-induced autophagy can sustain survival of dormant ovarian cancer xenografts, and disruption of autophagy with chloroquine, a functional inhibitor, significantly delays outgrowth of tumors following downregulation of DIRAS3 [Citation8]. These studies provided the first inducible dormancy model, and documented the role of DIRAS3-mediated autophagy in this process.
Whereas DIRAS3 is found in humans, pigs and cows, DIRAS3 has been lost during the evolution of the murine genome, through a telomeric chromosomal re-arrangement that occurred ∼60 million years ago [Citation11]. Despite the absence of DIRAS3, the autophagic process is not impaired in murine cells. Both mice and humans express 2 homologous RAS-related GTPases, DIRAS1 and DIRAS2. These 22-kDa GTPases have 30–40% overall homology with HRAS and 50–60% homology with DIRAS3 where the only major difference from DIRAS3 is the truncation of the N-terminal extension from 34 amino acids to 4 amino acids (Figure S1). DIRAS1 and DIRAS2 have not been studied extensively and only 2 reports have indicated their function in tumor progression [Citation12,Citation13]. Bergom and colleagues described a tumor-suppressive role for DIRAS1 in gliomas and esophageal cancers where its interaction with RAP1GDS1/SmgGDS (Rap1 GTPase-GDP dissociation stimulator 1), antagonizes the guanine nucleotide exchange factor, which specifically activates RHOA (ras homolog family member A) and RHOC (ras homolog family member C) and inhibits its binding to other small oncogenic GTPases [Citation14,Citation15]. To our knowledge, no study has examined the role of DIRAS1 and DIRAS2 in the progression of ovarian cancer and it remains unknown whether or not these GTPases serve as surrogates for DIRAS3 in the murine genome to modulate autophagy. Herein, we address these critical questions and document the ability of DIRAS1 and DIRAS2 to suppress ovarian cancer cell growth through autophagic cell death.
Results
DIRAS1 and DIRAS2 are downregulated in human ovarian cancer associated with decreased overall and disease-free survival
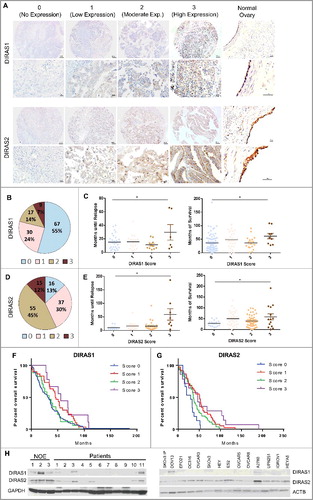
DIRAS1/RIG (DIRAS family GTPase 1) and DIRAS2 (DIRAS family GTPase 2) were expressed in each of 4 specimens of normal human ovarian surface epithelium analyzed immunohistochemically with specific murine monoclonal antibodies. To measure the expression of DIRAS1 and DIRAS2 protein in human ovarian cancers, a tissue microarray was similarly stained. Of the 123 cases, 67 cases did not express DIRAS1 (55%) and 16 cases did not express DIRAS2 (13%). Cases with definite but low expression in the tumor were scored as 1, and those with moderate expression were scored as 2. High expression was scored as 3, and this occurred in 9 cases for DIRAS1 (7%) and 15 cases for DIRAS2 (12%) ( and ). Representative images of staining intensities are provided in . Survival analysis revealed a significantly longer progression-free and overall survival for patients whose tumors had high (score 3) DIRAS1 or DIRAS2 expression compared to those patients whose tumors were deficient in DIRAS1 or DIRAS2 (score 0) ( and ). The median overall survival for those patients who did not have any DIRAS1 expression was 31.4 mo compared to 55.7 mo (P = 0.0399) for those with high (score 3) expression (). Likewise, patients whose tumors had high (score 3) DIRAS2 expression had a median overall survival of 46.7 mo compared to 29.4 mo (P = 0.0334) when no expression could be detected (). Statistical significance was determined by Mantel-Cox Log-rank analysis of overall survival. No other known co-factors, such as patient age, grade of the tumors, specimen collection or stage, which may affect patient survival, were observed between the cohorts (Table S1).
Figure 1. DIRAS family expression is downregulated in ovarian cancers and cancer cell lines. (A) Normal ovaries and tumor tissue microarrays with 122 cases represented were analyzed using immunohistochemistry with anti-DIRAS1 and anti-DIRAS2 antibodies and scored 0 to 3. Examples from the tumor array representing the score 0 (no expression), 1 (low expression), 2 (moderate expression) and 3 (high expression) are shown with 10x magnification, and enlarged 40x magnification insets for each antibody. Bar: 100 µm. (B) The fraction of ovarian cancers with DIRAS family expression. (C) The correlation between disease-free survival and DIRAS family member expression. Each circle represents one patient sample. The median disease-free survival time is listed on top. (D) The fraction of ovarian cancers with DIRAS2 expression. (E) The correlation between disease-free survival and overall survival by staining score of DIRAS1. Each circle represents one patient sample. Asterisk denotes significant difference (*p<0.05 or **p<0.01). (F) Kaplan-Meier overall survival analysis of DIRAS1 expression by staining score. (G) Kaplan-Meier overall survival analysis of DIRAS2 expression by staining score. Statistical significance was determined by Mantel-Cox Log-rank analysis of the overall survival. (H) DIRAS1 and DIRAS2 protein expression levels were determined in normal ovarian epithelial scrapings (NOE), 11 ovarian cancer primary tumors and 14 ovarian cancer cell lines using western blot analysis.
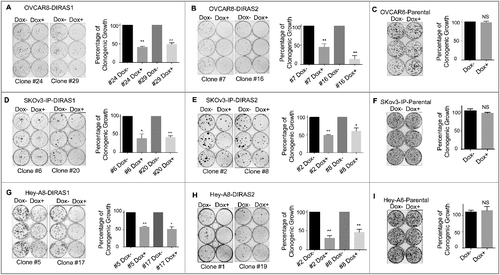
DIRAS family members are downregulated in ovarian cancer cell lines, and re-expression of DIRAS1 and DIRAS2 inhibits ovarian cancer cell growth in vitro
DIRAS1 and DIRAS2 expression were measured by qRT-PCR and western analysis in 13 ovarian cancer cell lines. DIRAS1 mRNA expression was downregulated in 5 cell lines (38%) and DIRAS2 was downregulated in 7 cell lines (54%) (Figure S2). Similarly, DIRAS1 and DIRAS2 protein expression was also decreased in 11 tumor homogenates and across 14 ovarian cancer cell lines compared to normal ovarian epithelial scrapings (). DIRAS3 inhibits ovarian cancer cell growth and viability in both long- and short-term assays [Citation16]. To determine whether DIRAS1 or DIRAS2 also inhibited cancer cell growth and survival, we generated stable sublines of OVCAR8, SKOv3-IP and Hey-A8 ovarian cancer cell lines with Tet-on inducible expression of DIRAS1 and DIRAS2 to test the effect of re-expression on both long-term clonogenic growth ( and Figure S3) and short-term cell viability (Figure S4). Re-expression of both DIRAS1 and DIRAS2 inhibited clonogenic ovarian cancer cell growth. Two independent subclones were used for each inducible subline to assure reproducibility, and parental cell lines were used to control for the effect of doxycycline alone (-). Transient transfection of DIRAS1 and DIRAS2 in SKOv3 and Hey-A8 ovarian cancer cell lines produced similar results (Figure S3). Short-term cell viability was also significantly decreased as determined by sulforhodamine B colorimetric staining (Figure S4).
Figure 2. Re-expression of DIRAS1 or DIRAS2 inhibits ovarian cancer cell growth in vitro. (A and B) Two distinct subclones of OVCAR8-DIRAS1 or OVCAR8-DIRAS2 cells were seeded at 400 cells/well and doxycycline (1 µg/mL) was added to the media every 48 h for 6 d to induce gene expression. Colonies were allowed to grow for 2 wk and then stained with Coomassie Brilliant Blue. Percentage of growth inhibition was determined for 3 independent experiments all performed with triplicate samples. (C) OVCAR8-Praental cells were seeded at 400 cells/well and doxycycline (1 µg/mL) was added to the media every 48 h for 6 d. Colonies were allowed to grow for 2 wk and then stained with Coomassie Brilliant Blue. Percentage of growth inhibition was determined for 3 independent experiments all performed with triplicate samples. (D–I) Similar experiments were carried out in SKOv3-IP-inducible lines and Hey-A8-inducible lines or their parental control cells, seeded at 800 and 600 cells per well, respectively. Asterisk denotes significant difference (*p<0.05 or **p<0.01).
DIRAS-mediated growth inhibition is dependent on functional autophagy, but not apoptosis, cell cycle arrest, or senescence
Because DIRAS3 induces autophagy-mediated cell death in ovarian cancers, we hypothesized that DIRAS1 and DIRAS2 may exert similar effects in ovarian cancers. To test this hypothesis we used the previously described inducible-sublines of ovarian cancer cells and induced DIRAS1 or DIRAS2 expression for 18–48 h with the addition of doxycycline. Upon re-expression of DIRAS1 or DIRAS2 we observed an increase in the autophagic flux as determined by the LC3-II to LC3-I ratio (normalized to ACTB [actin beta]), that could be further enhanced by using chloroquine, a functional inhibitor of autophagy ( and Figure S5A-B). We confirmed these results by immunofluorescent staining for MAP1LC3B (microtubule associated protein 1 light chain 3 beta), which revealed an increased formation of puncta after induction of DIRAS1 or DIRAS2, demonstrating the presence of autophagosomes and represents the accumulation of a membrane-bound form of MAP1LC3B on autophagic vesicles [Citation17,Citation18] (-).
Figure 3. Re-expression of DIRAS family members induces autophagy. OVCAR8-inducible cells were treated with or without doxycycline for 18–48 h with or without the presence of chloroquine (5 µM). (A) Cell lysate was collected and western blot analysis was performed to examine the conversion of LC3-I to LC3-II, SQSTM1/p62 levels, and expression of DIRAS1 or DIRAS2. ACTB/β-actin was used as a loading control. Upon re-expression of DIRAS1 or DIRAS2 we observed decreased SQSTM1 levels and increased conversion to LC3-II, which was further enhanced by the addition of chloroquine. (B and C) Immunofluorescence staining of DIRAS1 or DIRAS2 (green) and LC3B (red) was performed to document the formation of autophagosomes. Scale bar: 10 µm. (D and E) Fluorescence microscopy of OVCAR8-DIRAS1 or OVCAR8-DIRAS2 ovarian cancer cells with or without doxycycline treatment (1 µg/mL), for 18–30 h to induce gene expression, 24 h post infection with GFP-mCherry-LC3B-expressing lentivirus to visualize autophagic flux. Yellow puncta indicate the presence of GFP and mCherry signal. Red puncta indicate the fusion of the autophagosome with the lysosome and quenching of GFP. Scale bar: 10 µm. Average puncta counts were determined for each time point and condition using ImageJ and plotted with GraphPad Prism. Data were collected over 3 independent experiments and more than 50 cells were analyzed per condition. Asterisk denotes significant difference as determined by Student t test (*p<0.05 or **p<0.01). (F) TEM images of induced or noninduced OVCAR8-DIRAS1 or DIRAS2 cells. Red arrows indicate typical double-membrane autophagosomes. Scale bars: 5 µm and 5 nm for close-up image. Data were collected over 3 independent experiments. Asterisk denotes significant difference (*p<0.05 or **p<0.01).
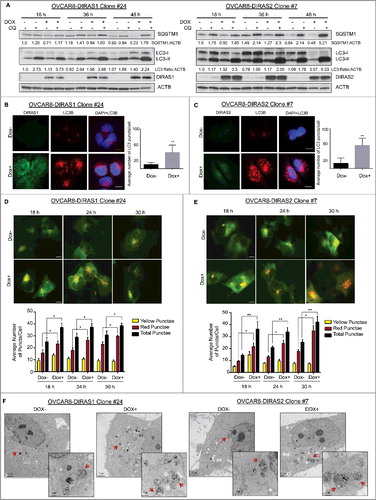
Using a tandem GFP-mCherry-MAP1LC3B lentivirus, we measured the autophagic flux following re-expression of DIRAS1 or DIRAS2 by immunofluorescence of live cells. Due to the low pH of the autolysosome, the green fluorescence from the acid-sensitive GFP is lost upon fusion, however the acid-insensitive mCherry can still be visualized by fluorescence microscopy [Citation19]. Upon re-expression of DIRAS1 or DIRAS2 we saw significant colocalization of GFP and mCherry signals, which was converted over time to mCherry only. We observed an increase in the total number of autophagosomes compared to uninduced OVCAR8 cells and a greater conversion to an mCherry-only signal as time increased consistent with the induction of autophagy by DIRAS1 and DIRAS2 (-). These results were confirmed using confocal microscopy over an 8-h timecouse, and a timelapse video was created to document the conversion from overlapping GFP and mCherry signals to mCherry only (Videos S1-2 and Figure S6). While the basal autophagy was also increased during these experiments, we hypothesize that this may be caused by lentiviral infection with the tandem MAP1LC3B construct, and therefore uninduced (Dox-) samples at each timepoint were used for relative comparison.
Transmission electron microscopy (TEM) performed on OVCAR8-inducible, SKOv3-inducible and HeyA8-inducible cells also detected an increase in autophagosomes containing multiple lamellae, intact cytoplasmic structures and residual digested materials after re-expression of DIRAS1 and DIRAS2 ( and Figure S5C-D). Although basal autophagy and autophagosome formation were observed in the absence of doxycycline, there was a significant increase in both number and size of the autophagosomes once DIRAS1 or DIRAS2 was re-expressed in all 3 cancer cell lines. Similar results were obtained in SKOv3 and Hey-A8 cells that were transiently transfected with DIRAS1 or DIRAS2 (Figure S7).
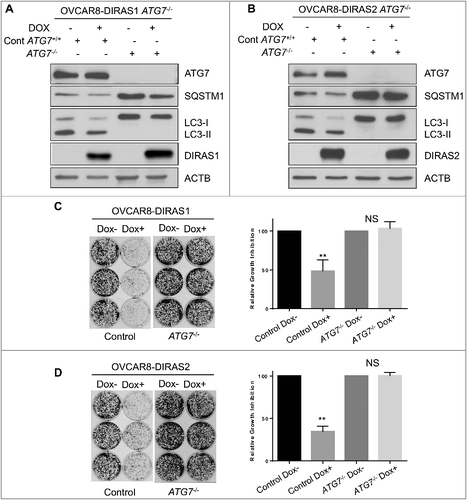
To determine whether DIRAS1- and DIRAS2-induced growth inhibition was dependent upon autophagy, we used the CRISPR/Cas9 gene-editing technique to develop ATG7 (autophagy-related 7) null cells. ATG7 is an E1-like enzyme that is required for the formation of the ATG12–ATG5 complex in addition to the conjugation of phosphatidylethanolamine (PE) to LC3-I. Matched with a double nickase control cell line, re-expression of DIRAS1 or DIRAS2 by doxycycline induction was evaluated in OVCAR8 cells. Next, we tested whether knockdown of ATG7 would inhibit DIRAS1 or DIRAS2-induced autophagy as determined by LC3-II conversion. We found that OVCAR8-inducible cells lacking ATG7 rescued the autophagy-induced phenotype following re-expression of DIRAS1 or DIRAS2 (-). We also noted that the growth inhibition observed following re-expression of DIRAS1 or DIRAS2 was dependent upon functional autophagy, as measured by clonogenic long-term growth assays (-). Similar results were obtained using a second autophagy-deficient model where OVCAR8-inducible cells were generated with knockout of ATG5 (Figure S8). These results suggest that induction of autophagy is a key mechanism by which DIRAS1 and DIRAS2 inhibit ovarian cancer cell growth and survival.
Figure 4. DIRAS1 and DIRAS2 growth inhibition is dependent upon functional autophagy. Using CRISPR/Cas9 double-nickase control plasmid or ATG7 sgRNA, OVCAR8-DIRAS1 and OVCAR8-DIRAS2 inducible cells were generated from single-cell clones. (A and B) Western blot analysis revealed that control cells induced autophagy upon re-expression of DIRAS1 or DIRAS2 whereas ATG7−/− cells did not. Knockout efficiency was observed by western blot analysis of ATG7. (C and D) Clonogenic assays were performed with these sublines, documenting that growth inhibition seen by re-expressing DIRAS1 or DIRAS2 is dependent upon functional autophagy. Experiments were completed in triplicate. Asterisk denotes significant difference (*p<0.05 or **p<0.01).
We next asked whether there were other mechanisms by which DIRAS1 and DIRAS2 might contribute to growth inhibition of ovarian cancer cells. We re-expressed DIRAS1 or DIRAS2 in the inducible ovarian cancer cell lines and measured ANXA5/annexin V-propidium iodide (PI) staining with flow cytometry to determine the percentage of apoptotic cells over 72 h. Neither upregulation of DIRAS1 (Figure S9A) nor of DIRAS2 (Figure S9C) significantly affected levels of apoptosis, but apoptosis was readily induced in the same 3 inducible cell lines by treatment with cisplatin as a positive control. Western blot analysis of cleaved CASP3 (caspase 3) confirmed these results (Figure S9B and S9D). Cell cycle analysis was performed on PI-stained inducible ovarian cancer cells and revealed no significant increase in cell cycle arrest across G1, S, or G2-M after induction of DIRAS1 or DIRAS2 in 3 different cell lines (Figure S10). These results suggest that cell cycle arrest is not the primary mechanism by which DIRAS1 or DIRAS2 inhibit ovarian cancer cell growth.
We then used senescence-associated GLB1 (galactosidase beta 1; SA-GLB1) staining to determine whether the induction of cellular senescence might account for DIRAS-mediated inhibition of ovarian cancer cell growth. Re-expression of DIRAS1 or DIRAS2 did not produce a significant increase in positively stained cells, but treatment with the CDK4 (cyclin dependent kinase 4)-CDK6 (cyclin dependent kinase 6) inhibitor palbociclib did induce senescence, providing a positive control (Figure S11). SA-GLB1 staining was extremely faint in the TP53 null SKOv3 cell line, as would be predicted based on the role of TP53 during activation of this pathway. Collectively, these results suggest that autophagy is essential for DIRAS1- and DIRAS2-induced growth inhibition, but that the process is independent of apoptosis, cell cycle arrest, or senescence.
DIRAS family members induce autophagy by inhibiting the AKT1-MTOR and RAS-MAPK signaling pathways resulting in nuclear localization of autophagy-related transcription factors FOXO3 and TFEB
To determine the mechanism whereby DIRAS1 and DIRAS2 induce autophagy, we first examined the effect of re-expressing DIRAS1 and DIRAS2 on both the phosphoinositide 3-kinase (PI3K) and RAS-MAPK kinase signaling pathways. Re-expression of DIRAS1 and DIRAS2 inhibited S473 AKT1 phosphorylation, S2448 MTOR phosphorylation and S42/44 MAPK1/ERK2 phosphorylation significantly at 24 h (). Normalized protein expression was evaluated over several experiments and representative graphs depict the modest, yet significant decrease in phosphorylated proteins following re-expression of DIRAS1 or DIRAS2 ().
Figure 5. DIRAS1 and DIRAS2 induce autophagy by inhibiting PI3K and regulating the FOXO3 transcription factor. (A) OVCAR8-inducible cells were treated with or without doxycycline for 24 h to induce DIRAS1 or DIRAS2 gene expression. Cell lysate was collected and western blot analysis was performed. Re-expression of DIRAS1 and DIRAS2 resulted in a significant decrease in p-AKT (S473) and p-MAPK/ERK (42/44). p-MTOR (S2488), a downstream target of AKT and key inhibitor of autophagy, was also decreased following re-expression of DIRAS1 or DIRAS2. (B) ImageJ quantification was performed for 3 independent western blot analyses to determine the relative expression of p-AKT, p-MAPK/ERK and p-MTOR following re-expression of DIRAS1 or DIRAS2 (*p<0.05; **p<0.01). (C) Cell lysate was collected and western blot analysis was performed to examine the nuclear localization of FOXO3 or TFEB. PARP and TUBA/α-tubulin were used as nuclear and cytoplasm extraction controls. The numbers below the blots correspond to ImageJ densitometry of the blot. (D) Immunofluorescence staining of FOXO3 and TFEB nuclear localization following re-expression of DIRAS1 or DIRAS2. Scale bars: 20 µm. (E and F) OVCAR8-inducible cell lines were treated with or without doxycycline for 24 h to induce gene expression of DIRAS1 or DIRAS2. mRNA expression of LC3B, ULK1, RAB7, GABARAP, BECN1, and LAMP1 was measured by qRT-PCR. (E) Re-expression of DIRAS1 in OVCAR8 ovarian cancer cells increased mRNA expression of ULK1, RAB7, GABARAP, BECN1 and LAMP1. (F) Re-expression of DIRAS2 in OVCAR8 increases mRNA expression of LC3B, ULK1, RAB7, GABARAP, and BECN1.
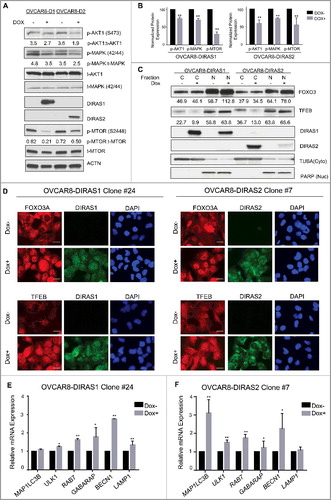
The transcription factor FOXO3/FOXO3A (forkhead box O3), a downstream target of AKT1 and of MAPK, requires phosphorylation to bind YWHA/14-3-3, which promotes its inactivation by driving nuclear export [Citation20]. Inhibition of the PI3K-AKT1 signaling pathway results in increased nuclear accumulation of FOXO3, which increases transcription of MAP1LC3B, GABARAP, ATG5, ATG12, PIK3C3/VPS34, BECN1, BNIP3 and RAB7A [Citation21–24]. Upon starvation, TFEB (transcription factor EB) is dephosphorylated, resulting in nuclear localization and transcription of key autophagy-related genes, including MAP1LC3B, SQSTM1, UVRAG and LAMP1 [Citation25]. Re-expression of DIRAS1 or DIRAS2 increased nuclear localization of these autophagy-related transcription-factors. Increased nuclear localization of FOXO3 and TFEB was observed by western blot analysis () and immunofluorescence staining following re-expression of the DIRAS family members ().
Using qRT-PCR we observed significant transcriptional upregulation of several key autophagy-related genes including: MAP1LC3B, ULK1, RAB7A, GABARAP, BECN1 and LAMP1 (- and Figure S12) at 24 h post re-expression of DIRAS1 or DIRAS2. However, we did not observe a significant increase in transcriptional regulation for RAB11A, ATG4, ATG12 or BNIP3 (data not shown). Knockdown of FOXO3 or TFEB by transient siRNA transfection resulted in decreased autophagy following re-expression of DIRAS1 and DIRAS2 compared to cells transfected with control siRNA, as observed by western blot analysis of SQSTM1/p62 (squestosome 1) and MAP1LC3B (Figure S13A-B). Similarly, we observed that knockdown of FOXO3 or TFEB in OVCAR8-inducible ovarian cancer cell lines inhibited the transcription-mediated upregulation of several key autophagy-related proteins (Figure S13C-D). Interestingly, knockdown of FOXO3 and TFEB had differential effects suggesting that some compensatory mechanisms might facilitate survival following loss of these key autophagy regulators.
Constitutively active AKT1 inhibits DIRAS1- and DIRAS2-induced autophagy
The AKT1-MTOR signaling pathway is a critical regulator of autophagy. To determine the functional interaction of DIRAS1 and DIRAS2 with the AKT1-MTOR signaling pathway, we transfected OVCAR8-inducible cells with either dominant-negative AKT1 (AKT-DN), which contains 3 point mutations—S473A, T308A and K179A—or constitutively active (AKT-CA), which contains 2 point mutations—S473D and T308D. Re-expression of DIRAS1 or DIRAS2 resulted in increased MAP1LC3B puncta as observed by immunofluorescence staining, and this was inhibited in cells transfected with constitutively active AKT1 (Figure S14). Transfection of dominant negative AKT1 had no effect on DIRAS1- or DIRAS2-induced autophagy as determined by MAP1LC3B puncta formation using immunofluorescence (Figure S14), suggesting that autophagy induced by re-expressing the DIRAS family members is, in part, regulated by the PI3K pathway.
DIRAS1 and DIRAS2 inhibit growth and induce autophagy in murine cells
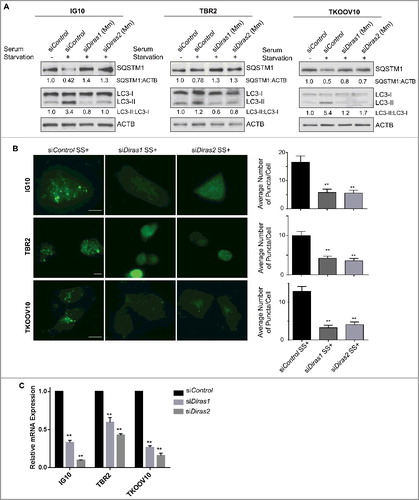
As DIRAS3 has been lost from the murine genome by telomeric chromosomal re-arrangement [Citation11], we hypothesized that DIRAS1 or DIRAS2 may serve as surrogates for DIRAS3, playing an essential role in the induction of autophagy. Murine DIRAS1 and DIRAS2 are 94% and 99%, respectively, homologous to the Homo sapiens proteins, mainly differing at the C terminus (Figure S15). To determine whether they exert an overlapping function, we measured the ability of DIRAS1 and DIRAS2 to inhibit cell growth and to induce autophagy in murine ovarian cancer cells. Transient overexpression of murine DIRAS1 and DIRAS2 resulted in long term growth inhibition in TBR2, ID8, IG10 and TKOOV10 murine ovarian cancer cell lines and NIH3T3 mouse fibroblasts (- and Figure S16). Additionally, transient overexpression of murine DIRAS1 or DIRAS2 resulted in reduction of SQSTM1 and increased conversion of LC3-I to LC3-II, which was further documented by the addition of chloroquine (-). TEM imaging confirmed the induction of autophagy and autophagosome formation (Figure S17). Autophagy induced by serum starvation was inhibited following siRNA knockdown of murine Diras1 and Diras2 as seen by western blot analysis () and immunofluorescent staining of MAP1LC3B puncta (), suggesting an essential role for murine DIRAS1 and DIRAS2 in starvation-induced autophagy. Knockdown efficiency of murine Diras1 and Diras2 was determined by qRT-PCR (). The essential role of DIRAS1 and DIRAS2 to promote autophagy was also observed in human cells where autophagy was induced following re-expression of DIRAS3 (Figure S18).
Figure 6. Transient expression of murine DIRAS1 and DIRAS2 inhibit murine ovarian cancer cell clonogenic growth and induce autophagy. Long-term clonogenic growth was assessed following transient overexpression of murine DIRAS1 and DIRAS2 in ID8 (A), IG10 (B), TBR2 (C) and TKOOV10 (D) murine ovarian cancer cell lines. Selection was performed with G418 for 2 wk until colonies reached at least 50 cells in size. Columns represent the mean and bars represent the S.D. The experiment was performed at least 3 independent times. Asterisk denotes significant difference (**p<0.01). ID8 (A), IG10 (B), TBR2 (C) and TKOOV10 (D) murine ovarian cancer cells were seeded at 0.3 × 10⁶ cells per well and transfected with empty vector, DIRAS1- or DIRAS2-encoding plasmid DNA and treated with or without chloroquine (5 µm) for 24 h prior to lysing and immunoblotting as indicated. Densitometry was measured with ImageJ and experiments were performed at least 3 times. Autophagic flux was determined by the ratio of LC3-II:LC3-I and normalized to the loading control, ACTB/β-actin.
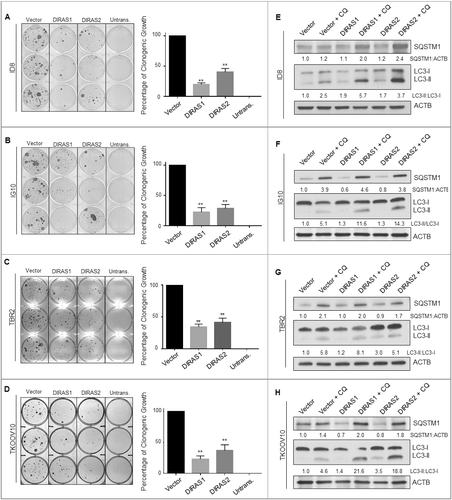
Figure 7. Murine DIRAS1 and DIRAS2 are essential for starvation-induced autophagy. Mouse ovarian cancer cells were transfected with control, murine Diras1 or murine Diras2 siRNA for 72 h prior to autophagy induction by serum starvation for 4–16 h. (A) Western-blot analysis was performed as indicated and documented a decrease in serum starvation-induced autophagic flux following knockdown of DIRAS1 or DIRAS2. (B) Immunofluorescence staining of IG10, TBR2, and TKOOV10 cells for LC3 puncta following autophagy induction by serum starvation for 16 h was performed. Quantification of puncta/cell was calculated for at least 100 cells per experiment, for 3 experiments. Columns indicate the mean and bars represent the S.D. Significance denoted by the asterisk (*p<0.05, **p<0.01). (C) qRT-PCR analysis of murine Diras1 and murine Diras2 mRNA expression following knockdown with siRNA. Columns indicate the mean and bars represent the s.d. Significance denoted by the asterisk (*p<0.05, **p<0.01).
Discussion
Our observations document the role of DIRAS1 and DIRAS2 as tumor suppressors for ovarian cancer and demonstrate, for the first time, their role in autophagy and autophagic cell death. Immunohistochemical analysis documented that DIRAS1 and DIRAS2 downregulation was associated with decreased progression-free and overall survival and that ovarian cancer growth inhibition was mediated by autophagic cell death, but not apoptosis, cell cycle arrest or senescence. Similar to DIRAS3, expression of DIRAS1 and DIRAS2 induced autophagy at several different levels, including the inhibition of both the PI3K-AKT1 and RAS-MAPK signaling pathways and by a transcription-dependent upregulation of autophagy-related genes. Knockdown of DIRAS1 or DIRAS2 prevents starvation-induced autophagy in both human and murine cells. DIRAS1 and DIRAS2 likely serve as surrogates to DIRAS3 in the murine genome, playing an essential role in murine autophagy. These data suggest that the DIRAS family proteins serve as modulators of autophagy, and provide some level of redundancy to maintain this important cellular process.
The significance of dual pathway (PI3K and RAS-MAPK) inhibition by DIRAS1 or DIRAS2 is underlined by the ability of DIRAS1 or DIRAS2 to regulate autophagy by modulating nuclear localization of FOXO3 and TFEB, 2 dominant regulators of autophagy-related transcription. The dual role of these pathways in maintaining cellular homeostasis through autophagy is highlighted by the fact that upregulation of one pathway occurs following knockdown of the other with siRNA (Figure S12). In response to DIRAS1 or DIRAS2 expression, we observed increased transcription of MAP1LC3B, ULK1, RAB7, GABARAP, BECN1 and LAMP1, which was dependent upon FOXO3 and TFEB nuclear localization. Whereas DIRAS3 has been shown to regulate FOXO3-mediated upregulation of ATG4, LC3 and RAB7 [Citation10], we found that DIRAS1 and DIRAS2 increase several additional autophagy-related genes, most notably those involved in lysosomal fusion. This is in line with our experimental results, which document quick progression through autophagy and is highlighted by the large increase in LC3-II following the addition of chloroquine, a lysosomotropic agent that inhibits lysosomal hydrolases and prevents autophagosome-lysosome fusion and degradation. Interestingly, all 3 members of the DIRAS family have multiple LC3-interacting regions [Citation26], but based on our immunofluorescence staining of LC3B and DIRAS1 or DIRAS2, there does not seem to be significant colocalization between the 2 proteins, unlike the colocalization of DIRAS3 with LC3B [Citation8].
Additionally, colocalization with LC3B does not seem to be the only difference between DIRAS1/DIRAS2 and DIRAS3. DIRAS3 has been well characterized as a member of the autophagosome initiation complex [Citation9], where DIRAS3 has been shown to displace BCL2 from BECN1 dimers and then de-dimerize BECN1. Immunoprecipitation of DIRAS1 or DIRAS2 did not show colocalization with BECN1 (data not shown). While the effect of DIRAS1 and DIRAS2 on BECN1 homodimerization remains to be tested, this direct interaction may account for the weaker induction of autophagy as seen following re-expression of DIRAS1 or DIRAS2 compared to DIRAS3, in ovarian cancer cells. As we previously reported that the N terminus of DIRAS3 may be important for the disruption of BECN1-BCL2 interaction [Citation9], the shorter N-termini of DIRAS1 and DIRAS2 lacking the leucine-rich, hydrophobic domain might account for the differences in the mechanisms by which DIRAS1 and DIRAS2 induce autophagy compared to DIRAS3.
Genetically engineered mouse models generated by multiple approaches targeting autophagy-related genes have been used to better understand mammalian development and adult tissue homeostasis. For example, homozygous depletion of Ambra1, Atg5, and Becn1, results in early embryonic lethality, suggesting a key developmental role for autophagy [Citation27–29]. Tsukamoto et. al [Citation27]. used mice expressing GFP-fused LC3, to document the induction of autophagy following fertilization, demonstrating how maternal proteins in oocytes can be degraded permitting expression of the zygote genome [Citation27]. We found that homozygous deletion of murine Diras1 or Diras2 resulted in early embryonic lethality (Figure S19). While these complex phenotypes may not only represent the role of autophagy, but also gene-specific functions, they document the importance of DIRAS1 and DIRAS2 in murine development. As others have previously reported, autophagy is increased following fertilization of the egg resulting in stalled development of preimplantation mouse embryos which are autophagy deficient. Based on these findings, we hypothesize that the role of DIRAS1 and DIRAS2 in murine autophagy might be required for development of embryos from the 2-cell stage and beyond.
Although mutations in key autophagy-related genes are not seen widely across cancers, the role of autophagy to suppress tumorigenesis was discovered through loss of BECN1 in breast, ovary and prostate cancers [Citation30]. In mouse models, homozygous loss of Becn1 results in prenatal lethality, and heterozygous loss of Becn1 results in premature death, reduced autophagy and an increased incidence of lung carcinomas, hepatocellular carcinomas and lymphomas [Citation31]. These data provide evidence that autophagy could serve as a tumor suppressive mechanism. Similarly, many other well-characterized tumor suppressors, such as PTEN, AMPK, STK11/LKB1 and TSC1/2 all negatively regulate the protein kinase MTOR (mechanistic target of rapamycin kinase) and induce autophagy. The overlap in signaling cascades between regulation of autophagy and the control of cancer provide mechanisms by which tumor suppressors and oncogenes can participate in this process, and adds to the complexity of the role of autophagy in oncogenesis. For example, inhibition of autophagy promotes oxidative stress, genomic instability and oncogenesis, whereas, in contrast, autophagy can also protect the cancer cells from hypoxia and nutrient starvation, which can promote resistance to chemotherapy in established tumors [Citation32–34]. In this situation, re-expression of the DIRAS family members may be observed resulting in a dormancy phenotype as previously described with DIRAS3 [Citation9]. It remains unknown whether this occurs through re-expression of the protein in an autophagy-dependent environment (adaptation) or by a more selective process in which a cancer cell lineage acquired enough oncogenic alterations to supersede the tumor suppressive effects of DIRAS3 expression.
Consistent with the role of autophagy as a tumor suppressive mechanism, DIRAS1 and DIRAS2 protein expression was correlated with both increased overall survival and progression-free survival in a cohort of ovarian cancer patients, whereas DIRAS3 downregulation was only associated with decreased progression-free survival. Unlike DIRAS3, DIRAS1 and DIRAS2 are not imprinted genes, so the extent of downregulation may be less frequent where 2 hits are required. Future studies of the mechanisms by which DIRAS1 and DIRAS2 are downregulated are ongoing in our laboratory. Sequence predictions suggest that MIR221 and MIR222 [Citation35–38] would likely recognize all 3 DIRAS family members and therefore we hypothesize that in those cases where DIRAS3 is downregulated by this mechanism, DIRAS1 and DIRAS2 might also be downregulated, thus inhibiting autophagy. Immunohistochemical staining analysis of DIRAS1 and DIRAS2 across normal organs suggest differential expression; however, we noted that all 3 DIRAS family members had relatively strong expression in normal pancreas, breast, kidney and adrenal gland (Figure S20). As DIRAS3 has been shown to be downregulated in multiple tumor types, there may be a potential tumor suppressive role for DIRAS1 and DIRAS2 in other cancers.
This work establishes the role of DIRAS1 and DIRAS2 as tumor suppressors and highlights their importance in the murine genome. DIRAS1, DIRAS2, and DIRAS3, share the ability to inhibit cell proliferation while inducing autophagic cell death in vitro. Mechanistically, DIRAS1 and DIRAS2 induce autophagy by inhibition of the RAS-MAPK and PI3K-AKT-MTOR signaling pathways and inducing transcriptional activation of autophagy-related genes by FOXO3 and TFEB. Murine DIRAS1 and DIRAS2 function critically in murine autophagy, likely serving as surrogates for DIRAS3 in the murine genome.
Materials and methods
Antibodies and reagents
Antibodies against LC3 (2775S), ACTB/β-actin (4910L), p-MAPK/ERK (43705), pAKT-Ser473 (9271S), FOXO3/FOXo3a (12829S), TFEB (4240S), MTOR (2972), p-MTOR (2971), TUBA/α-tubulin (5335S), ATG5 (26305), ATG7 (2631) and ACTN/actinin alpha (6487) were purchased from Cell Signaling Technology. Antibodies against DIRAS1 and DIRAS3/ARHI were generated in our laboratory, and do not show cross reactivity with other members of the DIRAS family. Antibody against DIRAS2 (TA 809398) was purchased from Origene. AKT (sc-514302) and MAPK/ERK (sc-514302) antibodies were purchased from Santa Cruz Biotechnology. Antibodies against PARP (MAB3192) and cleaved-CASP3/caspase3 (04-439) were purchased from Millipore. SQSTM1/p62 antibody was purchased from MBL. siRNAs were purchased from Dharmacon and sgRNAs were purchased from Sage Biologicals. pCMV-DIRAS3 Y2, pCMV-ΔNT DIRAS3, plasmids were constructed in our laboratory. pCMV-DIRAS1 and pCMV-DIRAS2 mouse and human plasmids were purchased from Origene (SC100097, SC317295, MC205282 and MC210705) and sequence verification was performed using Sanger-based techniques at our core facility. ATG5−/− and ATG7−/− CRISPR/Cas9 knockout plasmid was purchased from Santa Cruz Biotechnology (sc-416847, sc-400997) along with the control double nickase (sc-437281). HA-tagged AKT-CA or AKT-DN plasmids (Myr-HA-AKT1-DD or Myr-HA-AKT1[AAA], respectively) were obtained from Dr. Gordon Mills (University of Texas, MD Anderson Cancer Center). Tandem GFP-mCherry-LC3B lentivirus was obtained from the Gene Vector Core facility at Baylor College of Medicine. Cisplatin (Sigma, 1134357) was used, as a positive control, at the concentrations indicated.
Cell lines
Human ovarian cancer cells, SKOv3, Hey, and OVCAR8 were grown in McCoys 5A (Corning, 10-050-CV) and RPMI (Corning, 15-040-CV), respectively, supplemented with 10% fetal bovine serum and 1% L-glutamine. The Tet-on inducible sublines created in our laboratory were grown in their specified medium supplemented with 10% tet-fetal bovie serum, 1% L-glutamine, and 200 ng/mL G418 (Thermo Scientific, 11811031). DIRAS1, DIRAS2 or DIRAS3 expression was induced by adding 1 ng/mL doxycycline (RPI, D43020-100.0) to the culture medium. Mouse ovarian cancer cell lines, 1D8, IG10 and TKOOV10 (provided by Dr. Samuel Mok, University of Texas, MD Anderson Cancer Center) were grown in RPMI medium supplemented with 10% fetal bovine serum and 1% L-glutamine. Mouse ovarian cancer cell line, TBR2 (provided by Dr. Sandra Orsulic, Cedars-Sinai), was maintained in DMEM/F12 medium (Corning, 10-090-CV) supplemented with 10% fetal bovine serum and 1% L-glutamine. Mouse fibroblasts, and NIH3T3 cells were cultured in DMEM supplemented with 10% fetal bovine serum, 1% L-glutamine, and 1% sodium pyruvate.
OVCAR8-inducible ATG5−/− cells and a corresponding double-nickase control were generated by transfecting OVCAR8-DIRAS1 or OVCAR8-DIRAS2 ovarian cancer cells with an ATG5 CRISPR plasmid or a control plasmid for 48 h prior to sorting for GFP-positive cells using a FACSAria II Cell Sorter (Beckton, Dickinson and Company Franklin Lakes, NJ, USA). A pooled population of sorted cells were expanded and then re-sorted to obtain the cells with the greatest GFP signal.
Measurement of mRNA expression
OVCAR8-inducible cells were seeded in a 6-well plate at 1.5 × 10⁵ cells/well, or following reverse transfection of siRNA at 1.0 × 10⁵ cells/well. DIRAS1 or DIRAS2 expression was induced by adding doxycycline to the culture medium for the indicated period of time. RNA was extracted with Trizol (Invitrogen, 15596026) using the manufacturer's protocol, and cDNA was synthesized from 1 µg of RNA using the Superscript II First Strand Synthesis Kit (Invitrogen, 11904-018). RNA pooled from ovarian cancer scrapings and ovarian cancer cell lines were also extracted using Trizol and purified with the RNeasy kit from Qiagen (217004). SYBR green-based quantitative PCR was used to measure RNA levels. Relative expression was calculated by the 2−ΔΔCT method using GAPDH (glyceraldehyde-3-phosphatase dehydrogenase) as the reference gene. The experiments were repeated a minimum of 3 times, and samples were measured in technical duplicate.
Primers included (5’ → 3’):
Immunohistochemical staining
Formalin-fixed, paraffin-embedded ovarian tissue microarrays were de-paraffinized and rehydrated. The slides were steamed in Citrate Buffer (10mM Sodium citrate dihydrate [Sigma, W302600, pH = 6.0) for 10 min to retrieve latent epitopes, followed by sequential blocking steps with PeroxAbolish (Biocare Medical, PXA969L), Avidin and Biotin (Biocare Medical, AB972 H) and 5% bovine serum albumin (BSA;Sigma Aldrich, A7906) in phosphate-buffered saline (PBS; Corning, 46-013-CM). The slides were incubated with a mouse anti-DIRAS1, mouse anti-DIRAS2, and mouse anti-DIRAS3 antibody (reagents previously listed) overnight at 4°C. The slides were washed and stained with a biotin-labeled 4plus anti-mouse secondary antibody (Biocare Medical, GM601H) for 30 min at room temperature before repeated washings. Subsequently 4plus streptavidin horseradish peroxidase (Biocare Medical, HP604) was applied for 10 min at room temperature. The slides were developed using a DAB chromagen kit and then counterstained with hematoxylin. Normal ovarian epithelial cells and OVCAR8-inducible cells were used as positive controls, and mouse IgG as negative controls. Slide analysis was performed independently by 2 investigators and cases in which <20% of the core contained tumor were excluded from the analysis. Tissue microarrays were prepared by the Pathology Core facility of the M.D. Anderson SPORE in Ovarian Cancer. The microarrays contained 148 distinct ovarian cancer specimens of which 122 were epithelial ovarian cancers where immunohistochemical staining could be interpreted. Protocols and informed consents to acquire and develop these arrays were approved by the respective Institutional Review Boards (IRB). Normal organ tissue arrays were purchased from US Biomax, Inc. (FDA999i) and contained 2–6 samples per tissue site, and included 27 different organ samples, which were interpretable upon staining.
Brightfield and fluorescence microscopy
Microscopy was performed using an Olympus IX71 microscope equipped with a DP72 camera and an XM10 camera at the specified magnifications.
Cell proliferation assay
The growth inhibitory effects of the DIRAS family members were determined using clonogenic and sulforhodamine B (SRB) assays. Clonogenic assays were performed using OVCAR8, SKOv3-IP and Hey-A8 inducible cell lines, where 400–800 cells/well were cultured with or without doxycycline for 72 h. Cells were then allowed to grow in a clonogenic fashion for 2 wk, and stained with Coomassie Brilliant Blue (Sigma, B7920), before the colonies were quantified. SRB short-term cell viability assays were performed using OVCAR8, SKOv3-IP and Hey-A8 cells (3-5 × 10³) cultured with or without doxycycline for 72 h. Cells were washed, and fixed with 30% TCA at 4°C, and incubated for 30 min at room temperature with 0.4% SRB (Sigma, S9012) in 1% acetic acid. The plates were read with a microplate-reader (Biotek synergy 2, Tecan) at 510 nm.
Cell cycle analysis
The percentage of cells in different phases of the cell cycle was determined based on relative DNA content as determined by flow cytometric analysis. Inducible cells were treated with doxycycline as indicated for the specific time to induce DIRAS1 or DIRAS2 expression. The cells were then detached by incubating with 0.05% tryspin-EDTA, washed with PBS and counted. Two million cells were fixed in 70% cold ethanol for 30 min. Cells were then pelleted by centrifugation at 168 g for 5 min and washed in PBS 2 times. Cells were resuspended in PBS containing 1 µg/ml PI (Invitrogen, V13242) and RNaseA (Invitrogen, 12091021) and incubated for 20 min at room temperature. Cells were analyzed on a Beckman Coulter Gallios™ flow cytometer. Experiments were conducted in triplicate and repeated at least twice.
Flow cytometry analysis of apoptotic cells
ANXA5-PI staining was used to determine the percentage apoptotic cells following re-expression of DIRAS1 or DIRAS2 as indicated. Cells were washed with PBS and trypsinized before centrifugation at 168 g for 5 min. Cells were resuspended in binding buffer and incubated for 20 min with fluorescein isothiocyanate-conjugated ANXA5/annexin V (Invitrogen, V13242) and PI. Cells were analyzed on a Beckman Coulter Gallios™ flow cytometer. Experiments were conducted in triplicate and repeated more than 3 times.
SA-GLB1 staining
Inducible cells were grown in 6-well plates at an initial density of 15–30,000 cells per well. After 72 h incubation with doxycycline to induce DIRAS1 or DIRAS2 expression, cells were washed with PBS and fixed in 4% paraformaldehyde before staining with X-gal solution according to the manufacturer's instructions (Senescence Cell Histochemical Staining kit; Sigma-Aldrich CS0030). After incubation in the staining solution for 4–16 h at 37°C, GLB1-positive cells with blue precipitate were counted and analyzed using bright field microscopy. Treatment with 5 µM Palbociclib (Selleckchem, PD-0332991), a CDK4-CDK6 inhibitor, was used as a positive control.
Transmission electron microscopy
Cells were seeded at 1.0-2.5 × 10⁵ cells/well in a 6-well plate and re-expression of DIRAS1, DIRAS2, and/or DIRAS3 was induced or transfected for a specified time period. After re-expression, samples were fixed with light Karnovsky's fixative solution (Electron Microscopy Sciences, 15732-10; 1.3 mL 16% paraformaldehyde, 0.5 mL 50% glutaraldehyde EM Grade, 5 mL 0.2 M sodium phosphate buffer, 3 mL H2O) containing 3% glutaraldehyde plus 2% paraformaldehyde in 0.1 M cacodylate buffer, pH 7.3, and stored at 4°C. After fixation, samples were submitted to the MD Anderson electron microscopy core facility for processing (by Mr. Kenneth Dunner Jr.). Briefly, cells were washed in 0.1 M cacodylate buffer and treated with 0.1% Millipore-filtered buffered tannic acid (Electron Microscopy Sciences, 21700)), postfixed with 1% buffered osmium tetroxide for 30 min, and stained with 1% Millipore-filtered uranyl acetate. The samples were washed several times in water then dehydrated in increasing concentrations of ethanol, infiltrated, and embedded in LX-112 medium (Electron Microscopy Sciences). The samples were polymerized in a 60°C oven for 2 days. Ultrathin sections were obtained using a Leica Ultracut microtome (Leica), stained with uranyl acetate and lead citrate in a Leica EM Stainer, and examined in a JEM 1010 transmission electron microscope (JEOL, USA, Inc.) at an accelerating voltage of 80 kV. Digital images were obtained using the AMT Imaging System (Advanced Microscopy Techniques Corp).
Western blotting
Cell lysates were prepared as indicated following incubation in lysis buffer (50 mM HEPES, pH 7.0, 150 mM NaCl, 1.5 mM MgCl2, 1 mM EGTA, 10 mM NaF, 10 mM sodium pyrophosphate, 10% glycerol, 1% Triton X-100 [Sigma, X100-1L]) plus protease and phosphatase inhibitors (1 mM PMSF [78830], 10 µg/mL leupeptin [Sigma, L2884], 10 µg/mL aprotinin [Sigma, A1153], 1 mM Na3VO4). Cells were lysed for 30 min on ice, and then centrifuged at 17,000 × g for 30 min at 4ºC. The protein concentration was assessed using a bicinchoninic acid protein assay (ThermoScientific, 23225). Equal amounts of protein were separated by 8–16% SDS-PAGE, transferred to PVDF membranes and subjected to western blotting using an ECL chemiluminescence reagent (PerkinElmer, NEL105001). Nuclear/cytoplasmic extraction was performed according to the manufacturer's protocol NE-PER (ThermoFisher Scientific, 78833).
siRNA transfection
Cells were transfected with control or DIRAS family siRNAs (single and pooled oligos) using the Transfection #1 or #4 reagent (Dharmacon Research, T-2001-01, T-2004-01). Briefly, a mixture of siRNA (100 nM final concentration) and transfection reagents were incubated for 20 min at room temperature. This mixture was then added to cells and allowed to incubate for 48–72 h before cells were harvested for analysis.
Transient transfection
Transient transfection was performed using MegaTran 1.0 (Origene, TT200005) according to the manufacturer's protocol. For transfection of a 6-well plate, 3 μg of DNA was combined with 9 μL of transfection reagent in 250 μL of OPTIMEM (Gibco, 31985-070) and allowed to incubate at room temperature for 10 min before being added to the cultured cells.
Immunofluorescent staining
Tumor cells (3 × 10⁴) were seeded in chamber slides and treated as specified. Cells were fixed with 4% paraformaldehyde and permeabilized with 0.5% Triton X-100. Cells were washed with PBS, and blocked with 5% BSA-PBS followed by incubation with the primary antibody. After washing, cells were incubated with secondary antibodies conjugated with Alexa Fluor 488 or 594 (Molecular Probes, A11017, A11020, A11070, A11072), mounted and examined using a fluorescence microscope (Olympus IX71 microscope with an XM10 camera).
Live cell imaging of autophagic flux and analysis
5.0 × 10⁴ OVCAR8-inducible cells were seeded in 4-well glass bottom chamber slides (Ibidi, 80427). Twelve h post seeding cells were infected with 10 multiplicity of infection GFP-mCherry-LC3B-encoding lentivirus obtained from the Gene Vector Core facility at Baylor College of Medicine. Doxycycline was added to induce DIRAS1 or DIRAS2 gene expression at the same time. Sixteen h following lentiviral infection, media was removed and cells were washed briefly before being refreshed with new media with or without doxycycline. Cells were then transferred to the MD Anderson imaging core facility and set up for equilibration on the Andor Revolution XDi WD spinning disk confocal microscope. DRAQ5 (1:1000; ThermoFisher, 62251) was added immediately prior to imaging. Confocal images were captured for 10 distinct areas (5 Dox−; 5 Dox+) every 10 min for 8 h. Each experiment was repeated at least 3 independent times and 20 cells were analyzed per condition. Image analysis was performed using Imaris 9.0 Cell and Vesicle tracker (Bitplane) and average puncta/20 cells were plotted over time to determine the relative autophagic flux following re-expression of DIRAS1 or DIRAS2. Due to repetitive imaging, quenching of the fluorescent signals was observed and additional experiments were captured at 18, 24, and 30 h intervals as a way to have direct comparison without repeat exposure of the cells to the laser. Analysis of puncta from these experiments was performed using ImageJ and plotted by Prism (GraphPad). Students t-test was performed to determine statistical significance between groups and two-way Anova and a post-hoc Tukey's analysis was applied to confirm statistical differences among the number of puncta for each condition.
Autophagy modulation
Cells were treated as described and chloroquine (5 µM; Sigma, C6628) was added to inhibit lysosomal degradation for 18–24 h prior to lysing the cells. To induce autophagy cells were rinsed briefly with PBS and the medium was replaced with serum-free medium for 4–16 h.
Generation of knockout mouse models
Validated sgRNA constructs were purchased from SageLabs (St. Louis, MO, USA), and prepared at a desired concentration of 2.5 ng/µL, and Cas9 mRNA at 5 ng/µL to a total volume of 600 µL. Pro-nuclear injection of C57Bl/6N embryos was performed by the MD Anderson Genetically Engineered Mouse facility. All animal procedures were approved by the Institutional Animal Care and Use Committee at the MD Anderson Cancer Center, an AAALAC-accredited institution. Backcrosses were performed 2 times and germline transmission was confirmed by genotyping. Genotyping was performed by dissolving a 1–2 mm tail sample in Allele-in-one tail direct lysis buffer (Allele Biotechnology, ABP-PP-MT01500) at 55°C overnight or until the tail was fully digested. Polymerase chain reaction (PCR) was performed on an optimized amount of direct lysis DNA (approximately 1:50 dilution) using Taq PCR Mastermix (Qiagen, 201443) and the following primers (5’ → 3’):
PCR conditions were as follows: 94°C 5 min (1 cycle), 94°C 45 sec followed by 55°C for 45 sec followed by 72°C for 45 sec (30 cycles), 72°C for 5 min (1 cycle). PCR product was purified with QIAquick PCR Purification kit (Qiagen, 28104) and then sent for Sanger sequencing using the MD Anderson Sequencing Core facility.
Statistical analysis
Data are expressed as mean ± standard deviation, unless otherwise specified. Statistical significance was analyzed using a 2-tailed Student t test. Survival analysis was performed using the Kaplan-Meier method. P-values <0.05 were considered statistically significant and denoted by a single asterisk. P-values <0.01 were denoted by a double asterisk.
Disclosure of potential conflicts of interest
The authors declare no conflict of interest.
Supplemental data
Supplemental data for this article can be accessed at: https://doi.org/10.1080/15548627.2018.1427022
supp_data_1427022.zip
Download Zip (51.9 MB)Acknowledgements
The authors would like to thank members of the Bast laboratory for their discussion and suggestions and Dr. Robert Langley for careful review of the manuscript. This work was supported by the MD Anderson SPORE in Ovarian Cancer NCI P50 CA 83639, the National Cancer Institute R01 CA135354, the Shared Resources of the MD Anderson CCSG grant NCI P30 CA16672, The National Foundation for Cancer Research, the philanthropic support from the Anne and Henry Zarrow Foundation, and generous donations from Stuart and Gaye-Lynn Zarrow and the Roberson endowment. M.N.S. was supported by a pre-doctoral fellowship from the NIH TL1TR000369 and UL1TF000371 and a fellowship in cancer research from the American Legion Auxiliary. G.Y.H. was supported by the TRIUMPH Postdoctoral Fellowship program (CPRIT grant no. RP170067) and the Ann and Sol Schreiber Mentored Investigator Award from the Ovarian Cancer Research Fund Alliance.
Additional information
Funding
Related Research Data
References
- Yu Y, Xu F, Peng H, et al. NOEY2 (ARHI), an imprinted putative tumor suppressor gene in ovarian and breast carcinomas. Proc Natl Acad Sci USA. 1999;96(1):214–219. PubMed PMID: 9874798; PubMed Central PMCID: PMCPMC15119. https://doi.org/10.1073/pnas.96.1.214.
- Luo RZ, Peng H, Xu F, et al. Genomic structure and promoter characterization of an imprinted tumor suppressor gene ARHI. Biochim Biophys Acta. 2001;1519(3):216–222. PubMed PMID: 11418188. https://doi.org/10.1016/S0167-4781(01)00226-3.
- Rosen DG, Wang L, Jain AN, et al. Expression of the tumor suppressor gene ARHI in epithelial ovarian cancer is associated with increased expression of p21WAF1/CIP1 and prolonged progression-free survival. Clin Cancer Res. 2004;10(19):6559–6566. doi:10.1158/1078-0432.CCR-04-0698. PubMed PMID: 15475444. https://doi.org/10.1158/1078-0432.CCR-04-0698.
- Wang L, Hoque A, Luo RZ, et al. Loss of the expression of the tumor suppressor gene ARHI is associated with progression of breast cancer. Clin Cancer Res. 2003;9(10 Pt 1):3660–3666. PubMed PMID: 14506155.
- Lu Z, Luo RZ, Peng H, et al. E2F-HDAC complexes negatively regulate the tumor suppressor gene ARHI in breast cancer. Oncogene. 2006;25(2):230–239. doi:10.1038/sj.onc.1209025. PubMed PMID: 16158053. https://doi.org/10.1038/sj.onc.1209025.
- Lu Z, Luo RZ, Peng H, et al. Transcriptional and posttranscriptional down-regulation of the imprinted tumor suppressor gene ARHI (DRAS3) in ovarian cancer. Clin Cancer Res. 2006;12(8):2404–2413. doi:10.1158/1078-0432.CCR-05-1036. PubMed PMID: 16638845. https://doi.org/10.1158/1078-0432.CCR-05-1036.
- Yu Y, Luo R, Lu Z, et al. Biochemistry and biology of ARHI (DIRAS3), an imprinted tumor suppressor gene whose expression is lost in ovarian and breast cancers. Methods Enzymol. 2006;407:455–468. doi:10.1016/S0076-6879(05)07037-0. PubMed PMID: 16757345. https://doi.org/10.1016/S0076-6879(05)07037-0. PMID:16757345
- Lu Z, Luo RZ, Lu Y, et al. The tumor suppressor gene ARHI regulates autophagy and tumor dormancy in human ovarian cancer cells. J Clin Invest. 2008;118(12):3917–3929. doi:10.1172/JCI35512. PubMed PMID: 19033662; PubMed Central PMCID: PMCPMC2582930.
- Lu Z, Baquero MT, Yang H, et al. DIRAS3 regulates the autophagosome initiation complex in dormant ovarian cancer cells. Autophagy. 2014;10(6):1071–1092. doi:10.4161/auto.28577. PubMed PMID: 24879154; PubMed Central PMCID: PMCPMC4091169. https://doi.org/10.4161/auto.28577.
- Lu Z, Yang H, Sutton MN, et al. ARHI (DIRAS3) induces autophagy in ovarian cancer cells by downregulating the epidermal growth factor receptor, inhibiting PI3K and Ras/MAP signaling and activating the FOXo3a-mediated induction of Rab7. Cell Death Differ. 2014;21(8):1275–1289. doi:10.1038/cdd.2014.48. PubMed PMID: 24769729; PubMed Central PMCID: PMCPMC4085535. https://doi.org/10.1038/cdd.2014.48.
- Fitzgerald J, Bateman JF. Why mice have lost genes for COL21A1, STK17A, GPR145 and AHRI: evidence for gene deletion at evolutionary breakpoints in the rodent lineage. Trends Genet. 2004;20(9):408–412. doi:10.1016/j.tig.2004.07.002. PubMed PMID: 15313548. https://doi.org/10.1016/j.tig.2004.07.002.
- Zhu YH, Fu L, Chen L, et al. Downregulation of the novel tumor suppressor DIRAS1 predicts poor prognosis in esophageal squamous cell carcinoma. Cancer Res. 2013;73(7):2298–2309. doi:10.1158/0008-5472.CAN-12-2663. PubMed PMID: 23436800. https://doi.org/10.1158/0008-5472.CAN-12-2663.
- Ellis CA, Vos MD, Howell H, et al. Rig is a novel Ras-related protein and potential neural tumor suppressor. Proc Natl Acad Sci USA. 2002;99(15):9876–9881. doi:10.1073/pnas.142193799. PubMed PMID: 12107278; PubMed Central PMCID: PMCPMC125049. https://doi.org/10.1073/pnas.142193799.
- Bergom C, Hauser AD, Rymaszewski A, et al. The tumor-suppressive small GTPase DiRas1 binds the noncanonical guanine nucleotide exchange factor SmgGDS and antagonizes SmgGDS interactions with oncogenic small GTPases. J Biol Chem. 2016;291(20):10948. doi:10.1074/jbc.A115.696831. PubMed PMID: 27197236; PubMed Central PMCID: PMCPMC4865938. https://doi.org/10.1074/jbc.A115.696831.
- Bergom C, Hauser AD, Rymaszewski A, et al. The Tumor-suppressive small GTPase DiRas1 binds the noncanonical guanine nucleotide exchange factor SmgGDS and antagonizes SmgGDS interactions with oncogenic small GTPases. J Biol Chem. 2016;291(12):6534–6545. doi:10.1074/jbc.M115.696831. PubMed PMID: 26814130; PubMed Central PMCID: PMCPMC4813585. https://doi.org/10.1074/jbc.M115.696831.
- Luo RZ, Fang X, Marquez R, et al. ARHI is a Ras-related small G-protein with a novel N-terminal extension that inhibits growth of ovarian and breast cancers. Oncogene. 2003;22(19):2897–2909. doi:10.1038/sj.onc.1206380. PubMed PMID: 12771940. https://doi.org/10.1038/sj.onc.1206380.
- Kabeya Y, Mizushima N, Ueno T, et al. LC3, a mammalian homologue of yeast Apg8p, is localized in autophagosome membranes after processing. EMBO J. 2000;19(21):5720–5728. doi:10.1093/emboj/19.21.5720. PubMed PMID: 11060023; PubMed Central PMCID: PMCPMC305793. https://doi.org/10.1093/emboj/19.21.5720.
- Takahashi Y, Coppola D, Matsushita N, et al. Bif-1 interacts with Beclin 1 through UVRAG and regulates autophagy and tumorigenesis. Nat Cell Biol. 2007;9(10):1142–1151. doi:10.1038/ncb1634. PubMed PMID: 17891140; PubMed Central PMCID: PMCPMC2254521. https://doi.org/10.1038/ncb1634.
- Hansen TE, Johansen T. Following autophagy step by step. BMC Biol. 2011;9:39. doi:10.1186/1741-7007-9-39. PubMed PMID: 21635796; PubMed Central PMCID: PMCPMC3107173. https://doi.org/10.1186/1741-7007-9-39.
- Brunet A, Bonni A, Zigmond MJ, et al. Akt promotes cell survival by phosphorylating and inhibiting a Forkhead transcription factor. Cell. 1999;96(6):857–868. PubMed PMID: 10102273. https://doi.org/10.1016/S0092-8674(00)80595-4.
- Vellai T. Autophagy genes and ageing. Cell Death Differ. 2009;16(1):94–102. doi:10.1038/cdd.2008.126. PubMed PMID: 19079287. https://doi.org/10.1038/cdd.2008.126.
- Miranda A, Mickle A, Medda B, et al. Altered mechanosensitive properties of vagal afferent fibers innervating the stomach following gastric surgery in rats. Neuroscience. 2009;162(4):1299–1306. doi:10.1016/j.neuroscience.2009.05.042. PubMed PMID: 19477237; PubMed Central PMCID: PMCPMC2741133. https://doi.org/10.1016/j.neuroscience.2009.05.042.
- Zhou WJ, Deng R, Feng GK, et al. A G-quadruplex ligand SYUIQ-5 induces autophagy by inhibiting the Akt-FOXO3a pathway in nasopharyngeal cancer cells. Ai Zheng. 2009;28(10):1049–1053. PubMed PMID: 19799812.
- Mukherjee S, Ray D, Lekli I, et al. Effects of Longevinex (modified resveratrol) on cardioprotection and its mechanisms of action. Can J Physiol Pharmacol. 2010;88(11):1017–1025. doi:10.1139/y10-082. PubMed PMID: 21076489. https://doi.org/10.1139/Y10-082.
- Settembre C, Ballabio A. TFEB regulates autophagy: an integrated coordination of cellular degradation and recycling processes. Autophagy. 2011;7(11):1379–1381. doi:10.4161/auto.7.11.17166. PubMed PMID: 21785263. https://doi.org/10.4161/auto.7.11.17166.
- Kalvari I, Tsompanis S, Mulakkal NC, et al. iLIR: A web resource for prediction of Atg8-family interacting proteins. Autophagy. 2014;10(5):913–925. doi:10.4161/auto.28260. PubMed PMID: 24589857; PubMed Central PMCID: PMCPMC5119064. https://doi.org/10.4161/auto.28260.
- Tsukamoto S, Kuma A, Murakami M, et al. Autophagy is essential for preimplantation development of mouse embryos. Science. 2008;321(5885):117–120. doi:10.1126/science.1154822. PubMed PMID: 18599786. https://doi.org/10.1126/science.1154822.
- Qu X, Yu J, Bhagat G, et al. Promotion of tumorigenesis by heterozygous disruption of the beclin 1 autophagy gene. J Clin Invest. 2003;112(12):1809–1820. doi:10.1172/JCI20039. PubMed PMID: 14638851; PubMed Central PMCID: PMCPMC297002. https://doi.org/10.1172/JCI20039.
- Fimia GM, Stoykova A, Romagnoli A, et al. Ambra1 regulates autophagy and development of the nervous system. Nature. 2007;447(7148):1121–1125. doi:10.1038/nature05925. PubMed PMID: 17589504.
- Liang XH, Jackson S, Seaman M, et al. Induction of autophagy and inhibition of tumorigenesis by beclin 1. Nature. 1999;402(6762):672–676. doi:10.1038/45257. PubMed PMID: 10604474. https://doi.org/10.1038/45257.
- Yue Z, Jin S, Yang C, et al. Beclin 1, an autophagy gene essential for early embryonic development, is a haploinsufficient tumor suppressor. Proc Natl Acad Sci USA. 2003;100(25):15077–15082. doi:10.1073/pnas.2436255100. PubMed PMID: 14657337; PubMed Central PMCID: PMCPMC299911. https://doi.org/10.1073/pnas.2436255100.
- Avalos Y, Canales J, Bravo-Sagua R, et al. Tumor suppression and promotion by autophagy. Biomed Res Int. 2014;2014:603980. doi:10.1155/2014/603980. PubMed PMID: 25328887; PubMed Central PMCID: PMCPMC4189854. https://doi.org/10.1155/2014/603980. PMID:25328887
- Galluzzi L, Bravo-San Pedro JM, Kroemer G. Autophagy Mediates Tumor Suppression via Cellular Senescence. Trends Cell Biol. 2016;26(1):1–3. doi:10.1016/j.tcb.2015.11.001. PubMed PMID: 26612212. https://doi.org/10.1016/j.tcb.2015.11.001.
- Galluzzi L, Pietrocola F, Bravo-San Pedro JM, et al. Autophagy in malignant transformation and cancer progression. EMBO J. 2015;34(7):856–880. doi:10.15252/embj.201490784. PubMed PMID: 25712477; PubMed Central PMCID: PMCPMC4388596. https://doi.org/10.15252/embj.201490784.
- Zhang S, Lu Z, Unruh AK, et al. Clinically relevant microRNAs in ovarian cancer. Mol Cancer Res. 2015;13(3):393–401. doi:10.1158/1541-7786.MCR-14-0424. PubMed PMID: 25304686; PubMed Central PMCID: PMCPMC4369176. https://doi.org/10.1158/1541-7786.MCR-14-0424.
- Chen Y, Zaman MS, Deng G, et al. MicroRNAs 221/222 and genistein-mediated regulation of ARHI tumor suppressor gene in prostate cancer. Cancer Prev Res (Phila). 2011;4(1):76–86. doi:10.1158/1940-6207.CAPR-10-0167. PubMed PMID: 21071579; PubMed Central PMCID: PMCPMC3894108. https://doi.org/10.1158/1940-6207.CAPR-10-0167.
- Li Y, Liu M, Zhang Y, et al. Effects of ARHI on breast cancer cell biological behavior regulated by microRNA-221. Tumour Biol. 2013;34(6):3545–3554. doi:10.1007/s13277-013-0933-6. PubMed PMID: 23801152. https://doi.org/10.1007/s13277-013-0933-6.
- Lin D, Cui F, Bu Q, et al. The expression and clinical significance of GTP-binding RAS-like 3 (ARHI) and microRNA 221 and 222 in prostate cancer. J Int Med Res. 2011;39(5):1870–1875. PubMed PMID: 22117988. https://doi.org/10.1177/147323001103900530. PMID:22117988.