
ABSTRACT
Previously, macroautophagy/autophagy was demonstrated to be regulated inter alia by the primary cilium. Mutations in RPGRIP1L cause ciliary dysfunctions resulting in severe human diseases summarized as ciliopathies. Recently, we showed that RPGRIP1L deficiency leads to a decreased proteasomal activity at the ciliary base in mice. Importantly, the drug-induced restoration of proteasomal activity does not rescue ciliary length alterations in the absence of RPGRIP1L indicating that RPGRIP1L affects ciliary function also via other mechanisms. Based on this knowledge, we analyzed autophagy in Rpgrip1l-negative mouse embryos. In these embryos, autophagic activity was decreased due to an increased activation of the MTOR complex 1 (MTORC1). Application of the MTORC1 inhibitor rapamycin rescued dysregulated MTORC1, autophagic activity and cilia length but not proteasomal activity in Rpgrip1l-deficient mouse embryonic fibroblasts demonstrating that RPGRIP1L seems to regulate autophagic and proteasomal activity independently from each other.
Abbreviations
| 3D-SIM | = | 3-dimensional-structured illumination microscopy |
| 3-MA | = | 3-methyladenine |
| 18α-GA | = | 18α-glycyrrhetinic acid |
| ABT-737 | = | 4-(4-[{4’-chloro-2-biphenyl}methyl]-1-piperazinyl)-N-[{4-([{2R}-4-{dimethylamino}-1-{phenylsulfanyl}-2-butanyl]amino)-3-nitrophenyl} sulfonyl]benzamide |
| ac | = | acetylated |
| ACT | = | actin |
| AKT1 | = | AKT1, thymoma viral proto-oncogene 1 |
| ATG | = | autophagy related |
| BB | = | basal body |
| BBS4 | = | Bardet-Biedl syndrome 4 |
| CQ | = | chloroquine |
| COPD | = | chronic obstructive pulmonary disease |
| detyr | = | detyrosinated |
| COP9 | = | Constitutive photomorphogenesis 9 |
| CTNNB1 | = | catenin (cadherin associated protein), beta 1 |
| DMEM | = | Dulbecco's modified Eagle's medium |
| DMSO | = | dimethyl sulfoxide |
| EDTA | = | ethylenediaminetetraacetic acid |
| EGFP | = | enhanced green fluorescent protein |
| F-ACT | = | actin, filamentous |
| FOXO3 | = | forkhead box O3 |
| Gapdh | = | glyceraldehyde-3-phosphate dehydrogenase |
| GLI1 | = | GLI-Kruppel family member GLI1 |
| GLI3 | = | GLI-Kruppel family member GLI3 |
| HIF1A | = | hypoxia inducible factor 1, alpha subunit |
| IFT | = | intraflagellar transport |
| MAP1LC3B | = | microtubule-associated protein 1 light chain 3 beta |
| MEF | = | mouse embryonic fibroblast |
| MeOH | = | methanol |
| MTOR | = | mechanistic target of rapamycin (serine/threonine kinase) |
| MTORC | = | MTOR complex NA, numerical aperture |
| OFD1/orofaciodigital syndrom protein 1 | = | OFD1, centriole and centriolar satellite protein |
| PBS | = | phosphate-buffered saline |
| PSMD2 | = | proteasome (prosome, macropain) 26S subunit, non-ATPase, 2 |
| Ptch1 | = | patched 1 |
| PVDF | = | polyvinylidene difluoride |
| RPGRIP1L | = | Rpgrip1-like |
| SAG | = | Smoothened agonist |
| SDS-PAGE | = | sodium dodecyl sulfate-polyacrylamide gel electrophoresis |
| SEM | = | standard error of the mean |
| Ser33/37/Thr41 | = | serine 33/37 threonine 41 |
| Ser2448 | = | serine 2448 |
| Ser473 | = | serine 473 |
| SHH | = | sonic hedgehog |
| SFN | = | sulforaphane |
| Thr308 | = | threonine 308 |
| TRITC | = | tetramethylrhodamine |
| TSC1 | = | tuberous sclerosis 1 |
| TUBG | = | tubulin, gamma |
| TZ | = | transition zone |
| UPS | = | ubiquitin-proteasome system |
| USP14 | = | ubiquitin specific peptidase 14 |
| WNT | = | wingless-type MMTV integration site family |
Introduction
Primary cilia are microtubule-based compartments found on almost every eukaryotic cell. They function as the cell's antenna receiving and transducing signals from the environment and consist in a simplified form of the basal body (BB), the axoneme and the transition zone (TZ). While the BB anchors the cilium in the cell, and the axoneme is a microtubule-based scaffold for the ciliary projection out of the cell's surface, the TZ is in control of ciliary protein import and export. Defects in ciliary protein composition have been linked to severe human pathologies summarized as ciliopathies with symptoms ranging from mental retardation to cystic kidneys and skeletal malformations [Citation1-4]. The wide range of symptoms can be traced back to the dysregulation of cilia-mediated signaling pathways such as the SHH (sonic hedgehog) pathway. These pathways control cellular processes, e.g. proliferation, cell migration, differentiation or apoptosis [Citation5].
In 2013, 2 studies revealed an association between primary cilia and autophagy. Tang et al. showed that clearance of OFD1/orofaciodigital syndrome protein 1 (OFD1, centriole and centriolar satellite protein), a protein located at the BB, is dependent on autophagy [Citation6], while Pampliega et al. demonstrated a functional interaction between cilia and autophagy in which cilia-mediated SHH signaling is able to promote autophagic activity [Citation7]. Furthermore, autophagy is regulated in a negative manner by the MTOR (mechanistic target of rapamycin [serine/threonine kinase]) signaling pathway. This highly conserved pathway is characterized by the serine-threonine kinase MTOR, which forms 2 different complexes, MTORC1/MTOR complex 1 and MTORC2/MTOR complex 2, depending upon its interaction partners. Whereas MTORC1 is the regulating complex for autophagy and protein synthesis, it is suggested that MTORC2 is involved in microtubule organization [Citation8,Citation9]. The activation of the MTOR protein in complex 1 is realized by its phosphorylation at Ser2448 [Citation10,Citation11]. MTORC1 activity can be influenced by several factors: The known main regulator of the MTORC1 is a heterodimeric protein complex consisting of TSC1 (tuberous sclerosis 1) and TSC2. Interaction of these proteins leads to a strong suppression of MTORC1 activity [Citation12]. Another factor that modulates MTORC1 activity is AKT1 (AKT serine/threonine kinase 1). As with MTORC1, AKT1 is a well-known signaling node in vertebrate signal transduction [Citation13]. AKT1 is activated by phosphorylation at Thr308 and subsequently at Ser473 [Citation14-17]. Activated AKT1 modulates MTORC1 signaling in different ways: On the one hand, several studies indicate that AKT1 is able to phosphorylate TSC2 and thereby activate the TSC1/2 complex [Citation18-20]. On the other hand, studies reveal that MTORC1 can be phosphorylated directly at the Ser2448 residue via AKT1 [Citation21]. In its activated form, MTORC1 inhibits autophagy via preventing the formation of autophagosomes, while it increases protein synthesis [Citation22-27].
Rpgrip1l/Ftm/Mks5/Nphp8 (Rpgrip1-like) encodes a protein that is localized at the ciliary transition zone [Citation28] and Rpgrip1l-deficient mouse embryos die, at the latest, around birth displaying a severe ciliopathy phenotype [Citation29,Citation30]. Moreover, mutations in RPGRIP1L are found in patients suffering from deadly ciliopathies like the Meckel-Gruber or Joubert Syndrome [Citation30-32]. Recently, we described that RPGRIP1L regulates proteasomal activity at primary cilia and thereby controls cilia-mediated SHH signaling [Citation28].
In our current study, we report that RPGRIP1L additionally controls autophagy and that RPGRIP1L seems to regulate both predominant protein degradation processes of eukaryotes independently from each other. We demonstrate that RPGRIP1L positively governs autophagic activity via regulating autophagy initiation by controlling MTOR signaling. Moreover, we suggest that RPGRIP1L might govern later steps of autophagy by a yet unknown mechanism. Our data highlight impaired autophagy as one factor that contributes to or even causes deadly ciliopathies and suggest autophagy as a potential therapeutic target for the treatment of ciliopathies. Given that RPGRIP1L regulates both autophagy and proteasomal activity at the ciliary base, a combined treatment of ciliopathies caused by mutations in RPGRIP1L should be taken into consideration.
Results
Recently, we showed that Rpgrip1l-deficient mouse embryos suffer from a decreased proteasomal activity specifically at the base of primary cilia leading to a dysregulation in cellular signaling pathways such as the canonical WNT (wingless-type MMTV integration site family) or SHH pathway [Citation28]. Although treatment with the well-known proteasome activator sulforaphane (SFN) rescues proteasomal activity at the base of Rpgrip1l-negative cilia, ciliary length is not restored indicating that at least one other factor is responsible for the ciliary dysfunction caused by RPGRIP1L deficiency [Citation28]. It is known that autophagy is able to compensate a reduced proteasomal activity [Citation33,Citation34]. However, the strong mutant phenotype of Rpgrip1l-negative mouse embryos suggests that there is no compensation. Consequently, we analyzed autophagic activity in wild-type and Rpgrip1l-deficient mouse embryonic fibroblasts (MEFs) via measuring the quantities of autophagosomes.
MEFs were serum starved for 24 h to induce ciliogenesis and autophagy, and then immunostained for ATG5 (autophagy-related 5) and MAP1LC3B (microtubule-associated protein 1 light chain 3 beta), which represent well-known marker proteins for the quantification of autophagosomes; we determined the amount of autophagosomes by quantifying the ATG5 and MAP1LC3B-positive signals [Citation35]. Both the number of autophagosomes and the autophagosomal ratio (autophagosomal area per cell area) were significantly decreased in Rpgrip1l-negative MEFs (A-Aii and B-Bii). By performing western blot analyses with protein lysates obtained from MEFs after 24-h serum starvation, we demonstrated that RPGRIP1L deficiency results in a decreased amount of MAP1LC3B-II (), which is the form of MAP1LC3B that is recruited to phagophore (the autophagosome precursor) membranes. Because MAP1LC3B-II is not only closely correlated with the number of autophagosomes but is also finally degraded in the autolysosomal lumen, we performed an autophagic flux assay with MEFs which were serum starved for 24 h () [Citation36,Citation37]. In this assay, we inhibited both fusion of autophagosomes with lysosomes and lysosomal protein degradation by using chloroquine (CQ) and measured the amount of MAP1LC3B-II. After incubation in CQ for 6 h, MAP1LC3B-II accumulated in wild-type MEFs but not in rpgrip1l−/− MEFs () implicating a reduced autophagic flux in the absence of RPGRIP1L.
Figure 1. RPGRIP1L deficiency results in a decreased autophagic activity. (A to Aii) Immunofluorescence staining of ATG5 in wild-type and Rpgrip1l-negative MEFs. Cells were visualized by marking F-ACT (Phalloidin 488, green), and cells as well as cell nuclei were visualized by marking TUBG (blue). ATG5-positive autophagosomes were stained in red (n = 3). Scale bar: 5 µm. Either the number of ATG5-positive vesicles (Ai) or the ratio between the area of ATG5-positive vesicles and the total cell area (Aii) were quantified. The amount and the area of ATG5-positive vesicles per cell are significantly reduced. (B to Bii) Immunofluorescence staining on MEFs isolated from wild-type and Rpgrip1l-negative mouse embryos. Cells were visualized by marking F-ACT (Phalloidin 488, green) and cells as well as cell nuclei were visualized by marking TUBG (blue). Autophagosomes were stained by visualizing MAP1LC3B (red) (n = 4). Scale bar: 5 µm. Either the number of MAP1LC3B-positive vesicles (Bi) or the ratio between the area of MAP1LC3B-positive vesicles and the total cell area (Bii) were quantified. The amount and the area of MAP1LC3B-positive vesicles per cell are significantly reduced. (C) Western blot analysis of MAP1LC3B-II in MEFs (n = 3). The amount of MAP1LC3B-II is reduced in Rpgrip1l-negative MEFs. (D) Autophagic flux assay performed on MEFs serum starved for 24 h including 6-h CQ treatment (n = 4). Inhibition of lysosomal fusion via CQ-treatment leads to an accumulation of MAP1LC3B-II in wild-type but not in Rpgrip1l-deficient MEFs. (E) Autophagic flux assay performed on MEFs serum starved and CQ treated for 6 h (n = 8). Inhibition of lysosomal fusion via CQ treatment leads to an accumulation of MAP1LC3B-II in wild-type but not in Rpgrip1l-deficient MEFs. (F) Immunofluorescence-based measurement of OFD1 as an autophagic substrate at the base of wild-type and Rpgrip1l-deficient MEFs. The axoneme was stained with Ac-TUBA (green), the basal body with TUBG (blue) and OFD1 was stained in red (n = 3). Scale bar: 2.5 µm in the overview and 1 µm in the insets. The amount of OFD1 is significantly increased at the base of rpgrip1l−/− MEFs. (G) Immunofluorescence-based quantification of the BBS4 amount at the base of wild-type and rpgrip1l−/− MEFs (n = 6). The axoneme was marked with Ac-TUBA (green), the basal body with TUBG (blue), and BBS4 was stained in red. Scale bar: 1 µm. The amount of BBS4 found at the base of Rpgrip1l-deficient cilia is significantly decreased. (A to G) Asterisks indicate statistically significant differences. p.d.u., procedure defined unit.
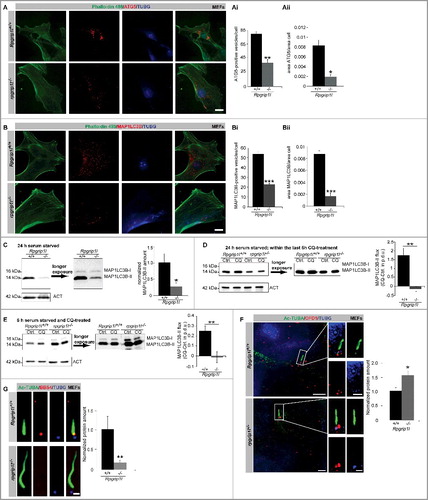
To evaluate whether the effect of RPGRIP1L on autophagy is cilia-dependent, we performed another autophagic flux assay with MEFs that were serum starved for only 6 h. After serum starvation for 6 h, 10.4% of the wild-type MEFs possessed cilia (Figure S1A). After serum starvation for 24 h, 72.1% of the wild-type MEFs displayed cilia. None of the Rpgrip1l-deficient MEFs showed cilia after serum starvation for 6 h, while 15.9% of the rpgrip1l−/− MEFs carried cilia after serum starvation for 24 h (Figure S1A). Similar to the autophagic flux assay performed with MEFs that underwent serum starvation for 24 h, the autophagic flux was reduced in MEFs that were serum starved for 6 h (). Consequently, the presence or absence of cilia does not seem to be the decisive event that leads to the reduced autophagic flux in rpgrip1l−/− MEFs. It might be rather the difference in the number of cilia between wild-type and Rpgrip1l-deficient MEFs under both conditions (6 h and 24 h serum starvation), respectively.
Remarkably, the MAP1LC3B-II amount of Rpgrip1l-negative MEFs in comparison to that of wild-type MEFs without CQ treatment was different after serum starvation for 6 h compared with that for 24 h. After serum starvation for 24 h, the amount of MAP1LC3B-II was decreased in rpgrip1l−/− MEFs (). After serum starvation for 6 h, the amount was increased in rpgrip1l−/− MEFs ( and Figure S1B). Because the autophagic flux was reduced in the absence of RPGRIP1L after serum starvation for 6 h and 24 h, this result was surprising. In order to validate this finding, we performed immunofluorescence studies in MEFs that were serum starved for 6 h by immunostaining of MAP1LC3B-II. In these MEFs, the autophagosomal ratio was increased (Figure S1C) verifying the data of the western blot studies. Interestingly, the MAP1LC3B signals were mainly localized in the nuclei of wild-type and Rpgrip1l-deficient MEFs that were serum starved for 6 h (Figure S1C), whereas these signals were predominantly found in the cytoplasm in wild-type and Rpgrip1l-negative MEFs which were exposed to serum starvation for 24 h ().
To assess what kind of MAP1LC3B situation occurs in vivo, we used cryosections of wild-type and Rpgrip1l-deficient limb buds as a well-established in vivo model for analyzing functional mechanisms in terms of cilia research[Citation28,Citation38-41]. The quantification of MAP1LC3B-positive signals in Rpgrip1l-negative limb bud cells revealed a significant reduction of autophagosomes by about half (Figure S2A-Aii) confirming the cell culture data obtained from experiments with MEFs that underwent serum starvation for 24 h. Because the situation in which a high number of cilia is present seems to be more natural than a situation in which only a few cilia are existing, we used MEFs that were serum starved for 24 h in all following experiments.
Previously, it was reported that the ciliary protein OFD1 (OFD1, centriole and centriolar satellite protein) is cleared from the basal body via autophagy making it an autophagic substrate [Citation6]. To test whether autophagic activity is decreased in the abscence of RPGRIP1L, we quantified fluorescence intensities of OFD1 directly at the base of primary cilia in wild-type and Rpgrip1l-deficient MEFs as well as limb bud cells. OFD1 accumulated at the ciliary base of cells that lack RPGRIP1L ( and S2B). Another protein influenced by autophagy is BBS4 (Bardet-Biedl syndrome 4). The ciliary recruitment of BBS4 is dependent on autophagy [Citation6]. In rpgrip1l−/− MEFs and limb bud cells, the amount of BBS4 at the ciliary base is reduced, thereby arguing for a decreased autophagy-mediated ciliary localization of this protein ( and Figure S2C). All these data demonstrate that RPGRIP1L deficiency impairs autophagy. Combining these data with those from our previous study, we conclude that RPGRIP1L positively controls proteasomal activity at the ciliary base and autophagic activity [Citation28].
Former studies revealed that autophagy is negatively regulated by MTORC1 signaling [Citation42]. Remarkably, cells that lack the ciliary protein IFT88 (intraflagellar transport 88) and do not form cilia have a higher activity of MTORC1 and a higher protein synthesis [Citation43]. In search of how RPGRIP1L controls autophagy, we analyzed the amount of phosphorylated and thereby activated MTORC1. Indicative for its activity is the phosphorylation at Ser2448[Citation10,Citation11]. The amount of phospho-(Ser2448)-MTOR was increased in Rpgrip1l-deficient MEFs () indicating that RPGRIP1L deficiency affects MTOR activation and thereby MTOR signaling. In this context, we investigated other downstream effects of MTORC1 signaling. In addition to the negative regulation of autophagy, MTORC1 stimulates protein synthesis [Citation44-47]. In this context, a former report revealed that autophagy regulates the volume of kidney cells [Citation43]. Previously, it was shown that the size of a cell correlates with its protein synthesis. The bigger the cell, the more proteins are produced in this cell [Citation48]. In Rpgrip1l-deficient limb buds, cells are larger than those of their wild-type littermates (). Based on these cell size quantifications, we conclude that protein synthesis is increased by RPGRIP1L deficiency reflecting the situation of elevated MTORC1 signaling.
Figure 2. RPGRIP1L deficiency leads to upregulated MTORC1 signaling. (A) Western blot studies for phospho-(Ser2448)-MTOR in MEFs (n = 3). The amount of phospho-(Ser2448)-MTOR is increased in total cell lysates of Rpgrip1l-negative MEFs. Nonphosphorylated MTOR was used for normalization, while ACT served as a loading control. (B) Immunofluorescence-based measurement of cell size of wild-type and rpgrip1l−/− limb bud cells. The cells were visualized with TRITC-Phalloidin marking F-ACT to monitor the cell size (in both cases: n = 4). For better visualization the same cells were depicted without and with cell size indication (yellow dotted lines). The cell size of rpgrip1l−/− limb bud cells is significantly increased. (C) Semiquantitative PCR analysis for Hif1a, a target of MTORC1 signaling (n = 3). The expression of Hif1a is almost doubled in Rpgrip1l-deficient MEFs. For better visualization of the DNA bands, the gel electrophoresis photo was color inverted. (D) Immunofluorescence-based measurement of the OFD1 amount at the base of wild-type and Rpgrip1l-negative MEFs treated with either DMSO (control) or rapamycin. The axoneme was stained with Ac-TUBA (green), the basal body with TUBG (blue), and OFD1 was stained in red (n = 4). Scale bar: 1 µm. Rapamycin treatment resulted in a significant reduction of the OFD1 amount at the ciliary base in both genotypes. (A to D) Asterisks indicate statistically significant differences. (D) The most important significant differences are written in bold.
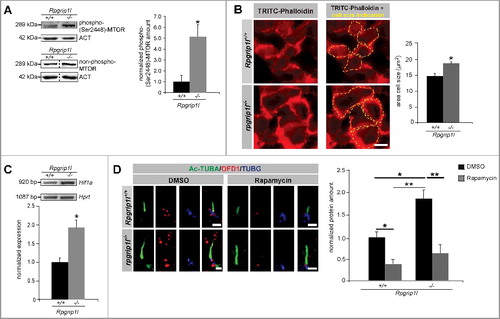
Another downstream target of MTORC1 signaling is HIF1A (hypoxia inducible factor 1 alpha subunit), which is positively regulated by MTORC1 [Citation49]. In Rpgrip1l-negative MEFs, the expression of Hif1a was elevated (). Taken together, these data let us assume that RPGRIP1L regulates autophagic activity via MTORC1. To demonstrate whether RPGRIP1L controls autophagy indeed by regulating MTOR signaling, we used rapamycin. The macrolide rapamycin is a well-known inhibitor of MTORC1 [Citation50-56]. It was shown that rapamycin is specifically suppressing MTORC1, while MTORC2 is relatively unaffected[Citation8,Citation9]. Treatment of Rpgrip1l-negative MEFs with rapamycin was performed to test if a downregulation of MTOR signaling results in an elevation of autophagic activity. This treatment resulted in a reduction of the OFD1 amount at the ciliary base in Rpgrip1l-deficient MEFs () implying a rescue of autophagic activity caused by rapamycin treatment. Consequently, RPGRIP1L regulates autophagy by governing MTOR signaling.
To examine how RPGRIP1L affects MTORC1, we focused on the events that lie upstream of MTORC1 action. To analyze a possible effect of RPGRIP1L on the TSC1/2 complex, we quantified the amount of TSC1 and phosphorylated TSC2. The amount of both TSC proteins was unaltered in Rpgrip1l-deficient MEFs ( and B). Moreover, we investigated the amount of phospho-(Ser473)-AKT1 and found it to be elevated in whole cell lysates upon RPGRIP1L deficiency (). Former studies reported the presence of AKT1 and activated (phosphorylated at Ser473) AKT1 at cilia. In 3T3-L1 preadipocytes, AKT1 is present in the entire cilium [Citation57]. After phosphorylation of AKT1 at Ser473, the localization changes and phospho-(Ser473)-AKT1 is detected at the basal body[Citation57,Citation58]. In immortalized fibroblasts (NIH3T3 cells), phospho-(Ser473)-AKT1 localizes at the ciliary base [Citation59]. Because we obtained all in vitro data of this study in MEFs, the localization of phospho-(Ser473)-AKT1 was checked in these cells. By using super-resolution microscopy, we detected phospho-(Ser473)-AKT1 spread over the entire cilia of wild-type MEFs (). Next, we quantified the amount of phospho-(Ser473)-AKT1 at cilia of Rpgrip1l-negative MEFs. In the absence of RPGRIP1L, phospho-(Ser473)-AKT1 was significantly elevated (). Interestingly, we found the active form of MTOR, phospho-(Ser2448)-MTOR, at the base of primary cilia in wild-type MEFs () making it likely that phospho-(Ser473)-AKT1 phosphorylates MTOR at primary cilia. In line with this assumption, RPGRIP1L deficiency resulted in an increased amount of phospho-(Ser2448)-MTOR at the ciliary base (). In summary, we propose that RPGRIP1L regulates autophagic activity by governing the amount of phospho-(Ser473)-AKT1 at the primary cilium.
Figure 3. RPGRIP1L deficiency regulates autophagy not by governing SHH signaling but by controlling AKT1 signaling. (A) Western blot studies for TSC1 (n = 3). The amount of TSC1 is unchanged in Rpgrip1l-deficient MEFs compared to their wild-type littermates. ACT served as a loading control. (B) Western blot studies for phospho-(Ser939)-TSC2. Nonphosphorylated TSC2 was used for normalization, while ACT served as a loading control (n = 3). The amount of phospho-(Ser939)-TSC2 is unaltered comparing wild-type and Rpgrip1l-deficient MEFs. Non-phosphorylated TSC2 was used for normalization, and ACT serves as a loading control. (C) Western blot studies for phospho-(Ser473)-AKT1. Non-phosphorylated AKT1 was used for normalization, while ACT served as a loading control (n = 3). The amount of phospho-(Ser473)-AKT1 is significantly elevated in rpgrip1l−/− MEFs. (D) Immunofluorescence studies in wild-type MEFs. Pictures were obtained using 3D-SIM. The ciliary axoneme was stained with Ac-TUBA (green), the basal body with TUBG (blue). Phospho-(Ser473)-AKT1 was stained in red and is located at the primary cilium of wild-type MEFs. Scale bar: 1 µm. (E) Immunofluorescence-based quantification of phospho-(Ser473)-AKT1 at wild-type and Rpgrip1l-deficient cilia in MEFs. The axoneme was stained with Ac-TUBA (green), the basal body with TUBG (blue) and phospho-(Ser473)-AKT1 was stained in red (n = 3). Scale bar: 1 µm. The amount of phospho-(Ser473)-AKT1 is significantly increased at the cilia of rpgrip1l−/− MEFs. (F) Immunofluorescence studies in wild-type MEFs. Pictures were obtained using 3D-SIM. The ciliary axoneme was stained with Ac-TUBA (green), the basal body with TUBG (blue). Phospho-(Ser2448)-MTOR was stained in red and is located at the base of primary cilia of wild-type MEFs. Scale bar: 1 µm. (G) Immunofluorescence-based measurement of phospho-(Ser2448)-MTOR at wild-type and Rpgrip1l-deficient cilia in MEFs. The axoneme was stained with Ac-TUBA (green), the basal body with TUBG (blue) and phospho-(Ser2448)-MTOR was stained in red (n = 3). Scale bar: 1 µm. The amount of phospho-(Ser2448)-MTOR is significantly increased at the base of rpgrip1l−/− MEFs. (H) Quantitative real-time reverse transcriptase-PCR studies for Ptch1 in SAG-treated Rpgrip1l-deficient MEFs compared with SAG-treated wild-type MEFs (n = 3). The relative induction of Ptch1 in Rpgrip1l-deficient MEFs is reduced about 60%. (I) Immunofluorescence studies on wild-type and Rpgrip1l-deficient MEFs after GLI1 overexpression. The cells were visualized by marking F-ACT (Phalloidin 405, blue), ATG5 was stained in red (n = 3). In the single channel images the F-ACT staining is shown in white to provide a high contrast between the black background and the outline of the cells which are marked by the F-ACT staining. Scale bar: 5 µm. The amount of ATG5 is increased after transfection with a plasmid expressing GLI1 in wild-type MEFs, while the amount of ATG5 remains unaltered after GLI1 overexpression in Rpgrip1l-deficient MEFs. (J) BBS4 staining of wild-type and Rpgrip1l-deficient MEFs after transfection with a plasmid expressing GLI1. Cilia were marked with Ac-TUBA (red), BBS4 was stained in blue (n = 3). Scale bar: 1 µm. The amount of BBS4 is increased after GLI1 overexpression in wild-type MEFs, while the amount of BBS4 remains unaltered after GLI1 transfection in Rpgrip1l-deficient MEFs. (C to J) Asterisks indicate statistically significant differences. (I and J) The most important significant differences are written in bold.
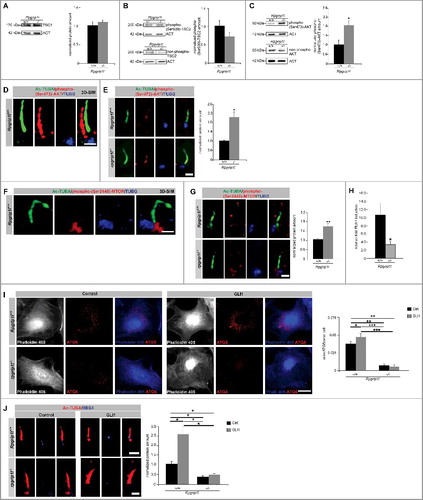
In a previous study, Pampliega et al. monitored autophagic flux in ift20−/−/intraflagellar transport 20−/− and ift88−/− MEFs and found it to be decreased [Citation7]. Interestingly, this decreased autophagic flux could not be elevated via application of rapamycin. The authors showed that deficiency of the ciliary proteins IFT20 and IFT88 results in an abnormal SHH signaling, which in turn leads to a dysregulation in autophagy and can be compensated via overexpression of GLI1 [Citation7]. In our case, rapamycin is able to compensate for the decreased autophagic activity in Rpgrip1l-negative MEFs (). In former reports, we demonstrated a downregulation of SHH signaling in embryonic limbs [Citation29], neural tubes [Citation29] and embryonic hearts [Citation60]. In our current study, we revealed a decreased expression of the SHH target gene Ptch1 (patched 1) in SAG (Smoothened agonist)-treated rpgrip1l−/− MEFs (). Consequently, the question arises whether RPGRIP1L regulates autophagic activity exclusively via governing MTOR signaling or whether this regulation is additionally realized by controlling SHH signaling. To address this issue, we overexpressed GLI1 (Figure S2D) and quantified the number of autophagosomes by marking ATG5 in whole cells as well as the amount of BBS4 at the ciliary base of wild-type and rpgrip1l−/− MEFs. The amount of both ATG5 and BBS4 was significantly increased in transfected wild-type MEFs ( and J) confirming the finding of Pampliega and colleagues [Citation7]. However, their amount was unaltered in GLI1-overexpressing Rpgrip1l-negative MEFs ( and ) demonstrating that RPGRIP1L regulates autophagy independently of SHH signaling.
Previously, we reported that RPGRIP1L affects SHH signaling at the level of GLI3 processing by regulating proteasomal activity at the ciliary base. In rpgrip1l−/− MEFs, the activity of the proteasome at the ciliary base is decreased [Citation28]. Consequently, the restoration of this proteasomal activity in the absence of RPGRIP1L should alter autophagic activity if RPGRIP1L regulates autophagy via SHH signaling. We treated Rpgrip1l-negative MEFs with SFN and with 18α-glycyrrhetinic acid (18α-GA), 2 well-known activators of proteasomal activity[Citation61,Citation62]. Previously, we showed that the treatment with SFN decreases the ciliary amount of proteasomal substrates in wild-type MEFs and rescues their amount at the ciliary base of Rpgrip1l-deficient MEFs [Citation28]. Quantification of BBS4 and OFD1 at the ciliary base after incubation of wild-type and Rpgrip1l-deficient MEFs in SFN showed no difference in the amount of both proteins between the control MEFs and the littermates (Figure S3A and S3B). In wild-type and rpgrip1l−/− MEFs, the proteolytic processing was clearly increased by treatment with 18α-GA (Figure S4A), demonstrating that the incubation of MEFs in 18α-GA increased proteasomal activity at the ciliary base. However, the amount of the autophagy-associated proteins OFD1 and BBS4 was unchanged at the base of cilia in wild-type and rpgrip1l−/− MEFs after treatment with 18α-GA (Figure S4B and C). On the basis of these results, we suggest that RPGRIP1L controls autophagy neither via governing SHH signaling nor via regulating proteasomal activity at the primary cilium.
Interestingly, it was shown previously that BBS4 is able to positively regulate proteasomal activity [Citation63]. Because the autophagy-dependent ciliary localization of BBS4 is impaired in the absence of RPGRIP1L, the question arises whether a rescue of autophagic activity would restore proteasomal activity at the ciliary base. To address this question, we used 4-(4-[{4′-chloro-2-biphenyl}methyl]-1-piperazinyl)-N-[{4-([{2R}-4-{dimethylamino}-1-{phenylsulfanyl}-2-butanyl]amino)-3-nitrophenyl} sulfonyl]benzamide (ABT-737), another known activator of autophagy aside from rapamycin [Citation64]. Because activation of autophagy neither affects GLI3 processing in the wild-type nor in the rpgrip1l−/− status (Figure S5A), we propose that RPGRIP1L regulates autophagy and proteasomal activity at the primary cilium independently of each other. To further analyze if the repression of autophagic activity affects GLI3 processing, we used 3-methyladenine (3-MA), a known inhibitor of autophagy [Citation65]. Treatment of wild-type as well as Rpgrip1l-negative MEFs with 3-MA did not alter the processing of GLI3 (Figure S5B).
Phospho-(Ser33/37/Thr41)-CTNNB1/β-catenin 1 represents another substrate that is specifically degraded by the proteasome at the ciliary base[Citation28,Citation66]. After treatment with the autophagy activator rapamycin, the amount of phospho-(Ser33/37/Thr41)-CTNNB1 at the ciliary base was unaltered in wild-type and Rpgrip1l-negative MEFs (Figure S5C) revealing that phospho-(Ser33/37/Thr41)-CTNNB1 is not degraded by autophagy and is not affected or even rescued by the restored autophagic activity in rapamycin-treated rpgrip1l−/− MEFs. To sum up, these data indicate that the known dysregulation of SHH signaling in Rpgrip1l-deficient individuals is not responsible for the diminished autophagic activity, and that RPGRIP1L regulates autophagy independently of proteasomal activity at the ciliary base.
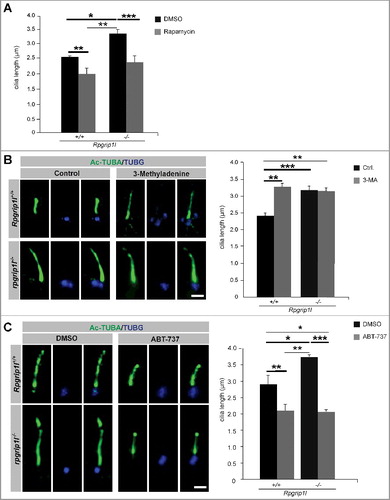
Previously, we showed that treatment of Rpgrip1l-negative MEFs with SFN restores proteasomal activity at the ciliary base but not cilia length indicating that additional factors besides the reduced proteasomal activity cause the numerous defects of Rpgrip1l-deficient embryos [Citation28]. Because treatment with rapamycin did not only decrease the OFD1 amount but also restored ciliary length in rpgrip1l−/− MEFs ( and ), the reduced autophagic activity might be another factor that leads to the defects observed in rpgrip1l−/− mouse embryos. Protein synthesis and autophagy are both mediated by MTORC1 [Citation22-26]. Previously, it was reported that MTOR modulates ciliary length via controlling protein synthesis [Citation67]. Thus, the question arises whether ciliary length in Rpgrip1l-deficient mice is altered due to rapamycin-induced changes in protein synthesis or due to the altered autophagy. To analyze this, we treated wild-type and rpgrip1l−/− MEFs with either the autophagy inhibitor 3-MA, acting independently of MTOR, or with the autophagy activator ABT-737, which was not shown to be associated with protein synthesis until now[Citation64,Citation68]. Treatment of wild-type MEFs with 3-MA resulted in an increase of ciliary length demonstrating that a reduction of autophagic activity increases cilia length independently of MTOR (). However, treatment of Rpgrip1l-negative MEFs with 3-MA did not alter cilia length (). Incubation in ABT-737 led to a decrease of cilia length in wild-type and rpgrip1l−/− MEFs, respectively (). Together these data indicate that although the reduction of autophagy in the absence of RPGRIP1L is based on an increased amount of active MTORC1, the changes in ciliary length of rpgrip1l−/− mouse embryos are not caused by the increased protein synthesis but by the reduced autophagic activity.
Figure 4. Pharmacological treatments rescue autophagic activity and ciliary length in the absence of RPGRIP1L. (A to C) Immunofluorescence-based cilia length quantifications. (A) Measurement of ciliary length after rapamycin treatment. The ciliary length in wild-type and Rpgrip1l-deficient MEFs is decreased after application of rapamycin (n = 3). (B) Application of the autophagy inhibitor 3-MA lengthens cilia in wild-type MEFs, but not Rpgrip1l-deficient MEFs. The ciliary axoneme is marked by Ac-TUBA (green), the basal body by TUBG (blue) (n = 4 for wild-type; n = 5 for rpgrip1l−/− MEFs). Scale bar: 1 µm. (C) Application of the autophagy activator ABT-737 decreases ciliary length in wild-type and Rpgrip1l-deficient MEFs. The ciliary axoneme is stained with Ac-TUBA (green), the basal body with TUBG (blue) (n = 4 for wild-type; n = 5 for Rpgrip1l−/− MEFs). Scale bar: 1 µm. Asterisks indicate statistically significant differences. The most important significant differences are written in bold. (A and C) Cells were treated with DMSO as a vehicle control.
Discussion
The degradation of proteins by autophagy and the ubiquitin-proteasome system is essential for mammalian development and homeostasis [Citation69-76]. Consequently, a tight regulation of these degradation processes has to be ensured. For this reason, cells have developed a compensatory safety concept. If one degradation system is downregulated, the other gets upregulated to prevent cell-damaging protein overload[Citation33,Citation34]. Thus, the regulation of both degradation systems in the same direction is rather uncommon. Our current study in combination with our previous report reveals that RPGRIP1L deficiency results in a decrease of proteasomal activity at the ciliary base and also in a reduction of autophagic activity demonstrating that RPGRIP1L positively controls both activities [Citation28]. In this regard, the differentiation between autophagic and proteasomal activity was a difficult task.
Most proteins that are affected by one of these degradation systems are also associated with the other. In our current study, all analyzed proteins (MAP1LC3B, OFD1, BBS4) except ATG5 are related to both degradation processes: MAP1LC3 is not only a substrate of autophagy but also of the 20S proteasome [Citation77]. Interestingly, the amount of MAP1LC3B-II in rpgrip1l−/− MEFs was subject to the period of time in which these MEFs were serum starved. In Rpgrip1l-negative MEFs that were exposed to serum starvation for 6 h, the amount of MAP1LC3B-II was increased, whereas the amount of MAP1LC3B-II was reduced in Rpgrip1l-deficient MEFs that underwent serum starvation for 24 h (-E). In summary, these data suggest that the amount of MAP1LC3 is unaffected by the reduced proteasomal activity at the ciliary base caused by RPGRIP1L deficiency.
Potentially, MAP1LC3 is not degraded by the cilia-regulated proteasome but by other kinds of proteasomes. Remarkably, despite the opposing amounts of MAP1LC3B-II in Rpgrip1l-negative MEFs after serum starvation for 6 h and for 24 h ( and Figure S1B), autophagy was decreased in the absence of RPGRIP1L under both conditions ( and E). An explanation for this phenomenon could be that loss of RPGRIP1L hypothetically affects autophagy in 2 different ways: rpgrip1l−/− MEFs that were serum starved for 6 h do not form cilia at all, while 10.4% of the wild-type MEFs possess cilia (Figure S1A). Previously, it was already speculated that primary cilia could be associated with autophagosome-lysosome fusion [Citation78]. Consequently, the absence of RPGRIP1L may result in a blockade of later steps in the autophagy process, e.g. a perturbed fusion between autophagosomes and lysosomes leading to a smaller number of autolysosomes. Considering the accumulation of MAP1LC3B-II in the nucleus of Rpgrip1l-negative MEFs that underwent serum starvation for 6 h, it is likely that the production of MAP1LC3B-II and presumably also of autophagosomes is unaffected by RPGRIP1L deficiency.
It is also known from other studies that the amount of MAP1LC3B-II increases in case of an impaired autophagosome-lysosome fusion [Citation79-82]. In the condition in which MEFs were serum starved for 24 h, a plethora of cilia was formed (Figure S1A) and loss of RPGRIP1L may disturb the generation of autophagosomes most likely by upregulating cilia-mediated MTOR signaling. Potentially, a residual autophagic activity and/or the cilia-independent proteasome degrades the high amount of MAP1LC3B-II and hence the high number of autophagosomes that was detected in rpgrip1l−/− MEFs that were serum starved for 6 h. Because no new autophagosomes were formed, the amount of MAP1LC3B-II was decreased in rpgrip1l−/− MEFs that were exposed to serum starvation for 24 h (). In summary, we propose that RPGRIP1L regulates the initiation of autophagy via governing MTOR signaling and later steps of autophagy (for example the fusion of autophagosomes and lysosomes) by a yet unknown mechanism. Future investigations should be undertaken to prove our two-way hypothesis.
In line with the finding that the absence of RPGRIP1L leads to a reduced autophagic activity, the autophagic substrate OFD1 is elevated by RPGRIP1L deficiency. It was previously reported that OFD1 positively regulates proteasomal activity. In contrast to RPGRIP1L, OFD1 controls the overall cellular proteasomal activity by controlling the amount of proteasomal components [Citation63]. Although the loss of RPGRIP1L results in an increased amount of OFD1 at the ciliary base ( and Figure S2B), overall cellular proteasomal activity is not altered and the proteasomal activity at the base of primary cilia is decreased [Citation28]. In this context, it is remarkable that RPGRIP1L deficiency results in a reduced amount of BBS4 at the ciliary base ( and Figure S2C), and that a positive regulation of overall proteasomal activity by BBS4 was formerly reported, raising the question of why the increased OFD1 amount or the decreased BBS4 amount at the ciliary base of rpgrip1l−/− MEFs and limbs does not lead to an affected overall cellular proteasomal activity. Addressing this question in the future will make an important contribution to the understanding of the crosstalk between autophagy and the ubiquitin-proteasome system, which at least partly is mediated by ciliary proteins.
RPGRIP1L is not the only protein that regulates both autophagic and proteasomal activity in the same direction. Another protein that is involved in the regulation of both degradation processes in the same direction is USP14 (ubiquitin specific peptidase 14). This protein negatively controls proteasomal activity by trimming K48 ubiquitin chains on proteasome-bound substrates [Citation83-85], and autophagic activity by governing K63 ubiquitination of BECN1/Beclin 1 [Citation86]. Furthermore, the transcription factor FOXO3 (forkhead box O3) activates proteasomal proteolysis and autophagy. However, it performs this function exclusively in myotubes[Citation87,Citation88]. Another factor that seems to control both degradation systems in a cell type-specific manner is the COP9 (Constitutive photomorphogenesis 9) complex consisting of the GPS1/CSN1/COPS1/COP9 signalosome 1 to COPS8/CSN8/COP9 signalosome 8 proteins. Su and colleagues showed that a conditional loss of the COPS8/CSN8 protein in murine hearts reduces the activity of the ubiquitin-proteasome system and the autophagic flux at the same time [Citation89].
Interestingly, some of the GPS1-COPS proteins localize at the centrosome in HeLa cells [Citation90]. Because the ciliary BB is built up by the centrosome, a localization of the GPS1-COPS complex at the cilium is conceivable. It is an interesting topic of future studies to test whether there is a relationship between GPS1-COPS proteins and RPGRIP1L. Moreover, it was reported that MTORC1 signaling does not only negatively control autophagic activity but also negatively regulates proteasomal activity [Citation91]. However, another report described the opposite, namely that MTORC1 signaling positively governs proteasomal activity [Citation92] leading to a controversial debate[Citation93,Citation94]. Our current study revealed that RPGRIP1L deficiency results in elevated MTORC1 signaling ( and , ) and our previous study showed that overall proteasomal activity is unaltered in rpgrip1l−/− MEFs [Citation28]. In combination, these data indicate that the increased MTORC1 signaling does not affect overall proteasomal activity at all in the absence of RPGRIP1L. Furthermore, the investigations in which we used the MTORC1 inhibitor rapamycin uncovered that proteasomal activity at the ciliary base is not regulated by MTORC1 signaling (Figure S5C).
Previously, we showed that RPGRIP1L governs proteasomal activity at the ciliary base via interacting with the PSMD2 (proteasome [prosome, macropain] 26S subunit, non-ATPase, 2) protein, a component of the regulatory proteasomal 19S subunit. In doing so, RPGRIP1L controls cilia-mediated SHH signaling [Citation28]. Although SHH signaling governs autophagy in MEFs, RPGRIP1L does not regulate autophagy via SHH signaling ( and ). In MEFs, the regulation of autophagy by RPGRIP1L is accomplished via MTORC1 signaling ( and ). Interestingly, several studies reported the localization of AKT1, a protein acting upstream of MTOR, to primary cilia: For example, the activated form of AKT1 is localized at the basal body of cilia in murine 3T3-L1 preadipocytes and in cortical progenitors[Citation57,Citation95]. In addition, it was shown that activated AKT1 colocalizes with HSP90 (heat shock protein 90) at the ciliary base making this part of the cilium a possible candidate for the activation of AKT1 signaling [Citation58]. Our data reveal that the amount of phospho-(Ser473)-AKT1 and phospho-(Ser2448)-MTOR is elevated in Rpgrip1l-deficient MEFs ( and ). Remarkably, we did not only detect the increased amount of these 2 proteins in whole cell lysates but also at primary cilia ( and ) demonstrating that more activated AKT1 and MTOR protein is present at Rpgrip1l-negative MEF cilia. These data together with the fact that the treatment of rpgrip1l−/− MEFs with the MTOR inhibitor rapamycin leads to a rescue of autophagic activity indicate that RPGRIP1L controls the phosphorylation of MTOR and hence autophagy by governing the activation of AKT1. The mechanism by which RPGRIP1L realizes the regulation of AKT1 phosphorylation remains to be elucidated in the future.
By using different pharmacological activators and inhibitors of autophagy and the proteasome, we suggest that RPGRIP1L regulates the 2 protein degradation processes independently from each other. It is a difficult endeavor to discriminate between autophagic and proteasomal activity because many drugs that have an effect on the one degradation system often also affect the other. The drugs used in the current study include rapamycin, SFN, 18α-GA, ABT-737 and 3-MA. Rapamycin is one of the best studied autophagy activators but it was reported that it is also able to affect proteasomal activity[Citation51-56,Citation96,Citation97]. An inhibition of proteasomal activity by rapamycin was shown in lymphocytes [Citation97], MEFs and human embryonic kidney (HEK293) cells [Citation92], whereas a rapamycin-induced activation of proteasomal activity was reported in MEFs, HEK293 cells and the murine liver [Citation91]. SFN and 18α-GA are well-known proteasome activators but can also activate autophagy. In the case of SFN, this autophagy-activating function was shown in pancreatic cancer cells [Citation98], human prostate cancer cell line (PC-3) [Citation99], human androgen-dependent prostate cancer cells, human neuroblastoma cells [Citation100], immortalized human hepatocytes [Citation101], murine neurons [Citation102] and the mouse brain [Citation103]. 18α-GA serves as a proteasome activator in human embryonic fibroblasts [Citation62], in human bone marrow stromal cells [Citation104] and in human as well as murine neuronal cells [Citation105] and functions as an autophagy activator in hepatocellular carcinoma cells [Citation106] and in non-small cell lung cancer cells [Citation107]. Thus, an effect on both autophagic and proteasomal activity, was reported for all three drugs. However, in MEFs, we did neither detect any effect of rapamycin on the proteasomal activity at the ciliary base (Figure S5C) nor any impact of SFN or 18α-GA on autophagic activity (Figure S3, Figure S4). Accordingly, the treatment of wild-type and rpgrip1l−/− MEFs with rapamycin, SFN or 18α-GA allows us to differentiate between autophagic and proteasomal activity at the ciliary base.
ABT-737 activates autophagy [Citation64], whereas 3-MA is an autophagy inhibitor [Citation65]. Until now, no connection between ABT-737 or 3-MA and the proteasome was reported. We analyzed the processing of GLI3, which is realized specifically by the cilia-regulated proteasome (see Citationrefs. 35 and Citation71), in wild-type and rpgrip1l−/− MEFs after treatment with ABT-737 or 3-MA and found no alteration (Figure S5A and S5B). Thus, the activation or the inhibition of autophagy does not affect proteasomal activity at the ciliary base in MEFs. Together, the results of the drug treatments in MEFs strongly argue for a scenario in which RPGRIP1L regulates proteasomal activity at the ciliary base and autophagy independently of each other. However, because all of our treatments have been carried out in vitro, we cannot conclude that the drugs used in our study exert the same effects in vivo.
Remarkably, on the one hand, ciliary proteins have an impact on autophagy, and, on the other hand, autophagy has an effect on cilia. In this context, several studies revealed that autophagy is able to regulate cilia length [Citation108-110]. Our investigations showed that the reduced autophagic activity in the absence of RPGRIP1L leads to an elongation of cilia (). Treatment of MEFs with the autophagy activators rapamycin (affects autophagy by inhibiting MTOR) and ABT-737 (affects autophagy but not protein synthesis) reduces cilia length ( and ) demonstrating that autophagy is able to modulate cilia length in MEFs independently of MTOR-regulated protein synthesis. Interestingly, a study in the zebrafish also reported that the usage of rapamycin reduces ciliary length [Citation67]. Noticeably, our treatment with the autophagy inhibitor 3-MA increases the length of cilia in wild-type MEFs but does not elongate cilia in rpgrip1l−/− MEFs (). We assume that RPGRIP1L deficiency decreases autophagic activity to such a low level that 3-MA has no impact on autophagy-regulated cilia length in these cells.
In contrast to our findings, Wang et al. showed that inhibition of autophagy via 3-MA leads to a decreased cilia length in HK2 cells [Citation111]. As this cell line is derived from human kidney cells, we hypothesize a cell type-dependent role of autophagy in the regulation of ciliary length. In the same study, it was demonstrated that ciliary length is affected by a cooperative activity of the proteasome and autophagy in HK2 cells [Citation111]. We found another situation in MEFs. Combined with the data of our previous report in which the proteasome activator SFN was not able to restore cilia length in Rpgrip1l-negative MEFs, we conclude that RPGRIP1L controls cilia length via regulating autophagy but not by governing proteasomal activity at the ciliary base [Citation28]. In summary, we propose that the differences that exist between the findings of our study and the results of other reports are caused by the analysis of different cell types.
One of the most important questions raised by our findings is whether reduced autophagic activity takes part in the development of human ciliopathies caused by mutations in RPGRIP1L. Previously, it was reported that autophagy plays an important role in vertebrate development[Citation70,Citation71,Citation112-114]. Autophagy is involved in the embryonic development of the brain [Citation115], the eyes [Citation116-118], the lung [Citation119], the heart[Citation120,Citation121] and the liver [Citation120]. To evaluate the importance of our findings for human health, it would be an interesting future task to analyze autophagic activity in ciliopathy patients who carry a mutation in RPGRIP1L. Previously, it was shown that prenatal rapamycin treatment reduced cystogenesis in pkd1−/− mice, a well-established mammalian model for polycystic kidney disease, a medical condition that is associated with dysfunctional cilia [Citation122-124]. However, this positive effect was not linked to autophagy but was only related to the relationship of upregulated MTOR signaling and cyst formation. So far, it is unknown if treatment with rapamycin has also positive impacts on other ciliopathy symptoms. Treatment of rpgrip1l−/− mouse embryos with rapamycin would shed light on this open question. Accordingly, the decreased autophagic activity and the impaired proteasomal activity could be 2 independent reasons for the development of ciliopathy symptoms in Rpgrip1l-negative mouse embryos. On that account, the rescue of both activities together could be the decisive step to treat, heal or even prevent ciliopathies caused by mutations in RPGRIP1L.
Materials and methods
Ethics statement and animal husbandry
All mice (Mus musculus) used in this study were on the C3H background and kept under standard housing conditions (12/12-h dark-light cycle; with food and water ad libitum). Animal procedures were performed in accordance with National Institutes of Health guidelines and with local and state regulations for research with animals.
Mouse strains
We mated Rpgrip1l+/− male and female mice to obtain wild-type and rpgrip1l−/− mouse embryos. Rpgrip1l-heterozygous mutant mice were generated as described previously [Citation29].
Primary antibodies
In this study, the following primary antibodies were used: rabbit anti-ACT (Sigma-Aldrich, A2066), mouse anti-GAPDH (Sigma-Aldrich, G8795), goat anti-GLI3 (R&D systems, AF3690), rabbit anti-phospho-(Ser2448)-MTOR (Cell Signaling Technology, 2971), rabbit anti-TSC1 (Cell Signaling Technology, 4906), rabbit anti-phospho-(Ser939)-TSC2 (Cell Signaling Technology, 3615), rabbit anti-phospho-(Ser473)-AKT1 (Cell Signaling Technology, 9271), mouse anti-Ac-TUBA (Santa Cruz Biotechnology, sc-23950), goat anti-TUBG (Santa Cruz Biotechnology, sc-7396), rabbit anti-BBS4 (Proteintech Group Inc., 12766-1-AP), rabbit anti-MAP1LC3B (Cell Signaling Technology, 2775), rabbit anti-MAP1LC3B (Abcam, ab48394), rabbit anti-OFD1 (kind gift provided by Brunella Franco; TIGEM, Italy), rabbit anti-MTOR (Cell Signaling Technology, 2983), rabbit anti-AKT1 (Cell Signaling Technology, 4691), rabbit anti-TSC2 (Abcam, ab32554), mouse anti-GFP (Roche, 11814460001), rabbit anti-phospho-(Ser33/37/Thr41)-CTNNB1 (Cell Signaling Technology, 9561), mouse anti-ATG5 (Proteintech Group Inc., 60061-1-LG), rabbit anti-ubiquitin (Sigma-Aldrich, U5379).
Autophagic flux assay
For the autophagic flux assay MEFs were treated for 6 h with 40 μM chloroquine (Sigma-Aldrich, C6628) dissolved in DMEM containing no serum. Alternatively, MEFs were serum starved for 24 h with an additional CQ treatment within the last 6 h. Serum-deprived MEFs served as control. Cells were harvested in radioimmunoprecipitation buffer (150 mM sodium chloride, 50 mM Tris-HCl, pH 7.4, 0.1% sodium deoxycholate (Sigma-Aldrich, D6750), 1 mM EDTA) and prepared for western blot analysis. Calculation of the autophagic flux was performed via subtracting the quantified and normalized (to the ACT loading control) MAP1LC3B amount (in procedure defined units) of the CQ-treated MEFs from the quantified and normalized MAP1LC3B amount of the untreated MEFs.
Cell culture, transfection, and drug treatment
For MEF isolation, single embryos (E12.5) were used. MEFs were grown in DMEM supplemented with 10% fetal calf serum, 1:100 (vol:vol) L-glutamine (Gibco, 25030-024), 1:100 (vol:vol) sodium pyruvate (Gibco, 11360-39), 1:100 (vol:vol) nonessential amino acids (Gibco, 1140-35), and 1:100 (vol:vol) penicillin/streptomycin (Gibco, 15140-122) at 37°C and 5% CO2. Ciliogenesis was induced by starving confluent MEFs in medium containing 0.5% fetal calf serum for at least 24 h.
GLI1 overexpression in MEFs was achieved via transfection of a construct encoding a HsGLI1-EGFP fusion protein. Full-length HsGLI1 was cloned into a p-EGFP-C1 vector (BD Biosciences Clontech, 6084-1). Transfection was performed using the Lipofectamine 3000 detergent (Thermo Fisher Scientific, L3000008) when the MEFs reached 70–80% confluency. At 6–10 h after transfection, MEFs were serum starved for 24 h. Cells were either harvested for western blot analysis or fixed and stained for fluorescence microscopy.
Cells were treated for 20 h with 10 nM rapamycin (Cell Signaling Technology, 9904), for 20 h with 10 µM 3-methyladenine (Sigma-Aldrich, M9281), 5 µM SFN (Enzo Life Sciences, ALX-350-230-M010), for 6 h with 1 µM ABT-737 (Viva Bioscience, B2766-0001), for 2 h with 2 µg/ml 18α-GA (Sigma-Aldrich, G8503-250MG) or 6 h with 40 µM CQ (Sigma-Aldrich, C-6628). As a solvent control, cells were treated for the same time with 0.1% DMSO; in the case of 3-methyladenine, 18α-GA and CQ, serum-deprived DMEM served as solvent and thereby as control. To stimulate SHH signaling, cells were treated for 24 h with 200 nM SAG (Calbiochem, 566660). All treatment experiments were repeated 3 independent times.
Cryosections
The isolated embryos were fixed in 4% paraformaldehyde for 2 h at room temperature. Subsequently, the limbs were separated from the animals and incubated separately in 30% sucrose (Merck, 107651; in PBS [4 mM NaH2PO4·H2O, 16 mM Na2HPO4·2H2O, 150 mM NaCl]) over night (o/n) at 4°C. On the following day, embryos and limbs were embedded in Tissue-Tek O.C.T. Compound (Sakura Finetek Inc., 4583) and then stored at -80°C. Transverse cryostat sections (7 µm in thickness) were prepared. For staining with anti-OFD1, the sections were fixed 10 min in MeOH at -20°C.
Immunofluorescence
For immunofluorescence of MEFs, cells were grown on coverslips until confluency. After serum starvation for 24 h, MEFs were fixed with 4% paraformaldehyde (for stainings with the antibodies to phospho-[Ser473]-AKT1, Ac-TUBA, phospho-[Ser33/37/Thr41]-CTNNB1 and phospho-[Ser2448]-MTOR) or methanol (for stainings with the antibodies against BBS4, MAP1LC3B, CDH, ubiquitin, ATG5 and OFD1). Fixed cells were rinsed 3 times with sterile PBS. Permeabilization was performed by incubating the cells in PBS-0.5% Triton X-100 (AppliChem, A4975,0500) for 10 min. After 3 washes with PBS-0.1% Triton X-100, unspecific antigens were blocked for at least 1 h at room temperature using PBS-0.1% Triton X-100 containing 10% donkey serum (EMD Millipore, S30-100ML). In blocking solution, diluted primary antibodies were incubated o/n at 4°C. After 3 washing steps with PBS-0.1% Triton X-100, incubation with fluorescent secondary antibody (Jackson ImmunoResearch Laboratories) all were raised in donkeys, anti-mouse Alexa 488 (711-545-151), anti-rabbit Alexa 488 (711-545-152), anti-mouse Cy 3 (715-165-151), anti-rabbit Cy 3 (715-165-152), anti-rabbit Dylight 405 (711-475-152), anti-goat Dylight 405 (705-475-003) diluted in block was performed at room temperature for 1 h followed by several washings and subsequent embedding with Mowiol (Sigma-Aldrich, 81381).
For immunofluorescence on limb cryosections, sections were permeabilized with PBS-0.5% Triton X-100 for 15 min at room temperature. Blocking was performed with 10% donkey serum in PBS-0.1% Triton X-100. The sections then were incubated with the primary antibodies diluted in block o/n at 4°C. After 3 washing steps, sections were incubated in the secondary antibody (again diluted in blocking solution) for 2 h at 37°C and then washed again. Finally, they were embedded in Mowiol.
Image processing
Image acquisition and data analysis were performed at room temperature using a microscope (Imager.A2; Carl Zeiss), 100x, NA 1.46 oil immersion objective lens (Carl Zeiss), a monochrome charge-coupled device camera (AxioCam MRm; Carl Zeiss), and the AxioVision Rel. 4.8 software package (Carl Zeiss).
3D-structured illumination microscopy (3D-SIM) was performed on a Zeiss ELYRA PS.1 system (Carl Zeiss) equipped with an Andor EM-CCD iXON DU-885 with 1004 × 1002 pixels at room temperature. Z-stacks were taken using a 100x alpha-Plan-Apochromat oil immersion objective with a numerical aperture of 1.46. To generate structured illumination a grid pattern is projected onto the image plane in 5 different positions and at 5 different modulation angles to obtain high frequency information within the low frequency information captured by the optical system. For the Dylight405-, Dylight488-, Cy3-channel back-computation of the lower frequencies using Fourier transformation was performed using the Zeiss ZEN Structured Illumination Processing tool to increase the resolution in the final image.
Appropriate anti-mouse, rabbit, or goat Cy3, Dylight405 or Dylight488 fluorochrome–conjugated secondary antibodies (Jackson ImmunoResearch, 711-165-152; Jackson ImmunoResearch, 705-475-003; Jackson ImmunoResearch, 715-485-151) were used to detect primary antibody binding. The following Phalloidin-conjugates were used: CytoPainter Phalloidin-iFluor 488 reagent (Abcam, ab176753); CytoPainter Phalloidin-iFluor 405 reagent (Abcam, ab176752) and TRITC-Phalloidin (Sigma-Aldrich, P1951).
Quantifications of immunofluorescence intensities
Intensity of ciliary protein staining was quantified using ImageJ (National Institutes of Health). For the measurement of fluorescence intensities of ciliary base proteins, we selected the region labeled by TUBG and the area in-between the TUBG staining and the proximal part of the Ac-TUBA staining and measured the total pixel intensity. For quantifications of the fluorescence intensity of the phospho-(Ser473)-AKT1 signal, we used the area marked by Ac-TUBA and quantified the average pixel intensity to take the cilia length into account, thereby making the data of wild-type and rpgrip1l−/− cilia comparable. To get rid of the ratio of nonspecific (background) staining, we subtracted the mean value of the average pixel intensity (in the case of phospho-[Ser473]-AKT1) or of the total pixel intensity (for all ciliary base proteins) of 3 neighboring regions free from specific staining.
Quantifications of autophagosomes in MEFs
All measurements (either MAP1LC3B or ATG5) were performed in Fiji (National Institues of Health). Images were loaded into the software and single-color planes were merged. The cell border was marked and the total cell area was measured. The red channel within this area was copied and pasted into a new Fiji file. Total autophagosome area was measured via the “Object counter” Plugin, whereas an intensity threshold between 30 and 40 (for both wild-type and Rpgrip1l-deficient MEFs) was used to automatically mark the autophagosomes and thereby measure their area. All autophagosome areas for one cell were summed up. A ratio between their sum and the total cell area was calculated. For each individual per genotype, at least 10 cells and their autophagosomes were measured.
Quantitative real-time reverse transcriptase PCR analysis
All quantitative real-time reverse transcriptase PCR analysis were performed using TaqMan™ probes and a StepOne™ Real-Time PCR System (Thermo Fisher Scientific/Applied Biosystems). The used TaqMan™ probes were Ptch1 (Thermo Fisher Scientific/Applied Biosystems, Mm00436026_m1) and Gapdh (Thermo Fisher Scientific/Applied Biosystems, Mm99999915_g1) as a housekeeping gene. Measurements were performed in triplets. Expression differences between wild-type and Rpgrip1l-deficient MEFs were calculated via the ΔΔCt-method.
Semiquantitative PCR analysis
MEF total cell RNA was isolated using the RNeasy Mini Kit (Qiagen, 74104) and a RNase-Free DNase Set (Qiagen, 79254). The RNA was transcribed into cDNA by usage of a reverse transcriptase system (Roche, 11785826001). With this cDNA a semiquantitative PCR for Hif1a was performed, while Hprt was used for normalization. The following primers were used:
Hif1a forw.: TGATGCTCTCACTCTGCTGG
Hif1a rev.: AGAAGGACTTGCTGGCTGAT
Hprt forw.: CACAGGACTAGAACACCTGC
Hprt rev.: GCTGGTGAAAAGGACCTCT
Western blotting
Whole-cell lysates were obtained by lysis with radioimmunoprecipitation buffer (150 mM sodium chloride, 50 mM Tris-HCl, pH 7.4, 0.1% sodium deoxycholate, 1 mM EDTA). The Bradford method was used to determine the protein amount. All samples were normalized. Total protein (20 μg) was separated by SDS-PAGE on polyacrylamide gels (10% or 15%) and transferred to a PVDF membrane (Bio-Rad Laboratories Inc., 1620177). Blocking was performed in either skimmed milk powder or bovine serum albumin dissolved in PBS-0.1% Tween 20 (Carl Roth GmbH + Co. KG, 9127.1) or TBS (20 mM NaCl, 150 mM Tris)-0.1% Tween 20. The membrane was incubated with antibodies against MAP1LC3B (in this case the antibody from Cell Signaling Technology was used), GLI3, phospho-(Ser2448)-MTOR, non-phospho-MTOR, TSC1, phospho-(Ser939)-TSC2, non-phospho-TSC2, phospho-(Ser473)-AKT1, non-phospho-AKT1, GLI1 or GFP. Anti-ACT antibody was used as loading control. Proteins were detected with secondary antibodies conjugated to horseradish peroxidase (DakoCytomation, P0260; DakoCytomation, P0448; Santa Cruz Biotechnology, sc-2020) and the ECL detection kit (GE Healthcare, RPN2232). Band visualization was performed using a LAS-4000 mini (Fujifilm) and their intensities were measured using the Fiji Software (National Institutes of Health).
Figure preparation
Figure preparation was performed by using Photoshop 7 or CS4 (Adobe), and collages of all images for figure preparation were arranged using Illustrator CS4 (Adobe).
Statistical data
Data are presented as means ± SEM. A 2-tailed Student t test was performed for all compared data by using Excel (Microsoft). A P < 0.05 was considered to be statistically significant (*), a P < 0.01 was regarded as statistically very significant (**), and a P < 0.001 was considered to be highly significant statistically (***).
Disclosure of potential conflict of interest
The authors report no conflict of interest.
supp_data_1429874.doc
Download MS Word (9.8 MB)Acknowledgements
The authors thank the members of the Center for Advanced imaging (CAi) at the Heinrich Heine University Düsseldorf for their support concerning the used imaging applications. We are grateful to Brunella Franco for providing the antibody against OFD1. Our particular thanks go to Tilman Grune, Sebastian Wesselborg and Renate Dildrop for especially fruitful discussions.
Additional information
Funding
Related Research Data
References
- Oud M, Lamers I, Arts H. Ciliopathies: genetics in pediatric medicine. J Pediatr Genet. 2017;6(1):18–29. https://doi.org/10.1055/s-0036-1593841. PMID:28180024
- Braun D, Hildebrandt F. Ciliopathies. Cold Spring Harb Perspect Biol. 2017;9(3). pii: a028191.
- Hildebrandt F, Benzing T, Katsanis N. Ciliopathies. N Engl J Med. 2011;364(16):1533–1543. https://doi.org/10.1056/NEJMra1010172. PMID:21506742
- Waters A, Beales P. Ciliopathies: an expanding disease spectrum. Pediatr Nephrol. 2011;26(7):1039–1056. https://doi.org/10.1007/s00467-010-1731-7. PMID:21210154
- Satir P, Pedersen L, Christensen S. The primary cilium at a glance. J Cell Sci. 2010;123(4):499–503. https://doi.org/10.1242/jcs.050377. PMID:20144997
- Tang Z, Lin M, Stowe T, et al. Autophagy promotes primary ciliogenesis by removing OFD1 from centriolar satellites. Nature. 2013;502(7470):254–257. https://doi.org/10.1038/nature12606. PMID:24089205
- Pampliega O, Orhon I, Patel B, et al. Functional interaction between autophagy and ciliogenesis. Nature. 2013;502(7470):194–200. https://doi.org/10.1038/nature12639. PMID:24089209
- Jacinto E, Loewith R, Schmidt A, et al. Mammalian TOR complex 2 controls the actin cytoskeleton and is rapamycin insensitive. Nat Cell Biol. 2004;6(11):1122–1128. https://doi.org/10.1038/ncb1183. PMID:15467718
- Sarbassov D, Ali S, Kim D, et al. Rictor, a novel binding partner of mTOR, defines a rapamycin-insensitive and raptor-independent pathway that regulates the cytoskeleton. Curr Biol. 2004;14(14):1296–1302. https://doi.org/10.1016/j.cub.2004.06.054. PMID:15268862
- Sekulić A, Hudson C, Homme J, et al. A direct linkage between the phosphoinositide 3-kinase-AKT signaling pathway and the mammalian target of rapamycin in mitogen-stimulated and transformed cells. Cancer Res. 2000;60(13):3504–3513. PMID:10910062
- Copp J, Manning G, Hunter T. TORC-specific phosphorylation of mammalian target of rapamycin (mTOR): phospho-Ser2481 is a marker for intact mTOR signaling complex 2. Cancer Res. 2009;69(5):1821–1827. https://doi.org/10.1158/0008-5472.CAN-08-3014. PMID:19244117
- Gao X, Zhang Y, Arrazola P, et al. Tsc tumour suppressor proteins antagonize amino-acid-TOR signalling. Nat Cell Biol. 2002;4(9):699–704. https://doi.org/10.1038/ncb847. PMID:12172555
- Hemmings B, Restuccia D. PI3K-PKB/Akt pathway. Cold Spring Harb Perspect Biol. 2012;4(9):a011189. https://doi.org/10.1101/cshperspect.a011189. PMID:22952397
- Alessi D, James S, Downes C, et al. Characterization of a 3-phosphoinositide-dependent protein kinase which phosphorylates and activates protein kinase Balpha. Curr Biol. 1997;7(4):261–269. https://doi.org/10.1016/S0960-9822(06)00122-9. PMID:9094314
- Sarbassov D, Guertin D, Ali S, et al. Phosphorylation and regulation of Akt/PKB by the rictor-mTOR complex. Science. 2005;307(5712):1098–1101. https://doi.org/10.1126/science.1106148. PMID:15718470
- Gao T, Furnari F, Newton A. PHLPP: a phosphatase that directly dephosphorylates Akt, promotes apoptosis, and suppresses tumor growth. Mol Cell. 2005;18(1):13–24. https://doi.org/10.1016/j.molcel.2005.03.008. PMID:15808505
- Feng J, Park J, Cron P, et al. Identification of a PKB/Akt hydrophobic motif Ser-473 kinase as DNA-dependent protein kinase. J Biol Chem. 2004;279(39):41189–41196. https://doi.org/10.1074/jbc.M406731200. PMID:15262962
- Inoki K, Li Y, Zhu T, et al. TSC2 is phosphorylated and inhibited by Akt and suppresses mTOR signalling. Nat Cell Biol. 2002;4(9):648–657. https://doi.org/10.1038/ncb839. PMID:12172553
- Potter C, Pedraza L, Xu T. Akt regulates growth by directly phosphorylating Tsc2. Nat Cell Biol. 2002;4(9):658–665. https://doi.org/10.1038/ncb840. PMID:12172554
- Manning B, Tee A, Logsdon M, et al. Identification of the tuberous sclerosis complex-2 tumor suppressor gene product tuberin as a target of the phosphoinositide 3-kinase/akt pathway. Mol Cell. 2002;10(1):151–162. https://doi.org/10.1016/S1097-2765(02)00568-3. PMID:12150915
- Navé B, Ouwens M, Withers D, et al. Mammalian target of rapamycin is a direct target for protein kinase B: identification of a convergence point for opposing effects of insulin and amino-acid deficiency on protein translation. Biochem J. 1999;344(Pt 2):427–431. https://doi.org/10.1042/bj3440427. PMID:10567225
- Kim J, Kundu M, Viollet B, et al. AMPK and mTOR regulate autophagy through direct phosphorylation of Ulk1. Nat Cell Biol. 2011;13(2):132–141. https://doi.org/10.1038/ncb2152. PMID:21258367
- Saxton R, Sabatini D. mTOR signaling in growth, metabolism, and disease. Cell. 2017;168(6):960–976. https://doi.org/10.1016/j.cell.2017.02.004. PMID:28283069
- Martina J, Chen Y, Gucek M, et al. MTORC1 functions as a transcriptional regulator of autophagy by preventing nuclear transport of TFEB. Autophagy. 2012;8(6):903–914. https://doi.org/10.4161/auto.19653. PMID:22576015
- Roczniak-Ferguson A, Petit C, Froehlich F, et al. The transcription factor TFEB links mTORC1 signaling to transcriptional control of lysosome homeostasis. Sci Signal. 2012;5(228):ra42. https://doi.org/10.1126/scisignal.2002790. PMID:22692423
- Settembre C, Zoncu R, Medina D, et al. A lysosome-to-nucleus signalling mechanism senses and regulates the lysosome via mTOR and TFEB. EMBO J. 2012;31(5):1095–1108. https://doi.org/10.1038/emboj.2012.32. PMID:22343943
- Quan W, Lee M. Role of autophagy in the control of body metabolism. Endocrinol Metab (Seoul). 2013;28(1):6–11. https://doi.org/10.3803/EnM.2013.28.1.6. PMID:24396643
- Gerhardt C, Lier J, Burmühl S, et al. The transition zone protein Rpgrip1l regulates proteasomal activity at the primary cilium. J Cell Biol. 2015;210(1):115–133. https://doi.org/10.1083/jcb.201408060. PMID:26150391
- Vierkotten J, Dildrop R, Peters T, et al. Ftm is a novel basal body protein of cilia involved in Shh signalling. Development. 2007;134(14):2569–2577. https://doi.org/10.1242/dev.003715. PMID:17553904
- Delous M, Baala L, Salomon R, et al. The ciliary gene RPGRIP1L is mutated in cerebello-oculo-renal syndrome (Joubert syndrome type B) and Meckel syndrome. Nat Genet. 2007;39(7):875–881. https://doi.org/10.1038/ng2039. PMID:17558409
- Arts H, Doherty D, van Beersum S, et al. Mutations in the gene encoding the basal body protein RPGRIP1L, a nephrocystin-4 interactor, cause Joubert syndrome. Nat Genet. 2007;39(7):882–888. https://doi.org/10.1038/ng2069. PMID:17558407
- Wolf M, Saunier S, O'Toole J, et al. Mutational analysis of the RPGRIP1L gene in patients with Joubert syndrome and nephronophthisis. Kidney Int. 2007;72(12):1520–1526. https://doi.org/10.1038/sj.ki.5002630. PMID:17960139
- Lilienbaum A. Relationship between the proteasomal system and autophagy. Int J Biochem Mol Biol. 2013;4(1):1–26. PMID:23638318
- Levine B, Kroemer G. Autophagy in the pathogenesis of disease. Cell 2008;132(1):27–42. https://doi.org/10.1016/j.cell.2007.12.018. PMID:18191218
- Klionsky D, Abdelmohsen K, Abe A, et al. Guidelines for the use and interpretation of assays for monitoring autophagy (3rd edition). Autophagy. 2016;12(1):1–222. https://doi.org/10.1080/15548627.2015.1100356. PMID:26799652
- Tanida I, Minematsu-Ikeguchi N, Ueno T, et al. Lysosomal turnover, but not a cellular level, of endogenous LC3 is a marker for autophagy. Autophagy. 2005;1(2):84–91. https://doi.org/10.4161/auto.1.2.1697. PMID:16874052
- Kabeya Y, Mizushima N, Ueno T, et al. LC3, a mammalian homologue of yeast Apg8p, is localized in autophagosome membranes after processing. EMBO J. 2000;19(21):5720–5728. https://doi.org/10.1093/emboj/19.21.5720. PMID:11060023
- Goetz S, Anderson K. The primary cilium: a signalling centre during vertebrate development. Nat Rev Genet. 2010;11(5):331–344. https://doi.org/10.1038/nrg2774. PMID:20395968
- Bimonte S, De Angelis A, Quagliata L, et al. Ofd1 is required in limb bud patterning and endochondral bone development. Dev Biol. 2011;349(5):179–191. https://doi.org/10.1016/j.ydbio.2010.09.020. PMID:20920500
- Emechebe U, Kumar PP, Rozenberg J, et al. T-box3 is a ciliary protein and regulates stability of the Gli3 transcription factor to control digit number. Elife. 2016;5:e07897. https://doi.org/10.7554/eLife.07897. PMID:27046536
- Xin D, Christopher K, Zeng L, et al. IFT56 regulates vertebrate developmental patterning by maintaining IFTB integrity and ciliary microtubule architecture. Development. 2017;144(8):1544–1553.
- Jung C, Ro SH, Cao J, et al. mTOR regulation of autophagy. FEBS Lett. 2010;584(7):1287–1295. https://doi.org/10.1016/j.febslet.2010.01.017. PMID:20083114
- Boehlke C, Kotsis F, Patel V, et al. Primary cilia regulate mTORC1 activity and cell size through Lkb1. Nat. Cell Biol. 2010;12(11):1115–1122.
- Herbert T, Kilhams G, Batty I, et al. Distinct signalling pathways mediate insulin and phorbol ester-stimulated eukaryotic initiation factor 4F assembly and protein synthesis in HEK 293 cells. J Biol Chem. 2000;275(15):11249–11256. https://doi.org/10.1074/jbc.275.15.11249. PMID:10753934
- Wang L, Wang X, Proud C. Activation of mRNA translation in rat cardiac myocytes by insulin involves multiple rapamycin-sensitive steps. Am J Physiol Heart Circ Physiol. 2000;278(4):H1056–1068. https://doi.org/10.1152/ajpheart.2000.278.4.H1056. PMID:10749698
- Wang L, Proud C. Ras/Erk signaling is essential for activation of protein synthesis by Gq protein-coupled receptor agonists in adult cardiomyocytes. Circ Res. 2002;91(9):821–829. https://doi.org/10.1161/01.RES.0000041029.97988.E9. PMID:12411397
- Wang X, Proud C. The mTOR pathway in the control of protein synthesis. Physiology (Bethesda). 2006;21:362–369. PMID:16990457
- Fingar D, Salama S, Tsou C, et al. Mammalian cell size is controlled by mTOR and its downstream targets S6K1 and 4EBP1/eIF4E. Genes Dev. 2002;16(12):1472–1487. https://doi.org/10.1101/gad.995802. PMID:12080086
- Land S, Tee A. Hypoxia-inducible factor 1alpha is regulated by the mammalian target of rapamycin (mTOR) via an mTOR signaling motif. J Biol Chem. 2007;282(28):20534–20543. https://doi.org/10.1074/jbc.M611782200. PMID:17502379
- Heitman J, Movva N, Hall M. Targets for cell cycle arrest by the immunosuppressant rapamycin in yeast. Science. 1991;253(5022):905–909. https://doi.org/10.1126/science.1715094. PMID:1715094
- Kunz J, Henriquez R, Schneider U, et al. Target of rapamycin in yeast, TOR2, is an essential phosphatidylinositol kinase homolog required for G1 progression. Cell. 1993;73(3):585–596. https://doi.org/10.1016/0092-8674(93)90144-F. PMID:8387896
- Helliwell S, Wagner P, Kunz J, et al. TOR1 and TOR2 are structurally and functionally similar but not identical phosphatidylinositol kinase homologues in yeast. Mol Biol Cell. 1994;5(1):105–118. https://doi.org/10.1091/mbc.5.1.105. PMID:8186460
- Brown E, Albers M, Shin T, et al. A mammalian protein targeted by G1-arresting rapamycin-receptor complex. Nature. 1994;369(6483):756–758. https://doi.org/10.1038/369756a0. PMID:8008069
- Chiu M, Katz H, Berlin V. RAPT1, a mammalian homolog of yeast Tor, interacts with the FKBP12/rapamycin complex. Proc Natl Acad Sci USA. 1994;91(26):12574–12578. https://doi.org/10.1073/pnas.91.26.12574. PMID:7809080
- Sabatini D, Erdjument-Bromage H, Lui M, et al. RAFT1: a mammalian protein that binds to FKBP12 in a rapamycin-dependent fashion and is homologous to yeast TORs. Cell. 1994;78(1):35–43. https://doi.org/10.1016/0092-8674(94)90570-3. PMID:7518356
- Sabers C, Martin M, Brunn G, et al. Isolation of a protein target of the FKBP12-rapamycin complex in mammalian cells. J Biol Chem. 1995;270(2):815–822. https://doi.org/10.1074/jbc.270.2.815. PMID:7822316
- Zhu D, Shi S, Wang H, et al. Growth arrest induces primary-cilium formation and sensitizes IGF-1-receptor signaling during differentiation induction of 3T3-L1 preadipocytes. J Cell Sci. 2009;122(Pt 15):2760–2768. https://doi.org/10.1242/jcs.046276. PMID:19596798
- Wang H, Zou X, Wei Z, et al. Hsp90α forms a stable complex at the cilium neck for the interaction of signalling molecules in IGF-1 receptor signalling. J Cell Sci. 2015;128(1):100–108. https://doi.org/10.1242/jcs.155101. PMID:25359884
- Suizu F, Hirata N, Kimura K, et al. Phosphorylation-dependent Akt-Inversin interaction at the basal body of primary cilia. EMBO J. 2016;35(12):1346–1363. https://doi.org/10.15252/embj.201593003. PMID:27220846
- Gerhardt C, Lier J, Kuschel S, et al. The ciliary protein Ftm is required for ventricular wall and septal development. PLOS ONE. 2013;8(2):e57545. https://doi.org/10.1371/journal.pone.0057545. PMID:23469020
- Kwak M, Cho J, Huang B, et al. Role of increased expression of the proteasome in the protective effects of sulforaphane against hydrogen peroxide-mediated cytotoxicity in murine neuroblastoma cells. Free Radic Biol Med. 2007;43(5):809–817. https://doi.org/10.1016/j.freeradbiomed.2007.05.029. PMID:17664144
- Kapeta S, Chondrogianni N, Gonos E. Nuclear erythroid factor 2-mediated proteasome activation delays senescence in human fibroblasts. J Biol Chem. 2010;285(11):8171–8184. https://doi.org/10.1074/jbc.M109.031575. PMID:20068043
- Liu Y, Tsai I, Morleo M, et al. Ciliopathy proteins regulate paracrine signaling by modulating proteasomal degradation of mediators. J Clin Invest. 2014;124(5):2059–70. https://doi.org/10.1172/JCI71898. PMID:24691443
- Maiuri M, Criollo A, Tasdemir E, et al. BH3-only proteins and BH3 mimetics induce autophagy by competitively disrupting the interaction between Beclin 1 and Bcl-2/Bcl-X(L). Autophagy. 2007;3(4):374–376. https://doi.org/10.4161/auto.4237. PMID:17438366
- Seglen P, Gordon P. 3-Methyladenine: specific inhibitor of autophagic/lysosomal protein degradation in isolated rat hepatocytes. Proc Natl Acad Sci USA. 1982;79(6):1889–1892. https://doi.org/10.1073/pnas.79.6.1889. PMID:6952238
- Corbit K, Shyer A, Dowdle W, et al. Kif3a constrains beta-catenin-dependent Wnt signalling through dual ciliary and non-ciliary mechanisms. Nat Cell Biol. 2008;10(1):70–76. https://doi.org/10.1038/ncb1670. PMID:18084282
- Yuan S, Li J, Diener D, et al. Target-of-rapamycin complex 1 (Torc1) signaling modulates cilia size and function through protein synthesis regulation. Proc Natl Acad Sci USA. 2012;109(6):2021–2026. https://doi.org/10.1073/pnas.1112834109. PMID:22308353
- Cencic R, Carrier M, Trnkus A, et al. Synergistic effect of inhibiting translation initiation in combination with cytotoxic agents in acute myelogenous leukemia cells. Leuk Res. 2010;34(4):535–541. https://doi.org/10.1016/j.leukres.2009.07.043. PMID:19726085
- Gerhardt C, Leu T, Lier J, et al. The cilia-regulated proteasome and its role in the development of ciliopathies and cancer. Cilia. 2016;5:14. https://doi.org/10.1186/s13630-016-0035-3. PMID:27293550
- Mizushima N, Levine B. Autophagy in mammalian development and differentiation. Nat Cell Biol. 2010;12(9):823–830. https://doi.org/10.1038/ncb0910-823. PMID:20811354
- Cecconi F, Levine B. The role of autophagy in mammalian development: cell makeover rather than cell death. Dev Cell. 2008;15(3):344–357. https://doi.org/10.1016/j.devcel.2008.08.012. PMID:18804433
- Le Bot N. Autophagy: a new regulator of development. Nat Cell Biol. 2007;9(7):741. https://doi.org/10.1038/ncb0707-741. PMID:17603510
- Ryter S, Cloonan S, Choi A. Autophagy: a critical regulator of cellular metabolism and homeostasis. Mol Cells. 2013;36(1):7–16. https://doi.org/10.1007/s10059-013-0140-8. PMID:23708729
- Gerhardt C, Wiegering A, Leu T, et al. Control of Hedgehog signalling by the cilia-regulated proteasome. J Dev Biol. 2016;4(3):27. https://doi.org/10.3390/jdb4030027.
- Lippai M, Szatmári Z. Autophagy-from molecular mechanisms to clinical relevance. Cell Biol Toxicol. 2017;33(2):145–168. https://doi.org/10.1007/s10565-016-9374-5. PMID:27957648
- K M, Choi A, Ryter S. Emerging role of selective autophagy in human diseases. Front Pharmacol. 2014;5:244. PMID:25414669
- Gao Z, Gammoh N, Wong P, et al. Processing of autophagic protein LC3 by the 20S proteasome. Autophagy. 2010;6(1):126–137. https://doi.org/10.4161/auto.6.1.10928. PMID:20061800
- Li L, Zhong Q. Autophagosome-lysosome fusion: PIs to the rescue. EMBO J. 2016;35(17):1845–1847. https://doi.org/10.15252/embj.201695134. PMID:27440401
- Jiang P, Nishimura T, Sakamaki Y, et al. The HOPS complex mediates autophagosome-lysosome fusion through interaction with syntaxin 17. Mol Biol Cell. 2014;25(8):1327–1337. https://doi.org/10.1091/mbc.E13-08-0447. PMID:24554770
- Zhen Y, Li W. Impairment of autophagosome-lysosome fusion in the buff mutant mice with the VPS33A(D251E) mutation. Autophagy. 2015;11(9):1608–1622. https://doi.org/10.1080/15548627.2015.1072669. PMID:26259518
- Hasegawa J, Iwamoto R, Otomo T, et al. Autophagosome-lysosome fusion in neurons requires INPP5E, a protein associated with Joubert syndrome. EMBO J. 2016;35(17):1853–1867. https://doi.org/10.15252/embj.201593148. PMID:27340123
- Jia R, Guardia C, Pu J, et al. BORC coordinates encounter and fusion of lysosomes with autophagosomes. Autophagy. 2017;13(10):1648–1663. https://doi.org/10.1080/15548627.2017.1343768. PMID:28825857
- Borodovsky A, Kessler B, Casagrande R, et al. A novel active site-directed probe specific for deubiquitylating enzymes reveals proteasome association of USP14. EMBO J. 2001;20(18):5187–5196. https://doi.org/10.1093/emboj/20.18.5187. PMID:11566882
- Koulich E, Li X, DeMartino G. Relative structural and functional roles of multiple deubiquitylating proteins associated with mammalian 26S proteasome. Mol Biol Cell. 2008;19(3):1072–1082. https://doi.org/10.1091/mbc.E07-10-1040. PMID:18162577
- Lee B, Lee M, Park S, et al. Enhancement of proteasome activity by a small-molecule inhibitor of USP14. Nature. 2010;467(7312):179–184. https://doi.org/10.1038/nature09299. PMID:20829789
- Xu D, Shan B, Sun H, et al. USP14 regulates autophagy by suppressing K63 ubiquitination of Beclin 1. Genes Dev. 2016;30(15):1718–1730. https://doi.org/10.1101/gad.285122.116. PMID:27542828
- Zhao J, Brault J, Schild A, et al. FoxO3 coordinately activates protein degradation by the autophagic/lysosomal and proteasomal pathways in atrophying muscle cells. Cell Metab. 2007;6(6):472–483. https://doi.org/10.1016/j.cmet.2007.11.004. PMID:18054316
- Milan G, Romanello V, Pescatore F, et al. Regulation of autophagy and the ubiquitin-proteasome system by the FoxO transcriptional network during muscle atrophy. Nat Commun. 2015;6:6670. https://doi.org/10.1038/ncomms7670. PMID:25858807
- Su H, Li J, Osinska H, et al. The COP9 signalosome is required for autophagy, proteasome-mediated proteolysis, and cardiomyocyte survival in adult mice. Circ Heart Fail. 2013;6(5):1049–1057. https://doi.org/10.1161/CIRCHEARTFAILURE.113.000338. PMID:23873473
- Peth A, Boettcher J, Dubiel W. Ubiquitin-dependent proteolysis of the microtubule end-binding protein 1, EB1, is controlled by the COP9 signalosome: possible consequences for microtubule filament stability. J Mol Biol. 2007;368(2):550–563. https://doi.org/10.1016/j.jmb.2007.02.052. PMID:17350042
- Zhao J, Zhai B, Gygi S, et al. mTOR inhibition activates overall protein degradation by the ubiquitin proteasome system as well as by autophagy. Proc Natl Acad Sci U S A. 2015;112(52):15790–15797. https://doi.org/10.1073/pnas.1521919112. PMID:26669439
- Zhang Y, Nicholatos J, Dreier J, et al. Coordinated regulation of protein synthesis and degradation by mTORC1. Nature. 2014;513(7518):440–443. https://doi.org/10.1038/nature13492. PMID:25043031
- Zhao J, Garcia G, Goldberg A. Control of proteasomal proteolysis by mTOR. Nature. 2016;529(7586):E1–2. https://doi.org/10.1038/nature16472. PMID:26791731
- Zhang Y, Manning B. Zhang & Manning reply. Nature. 2016;529(7586):E2–3. https://doi.org/10.1038/nature16473. PMID:26791732
- Higginbotham H, Guo J, Yokota Y, et al. Arl13b-regulated cilia activities are essential for polarized radial glial scaffold formation. Nat Neurosci. 2013;16(8):1000–1007. https://doi.org/10.1038/nn.3451. PMID:23817546
- Osmulski P, Gaczynska M. Rapamycin allosterically inhibits the proteasome. Mol Pharmacol. 2013;84(1):104–113. https://doi.org/10.1124/mol.112.083873. PMID:23619386
- Wang X, Omura S, Szweda L, et al. Rapamycin inhibits proteasome activator expression and proteasome activity. Eur J Immunol. 1997;27(11):2781–2786. https://doi.org/10.1002/eji.1830271106. PMID:9394799
- Naumann P, Fortunato F, Zentgraf H, et al. Autophagy and cell death signaling following dietary sulforaphane act independently of each other and require oxidative stress in pancreatic cancer. Int J Oncol. 2011;39(1):101–109. PMID:21537844
- Herman-Antosiewicz A, Johnson D, Singh S. Sulforaphane causes autophagy to inhibit release of cytochrome C and apoptosis in human prostate cancer cells. Cancer Res. 2006;66(11):5828–5835. https://doi.org/10.1158/0008-5472.CAN-06-0139. PMID:16740722
- Lee J, Jeong J, Park S. Sulforaphane-induced autophagy flux prevents prion protein-mediated neurotoxicity through AMPK pathway. Neuroscience. 2014;278:31–39. https://doi.org/10.1016/j.neuroscience.2014.07.072. PMID:25130556
- Wang W, He Y, Yu G, et al. Sulforaphane Protects the Liver against CdSe Quantum Dot-Induced Cytotoxicity. PLoS One. 2015;10(9):e0138771. https://doi.org/10.1371/journal.pone.0138771. PMID:26402917
- Jo C, Gundemir S, Pritchard S, et al. Nrf2 reduces levels of phosphorylated tau protein by inducing autophagy adaptor protein NDP52. Nat Commun. 2014;5:3496. https://doi.org/10.1038/ncomms4496. PMID:24667209
- Liu Y, Hettinger C, Zhang D, et al. Sulforaphane enhances proteasomal and autophagic activities in mice and is a potential therapeutic reagent for Huntington's disease. J Neurochem. 2014;129(3):539–547. https://doi.org/10.1111/jnc.12647. PMID:24383989
- Lu L, Song H, Zhang W, et al. Potential role of 20S proteasome in maintaining stem cell integrity of human bone marrow stromal cells in prolonged culture expansion. Biochem Biophys Res Commun. 2012;422(1):121–127. https://doi.org/10.1016/j.bbrc.2012.04.119. PMID:22564728
- Papaevgeniou N, Sakellari M, Jha S, et al. 18α-Glycyrrhetinic acid proteasome activator decelerates aging and Alzheimer's disease progression in caenorhabditis elegans and neuronal cultures. Antioxid Redox Signal. 2016;25(16):855–869. https://doi.org/10.1089/ars.2015.6494. PMID:26886723
- Tang Z, Li T, Chang L, et al. Glycyrrhetinic acid triggers a protective autophagy by activation of extracellular regulated protein kinases in hepatocellular carcinoma cells. J Agric Food Chem. 2014;62(49):11910–11916. https://doi.org/10.1021/jf503968k. PMID:25403108
- Tang Z, Zhang L, Li T, et al. Glycyrrhetinic acid induces cytoprotective autophagy via the inositol-requiring enzyme 1α-c-Jun N-terminal kinase cascade in non-small cell lung cancer cells. Oncotarget. 2015;6(41):43911–43926. https://doi.org/10.18632/oncotarget.6084. PMID:26549806
- Lam H, Cloonan S, Bhashyam A, et al. Histone deacetylase 6-mediated selective autophagy regulates COPD-associated cilia dysfunction. J Clin Invest. 2013;123(12):5212–5230. https://doi.org/10.1172/JCI69636. PMID:24200693
- Xu Q, Liu W, Liu X, et al. Silibinin negatively contributes to primary cilia length via autophagy regulated by histone deacetylase 6 in confluent mouse embryo fibroblast 3T3-L1 cells. Mol Cell Biochem. 2016;420(1-2):53–63. https://doi.org/10.1007/s11010-016-2766-2. PMID:27435857
- Shin J, Bae D, Kim E, et al. Autophagy regulates formation of primary cilia in mefloquine-treated cells. Biomol Ther (Seoul). 2015;23(4):327–332. https://doi.org/10.4062/biomolther.2015.025. PMID:26157548
- Wang S, Livingston M, Su Y, et al. Reciprocal regulation of cilia and autophagy via the MTOR and proteasome pathways. Autophagy. 2015;11(4):607–616. https://doi.org/10.1080/15548627.2015.1023983. PMID:25906314
- Aburto M, Hurlé J, Varela-Nieto I, et al. Autophagy during vertebrate development. Cells. 2012;1(3):428–448. https://doi.org/10.3390/cells1030428. PMID:24710484
- Di Bartolomeo S, Nazio F, Cecconi F. The role of autophagy during development in higher eukaryotes. Traffic. 2010;11(10):1280–1289. https://doi.org/10.1111/j.1600-0854.2010.01103.x. PMID:20633243
- Yue Z, Jin S, Yang C, et al. Beclin 1, an autophagy gene essential for early embryonic development, is a haploinsufficient tumor suppressor. Proc Natl Acad Sci USA. 2003;100(25):15077–15082. https://doi.org/10.1073/pnas.2436255100. PMID:14657337
- Fimia G, Stoykova A, Romagnoli A, et al. Ambra1 regulates autophagy and development of the nervous system. Nature. 2007;447(7148):1121–1125. PMID:17589504
- Costello M, Brennan L, Basu S, et al. Autophagy and mitophagy participate in ocular lens organelle degradation. Exp Eye Res. 2013;116:141–150. https://doi.org/10.1016/j.exer.2013.08.017. PMID:24012988
- Basu S, Rajakaruna S, Reyes B, et al. Suppression of MAPK/JNK-MTORC1 signaling leads to premature loss of organelles and nuclei by autophagy during terminal differentiation of lens fiber cells. Autophagy. 2014;10(7):1193–1211. https://doi.org/10.4161/auto.28768. PMID:24813396
- Mellén M, de la Rosa E, Boya P, et al. The autophagic machinery is necessary for removal of cell corpses from the developing retinal neuroepithelium. Cell Death Differ. 2008;15(8):1279–1290. https://doi.org/10.1038/cdd.2008.40. PMID:18369370
- Qu X, Zou Z, Sun Q, et al. Autophagy gene-dependent clearance of apoptotic cells during embryonic development. Cell. 2007;128(5):931–946. https://doi.org/10.1016/j.cell.2006.12.044. PMID:17350577
- Gan B, Peng X, Nagy T, et al. Role of FIP200 in cardiac and liver development and its regulation of TNFalpha and TSC-mTOR signaling pathways. J Cell Biol. 2006;175(1):121–133. https://doi.org/10.1083/jcb.200604129. PMID:17015619
- Lee E, Koo Y, Ng A, et al. Autophagy is essential for cardiac morphogenesis during vertebrate development. Autophagy. 2014;10(4) Epub ahead of print. https://doi.org/10.4161/auto.27649.
- Stayner C, Shields J, Slobbe L, et al. Rapamycin-mediated suppression of renal cyst expansion in del34 Pkd1-/- mutant mouse embryos: an investigation of the feasibility of renal cyst prevention in the foetus. Nephrology (Carlton). 2012;17(8):739–747. https://doi.org/10.1111/j.1440-1797.2012.01639.x. PMID:22725947
- Saeki H, Kondo S, Morita T, et al. Immotile cilia syndrome associated with polycystic kidney. J Urol. 1984;132(6):1165–1166. https://doi.org/10.1016/S0022-5347(17)50080-4. PMID:6502812
- Pazour G, Dickert B, Vucica Y, et al. Chlamydomonas IFT88 and its mouse homologue, polycystic kidney disease gene tg737, are required for assembly of cilia and flagella. J Cell Biol. 2000;151(3):709–718. https://doi.org/10.1083/jcb.151.3.709. PMID:11062270