
ABSTRACT
Autophagy dysfunction is a potential toxic effect of nanoparticles. Previous studies have indicated that silica nanoparticles (SiNPs) induce macroautophagy/autophagy dysfunction, while the precise mechanisms remain uncertain. Hence, the present study investigated the molecular mechanisms by which SiNPs enhanced autophagosome synthesis, which then contributed to autophagy dysfunction. First, the effects of SiNPs on autophagy and autophagic flux were verified using transmission electron microscopy, laser scanning confocal microscopy, and western blot assays. Then, the activation of endoplasmic reticular (ER) stress was validated to be through the EIF2AK3 and ATF6 UPR pathways but not the ERN1-XBP1 pathway, along with the upregulation of downstream ATF4 and DDIT3. Thereafter, the ER stress inhibitor 4-phenylbutyrate (4-PBA) was used to verify that SiNP-induced autophagy could be influenced by ER stress. Furthermore, specialized lentiviral shRNA were employed to determine that autophagy was induced via specific activation of the EIF2AK3 and ATF6 UPR pathways. Finally, the 2 autophagic genes LC3B and ATG12 were found to be transcriptionally upregulated by downstream ATF4 and DDIT3 in ER stress, which contributed to the SiNP-enhanced autophagosome synthesis. Taken together, these data suggest that SiNPs induced autophagosome accumulation via the activation of the EIF2AK3 and ATF6 UPR pathways in hepatocytes, which offers a new insight into detailed molecular mechanisms underlying SiNP-induced autophagy dysfunction, and specifically how UPR pathways regulate key autophagic genes. This work provides novel evidence for the study of toxic effects and risk assessment of SiNPs.
Introduction
Autophagy refers to an intracellular degradation process of macromolecules and organelles, and it is critical to maintain cellular homeostasis. Macroautophagy/autophagy induction is widespread in nanoparticle-induced biological responses [Citation1]. Plenty of nanoparticles have been reported to induce autophagy, such as quantum dots [Citation2], silver nanoparticles (AgNPs) [Citation3], gold nanoparticles [Citation4], silica nanoparticles [Citation5], rare earth oxides [Citation6], and polystyrene particles [Citation7]. In addition, some nanoparticles were found to cause autophagy dysfunction. For instance, carbon-based nanostructures were reported to inhibit autophagic flux in human umbilical vein endothelial cells (HUVECs) [Citation8], while AgNPs were able to cause defective autophagy and lysosomal dysfunction [Citation9,Citation10]. Furthermore, Stern’s group proposed that autophagy dysfunction was a potential toxic effect of nanoparticles [Citation1]. Autophagy dysfunction could be caused by excessive autophagy induction and blockage of autophagosome degradation, leading to cytotoxicity, inflammation, cancer-related signaling pathways, and even cell death [Citation11–Citation13]. Thus, autophagy dysfunction could result in certain diseases, such as cancer, metabolic disorders, inflammation, infections, and neurodegenerative diseases [Citation14].
Silica nanoparticles (SiNPs) are one of the most widely used engineered nanomaterials. SiNPs with favorable properties (biocompatibility and biodegradability) have been widely exploited in the cosmetics, food, and pharmaceutical industries and in the biomedical fields [Citation15–Citation18]. With the widespread prevalence of SiNPs, potential dermal, oral, or intranasal exposure chances have increased. The associated concerns with regard to human health and the environment are the main driving forces for the toxicological investigation of SiNPs. Therefore, it is necessary to study the detailed toxic mechanisms of SiNPs, which helps with their risk assessment and safety evaluation.
SiNPs have been shown to induce autophagy in various cell lines, such as HCT-116 human colon cancer cells, HepG2 human hepatoma cells, HUVECs, and RAW 264.7 murine macrophage cells [Citation3,Citation19–Citation21]. Moreover, our group and others have also reported that SiNPs induce autophagy dysfunction via lysosomal impairment and inhibition of autophagosome degradation [Citation5,Citation22]. Based on the aforementioned clues, we speculated that SiNP-induced autophagy dysfunction occurs via 2 mechanisms: first, through autophagy induction and enhanced autophagosome synthesis, and second, by autophagic degradation blockage. However, their exact mechanisms have been poorly understood. In the present study, we mainly focused on investigating the mechanisms through which SiNPs induced autophagy activation and enhanced autophagosome synthesis.
Endoplasmic reticulum (ER) stress is a kind of sensitive cellular stress that can be induced by external or internal factors, such as metabolic disturbances, inflammation, and oxidative stress [Citation23]. Oxidative stress is the main toxic paradigm of most nanoparticles [Citation24]. SiNPs are reported to stimulate reactive oxygen species (ROS) generation in vivo and in vitro [Citation25–Citation28]. ROS could cause oxidative stress, ER stress, inflammation, and consequent damage to proteins and subcellular organelles [Citation29,Citation30]. Oxidative stress and ER stress are interconnected, and oxidative stress usually induces ER stress [Citation31]. When ER stress occurs, a well-orchestrated signaling network called the unfolded protein response (UPR) is activated [Citation32]. The UPR is regulated by 3 ER unique sensors: EIF2AK3 (eukaryotic translation initiation factor 2 alpha kinase 3), ATF6 (activating transcription factor 6), and ERN1/IRE1 (endoplasmic reticulum to nucleus signaling 1). All 3 of these pathways activate distinct transcription factors: EIF2AK3 pathway activates ATF4 (activating transcription factor 4) and DDIT3 (DNA damage inducible transcript 3), ATF6 pathway activates DDIT3, and ERN1/IRE1pathway activates spliced XBP1 (X-box binding protein 1) [Citation33,Citation34]. Certain nanoparticles have been reported to induce ER stress, such as titanium dioxide nanoparticles (TiO2 NPs) [Citation35], AgNPs [Citation36], and iron oxide nanoparticles [Citation37].
ER stress may activate autophagy [Citation38,Citation39], and the relationship between ER stress and autophagy is complex [Citation31,Citation40]. Emerging evidence has indicated that ER stress regulates autophagy via mediating the transcription of autophagy-related genes (ATG) [Citation41]. The EIF2AK3-EIF2S1 (eukaryotic translation initiation factor 2 subunit alpha) pathway is essential for autophagy induction, and downstream ATF4 and DDIT3 have been shown to transcriptionally regulate a number of ATG genes, such as MAP1LC3B/LC3B (microtubule associated protein 1 light chain 3 beta), ATG5, ATG12, BECN1 (beclin 1), and ATG16L1 [Citation41]. In addition, spliced XBP1 is reported to upregulate the transcription of BECN1, indicating that the ERN1-XBP1 pathway is also implicated in the activation of autophagy [Citation42], while the role of ER stress in SiNP-induced autophagy remains unclear as of yet.
Hence, we proposed that SiNPs stimulate ROS generation, and then induce the oxidative stress and ER stress that lead to autophagy activation, which accelerated autophagosome accumulation causing autophagy dysfunction. In this study, firstly the effects of SiNPs on autopahgy and autophagic flux were measured. Then, the activation of the 3 UPR pathways induced by SiNPs was detected. Furthermore, the effect of ER stress on SiNP-induced autophagy was evaluated. Eventually, lentiviral shRNAs were employed to deeply investigate the molecular mechanism by which SiNPs enhanced autophagosome synthesis. This work unraveled a specific mechanism through which SiNPs induce autophagosome accumulation via the activation of the EIF2AK3 and ATF6 UPR pathways in hepatocytes, which contributes to autophagy dysfunction.
Results
Characterization of SiNPs
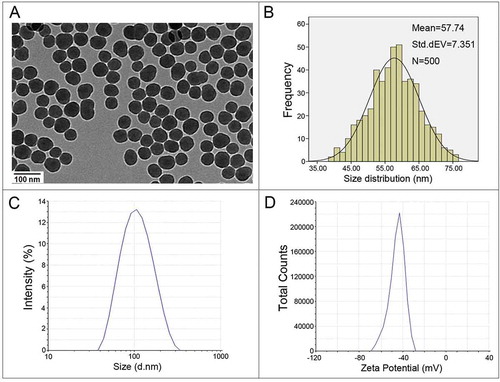
The SiNPs were fully characterized as shown in . Transmission electron microscopy (TEM) images showed that all of the particles exhibited near-spherical shape and good dispersibility (). The size distribution indicated that the average diameter of the SiNPs was approximately 58 nm (). As depicted in , the hydrodynamic sizes, zeta potential, and polydispersity index (PDI) of SiNPs in distilled water and serum-free media were measured by dynamic light scattering (DLS). The hydrodynamic sizes of the SiNPs remained stable over 48 h. The zeta potentials of the SiNPs at different time points were greater than (–) 30 mV. The PDI of the SiNPs suspensions was lower than 0.2. In addition, the representative hydrodynamic size and zeta potential of the SiNPs in distilled water at 24 h are shown in , indicating high homogeneity, monodispersity, and stability. In addition, the purity of the SiNPs was higher than 99.9%, and the limulus amebocyte lysate (LAL) assay indicated no detectable gram-negative endotoxin in the SiNP suspensions at concentrations of 0.75, 1.5, 3, 6, and 12 mg/ml (data not shown). These data demonstrated that the prepared SiNPs possessed good purity, stability, and monodispersity both in the distilled water and media.
Table 1. Hydrodynamic size and zeta potential of the SiNPs in dispersion media.
Figure 1. Characterization of SiNPs. (a) TEM analysis shows SiNPs exhibit near-spherical shape and good dispersibility. Scale bar: 100 nm. (b) Size-distribution histograms were obtained using ImageJ software. The average SiNP diameter was 57.74 ± 7.35 nm. (c) The hydrodynamic sizes and (d) zeta potential of SiNPs in distilled water.
Cellular internalization and cytotoxicity of SiNPs
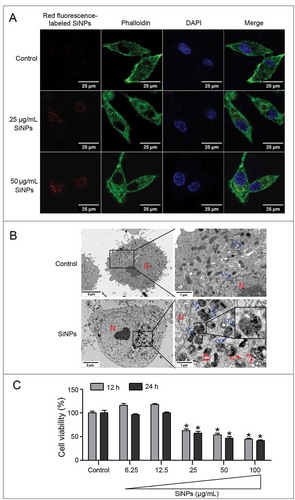
Since the cellular internalization and localization of the SiNPs directly affect their biological and toxicological response, their intracellular distribution was observed using laser scanning confocal microscopy (LSCM) and TEM. LSCM images indicated that red fluorescence-labeled SiNPs were taken up by L-02 cells post 24 h-treatment. With an increase in SiNP dose, the amount of internalized SiNPs also increased (). L-02 cells treated with SiNPs clearly manifested the prominent accumulation of electron-dense particles in the cytoplasm as well as enclosed in the vesicles. The enlarged image showes that a number of SiNPs were gathered in the lysosomes and autolysosomes (). In addition, the cytotoxicity of the SiNPs was evaluated by CCK-8 cell counting assay. L-02 cells were treated with different doses of SiNPs (6.25, 12.5, 25, 50, and 100 μg/ml) for 12 h and 24 h, and the data showed that the SiNPs decreased the cell viability in a dose- and time-dependent manner ().
Figure 2. Cellular uptake and cytotoxicity of the SiNPs in the L-02 cells. (a) LSCM images of the L-02 cells with 25 μg/ml and 50 μg/ml red fluorescence-labeled SiNPs treatment for 24 h. Cells were fixed and assessed by staining the cytoskeleton with Acti-stain™488 phalloidin (green) and nuclei with DAPI (blue).Scale bar: 25 µm (b) TEM images of the L-02 cells with 25 μg/ml SiNPs treatment for 24 h. No SiNPs were observed in the control group and the subcellular structures were normal. Electron-dense SiNPs were dispersed in the cytoplasm, lysosomes, and autolysosomes in the SiNP-treated cells. The magnification view of the selected area shows lysosomes (blue arrows), autolysosomes (red arrows) containing aggregated SiNPs. N, nucleus; LY, lysosome; and AL, autolysosome. Scale bars: 1 μm and 5 μm. (c) Cytotoxicity was analyzed by a CCK-8 kit. The L-02 cells were treated with different doses of SiNPs (6.25, 12.5, 25, 50, and 100 μg/ml) for 12 h and 24 h. Data are expressed as mean ± SD. ··· p · 0.05 versus the control.
SiNPs activate autophagy and enhance autophagosome accumulation
TEM, LSCM, and western blot assays were performed to confirm the effects of the SiNPs on autophagy and autophagic flux in the L-02 cells. As shown in , the subcellular organelles are morphologically normal in the untreated control cells with rare autophagic vacuoles, while there are many double-membrane autophagosomes and single-membrane autolysosomes in the SiNP-treated L-02 cells. The immunofluorescence assay combined with LSCM was performed to observe the pattern of cytoplasmic LC3B distribution. As shown in , LC3B is expressed dispersedly throughout the cytoplasm in the untreated control cells, whereas it is accumulated as specific puncta in the SiNP-treated cells. Quantitative analysis further revealed that the LC3B puncta increased in the SiNP-treated cells. The conversion of LC3B-I to LC3B-II and SQSTM1/p62 (sequestosome 1) degradation were used as the markers of autophagy activation. Western blot assay showed that the expression of LC3B-II was increased in a dose-dependent manner, while SQSTM1 degradation was not detected (). Generally, SQSTM1 is degraded in a normal complete autophagic process, while no obvious change in SQSTM1 degradation in L-02 cells implies that SiNPs might block the autophagic flux and inhibit the degradation of autophagosomes.
Figure 3. SiNPs activate autophagy and enhance autophagosome accumulation in the L-02 cells. (a) TEM images show that the autophagosomes accumulated in the L-02 cells with 25 μg/ml SiNPs treatment for 24 h. Red arrow, double-membrane autophagosome or single-membrane autolysosome. N, nucleus.Scale bars, 0.2 μm and 1 μm. (b) LSCM images of indirect immunofluorescence analysis show the LC3B distribution patterns in the control and SiNP-treated cells. LC3B (green) and DAPI staining of nuclei (blue) is shown. Scale bar: 25 μm. The number of punctate LC3B per cell in the untreated control and SiNP-treated cells is shown. Data are expressed as mean ± SD. *· p · 0.05 versus the control. (c) The L-02 cells were treated with 12.5, 25, and 50 μg/ml of SiNPs for 24 h. (d) The L-02 cells were pretreated with (+) or without (–) 10 nM BafA1 for 2 h, then the cells were treated with 12.5, 25, and 50 μg/ml of SiNPs for another 24 h. Thereafter, (c) and (d) cells were harvested and the expressions of LC3B and SQSTM1 were analyzed by western blot. Blots are representative of 3 independent experiments. ACTB was used as the sample-loading control. Densitometric LC3B-II:ACTB and SQSTM1:ACTB ratios from at least 3 independent experiments are shown. The value of the control without any treatment was set at 1 for each experiment (*, p < 0.05; N.S., not significant).
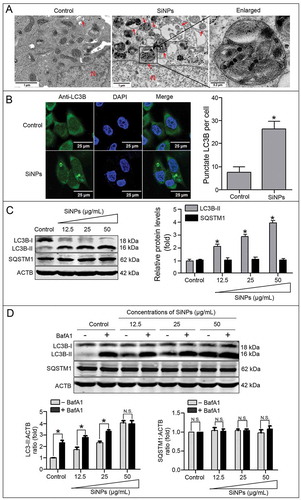
To further confirm the cause of autophagosome accumulation induced by the SiNPs, the expression of LC3B-II and SQSTM1 was measured in the absence or presence of Bafilomycin A1 (BafA1), a specific inhibitor of vacuolar-type H+-ATPase (V-ATPase), which inhibits the fusions of autophagosomes with lysosomes [Citation43]. With the BafA1 treatment, the LC3B-II accumulation further increased in the 12.5 and 25 μg/ml SiNP-treated groups, while there was no more LC3B-II accumulation in the 50 μg/ml SiNP-treated group in the presence of the BafA1, implying that autophagic flux was blocked (). The results indicating a higher level of LC3-II in the SiNP-treated groups than the control group with BafA1 treatment suggest that the SiNPs induced autophagy as well. Therefore, SiNPs cause autophagy dysfunction through a combination of both autophagy induction and autophagic flux blockage.
SiNPs induce ER stress via activating the EIF2AK3 and ATF6 pathways but not the ERN1-XBP1 pathway
ER stress is a sensitive cellular response that regulates autophagy through complicated mechanisms [Citation44]. To explore whether SiNPs induced autophagy through ER stress activation, we first investigated the effects of SiNP exposure on ER stress. The LSCM images show that the red fluorescence-labeled SiNPs colocalized with ER-Tracker Green probes, indicating that the SiNPs accumulated in the ER lumen (Figure 4(a)). Moreover, TEM observation indicated that the rough ER was intact, with a number of ribosomes attached in the untreated control cells, while degranulation of rough ER occurred in SiNP-treated cells ().
Figure 4. SiNPs induce ER stress via selectively activating the EIF2AK3 and ATF6 pathways. (a) LSCM images indicate that SiNPs were localized in the ER lumen. The L-02 cells were treated with 50 μg/ml red fluorescence-labeled SiNPs for 24 h. Thereafter, the living cells were stained with 1 μM of ER-Tracker Green probes at 37°C for 30 min, then the cells were stained with 20 ng/ml of Hoechst 33,342 at 37°C for another 30 min, and they were finally imaged by LSCM. SiNPs (red), ER-Tracker Green probes (green), and Hoechst 33,342 staining of the nuclei (blue) are shown. Scale bar: 10 μm. (b) TEM images of the L-02 cells with 25 μg/ml SiNP treatment for 24 h showed that the SiNPs caused ER ultrastructure damage and degranulation of rough ER. Red arrow, ER. N, nucleus. Scale bar: 0.2 μm. (c) SiNPs activated the EIF2AK3 and ATF6 pathways. The L-02 cells were treated with 6.25, 12.5, 25, 50, and 100 μg/ml of SiNPs for 24 h. Thereafter, the cells were harvested and the expression of HSPA5, EIF2AK3 (p-Thr980), EIF2AK3, EIF2S1 (p-Ser51), EIF2S1, ATF6, ATF4, and DDIT3 were analyzed by western blot using the indicated antibodies. Blots are representative of 3 independent experiments. ACTB was used as a sample-loading control. Densitometric HSPA5:ACTB, ATF4:ACTB, and DDIT3:ACTB ratios from at least 3 independent experiments are shown. The value of control without any treatment was set at 1 for each experiment (*, p < 0.05). (d) Frame diagrams of XBP1 mRNA splicing. XBP1 mRNA splicing involves cleavage of a 26-bp fragment containing the PstI site and shifting of the open reading frame (ORF), thus the spliced XBP1 does not contain the PstI site. (e) SiNPs did not activate the ERN1-XBP1 pathway of the UPR. The L-02 cells were treated with 12.5, 25, and 50 μg/ml of SiNPs for 24 h. Thereafter, the cells were harvested and RT-PCR was performed using XBP1-specific primers, and the PCR products were digested by PstI. The unsplicedXBP1 products were digested into 295-bp and 147-bp fragments in both the control andSiNP-treated groups, while the 416-bp spliced XBP1 products could not be digested by PstI in the positive thapsigargin (Tg)-treated group. XBP1(u): unspliced XBP1; XBP1(s): spliced XBP1. ACTB was used as the loading control.
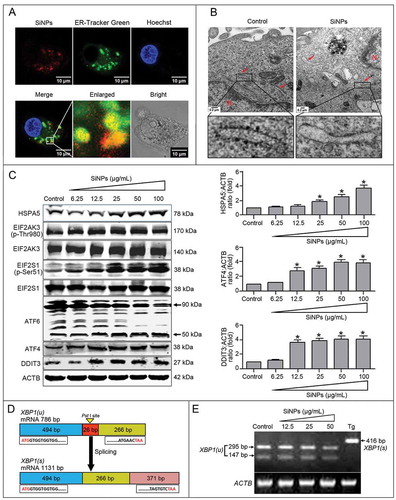
Then, we evaluated whether the SiNPs activated ER stress via the EIF2AK3, ATF6, and/or ERN1-XBP1 pathways. Upon ER stress, HSPA5 (heat shock protein family A [Hsp70] member 5) was released to the cytoplasm and its expression was upregulated. The results showed that the SiNPs increased the expression of HSPA5 compared with the untreated control group (). Moreover, higher levels of EIF2AK3 and EIF2S1 phosphorylation were observed in the SiNP-treated groups than that in the untreated control group. Subsequently, the phosphorylated EIF2AK3 and EIF2S1 upregulated ATF4 and DDIT3 expression in the SiNP-treated groups. In response to ER stress, ATF6 is translocated from the ER to Golgi apparatus and cleaved, releasing the active N-terminal 50 kDa ATF6. The western blot data in indicates that the SiNPs enhance the degradation of 90-kDa ATF6 precursors and increase the level of 50-kDa cleavage fragments, along with DDIT3 upregulation. These results indicated that the SiNPs activated the ATF6 pathway. Subsequently, reverse transcription-polymerase chain reaction (RT-PCR) and PstI digestion assays were conducted to determine whether the ERN1-XBP1 pathway was activated. Upon ERN1 activation, XBP1 mRNA was spliced and a 26-base pair (bp) fragment was cleaved, leading to the loss of the PstI restriction site (). Therefore, the 416-bp RT-PCR products from the Tg-treated positive control group were resistant to PstI digestion, whereas the products from the SiNP-treated and control groups were able to be digested by PstI, generating a 295-bp and 147-bp band, respectively, suggesting inactivation of the ERN1-XBP1 pathway. These data indicated that the SiNPs induced ER stress through the activation of the EIF2AK3 and ATF6 pathways but not the ERN1-XBP1 pathway.
SiNPs induce autophagy through the activation of ER stress
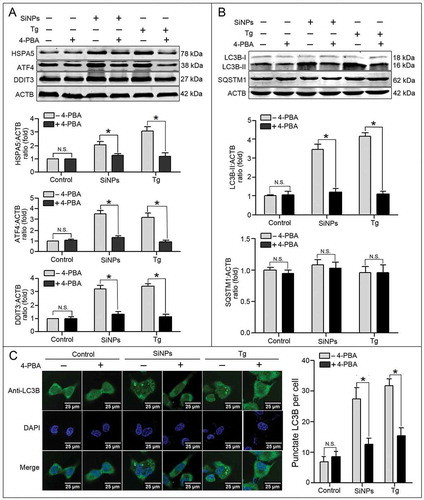
To verify whether SiNPs induced autophagy through ER stress, we speculated that the inhibition of ER stress would suppress SiNP-induced autophagy. First, the ER stress inhibitor 4-phenylbutyrate (4-PBA) was used to inhibit the SiNP-induced ER stress. The results in Figure 5(a) show that 4-PBA treatment decreased the expression of HSPA5, ATF4, and DDIT3 in the SiNP-treated and Tg-treated groups. In addition, 4-PBA treatment also inhibited the upregulation of LC3B-II induced by SiNPs, indicating that the autophagy induction was suppressed (). Furthermore, punctate LC3B and quantitative analysis revealed that 4-PBA treatment decreased the number of LC3B puncta in the SiNP-treated cells and Tg-treated cells (). Thus, the inhibition of ER stress by 4-PBA treatment suppressed SiNP-induced autophagy, suggesting that SiNPs induce autophagy via activating ER stress.
Figure 5. 4-phenylbutyric acid (4-PBA) inhibits SiNP-induced ER stress and autophagy. (a, b) L-02 cells incubated with 25 μg/ml SiNPs were treated with (+) or without (–) 5 mM 4-PBA (ER stress inhibitor) for 12 h before harvesting at 24 h. The L-02 cells that were treated with 300 nM thapsigargin (Tg, a chemical known to rapidly elicit ER stress) for 12 h were used as the positive control. Thereafter, the cells were harvested and the expressions of HSPA5, ATF4, DDIT3, LC3B, and SQSTM1 were analyzed by western blot using the indicated antibodies. Blots are representative of 3 independent experiments. ACTB was used as a sample-loading control. Densitometric HSPA5:ACTB, ATF4:ACTB, DDIT3:ACTB, LC3B-II;ACTB, and SQSTM1;ACTB ratios from at least 3 independent experiments are shown. The value of control without any treatment was set at 1 for each experiment (*, p < 0.05). (c) The LC3B distribution patterns in (a, b) cells were analyzed using indirect immunofluorescence with anti-LC3B antibodies and imaged by LSCM. LC3B (green) and DAPI staining of the nuclei (blue) are shown. Scale bar: 25 μm. The number of punctate LC3B per cell in the untreated control and SiNP-treated cells is shown. Data are expressed as mean ± SD. ··· p · 0.05 versus the control.
SiNP-induced autophagy is mediated by the EIF2AK3 and ATF6 UPR pathways
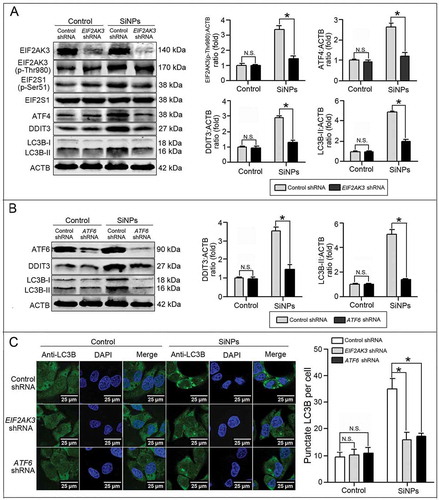
To further investigate the specific mechanism by which SiNPs induced autophagy via ER stress, EIF2AK3 and ATF6 were knocked down using lentiviral-based shRNA in L-02 cells. The knockdown efficiency varied between 80% and 90% (Figure 6(a,b)). Next, we investigated the consequence of EIF2AK3 and ATF6 knockdown on the EIF2AK3 and ATF6 pathways. As shown in , EIF2AK3 knockdown decreased EIF2AK3 and EIF2S1 phosphorylation and decreased ATF4 and DDIT3 expression in the SiNP-treated group. Similarly, ATF6 knockdown decreased the DDIT3 expression in the SiNP-treated group (). Meanwhile, we studied the effects of EIF2AK3 and ATF6 knockdown on SiNP-induced autophagy. Western blot assay revealed that the knockdown of EIF2AK3 or ATF6 reversed SiNP-induced augmentation of LC3B-II (). Quantitative analysis of punctate LC3B further revealed that the knockdown of EIF2AK3 or ATF6 decreased the number of LC3B puncta in the SiNP-treated group (). These data indicated thatSiNPs induced autophagy via activating the EIF2AK3 and ATF6 UPR pathways.
Figure 6. SiNP-induced autophagy is mediated by the EIF2AK3 and ATF6 UPR pathways. (a, b) The L-02 cells were incubated with lentiviral shRNA against EIF2AK3 (a) and ATF6 (b) (MOI = 1) for 3 h, then replaced with fresh complete media and treated with 25 μg/ml SiNPs for 24 h before harvesting at 72 h post-transduction. Thereafter, the cells were harvested and western blot was performed using the indicated antibodies. Blots are representative of 3 independent experiments. ACTB was used as the sample loading control. The densitometric EIF2AK3(p-Thr980):ACTB, ATF4:ACTB, DDIT3:ACTB, and LC3B-II:ACTB ratios from at least 3 independent experiments are shown in (a). The densitometric DDIT3:ACTB and LC3B-II:ACTB ratios from at least independent experiments are shown in (b). The value of the control cells with control shRNA was set at 1 for each experiment (*, p < 0.05; N.S., not significant). (c) The LC3B distribution patterns in (a, b) cells were analyzed using indirect immunofluorescence with anti-LC3B antibodies and imaged by LSCM. LC3B (green) and DAPI staining of the nuclei (blue) are shown. Scale bar: 25 μm. The number of punctate LC3B per cell in the untreated control and SiNP-treated cells is shown. Data are expressed as mean ± SD. ··· p · 0.05 versus the control.
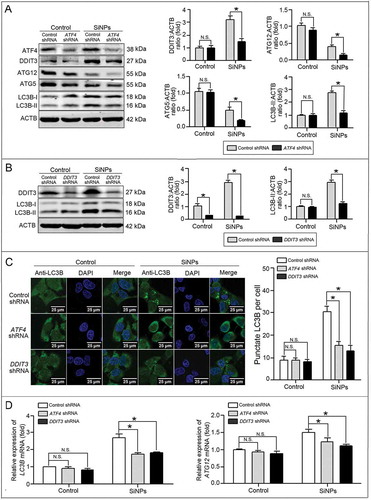
SiNPs enhance autophagosome synthesis via LC3B and ATG12 transcriptional upregulation modulated by ATF4 and DDIT3
The above intriguing results encouraged us to further explore the distinct mechanisms of SiNP-induced autophagy. The formation of autophagosomes is mediated by 2 ubiquitin-like protein conjugation systems, including phosphatidylethanolamine (PE)-conjugated LC3B (LC3B-II) and ATG12-ATG5-ATG16L1 complexes. Therefore, 2 key molecules LC3B and ATG12 were detected by western blot, and the data showed that the SiNPs upregulated LC3B-II expression but decreased ATG12 and ATG5 expression (). Moreover, in the SiNP-treated groups, ATF4 knockdown further inhibited the expression of LC3B-II, ATG12, and ATG5 to a lower level than control shRNA did. Meanwhile, there was no obvious change of ATG12 and ATG5 expression in the control group with or without ATF4 shRNA treatment. Similarly, DDIT3 knockdown also decreased LC3B-II expression in the SiNP-treated cells (). Verification was further performed using immunofluorescence and the LSCM assay. The LSCM images showed that knocking down ATF4 and DDIT3 decreased the LC3B puncta numbers in the SiNP-treated cells (). Furthermore, real-time PCR showed that the SiNPs increased the expression of LC3B and ATG12 mRNA, while the knockdown of ATF4 and DDIT3 decreased their expression accordingly ()). Therefore, we concluded that the SiNPs enhanced autophagosome synthesis via LC3B and ATG12 transcriptional upregulation modulated by ATF4 and DDIT3.
Figure 7. LC3B and ATG12 were transcriptionally upregulated by downstream ATF4 and DDIT3 in ER stress.(a, b) L-02 cells were incubated with lentiviral shRNA against ATF4 (a) and DDIT3 (b) (MOI = 1) for 3 h, then replaced with fresh complete media and treated with 25 μg/mlSiNPsfor 24 h before harvesting at 72 h post-transduction. Thereafter, the cells were harvested and western blot was performed using the indicated antibodies. Blots are representative of 3 independent experiments. ACTB was used as the sample loading control. The densitometric DDIT3:ACTB, ATG12:ACTB, ATG5:ACTB, and LC3B-II:ACTB ratios from at least 3 independent experiments are shown in (a). The densitometric DDIT3:ACTB and LC3B-II:ACTB ratios from at least 3 independent experiments are shown in (b). The value of the control cells with control shRNA was set at 1 for each experiment (*, p < 0.05). (c) The LC3B distribution patterns in (a, b) cells were analyzed using indirect immunofluorescence with anti-LC3B antibodies and imaged by LSCM. LC3B (green) and DAPI staining of the nuclei (blue) are shown. Scale bar: 25 μm. The number of punctate LC3B per cell in the untreated control and SiNP-treated cells are shown. Data are expressed as means ± SD. ··· p · 0.05 compared with the control. (d) Knockdown of ATF4 and DDIT3 inhibited LC3B and ATG12 mRNA expression. The L-02 cells were incubated with lentiviral shRNA against ATF4 and DDIT3 (MOI = 1) for 3 h, then replaced with the fresh complete media and treated with 25 μg/ml SiNPs for 24 h before harvesting at 72 h post-transduction. Thereafter, the cells were harvested and the real-time PCR assay was performed. Data are representative of 3 independent experiments (*, p < 0.05).
Discussion
Autophagy dysfunction is considered to be a potential toxic effect of nanoparticles that results in cytotoxicity, inflammation, cell death, and even diseases [Citation1,Citation12–Citation14]. Recent studies have determined there are various mechanisms involved in nanoparticle-induced autophagy, including the induction of autophagy initiation, the increase of autophagosome synthesis, the inhibition of autophagic flux, and blockage of autophagosome degradation [Citation45]. Autophagy dysfunction is caused by extensive autophagosome accumulation. Our previous studies have indicated that SiNPs induced autophagy dysfunction [Citation5,Citation20,Citation21], but the specific underlying mechanisms remained unclear. In the present study, we focused on investigating the mechanisms by which SiNPs enhanced autophagosome synthesis to make clear the cause of consequent autophagy dysfunction.
First, we verified the effect of the SiNPs on autophagy and autophagic flux in the L-02 cells using TEM, LSCM, and western blot assays. The results showed that the SiNPs activated autophagy and enhanced autophagosome formation, while the autophagic flux was blocked (). Based on these crucial phenomena, we further investigated the related mechanisms. The internalized SiNPs induced a large amount of ROS generation (as indicated in Fig.S1), which damaged the ultrastructures and normal functions of organelles, such as the ER, which is a complex organelle in which protein synthesis, folding, maturation, and transport take place. ER homeostasis is very sensitive to several stimuli, including metabolic disturbances, inflammation, and oxidative stress. Once ER homeostasis is disturbed, ER stress is provoked.
Then, we evaluated the effects of SiNPs on ER stress. We observed that the SiNPs localized in the ER lumen and caused the degranulation of rough ER. Moreover, we found that the SiNPs selectively activated ER stress via activating the EIF2AK3 and ATF6 pathways but not the ERN1-XBP1pathway. Our results are partially in line with a recent report, which also showed that SiNPs localized in the ER and induced ER autophagy in human colon cancer cells [Citation19]. Another report showed that SiNPs activated ER stress via HSPA5 upregulation and XBP1 splicing [Citation42], while our results indicated that SiNPs not only enhanced HSPA5 expression but also activated the EIF2AK3 and ATF6 pathways. What is different is that our results proposed that SiNPs did not activate the ERN1-XBP1 pathway. Such conflicting data might be attributed to the different types of SiNPs and cell models used. Our group treated L-02 cells with colloidal SiNPs prepared by the Stöber method, and another laboratory treated Huh7 cells with fumed SiNPs [Citation42]. Due to the potential role of ROS in SiNP-induced biological responses, we conducted a supplemental experiment to confirm that SiNPs induced ER stress and that autophagy was mediated by stimulating ROS generation (data are shown in Fig. S1).
Thereafter, inhibition of UPR using the ER stress inhibitor 4-PBA in SiNP-treated cells decreased the conversion of LC3B-I to LC3B-II, suggesting that SiNPs induced autophagy via ER stress activation. In addition, we have demonstrated that SiNPs induced autophagy via activating the EIF2AK3 and ATF6 pathways. However, the autophagy was not fully inhibited by EIF2AK3 and ATF6 knockdown, indicating that other signaling pathways independent of ER stress might be involved in SiNP-induced autophagy. For example, SiNP-induced ROS could activate MAPK (mitogen-activated protein kinase) following the inhibition of the MTOR (mechanistic target of rapamycin kinase) pathway, resulting in autophagy activation [Citation46].
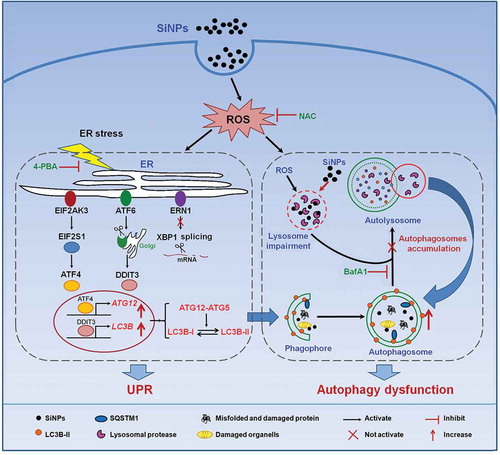
Figure 8. Schematic illustration of the proposed molecular mechanism by which SiNPs induce autophagosome accumulation and aggravate autophagy dysfunction. SiNPs were endocytosed into L-02 cells and stimulated ROS generation. The internalized SiNPs triggered ER stress through the activation of the EIF2AK3 and ATF6 pathways but not the ERN1-XBP1 pathway, along with the upregulation of ATF4 and DDIT3. Then, the 2 factors were translocated to the nucleus and increased the transcriptional expressions of 2 key autophagic genes LC3B and ATG12, contributing to autophagosome formation. Previous study has shown that the internalized SiNPs impaired the lysosomes and inhibited the degradation of the autophagosomes. Therefore, SiNPs induce the autophagosome accumulation and aggravate the autophagy dysfunction.
Furthermore, we attempted to explore how ER stress and UPR activated SiNP-induced autophagy. In the present study, the results indicated that SiNPs increased the expression of ATF4 and DDIT3 in the EIF2AK3 and ATF6 pathways, respectively. ATF4 and DDIT3 could transcriptionally regulate certain ATGs involved in autophagosome formation and maturation [Citation41]. Our data verified that SiNPs upregulated the mRNA levels of LC3B and ATG12. These 2 genes belong to 2 ubiquitin-like conjugation systems, respectively, the ATG12 and the ATG8/LC3B systems, which directly contribute to the elongation of phagophores and the maturation of autophagosomes [Citation47]. Moreover, ATF4 and DDIT3 knockdown in SiNP-treated cells suppressed the mRNA expression of LC3B and ATG12, while at the protein level, the SiNPs only increased LC3B-II expression and unexpectedly decreased the expression of ATG12 and ATG5. However, when knocking down ATF4, the protein levels of LC3B-II, ATG12, and ATG5 in the SiNP-treated groups were totally decreased; the protein level of LC3B-II was also reduced with DDIT3 knockdown treatment in the SiNP-treated groups. Although the expression of ATG12 and ATG5 were decreased by the SiNPs at the protein level, these data still indicate that the SiNPs did upregulate the transcription of LC3B and ATG12. Therefore, the SiNPs eventually increased autophagosome synthesis via EIF2AK3-ATF4- and ATF6-DDIT3-mediated LC3B and ATG12 transcriptional upregulation. The reason why SiNPs suppressed the protein levels of ATG12 and ATG5 might be through other mechanisms, such as the proteasome system, post-transcriptional inhibition, and epigenetic regulation [Citation48,Citation49].
Most evidence about autophagy dysfunction has focused on the termination stage of autophagic flux. For example, several nanoparticles, including AgNPs, raphene oxide quantum dots, and polymeric nanoparticles, suppresse the degradation of autophagosomes via lysosomal impairment [Citation9,Citation50,Citation51]. In addition, Stern et al. reported that nanoparticles could disrupt the cytoskeleton and prevent lysosomal trafficking, leading to autophagic flux blockage.1 Moreover, a recent study indicated that upconversion nanoparticles (UCNs) induce autolysosomal membrane turnover anomalies leading to abnormal autophagy [Citation52]. However, the contributions of autophagy initiation and autophagosome synthesis to autophagy dysfunction are rarely investigated. The current study reveals that the SiNPs enhanced autophagosome synthesis via LC3B and ATG12 transcriptional upregulation modulated by the EIF2AK3 and ATF6 UPR pathways. The increase of autophagosome formation accelerated the intracellular autophagosome accumulation, aggravating the autophagy dysfunction induced by SiNPs. The findings in this study provide a new view of the mechanisms of SiNP-induced autophagy dysfunction, which is beneficial to investigating their toxic effects.
Conclusion
The internalized SiNPs stimulated ROS generation, which in turn induced ER stress and UPR via activating the EIF2AK3 and ATF6 pathways but not the ERN1-XBP1 pathway. In the EIF2AK3 pathway, SiNPs activated the phosphorylation of EIF2AK3 and EIF2S1, upregulating the expression of downstream ATF4. In the ATF6 pathway, ATF6 is cleaved to release an active form (50 kDa), which leads to the upregulation of DDIT3. Meanwhile, SiNPs did not induce the splicing of XBP1 in the ERN1-XBP1 pathway. After that, ATF4 and DDIT3 were translocated to the nucleus and acted as transcriptional factors that positively modulated the transcriptional expressions of LC3B and ATG12. Moreover, not only was the expression of LC3B upregulated, but the conversion of LC3B-I to LC3B-II was also promoted by the covalent binding of ATG12 to ATG5, which contributed to autophagosome formation. In our previous study, we showed that the internalized SiNPs impaired the lysosomes and inhibited the degradation of the autophagosomes [Citation5]. Therefore, the SiNPs accelerated autophagosome accumulation and aggravated autophagy dysfunction (). This work provides a novel view of the mechanisms underlying SiNP-induced autophagy dysfunction and it facilitates our understanding of toxic mechanisms of SiNPs.
Materials and methods
Chemicals and antibodies
Bafilomycin A1 (BafA1, B1793), thapsigargin (Tg, T9033), 4-phenylbutyric acid (4-PBA, P21005), polyethylenimine (PEI, 408,727), and polybrene (107,689) were purchased from Sigma-Aldrich. All of the regents were stored at – 20°C in single-use aliquots. Rabbit anti-LC3B (L7543), rabbit anti-SQSTM1 (P0067), and mouse anti-ACTB (A5441) antibodies were purchased from Sigma-Aldrich. Antibodies against HSPA5 (3177), EIF2AK3 (3192), phospho-EIF2AK3 (p-Thr980;3179), EIF2S1 (2103), phospho-EIF2S1(p-Ser51;3398), DDIT3 (2895), ATG12 (4180), and ATG5 (12,994) were purchased from Cell Signaling Technology. Antibodies against ATF4 (sc-22,800), ATF6 (sc-22,799), and goat anti-rabbit IgG-FITC (sc-2012) were purchased from Santa Cruz Biotechnology. Goat anti-mouse IgG IRDye 680RD (926–68,070) and goat anti-rabbit IgG IRDye 800CW (926–32,211) antibodies were obtained from Li-Cor Biosciences.
Preparation and characterization of SiNPs
The silica nanoparticles (SiNPs) were prepared using the Stöber method and fully characterized as previously described [Citation53]. First, 2.5 ml of tetraethylorthosilicate (TEOS; Fluorochem, S15425) was added drop-wise into 50 ml of premixed ethanol solution containing 4 ml of ammonia and 2 ml of water. Then, the reaction system was stirred at 150 revolutions per minute continuously at 40°C for 12 h. At last, the SiNP precipitates were collected by centrifugation at 17,418 x g for 15 min and they were washed 3 times with deionized water. The precipitates were redispersed in 50 ml of deionized water for further use. The size and shape of the SiNPs were characterized by TEM (JEOL JEM-2100, Akishima-shi, Japan). The particle size was calculated from random fields of TEM images that show the general morphology. A total of 500 particles were randomly counted and measured to determine the mean size, standard deviation (SD), and size distribution. The average hydrodynamic size, zeta potentials, and polydispersity index (PDI) of the SiNPs were determined by a Zetasizer (Nano-ZS90, Malvern, UK). The measurements were performed on diluted SiNPs suspensions in distilled water and serum-free Dulbecco’s Modified Eagle’s Medium (DMEM; Corning, 10–013-CVR). The purity of the SiNPs was analyzed by inductively coupled plasma-atomic emission spectrometer (ICP-AES) (ARL, Washington D.C, USA) as described before [Citation17]. Endotoxin in the SiNPs suspensions was detected by gel clot limulus amebocyte lysate (LAL; Zhan Jiang Bokang Marine Biological Co. LTD) assay according to the manufacturer’s instruction, and the detection limit was lower than 0.125 EU/ml. The suspensions of the SiNPs were sonicated by a sonicator prior to use (160 W, 20 kHz, 5min; Bioruptor UDC-200; Diagenode, Liège, Belgium).
The red fluorescence-labeled SiNPs were prepared by a modified Stöber method as described before [Citation54]. Briefly, 3 ml of TEOS were added to 60 ml of ethanol solution containing Ru(phen)32+ (0.6 mg; Alfa Aesar, A13572), ammonia (2.4 ml), and water (1.2 ml). The reaction system was maintained at 40°C for 6 h, and then another 0.8 ml of TEOS was added and continued stirring for another 6 h. At last, the mixture was centrifuged at 12,096 x g for 15 min, the particles were collected and washed with ethanol 3 times, and they were finally dispersed in 60 ml of ethanol. The shape and size of the red fluorescence-labeled SiNPs were characterized by TEM (JEOL JEM-2100, Akishima-shi, Japan).
Cell cultures and exposure to SiNPs
The normal human hepatic cell line, L-02, was obtained from the Nanjing Keygen Biotech Cell Library (Nanjing, China). The HEK293FT cell line was purchased from Life Technologies (R70007). All the cell lines were routinely maintained in DMEM (Corning, 10–013-CVR) supplemented with 10% (v:v) fetal bovine serum (Gibco, 16,000–044), 100 U/ml penicillin, and 100 mg/ml streptomycin at 37°C under a humidified atmosphere of 5% CO2. Treatment with SiNPs was performed as described previously [Citation5]. Briefly, 1 day prior to treatment, the cells in the exponential growth stage were seeded in corresponding culture dishes and were allowed to attach to the culture surface for 24 h. First, varying concentrations of the SiNPs (6.25, 12.5, 25, 50, and 100 μg/ml) were diluted with serum-free media, and then the cell culture media were removed and replaced with the freshly prepared SiNPs diluent for different time points according to the need of the assay. Cells treated with serum-free media were used as the negative control in each assay.
Cell viability assay
The viability of the L-02 cells exposed to SiNPs was evaluated by a Cell Counting Kit-8 (CCK-8; Dojindo Molecular Technologies, CK04) according to the manufacturer’s instructions. Briefly, the L-02 cells (1.2 × 10⁴ cells/well) were seeded into a 96-well plate in 100 μl of DMEM and incubated at 37°C for 24 h. Then, the cells were exposed to various concentrations of SiNPs (6.25, 12.5, 25, 50, and 100 μg/ml) with 8 biological replicates for each concentration for 12 h and 24 h. At the indicated time points, 10 μl of CCK-8 reagents were added to each well and further incubated for 2 h, and then the absorbance at 450 nm was determined using a microplate reader (Synergy HT; Bio Tek, Winooski, VT, USA).
Transmission electron microscopy
TEM assay is recommended as the only tool that reveals the morphology of autophagic structures in their nature environment and position [Citation55]. It was performed to detect the cellular internalization of the SiNPs and observe the ultrastructures of the autophagosomes and ER. For analysis, the L-02 cells were exposed to 25 μg/ml of SiNPs for 24 h. Then, cells were washed 3 times with phosphate-buffered saline (PBS, pH 7.4; ZSGB-BIO, ZLI-9061) to remove the excess SiNPs present on the surface of the cells, and they were harvested by centrifugation at 453 x g for 10 min. Then, cell pellets were fixed in 2.5% glutaraldehyde (in 0.1 M PBS) for 3 h at 4°C, washed 3 times with 0.1 M PBS (453 x g, 5 min), embedded in 2% agarose gel, postfixed in 4% osmium tetroxide solution (Sigma-Aldrich, 251,755) for 1 h, washed with distilled water, stained with 0.5% uranyl acetate (SPI, 02624-AB) for 1 h, dehydrated in a graded series of ethanol (30%, 60%, 70%, 90%, and 100%), and finally embedded in epoxy resin (Sigma-Aldrich, 45,347). The resin was polymerized at 60°C for 48 h. Then, ultrathin sections were cut using an ultramicrotome and stained with 5% aqueous uranyl acetate and 2% aqueous lead citrate, air dried, and imaged with TEM.
Laser scanning confocal microscopy
For autophagosome analysis, 3 × 10⁵ L-02 cells were seeded in each confocal dish. After incubating for 24 h, the cells were treated with 25 μg/ml of SiNPs for another 24 h. Then, the cells were fixed with 4% paraformaldehyde (Sigma-Aldrich, 16,005), permeabilized with 0.5% Triton X-100 (Sigma-Aldrich, T8787) in PBS for 30 min, and blocked with 5% BSA (Sigma-Aldrich, A7906) for 1 h. After that, the cells were incubated with LC3B antibody (1:100 dilution in 5% BSA) at 4°C overnight, and then secondary FITC-conjugated anti-rabbit antibodies (1:50 dilution in 5% BSA) were added followed by incubation with 300 nM 4ʹ,6-diamidino-2-phenylindole (DAPI; Life Technologies, D1306) for nuclear staining. For SiNPs internalization assay, the L-02 cells with red fluorescence-labeled SiNPs treatment were fixed and permeabilized as described above. Then add 200 μl of 100 nMActi-stain™488 phalloidin (Cytoskeleton, PHDG1) and incubated at room temperature in the dark for 30 min. After that, cells were washed with PBS 3 times and the nucleus was counterstained for 10 min with 200 μl of 300 nM DAPI for 10 min. To analyze the location of the SiNPs in the ER, the cells were treated with 50 μg/ml of red fluorescence-labeled SiNPs for another 24 h. Then, the living cells were stained with 1 μM of ER-Tracker Green probes (KeyGen Biotech, KGMP016) according to the manufacturer’s protocol at 37°C for 30 min. After washing with PBS 3 times, the cells were stained with 20 ng/ml of Hoechst33342 (Sigma-Aldrich, 14,533) at 37°C for another 30 min. Finally, the cells were washed 3 times with PBS and images were analyzed using a TCS SP8 LSCM (Leica Microsystems CMS GmbH, Mannheim, Germany).
SDS-PAGE and western blot
Total cellular protein lysates were prepared by lysing cells in RIPA lysis buffer (Beyotime, P0013C) with a protease inhibitor cocktail (Roche, 04693132001) and a phosphatase inhibitor cocktail (Roche, 04906845001). The total protein concentration was determined using a BCA protein assay kit (DingGuoBioTECH, BCA01). Equal amounts of total proteins were separated with SDS-PAGE (8%) for EIF2AK3, and phospho-EIF2AK3 (p-Thr980) detection, 10% gels for SQSTM1, HSPA5, EIF2S1, phospho-EIF2S1 (p-Ser51), ATF6, ATF4, DDIT3, ATG12, and ATG5 detection, and 15% gels for LC3B detection. ACTB was used as the protein loading control. After SDS-PAGE, the proteins on the gels were transferred to BioTrace nitrocellulose membranes (Pall, 66,485), blocked with 5% skim milk in Tris-buffered saline (TBS, pH7.4; 20 mM Tris-HCl, 150 mM NaCl), and then incubated with different primary antibodies overnight at 4°C. The next day, the membranes were incubated with IRDye-labeled goat anti-mouse or goat anti-rabbit IgG at room temperature for 1 h. Finally, the protein bands were scanned using the Li-COR Odyssey system (LI-COR Biosciences, Lincoln, NE, USA). At least 3 independent experiments were performed and a representative result was shown. For the grayscale analysis, photodensitometric data from the protein bands were analyzed and quantified with Odyssey Infrared Imaging software.
Lentiviral shrna generation and transduction
The method of packaging lentiviral shRNA was described previously [Citation56]. Briefly, 3 × 10⁶ HEK293FT cells were seeded in each 10-cm dish in complete DMEM medium without penicillin and streptomycin. After 24 h, the cells in each 10-cm dish were transfected with 6 μg pCMVΔ8.74, 3 μg shRNA, or 1 μg pCMV-VSVG using 1 ml of fetal bovine serum-free medium containing 30 μl PEI (1 mg/ml). At 10 h post-transfection, the medium was removed and replaced with 10 ml of fresh medium. After 48 h, the lentiviral supernatants were collected by centrifuging at 2,000 x g for 10 min at 4°C and then filtered through a 0.45-μm membrane. The titer of lentiviral shRNA was measured using a Lenti-X p24 rapid titer kit (Clontech, 632,200) according to the manufacturer’s instructions and stored at – 80°C as aliquots. For the experiment, lentiviral shRNA was added to the L-02 cells (multiplicity of infection [MOI] = 1) in the presence of polybrene (4 μg/ml). After 3 h, the virus-containing medium was removed and replaced with fresh medium. After 48 h, the cells were exposed to 25 μg/ml of SiNPs for an additional 24 h, then the cells were harvested and analyzed using the indicated assays at 72 h post-transduction. Specific shRNA clones were selected according to the target knockdown efficiency. The following shRNA clones were used in this study: EIF2AK3 (Sigma-Aldrich, TRCN0000001401), ATF6 (Sigma-Aldrich, TRCN0000017855), ATF4 (Sigma-Aldrich, TRCN0000013573), DDIT3 (Sigma-Aldrich, TRCN0000364393), and control shRNA (Sigma-Aldrich, SHC010).
Quantitative real-time PCR
Total cellular RNA was extracted using TRIzol reagent (Life Technologies, 15,596–018) according to the manufacturer’s protocol. There was 1 μg of total RNA that was reverse-transcribed in a 20-μl volume using Reverse Transcription System (Promega, A3500). All of the cDNA samples were used immediately or stored at – 80°C until further use. PCR and PstI digestion assays were performed to detect the XBP1 splicing status, and the following primers were used:
XBP1 sense: 5ʹ-CCTTGTAGTTGAGAACCAGG-3ʹ,
XBP1 antisense: 5ʹ-GGGGCTTGGTATATATGTGG-3ʹ; and
ACTB sense: 5ʹ-ATCTGGCACCACACCTTCTACAATGAG-3ʹ,
ACTB antisense: 5ʹ-CGTCATACTCCTGCTTGCTG ATCC-3ʹ.
The PCR products were digested by PstI, and then separated on 2% agarose gel. ACTB was used as an internal control.
For the quantitative real-time PCR assay to detect the mRNA expression of LC3B and ATG12, 1 μl of cDNA was used in a 20-μl real-time PCR system with Power SYBR Green PCR Master Mix (Life Technologies, 4,367,659). Each experiment was performed in triplicate. Primers for the qPCR reactions were as follows:
LC3B sense: 5ʹ-AAGGCGCTTACAGCTCAATG-3ʹ,
LC3B antisense: 5ʹ-CTGGGAGGCATAGACCATGT-3ʹ;
ATG12 sense: 5ʹ-TAGAGCGAACACGAACCATCC-3ʹ,
ATG12 antisense: 5ʹ-CACTGCCAAAACACTCATAG AGA-3ʹ;
GAPDH sense: 5ʹ-TGTTGCCATCAATGACCCCTT-3ʹ,
GAPDH antisense: 5ʹ-CTCCACGACGTACTCAGCG-3ʹ.
The PCR reaction was conducted in a 7900HT Fast Real-Time PCR machine (Life Technologies, Grand Island, NY, USA) and data were analyzed using RQ manager software.
Statistical analysis
All of the data are presented as mean ± SD. All of the experiments were repeated at least 3 times. One-way analysis of variance (ANOVA),Dunnett and Tukey post-hoc tests, and 2-way ANOVA were used to analyze the data in the corresponding experiments. The statistical significance was set at p < 0.05.
Abbreviations
| 4-PBA | = | 4-phenylbutyric acid |
| ACTB | = | actin beta |
| ATF6 | = | activating transcription factor 6 |
| ATG | = | autophagy related |
| BafA1 | = | bafilomycin A1 |
| DAPI | = | 4′,6-diamidino-2-phenylindole |
| DDIT3 | = | DNA damage inducible transcript 3 |
| DMEM | = | Dulbecco’s Modified Eagle’s Medium |
| EIF2AK3 | = | eukaryotic translation initiation factor 2 alpha kinase 3 |
| EIF2S1 | = | eukaryotic translation initiation factor 2 subunit 1 alpha |
| ER | = | endoplasmic reticulum |
| ERN1 | = | endoplasmic reticulum to nucleus signaling 1 |
| NS, | = | not significant |
| HSPA5 | = | heat shock protein family A (Hsp70) member 5 |
| LC3B-I | = | unlipidated form of LC3B |
| LC3B-II | = | phosphatidylethanolamine-conjugated form of LC3B |
| LSCM | = | laser scanning confocal microscope |
| MAP1LC3B/LC3B | = | microtubule associated protein 1 light chain 3 beta |
| PCR | = | polymerase chain reaction |
| SD | = | standard deviation |
| SiNPs | = | silica nanoparticles |
| SQSTM1 | = | sequestosome 1 |
| ROS | = | reactive oxygen species |
| TEM | = | transmission electron microscopy |
| Tg | = | thapsigargin |
| UPR | = | unfolded protein response |
| XBP1 | = | X-box binding protein 1 |
Supplemental Material
Download Zip (1.9 MB)Acknowledgments
We would like to thank Prof. Zhendong Zhao(Chinese Academy of Medical Sciences & Peking Union Medical College) for kindly providing pCMVΔ8.74 and pCMV-VSVG.
Disclosure statement
No potential conflict of interest was reported by the authors.
Supplementary Material
Supplemental data for this article can be accessed here.
Additional information
Funding
Related Research Data
References
- Stern ST, Adiseshaiah PP, Crist RM. Autophagy and lysosomal dysfunction as emerging mechanisms of nanomaterial toxicity. Part Fibre Toxicol. 2012;9:20. PubMed PMID: 22697169; PubMed Central PMCID: PMC3441384.
- Peynshaert K, Soenen SJ, Manshian BB, et al. Coating of quantum dots strongly defines their effect on lysosomal health and autophagy. Acta Biomater. 2017 Jan;15(48):195–205. PubMed PMID: 27765679.
- Zhu L, Guo D, Sun L, et al. Activation of autophagy by elevated reactive oxygen species rather than released silver ions promotes cytotoxicity of polyvinylpyrrolidone-coated silver nanoparticles in hematopoietic cells. Nanoscale. 2017 May 04;9(17):5489–5498. PubMed PMID: 28401217.
- Ma X, Wu Y, Jin S, et al. Gold nanoparticles induce autophagosome accumulation through size-dependent nanoparticle uptake and lysosome impairment. ACS Nano. 2011 Nov 22;5(11):8629–8639. PubMed PMID: 21974862.
- Wang J, Yu Y, Lu K, et al. Silica nanoparticles induce autophagy dysfunction via lysosomal impairment and inhibition of autophagosome degradation in hepatocytes. Int J Nanomedicine. 2017;12:809–825. PubMed PMID: 28182147; PubMed Central PMCID: PMCPMC5279829. eng.
- Li R, Ji Z, Qin H, et al. Interference in autophagosome fusion by rare earth nanoparticles disrupts autophagic flux and regulation of an interleukin-1β producing inflammasome. ACS Nano. 2014 Oct 28;8(10):10280–10292. PubMed PMID: 25251502; PubMed Central PMCID: PMC4213039.
- Loos C, Syrovets T, Musyanovych A, et al. Amino-functionalized nanoparticles as inhibitors of mTOR and inducers of cell cycle arrest in leukemia cells. Biomaterials. 2014 Feb;35(6):1944–1953. PubMed PMID: 24331713.
- Orecna M, De Paoli SH, Janouskova O, et al. Toxicity of carboxylated carbon nanotubes in endothelial cells is attenuated by stimulation of the autophagic flux with the release of nanomaterial in autophagic vesicles. Nanomedicine. 2014 Jul;10(5):939–948. PubMed PMID: 24566271.
- Mishra AR, Zheng J, Tang X, et al. Silver nanoparticle-induced autophagic-lysosomal disruption and NLRP3-inflammasome activation in HepG2 cells is size-dependent. Toxicol Sci. 2016 Apr;150(2):473–487. PubMed PMID: 26801583.
- Mao BH, Tsai JC, Chen CW, et al. Mechanisms of silver nanoparticle-induced toxicity and important role of autophagy. Nanotoxicology. 2016 Oct;10;8:1021–1040. PubMed PMID: 27240148. DOI:10.1080/17435390.2016.1189614
- Zhang L, Wang X, Miao Y, et al. Magnetic ferroferric oxide nanoparticles induce vascular endothelial cell dysfunction and inflammation by disturbing autophagy. J Hazard Mater. 2016 Mar;05(304):186–195. PubMed PMID: 26551222.
- Zheng W, Wei M, Li S, et al. Nanomaterial-modulated autophagy: underlying mechanisms and functional consequences. Nanomedicine. 2016 Jun;11(11):1417–1430. PubMed PMID: 27193191.
- Xi C, Zhou J, Du S, et al. Autophagy upregulation promotes macrophages to escape mesoporous silica nanoparticle (MSN)-induced NF-kappaB-dependent inflammation. Inflamm Res. 2016 Apr;65(4):325–341. 10.1007/s00011-016-0919-0. PubMed PMID: 26860538.
- Tooze SA, Dikic I. Autophagy captures the nobel prize. Cell. 2016 Dec 01;167(6):1433–1435. PubMed PMID: 27912049.
- Wang Y, Zhao Q, Han N, et al. Mesoporous silica nanoparticles in drug delivery and biomedical applications. Nanomedicine. 2015 Feb;11(2):313–327. PubMed PMID: 25461284.
- Mebert AM, Baglole CJ, Desimone MF, et al. Nanoengineered silica: properties, applications and toxicity. Food Chem Toxicol. 2017 May;31(109):753–770. PubMed PMID: 28578101.
- Castillo RR, Colilla M, Vallet-Regi M. Advances in mesoporous silica-based nanocarriers for co-delivery and combination therapy against cancer. Expert Opin Drug Deliv. 2017 Feb;14(2):229–243. PubMed PMID: 27402029.
- Kurtz-Chalot A, Villiers C, Pourchez J, et al. Impact of silica nanoparticle surface chemistry on protein corona formation and consequential interactions with biological cells. Mater Sci Eng C Mater Biol Appl. 2017 Jun;01(75):16–24. PubMed PMID: 28415450.
- Wei F, Wang Y, Luo Z, et al. New findings of silica nanoparticles induced ER autophagy in human colon cancer cell. Sci Rep. 2017 Feb;14(7):42591. PubMed PMID: 28195184; PubMed Central PMCID: PMC5307363.
- Yu Y, Duan J, Yu Y, et al. Silica nanoparticles induce autophagy and autophagic cell death in HepG2 cells triggered by reactive oxygen species. J Hazard Mater. 2014 Apr;15(270):176–186. PubMed PMID: 24583672.
- Duan J, Yu Y, Yu Y, et al. Silica nanoparticles induce autophagy and endothelial dysfunction via the PI3K/Akt/mTOR signaling pathway. Int J Nanomedicine. 2014;9:5131–5141. PubMed PMID: 25395850; PubMed Central PMCID: PMC4227623.
- Schutz I, Lopez-Hernandez T, Gao Q, et al. Lysosomal dysfunction caused by cellular accumulation of silica nanoparticles. J Biol Chem. 2016 Jul 1;291(27):14170–14184. PubMed PMID: 27226546; PubMed Central PMCID: PMC4933175.
- Rutkowski DT, Hegde RS. Regulation of basal cellular physiology by the homeostatic unfolded protein response. J Cell Biol. 2010 May 31;189(5):783–794. PubMed PMID: 20513765; PubMed Central PMCID: PMC2878945.
- Khalili Fard J, Jafari S, Eghbal MA. A review of molecular mechanisms involved in toxicity of nanoparticles. Adv Pharm Bull. 2015 Nov;5(4):447–454. PubMed PMID: 26819915; PubMed Central PMCID: PMC4729339.
- Yu Y, Li Y, Wang W, et al. Acute toxicity of amorphous silica nanoparticles in intravenously exposed ICR mice. PloS One. 2013;8(4):e61346. PubMed PMID: 23593469; PubMed Central PMCID: PMC3625170.
- Duan J, Yu Y, Yu Y, et al. Silica nanoparticles enhance autophagic activity, disturb endothelial cell homeostasis and impair angiogenesis. Part Fibre Toxicol. 2014 Sep;30(11):50. PubMed PMID: 25266717; PubMed Central PMCID: PMC4193984.
- Jiang L, Yu Y, Li Y, et al. Oxidative damage and energy metabolism disorder contribute to the hemolytic effect of amorphous silica nanoparticles. Nanoscale Res Lett. 2016 Dec;11(1):57. 10.1186/s11671-016-1280-5. PubMed PMID: 26831695; PubMed Central PMCID: PMC4735100.
- Duan J, Yu Y, Li Y, et al. Low-dose exposure of silica nanoparticles induces cardiac dysfunction via neutrophil-mediated inflammation and cardiac contraction in zebrafish embryos. Nanotoxicology. 2016;10(5):575–585. PubMed PMID: 26551753.
- Nash KM, Ahmed S. Nanomedicine in the ROS-mediated pathophysiology: applications and clinical advances. Nanomedicine. 2015 Nov;11(8):2033–2040. PubMed PMID: 26255114; PubMed Central PMCID: PMC4628889.
- Hu L, Wang H, Huang L, et al. Crosstalk between autophagy and intracellular radiation response (Review). Int J Oncol. 2016 Dec;49(6):2217–2226. PubMed PMID: 27748893.
- Zhang K. Integration of ER stress, oxidative stress and the inflammatory response in health and disease. Int J Clin Exp Med. 2010 Jan 08;3(1):33–40. PubMed PMID: 20369038; PubMed Central PMCID: PMC2848304.
- Walter P, Ron D. The unfolded protein response: from stress pathway to homeostatic regulation. Science. 2011 Nov 25;334(6059):1081–1086. PubMed PMID: 22116877.
- Gregor MF, Hotamisligil GS. Inflammatory mechanisms in obesity. Annu Rev Immunol. 2011;29:415–445. PubMed PMID: 21219177.
- Fu S, Watkins SM, Hotamisligil GS. The role of endoplasmic reticulum in hepatic lipid homeostasis and stress signaling. Cell Metab. 2012 May 02;15(5):623–634. PubMed PMID: 22560215.
- Simon M, Saez G, Muggiolu G, et al. In situ quantification of diverse titanium dioxide nanoparticles unveils selective endoplasmic reticulum stress-dependent toxicity. Nanotoxicology. 2017 Feb;11(1):134–145. PubMed PMID: 28044465.
- Simard JC, Durocher I, Girard D. Silver nanoparticles induce irremediable endoplasmic reticulum stress leading to unfolded protein response dependent apoptosis in breast cancer cells. Apoptosis. 2016 Nov;21(11):1279–1290. 10.1007/s10495-016-1285-7. PubMed PMID: 27586505.
- Zhang X, Zhang H, Liang X, et al. Iron oxide nanoparticles induce autophagosome accumulation through multiple mechanisms: lysosome impairment, mitochondrial damage, and ER stress. Mol Pharm. 2016 Jul 05;13(7):2578–2587. PubMed PMID: 27287467.
- Liu D, Ke Z, Luo J. Thiamine deficiency and neurodegeneration: the interplay among oxidative stress, endoplasmic reticulum stress, and autophagy. Mol Neurobiol. 2017 Sep;54(7):5440–5448. 10.1007/s12035-016-0079-9. PubMed PMID: 27596507; PubMed Central PMCID: PMC5337452.
- Cai Y, Arikkath J, Yang L, et al. Interplay of endoplasmic reticulum stress and autophagy in neurodegenerative disorders. Autophagy. 2016;12(2):225–244. PubMed PMID: 26902584; PubMed Central PMCID: PMC4835965.
- Varga ZV, Giricz Z, Liaudet L, et al. Interplay of oxidative, nitrosative/nitrative stress, inflammation, cell death and autophagy in diabetic cardiomyopathy. Biochim Biophys Acta. 2015 Feb;1852(2):232–242. PubMed PMID: 24997452; PubMed Central PMCID: PMC4277896.
- B’Chir W, Maurin AC, Carraro V, et al. The eIF2alpha/ATF4 pathway is essential for stress-induced autophagy gene expression. Nucleic Acids Res. 2013 Sep;41(16):7683–7699. PubMed PMID: 23804767; PubMed Central PMCID: PMC3763548.
- Christen V, Fent K. Silica nanoparticles and silver-doped silica nanoparticles induce endoplasmatic reticulum stress response and alter cytochrome P4501A activity. Chemosphere. 2012 Apr;87(4):423–434. PubMed PMID: 22245057.
- Mauvezin C, Neufeld TP. Bafilomycin A1 disrupts autophagic flux by inhibiting both V-ATPase-dependent acidification and Ca-P60A/SERCA-dependent autophagosome-lysosome fusion. Autophagy. 2015;11(8):1437–1438. PubMed PMID: 26156798; PubMed Central PMCID: PMC4590655.
- Senft D, Ronai ZA. UPR, autophagy, and mitochondria crosstalk underlies the ER stress response. Trends Biochem Sci. 2015 Mar;40(3):141–148. PubMed PMID: 25656104; PubMed Central PMCID: PMC4340752.
- Cohignac V, Landry MJ, Boczkowski J, et al. Autophagy as a possible underlying mechanism of nanomaterial toxicity. Nanomaterials. 2014 Jul 08;4(3):548–582. PubMed PMID: 28344236; PubMed Central PMCID: PMC5304698.
- Scherz-Shouval R, Elazar Z. Regulation of autophagy by ROS: physiology and pathology. Trends Biochem Sci. 2011 Jan;36(1):30–38. PubMed PMID: 20728362.
- Tanida I. Autophagosome formation and molecular mechanism of autophagy. Antioxid Redox Signal. 2011 Jun;14(11):2201–2214. PubMed PMID: 20712405.
- Feng Y, Yao Z, Klionsky DJ. How to control self-digestion: transcriptional, post-transcriptional, and post-translational regulation of autophagy. Trends Cell Biol. 2015 Jun;25(6):354–363. PubMed PMID: 25759175; PubMed Central PMCID: PMC4441840.
- Shin HR, Kim H, Kim KI, et al. Epigenetic and transcriptional regulation of autophagy. Autophagy. 2016 Nov;12(11):2248–2249. PubMed PMID: 27487449; PubMed Central PMCID: PMC5103355.
- Ji X, Xu B, Yao M, et al. Graphene oxide quantum dots disrupt autophagic flux by inhibiting lysosome activity in GC-2 and TM4 cell lines. Toxicology. 2016 Dec;30(374):10–17. PubMed PMID: 27845169.
- Trudeau KM, Colby AH, Zeng J, et al. Lysosome acidification by photoactivated nanoparticles restores autophagy under lipotoxicity. J Cell Biol. 2016 Jul 04;214(1):25–34. PubMed PMID: 27377248; PubMed Central PMCID: PMC4932370.
- Zhang JQ, Zhou W, Zhu SS, et al. Persistency of enlarged autolysosomes underscores nanoparticle-induced autophagy in hepatocytes. Small (Weinheim an Der Bergstrasse, Germany). 2017 Feb;13(7). PubMed PMID: 27925395. DOI:10.1002/smll.201602876
- Duan J, Yu Y, Li Y, et al. Cardiovascular toxicity evaluation of silica nanoparticles in endothelial cells and zebrafish model. Biomaterials. 2013 Jul;34(23):5853–5862. PubMed PMID: 23663927.
- Xu J, Sun L, Li J, et al. FITC and Ru(phen)32+ co-doped silica particles as visualized ratiometric pH indicator. Nanoscale Res Lett. 2011 Oct 25;6(1):561. PubMed PMID: 22027093; PubMed Central PMCID: PMC3220666.
- Klionsky DJ, Abdelmohsen K, Abe A, et al. Guidelines for the use and interpretation of assays for monitoring autophagy (3rd edition). Autophagy. 2016;12(1):1–222. PubMed PMID: 26799652; PubMed Central PMCID: PMC4835977.
- Wang J, Kang R, Huang H, et al. Hepatitis C virus core protein activates autophagy through EIF2AK3 and ATF6 UPR pathway-mediated MAP1LC3B and ATG12 expression. Autophagy. 2014 May;10(5):766–784. PubMed PMID: 24589849; PubMed Central PMCID: PMCPMC5119055. eng.