
ABSTRACT
Breast cancer is a heterogeneous disease, and stratification of patients is fundamental to the success of treatment modalities. Breast tumors deficient in BRCA1 are mostly associated with basal-like breast cancers and targeted therapeutics for this disease subtype are still lacking. In order to address whether macroautophagy/autophagy inhibition will be effective in BRCA1-deficient mammary tumors, we generated mice with conditional deletion of an essential autophagy gene, Rb1cc1, along with Brca1 and Trp53, through utilization of the K14-Cre transgene. We found that Rb1cc1 deletion suppressed tumorigenesis in the BRCA1-deficient model when compared to wild type and heterozygous Rb1cc1 controls. However, in contrast to previous studies in the mouse mammary tumor virus (MMTV)-polyoma middle T antigen (PyMT) model, tumor growth and the distribution of histological subtypes were not affected by loss of RB1CC1. Interestingly, loss of RB1CC1 decreased mitochondrial mass and oxidative respiratory capacity of these tumor cells, along with a decrease in the phosphorylation of MTOR substrates and transcript levels of genes involved in mitochondrial biogenesis. Importantly, we observed an increased sensitivity to mitochondrial disrupting agents upon loss of RB1CC1. Consequently, our data showed that combination of an autophagy inhibitor, spautin-1, along with a mitochondrial complex I inhibitor, metformin, was more effective in limiting oxidative respiratory capacity, colony-forming ability and tumor growth. Altogether, our results indicate that inhibition of autophagy can increase the benefits of metformin treatment in BRCA1-deficient breast cancers.
Introduction
Germline mutations in the BRCA1 gene are associated with approximately 50% of hereditary breast cancers, and epigenetic silencing of this gene also occurs in sporadic breast cancers [1]. These tumors frequently harbor TP53 (tumor protein p53) mutations concurrently [Citation2,Citation3] and these perturbations predominantly lead to the formation of breast cancers that are classified as basal-like based on gene expression profiling [Citation4]. However, the presence of BRCA1 germline mutations expands mammary luminal progenitor (LP) cells in normal mammary glands of BRCA1-mutant carriers [Citation5–Citation7] and it is the loss of BRCA1 function that confers plasticity in LP cells, giving rise to basal-like breast cancers upon transformation [Citation7,Citation8]. As such, BRCA1-deficient breast cancers represent a subgroup of tumors that are amenable to stratification.
BRCA1/FANCS is a Fanconi anemia gene and plays an important role in DNA repair and maintenance of genomic stability [Citation9]. Although the loss of BRCA1’s tumor suppressor function in maintaining genome integrity is deemed to be important for tumorigenesis, it is only in specific tissues that BRCA1 exerts tumor suppressive effects [Citation10]. This can be explained in part by the fact that BRCA1 also regulates the anti-oxidant response through stabilization of NFE2L2/NRF2 [Citation11]. Consequently, the loss of BRCA1 will lead to high levels of reactive oxygen species that are mostly compatible in estrogen responsive tissues because of the estrogen pathway’s ability to induce compensatory increases in NFE2L2 levels [Citation12]. Additionally, BRCA1 may also impinge on the metabolic aspects of cells. Histological analysis of BRCA1-deficient breast tumors reveals a glycolytic stroma and, inversely, intense mitochondrial staining in epithelial tumor cells [Citation13]. In line with this, it has been reported that a BRCA1 mutation can reprogram breast epithelial cells towards mitochondrial-dependent metabolism and the authors suggest that the mitochondrial disruptor metformin could be effective as a chemopreventive strategy in BRCA1-deficient patients [Citation14]. These observations may be linked to the fact that Fanconi anemia proteins play a role in mitophagy [Citation15]. It is also worth noting that BRCA1 negatively regulates a key enzyme in lipid synthesis, namely, ACACA (acetyl-CoA carboxylase alpha) [Citation16,Citation17]. The TNFRSF11A/RANK+ LP population that is expanded in BRCA1-mutated patients also exhibits higher levels of genes involved in fatty acid metabolism [Citation6] and it would be interesting to address whether the preferential expansion of TNFRSF11A+ LPs is due to their inherent compatibility with increased lipid metabolism. All these abnormal metabolic changes that are associated with BRCA1-deficient cells raise the possibility of whether there are metabolic dependencies, which can be exploited for therapeutic targeting.
Autophagy is a process that enables cells to recycle cytoplasmic entities and organelles. This occurs through the sequestration of cargo within double-membraned structures termed autophagosomes. This process allows for sustenance under nutrient-limiting conditions and the elimination of defective organelles or proteins [Citation18]. As such, autophagy can have a direct impact on the metabolism of cells, especially in cancer cells that have excessive metabolic requirements [Citation19–Citation22]. However, the role of autophagy in breast cancer appears to be context dependent [Citation23–Citation27] and the culmination of genetic/epigenetic changes in cancer cells may determine their dependence on autophagy [Citation20,Citation22,Citation24]. In this study, we assessed the functions of the essential autophagy gene, Rb1cc1/Fip200, in a mouse model of BRCA1-deficient basal-like breast cancer [Citation28] and unraveled changes in mitochondrial metabolism that may affect the sensitivity of BRCA1-deficient breast tumors to mitochondrial disruptors.
Results
Deletion of rb1cc1 inhibits development of BRCA1-deficient mammary tumors
In order to address the potential role of autophagy in tumorigenesis and progression of brca1F/F;trp53F/F;K14-Cre-driven tumors (designated henceforth as BPK tumors), the essential autophagy gene Rb1cc1 was conditionally deleted in these tumor-bearing mice. For that purpose, Rb1cc1 floxed alleles were crossed into this tumor model to produce experimental mice that were either Rb1cc1+/+, Rb1cc1F/+ or rb1cc1F/F. The appearance of palpable tumors that consist predominantly of mammary and skin tumors was marginally affected upon loss of Rb1cc1 (medians: Rb1cc1+/+ BPK = 170 days, Rb1cc1F/+ BPK = 183.5 days, rb1cc1F/F BPK = 189.5 days; log-rank test, p = 0.0241) ()). When we compared mice with only mammary tumors among the 3 genotypes, an inhibition on the onset of mammary tumorigenesis was more apparent after Rb1cc1 deletion (medians: Rb1cc1+/+ BPK = 153 days, Rb1cc1F/+ BPK = 174 days, rb1cc1F/F BPK = 190 days; Log-Rank test, p = 0.0012) ()). These results suggest that Rb1cc1 deficiency preferentially regulates the onset of mammary tumors but not skin tumors.
Figure 1. Rb1cc1 deletion inhibits the onset of brca1F/F; trp53F/F; K14-Cre (BPK) mammary tumors. (a) Tumor free survival curves of BPK mice with either Rb1cc1+/+ (n = 21), Rb1cc1F/+ (n = 48) or rb1cc1F/F (n = 58) alleles. (b) Tumor-free survival curves of BPK mice bearing only mammary tumors and not skin or other tumors, with either Rb1cc1+/+ (n = 13), Rb1cc1F/+ (n = 22) or rb1cc1F/F (n = 30) alleles. (c) Histological subtypes of mammary tumors from BPK mice. Scale bar: 200 μm. (d) Table and (e) pie charts showing distribution of histological subtypes for mammary tumors from BPK mice with either Rb1cc1+/+, Rb1cc1F/+ or rb1cc1F/F alleles. (f) Representative images for mammary tumor sections from BPK mice with either Rb1cc1+/+, Rb1cc1F/+ or rb1cc1F/F alleles that were immuno-stained for SQSTM1. Scale bar: 200 μm. (g) Tumor growth curves of BPK mice with either Rb1cc1+/+ (n = 6), Rb1cc1F/+ (n = 12) or rb1cc1F/F (n = 17) alleles.
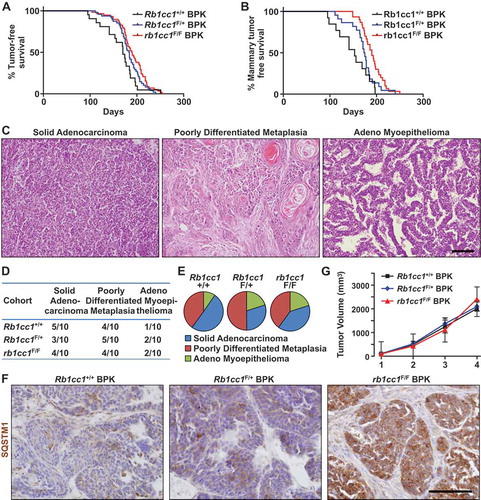
We next examined the histology of BPK tumors that arose for each genotype. In Rb1cc1+/+ BPK controls, a range of histological subtypes could be observed. These include solid adenocarcinomas, poorly differentiated metaplasias and adeno-myoepitheliomas (). Despite the reduced tumor development, Rb1cc1 deletion did not affect the distribution of histological subtypes to any significant extent (), suggesting that it is important in all 3 subtypes. Mammary tumors from each genotype were then sectioned and analyzed for the expression of the autophagy receptor protein, SQSTM1/p62. As observed previously in rb1cc1-null tumors in the mouse mammary tumor virus-polyoma middle T antigen (MMTV-PyMT) model [Citation23], the Rb1cc1F/F BPK tumors showed increased accumulation of SQSTM1, relative to Rb1cc1+/+ BPK and Rb1cc1F/+ BPK controls (), which is consistent with their defective autophagy upon Rb1cc1 deletion. Surprisingly, however, we did not observe any discernable differences in the tumor growth rates of these BPK tumors after Rb1cc1 deletion (), which is unlike the reduced growth of Rb1cc1-null tumors in the MMTV-PyMT model [Citation23], despite the decreased tumor development in both models. Together, these results demonstrate that autophagy plays a role in the development of BRCA1-deficient mammary tumors.
Deletion of rb1cc1 reduces the oxidative respiratory capacity of BRCA1-deficient mammary tumors
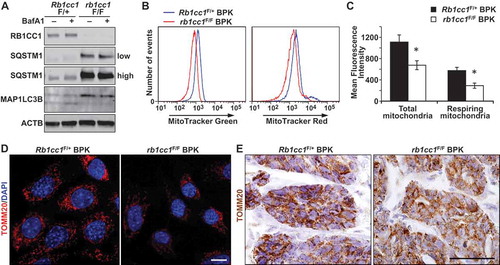
Recent studies have indicated a possible dependence of BRCA1-deficient breast cancer cells on mitochondrial oxidative respiration [Citation14]. Because the selective autophagic degradation of mitochondria (mitophagy) can have an impact on mitochondrial homeostasis, we next examined the mitochondrial content in Rb1cc1F/+ BPK and rb1cc1F/F BPK mammary cancer cells. rb1cc1F/F BPK cells were deficient in autophagy relative to Rb1cc1F/+ BPK cells as demonstrated by accumulation of SQSTM1, MAP1LC3B-I and the lack of MAP1LC3B-II accumulation after bafilomycin A1 treatment (). These cells were stained with MitoTracker Green and MitoTracker Red dyes to quantify total mitochondrial mass and respiring mitochondrial mass respectively. Flow cytometry analysis revealed that both total and respiring mitochondrial mass was reduced in rb1cc1F/F BPK relative to Rb1cc1F/+ BPK controls (). These changes could also be visualized when the cells were stained for the mitochondrial specific protein TOMM20, and analyzed through confocal microscopy (). However, there were no overt differences in the network of mitochondria between the 2 cell types, where both exhibited fragmented mitochondrial arrangement. Immuno-histochemical analysis of TOMM20 staining in these tumors also revealed a more diffuse staining pattern in rb1cc1F/F BPK tumors relative to Rb1cc1F/+ BPK tumors ()). Together, these data demonstrate a reduction in mitochondrial mass in BPK tumors upon loss of RB1CC1.
Figure 2. Rb1cc1 deletion reduces mitochondrial mass in BPK mammary tumors. (a) Immuno-blots showing levels of RB1CC1, SQSTM1, MAP1LC3B and ACTB in BPK primary cells with Rb1cc1F/+ or rb1cc1F/F. Cells were treated with HBSS ± bafilomycin A1 at 200 nM for 2 h before harvesting lysates. On the right, low indicates lower exposure time and high indicates higher exposure time of the same blot. (b) Histograms showing the distribution of BPK primary cells stained with MitoTracker Green or MitoTracker Red and analyzed by flow cytometry. (c) Quantification of the mean fluorescence intensities of BPK primary cells stained with MitoTracker Green or MitoTracker Red. Data represent the average of n = 4 tumors for Rb1cc1F/+ and rb1cc1F/F cohorts. Statistical significance was determined by two-tailed t-test, * denotes p ≤ 0.05. (d) Representative images of BPK primary cells with Rb1cc1F/+ or rb1cc1F/F alleles that were immuno-fluorescently labeled for TOMM20 and analyzed via confocal microscopy. Scale bar: 10 μm. (e) Representative images of BPK tumors with Rb1cc1F/+ or rb1cc1F/F alleles that were immuno-stained for TOMM20. Scale bar: 200 μm.
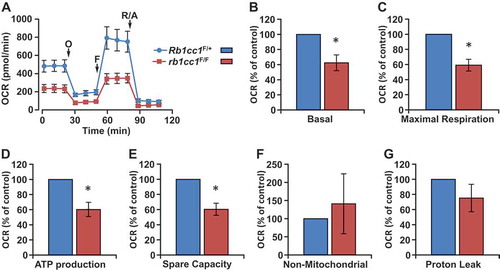
The reduction in mitochondrial mass upon RB1CC1 loss in BPK tumors led us to address whether the changes observed were associated with functional changes in mitochondrial oxygen consumption rate (OCR). Primary cells isolated from Rb1cc1F/+ BPK or rb1cc1F/F BPK mammary tumors were subjected to Seahorse XF24 extracellular flux analysis to measure OCR. Consistent with the reduction in mitochondrial mass (), loss of RB1CC1 also led to decreased basal OCR, maximal OCR, spare respiratory capacity and ATP production (). There were no significant changes in non-mitochondrial OCR and proton leak when the cells were depleted of RB1CC1 (). These results indicate that RB1CC1 plays an important role in maintaining higher oxidative respiratory capacity in BRCA1-deficient mammary tumors.
Figure 3. Rb1cc1 deletion diminishes the oxidative respiratory capacity of BPK mammary tumors. (a) Representative OCR plot of BPK primary cells with Rb1cc1F/+ or rb1cc1F/F alleles measured using a Seahorse XF24 extracellular flux analyzer. Arrows mark the injections of respective inhibitors at specific time points. (O, oligomycin A; F, FCCP; R/A, rotenone-antimycin). Quantification of (b) basal, (c) maximal respiration, (d) ATP production, (e) spare capacity, (f) non-mitochondrial and (g) proton leak OCR measurements of BPK primary cells with Rb1cc1F/+ or rb1cc1F/F alleles (n = 4, from independent tumor samples each). Statistical significance was determined by two-tailed t-test, * denotes p ≤ 0.05.
Deletion of Rb1cc1 decreases the activation of MTOR substrates and expression of genes associated with mitochondrial biogenesis in BRCA1-deficient mammary tumor cells
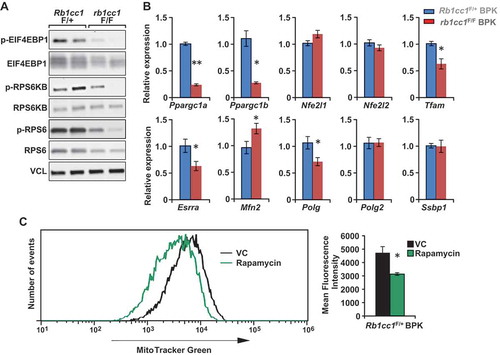
Mitochondrial homeostasis is regulated largely through the balance of mitophagy and mitochondrial biogenesis. A recent study has provided evidence for the involvement of Fanconi anemia proteins, which include BRCA1, in the process of mitophagy [Citation15]. As such, there is a possibility that the clearance of mitochondria through mitophagy is defective in BRCA1-deficient cells, irrespective of the presence or absence of RB1CC1. Hence, we focused on the potential effects of Rb1cc1 deletion on mitochondrial biogenesis as a cause for the decreased mitochondrial mass () and function (). The MTOR (mechanistic target of rapamycin kinase) pathway is an established regulator of mitochondrial biogenesis through its effects on master transcription factors of mitochondrial biogenesis [Citation29] and translation of mitochondrial proteins [Citation30]. Upon inspection of the MTOR pathway in the BPK mammary tumor cells, we found decreased levels of phosphorylated EIF4EBP1, RPS6KB and RPS6 in rb1cc1F/F BPK cells relative to Rb1cc1F/+ BPK cells, indicating a decrease in MTOR activity upon loss of Rb1cc1 (). Accordingly, we observed decreased levels of transcripts for key mitochondrial biogenesis regulators such as Ppargc1a, Ppargc1b, Tfam, Esrra and Polg (). Rb1cc1F/+ BPK tumor cells that were treated with spautin-1 for 48 h also exhibited diminished levels of phosphorylated MTOR substrates and mitochondrial biogenesis genes relative to vehicle-treated controls (Fig. S1A and S1B). When Rb1cc1F/+ BPK tumors were treated with the MTOR inhibitor rapamycin, we observed decreased mitochondrial mass relative to vehicle-treated controls (). Moreover, Rb1cc1F/+ BPK cells that were transduced to overexpress a constitutively active RHEB mutant (resulting in constitutively active MTOR) exhibited increased mitochondrial mass, indicating that MTOR activation is necessary and sufficient for mitochondrial biogenesis in BPK tumors (Fig. S1C and S1D). Altogether, these data indicate that the decreased mitochondrial function and mass upon Rb1cc1 deletion is associated with decreased MTOR activity and mitochondrial biogenesis.
Figure 4. Rb1cc1 deletion diminishes the phosphorylation of MTOR substrates and expression of mitochondrial biogenesis genes in BPK mammary tumors. (a) Immuno-blots showing levels of phospho-EIF4EBP1, EIF4EBP1, phospho-RPS6K, RPS6K, phospho-RPS6, RPS6 and VCL (vinculin) in BPK primary cells with Rb1cc1F/+ or rb1cc1F/F alleles (2 independent primary cell lysates each). (b) Bar charts showing gene expression levels of mitochondrial biogenesis-related genes in BPK primary cells with Rb1cc1F/+ or rb1cc1F/F alleles, analyzed by qRT-PCR (n = 12, triplicates of 4 independent samples each). Statistical significance was determined by two-tailed t-test, * denotes p ≤ 0.05, ** denotes p ≤ 0.01. (c) Histogram showing distribution of Rb1cc1F/+ BPK primary cells stained with MitoTracker Green after being transplanted into Nude mice and treated with vehicle or 5 mg/kg rapamycin (every other day, intraperitoneally, for a total of 3 doses). Bar charts showing the quantification of mean fluorescence intensities for MitoTracker Green staining in vehicle- and rapamycin-treated groups (n = 3 each). Statistical significance was determined by two-tailed t-test, * denotes p ≤ 0.05.
Deletion of Rb1cc1 sensitizes BRCA1-deficient mammary tumor cells to mitochondrial disrupting agents
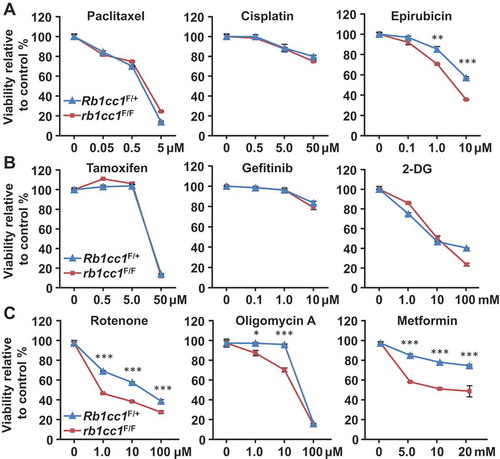
Next, we proceeded to address whether the differences in mitochondrial function upon loss of Rb1cc1 has any therapeutic relevance. Rb1cc1F/+ BPK and rb1cc1F/F BPK cells were treated with conventional chemotherapeutics, but both cells exhibited similar dose response curves in the presence of paclitaxel or cisplatin (). Conversely, a minor sensitization was observed when the cells were treated with epirubicin (). Treatment with tamoxifen, gefitinib or 2-deoxy-D-glucose also resulted in indiscernible dose response curves for the pair of cells (). Interestingly, when mitochondrial disrupting agents such as rotenone, oligomycin A and metformin were used, rb1cc1F/F BPK cells were more sensitized to these drugs relative to Rb1cc1F/+ BPK cells (). This increased sensitivity of rb1cc1F/F BPK cells to mitochondrial disruptors could also be observed when cell viability was measured using a fluorescent dye that allows the quantification of DNA (CyQuant) and indicated that the viability readings obtained were not due to differential changes in metabolic activity per se (data not shown). Along with our previous observations, these data suggest that the reduced mitochondrial function in BRCA1-deficient cells lacking Rb1cc1 may lower their threshold of sensitivity to inhibitors of mitochondrial function.
Figure 5. Rb1cc1 deletion sensitizes BPK mammary tumors to mitochondrial-disrupting agents. BPK cells were plated at a density of 10,000 cells per well in a 96-well format and incubated overnight before treatment with respective drugs for 48 h. Dose response curves for BPK primary cells with Rb1cc1F/+ or rb1cc1F/F alleles treated with (a) chemotherapeutic drugs, (b) targeted therapeutic drugs or (c) mitochondrial-disrupting agents. (Data points represent n = 6, triplicates of 2 independent experiments.) Statistical significance was determined by two-tailed t-test, * denotes p ≤ 0.05, ** denotes p ≤ 0.01 and *** denotes p ≤ 0.001.
Spautin-1 treatment in combination with metformin improved therapeutic outcomes
In order to address whether pharmacological inhibition of autophagy can also lead to sensitization of BRCA1-deficient mammary tumor cells to mitochondrial disruptors, we examined the combinatorial targeting of these cells with spautin-1, a specific autophagy inhibitor that disrupts the PIK3C3/Vps34 complex, in combination with metformin. Assessment of mitochondrial function by extracellular flux analysis in the presence of these inhibitors revealed that metformin was very effective in reducing basal OCR (95% inhibition) when compared with spautin-1 (65% inhibition) (). Conversely, spautin-1 was able to reduce spare respiratory capacity to a larger extent (85% inhibition) as compared with metformin (25% inhibition) (). Importantly, the combination of metformin and spautin-1 depleted both basal OCR and spare respiratory capacity to levels achieved by the respective inhibitors when used alone. Moreover, the combination of spautin-1 and metformin exerted highest potency in reducing the colony-forming ability of BRCA1-deficient mammary tumor cells relative to single-drug treatments and vehicle controls (). These results suggest that the drugs target different aspects of mitochondrial function and are in line with our previous observations where genetic inhibition of autophagy sensitizes BRCA1-deficient mammary tumor cells to metformin ().
Figure 6. Effects of spautin-1 treatment in combination with metformin. (a) Representative OCR plot of Rb1cc1F/+ BPK primary cells treated with vehicle, 2.5 mM metformin, 2.5 μM spautin-1, or 2.5 mM metformin + 2.5 µM spautin-1 for 24 h and measured using a Seahorse XF24 extracellular flux analyzer. (b) Quantification of basal and spare capacity of Rb1cc1F/+ BPK primary cells treated with vehicle, 2.5 mM metformin, 2.5 μM spautin-1, or 2.5 mM metformin + 2.5 μM spautin-1(n = 4 independent experiments). Statistical significance was determined by two-tailed t-test, * denotes p ≤ 0.05, ** denotes p ≤ 0.01 and *** denotes p ≤ 0.001. (c) Representative image and (d) quantification of colony-forming assays with Rb1cc1F/+ BPK primary cells treated with vehicle, 2.5 mM metformin, 2.5 μM spautin-1, or 2.5 mM metformin + 2.5 μM spautin-1 for a week (n = 9, triplicates from 3 independent experiments). Statistical significance was determined by two-tailed t-test, *** denotes p ≤ 0.001. (e) Tumor growth curves of Rb1cc1F/+ BPK primary cells transplanted into Nude mice and treated daily with vehicle, 100 mg/kg metformin, 40 mg/kg spautin-1 or the combination of metformin and spautin-1 (n = 10 tumors each). Statistical significance for growth curves was determined via ANCOVA. *** denotes p ≤ 0.001. (f) Quantification of the percentage of MKI67-positive cells and cleaved-CASP3-positive cells in Rb1cc1F/+ BPK primary cells transplanted into Nude mice and treated daily with vehicle, 100 mg/kg metformin, 40 mg/kg spautin-1 or the combination of metformin and spautin-1 (n = 6 tumors each). Representative images of (g) MKI67-positive cells and (h) cleaved-CASP3-positive cells in Rb1cc1F/+ BPK primary cells transplanted into Nude mice and treated daily with vehicle, 100 mg/kg metformin, 40 mg/kg spautin-1 or the combination of metformin and spautin-1.
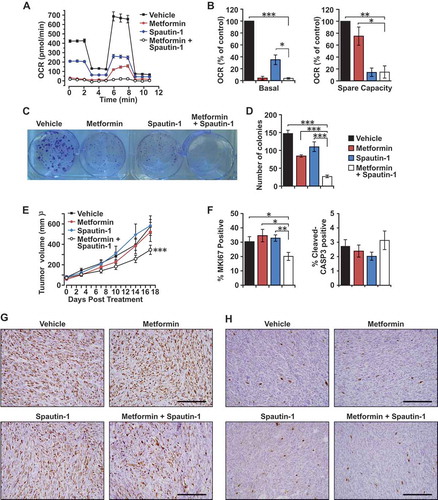
The efficacy of this drug combination was also evaluated on Rb1cc1F/+ BPK cells transplanted into nude mice. Only the combination of both drugs showed efficacy in retarding tumor growth by ~ 40% after 17 days of treatment when compared to vehicle and single-agent controls (). BRCA1-deficient tumors that were treated with the combination of metformin and spautin-1 were less proliferative as indicated by the percentage of MKI67/Ki-67-positive cells (~ 20% positive) when compared with controls (~ 30% positive) (). However, we did not observe significant differences in the number of cleaved-CASP3 (caspase 3)-positive cells between the respective tumor cohorts (). These findings indicate that, although they do not have significant effects on tumor growth when administered individually, the combination of metformin and spautin-1 can limit the growth capacity of BRCA1-deficient tumors in vivo.
Discussion
BRCA1-deficient tumors represent about half of inherited breast cancer cases, and aberrant silencing of BRCA1 in sporadic cases have also been observed [Citation1]. The loss of BRCA1 function has been associated with metabolic alterations [Citation6,Citation13,Citation14,Citation16,Citation17] and conversely, mutations in the metabolic enzymes IDH1/IDH2 can also lead to the acquisition of a ‘BRCAness’ phenotype, which sensitizes tumor cells to PARP1 inhibition [Citation31,Citation32]. In view of the interplay between BRCA1-deficiency and unique metabolic alterations, we generated a unique mouse model where the essential autophagy gene Rb1cc1 is deleted along with Brca1 and Trp53, and showed that Rb1cc1 contributes to the development of BRCA1-deficient mammary tumors (). These results suggest that the autophagic process, which is important under nutrient-limiting conditions, may play a tumor-promoting role in this important subset of breast tumors.
Interestingly, in this study, loss of Rb1cc1 in BRCA1-deficient mammary cells led to a decrease in mitochondrial mass (). Previously, we and others have observed that the loss of autophagy-related genes causes an accumulation of mitochondrial mass that can be attributed to defective mitophagy [Citation20,Citation22,Citation23,Citation33]. However, in the context of mammary tumor cells lacking BRCA1 and TRP53/TP53, deletion of Rb1cc1 decreased mitochondrial mass. A recent study has implicated Fanconi anemia genes, which include BRCA1, in the process of mitophagy [Citation15]. It could be possible that this may lead to an accumulation of mitochondrial mass in BRCA1-deficient mammary tumors that are mitophagy deficient and hence, depletion of RB1CC1 does not induce a further increase in mitochondrial mass. Instead, we observed a decrease in mitochondrial mass upon Rb1cc1 deletion that is associated with decreased phosphorylation of MTOR substrates (RPS6KB, RPS6 and EIF4EBP1) and decreased expression of mitochondrial biogenesis genes (). This is consistent with our previous observations in the MMTV-PyMT model where p-RPS6KB levels were reduced upon deletion of Rb1cc1 [Citation23]. Coupled with the fact that MTOR can regulate mitochondrial biogenesis [Citation29,Citation30], our results suggest that the decrease in mitochondrial mass in BRCA1-deficient mammary tumor cells could be attributed at least in part to decreased MTOR activity.
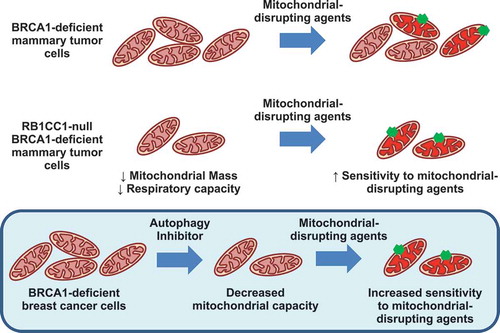
Although we did not observe a characteristic increase in mitochondrial mass that is associated with depletion of autophagy-related genes, we did observe impairment of mitochondrial function and oxidative phosphorylation in these BRCA1-deficient mammary tumor cells that lacked Rb1cc1 (). Spautin-1 treatment of BPK cells also diminished oxidative respiratory capacity (). This is in line with other studies where deletion of Atg7 led to decreased supply of glutamine for mitochondrial metabolism in BRAFV600E-driven and KRAS-driven lung tumors [Citation20,Citation22]. Importantly, the defective mitochondrial metabolism in Rb1cc1-deleted BRCA1-deficient cells resulted in sensitization to mitochondrial disrupting agents, which include metformin, oligomycin A and rotenone (). This was also observed when pharmacological inhibition of autophagy via spautin-1 sensitized BRCA1-deficient tumors to metformin administration in vivo (). To our knowledge, there are no prior reports showing sensitization of cancer cells to mitochondrial disruptors upon autophagy inhibition, and this may provide an additional avenue where autophagy inhibitors can be utilized in combination with mitochondrial disrupting agents such as metformin (). Additionally, a study involving gene expression analysis of metformin-resistant MCF-7 cells have implicated the upregulation of autophagy and degradome-related gene expression profiles [Citation34]. This supports the notion that autophagy may play a role in overcoming metabolic stress that is induced by metformin.
Figure 7. Model of sensitization to mitochondrial disruption in RB1CC1-deficient BPK mammary tumor cells.
Metformin is classified as a biguanide that is a first line treatment for type 2 diabetes, and its main mechanism of action is presumed to be through inhibition of complex I in mitochondria [Citation35,Citation36]. Additionally, metformin is currently being evaluated in a phase III clinical trial for early-stage breast cancer [Citation37]. Activation of AMPK upon metformin treatment has been suggested to be due to energy stress after complex I inhibition, whereas its inhibitory effects on MTOR signaling were reported to be due to restrained RRAGC nuclear shuttling after inhibition of mitochondrial respiratory complex activity [Citation36]. Accordingly, we observed decreased oxidative respiratory capacity and colony-forming ability with metformin treatment in BRCA1-deficient cells that were exacerbated when the combination of metformin and spautin-1 was used (). However, metformin alone did not exhibit any tumor growth inhibition in mice and this could possibly be due to lower effective concentrations that can be achieved in vivo [Citation38]. Despite that, the combination of metformin and spautin-1 was able to reduce the proliferative capacity and growth of BRCA1-deficient tumors in mice () and this is consistent with the sensitization effect that we observed upon loss of Rb1cc1 in vitro (). Moreover, we also found that metformin can reduce the growth of tumors established from rb1cc1F/F BPK cells (Fig. S2A) despite having no effect on Rb1cc1F/+ BPK cells (). Together, these results show that either pharmacological or genetic inhibition of autophagy in BPK cells can improve the efficacy of metformin. Importantly, this sensitization upon autophagy inhibition may help to alleviate concerns of unattainable plasma concentrations of metformin in vivo. It is interesting to note that metformin has been shown to decrease the sphere-forming ability of BRCA1-mutant mammary epithelial cells [Citation14] and breast cancer stem cell (CSC) properties [Citation35,Citation39]. We observe similar effects of metformin in reducing sphere-forming efficiency of BPK cells and this is accentuated if spautin-1 was used in combination (Fig. S2B). Nonetheless, a possible limitation of breast CSC-targeted therapies may be their inability to effectively reduce bulk tumor volume (due to the small population size of CSCs) and this has led to proposals to reconsider the evaluation criteria for CSC-targeted therapeutics in the clinic [Citation40]. Hence, it would be interesting to address whether the combination of autophagy inhibitors with metformin may exert positive therapeutic outcomes in tumor models for relapse and recurrence, as autophagy has also been shown to be important for maintaining breast CSC properties [Citation41–Citation44], and these are the scenarios where CSCs are thought to play a crucial role. Alternatively, the combination of metformin with an autophagy inhibitor can be evaluated in an adjuvant setting after chemotherapy or surgical resection.
The BRCA1 gene in humans is located on chromosome 17q21, and several autophagy genes such as BECN1 and NBR1 are within close proximity. BECN1 has been shown to have haplo-insufficient functions as a tumor suppressor [Citation45,Citation46] and focal deletions that encompass both BRCA1 and BECN1 were found to be enriched in breast and ovarian tumors [Citation47]. From our studies, deletion of Rb1cc1 inhibited tumorigenesis but did not affect tumor growth () and while we cannot completely exclude other potential interpretations of our results, these data would suggest that autophagy does not exert tumor suppressive effects in this BRCA1-deficient model of breast cancer. However, both Becn1 and Rb1cc1 may have non-autophagy related functions and this can be clarified with the use of our autophagy deficient Rb1cc1 knock-in allele in the near future [Citation48]. Notwithstanding, the co-deletion of BRCA1 and BECN1 due to their proximity may represent an opportunity that can be exploited to gain the best benefits from metformin administration. Apart from a combinatorial approach with autophagy inhibitors and metformin, it would be interesting to test whether patients stratified based on co-deletion of BRCA1 and BECN1 will respond better to metformin, because our results indicate that autophagy inhibition sensitizes BRCA1-deficient cells to mitochondrial-disrupting agents ().
We have previously demonstrated a tumor promoting function for RB1CC1 in MMTV-PyMT-driven tumors [Citation23] and distinct CSC populations within these tumors [Citation41]. Our results here extend the requirement for this essential autophagy gene in the initiation of BRCA1-deficient mammary tumors, but unlike in MMTV-PyMT driven tumors [Citation23], we did not observe decreased tumor growth upon loss of Rb1cc1 (). It is possible that upon deletion of Rb1cc1, there was a decrease in tumorigenesis because of a need to acquire additional mutations to circumvent the requirement for autophagy (). Hence, the tumors that do arise were no longer dependent on autophagy for tumor growth (). Conversely, PyMT tumors may continuously have a strong dependence on autophagy due to activation of oncogenic RAS signaling [Citation19,Citation20,Citation24]. Accordingly, this suggests that inhibition of RB1CC1 or autophagy may be effective as a prophylactic but not necessarily as a therapeutic intervention on its own in BRCA1-deficient breast tumors (). It is also worth noting that administration of spautin-1 to inhibit autophagy in an acute manner did not affect the growth of BRCA1-deficient tumors in vivo (), supporting the idea that combinatorial targeting of autophagy and mitochondria function, but not autophagy inhibition on its own, would be necessary for effective treatment of this subset of breast cancer.
The requirement for autophagy genes in mammary tumorigenesis has been investigated in multiple mouse models of breast cancer that are representative of different disease subtypes. Primarily, the effects of Becn1 heterozygosity have been studied in MMTV-PyMT (Luminal B subtype), MMTV-Neu (Her2 subtype), MMTV-Wnt1 (Basal-like subtype), and Palb2F/F; WAP-Cre breast cancer models [Citation25–Citation27]. Although BECN1 promoted palb2F/F; WAP-Cre driven tumor initiation, it had no effect on the development of MMTV-Neu and MMTV-PyMT tumors. Conversely, a tumor suppressive effect was observed for MMTV-Wnt1 tumors, but this was ascribed to possibly a non-autophagy function of BECN1 [Citation25]. These contextual outcomes imply that the requirement for autophagy would depend on the genetic drivers and cell states within tumors. The data presented in this study expand our understanding of the contexts where autophagy inhibition can be beneficial and also unravel a novel sensitization of BRCA1-deficient breast tumors to mitochondrial disruptors upon autophagy inhibition.
Materials and methods
Reagents and antibodies
MitoTracker Green FM (Invitrogen, M7514) dye was used to stain total mitochondria and MitoTracker Red CMXRos (Invitrogen, M7512) dye was utilized for staining of mitochondria with intact membrane potential. Antibodies used in this study were ACTB (Sigma-Aldrich, A5441), VCL/vinculin (Sigma-Aldrich, V4505), MAP1LC3B (Cell Signaling Technology, 2775), SQSTM1 (Cell Signaling Technology, 5114), SQSTM1 (Enzo Life Sciences, BML-PW9860), TOMM20 (Santa Cruz Biotechnology, SC-11,415), phospho-EIF4EBP1 (Cell Signaling Technology, 9451), EIF4EBP1 (Cell Signaling Technology, 9644), phospho-RPS6KB (Cell Signaling Technology, 9205), RPS6KB (Santa Cruz Biotechnology, SC-230), phospho-RPS6 (Cell Signaling Technology, 5364), RPS6 (Cell Signaling Technology, 2317), PECAM1/CD31-PacBlue (Biolegend, 102,422), PTPRC/CD45-PacBlue (Biolegend, 103,126), LY76/Ter119-PacBlue (Biolegend, 116,232) and CD24-Alexa Fluor 647 (Biolegend, 101,818). Inhibitors used in this study include paclitaxel (Sigma-Aldrich, T7402), cisplatin (Apexbio, A8321), epirubicin (Sigma-Aldrich, E9406), tamoxifen (Sigma-Aldrich, T5648), rotenone (Sigma-Aldrich, R8875), oligomycin A (Sigma-Aldrich, 75,351), gefitinib (Cayman Chemical, 13,166), 2-deoxy-D-glucose (Cayman Chemical, 14,325), bafilomycin A1 (Cayman Chemical, 11,038) rapamycin (LC Laboratories, R-5000), spautin-1 (Apexbio, B5873) and metformin (Apexbio, B1970).
Cell culture and treatment
Tumor cells derived from BRCA1-deficient tumors were cultured in DMEM/F12 medium (Gibco, 11,330–032) supplemented with 10% fetal bovine serum (Atlanta Biologicals, S11150), 10 ng/ml EGF (Gibco, PMG8041), 20 μg/ml insulin (Gemini Bio-products, 700-112P) and 50 units/ml penicillin-streptomycin (Gibco, 15,140–122). Viability of cells after treatment was determined using alamarBlue reagent (Thermo Scientific, Y00100). In colony-formation assays, a plating density of 1000 cells/well in 6-well plates was used and the number of colonies that formed after 7 days were quantified after crystal violet staining. To induce amino acid starvation, cells were cultured in Hanks’ balanced salt solution (HBSS; Gibco, 14,025).
Flow cytometry
Dissociated single-cell suspensions from primary tumors (as described previously [Citation41]) or cultured cells were incubated with MitoTracker dyes at a concentration of 25 nM for 15 min at 37°C. Cells were then rinsed before incubation with Lineage (PECAM1/CD31, PTPRC/CD45, LY76/Ter119) and CD24 antibodies for 20 min at 4°C. Cells were then rinsed before sorting or analysis by FACSAria or FACSCanto instruments (BD Biosciences, San Jose, CA, USA). Flow cytometry data were analyzed using FlowJo (Ashland, OR, USA) software.
Tumor mice and transplants
brca1F/F trp53F/F K14-Cre mice that have been previously described [Citation28] were obtained from Dr. Jos Jonkers (Netherlands Cancer Institute) and were crossed with rb1cc1F/F mice [Citation49] to generate Rb1cc1+/+ brca1F/F trp53F/F K14-Cre, Rb1cc1F/+ brca1F/F trp53F/F K14-Cre or rb1cc1F/F brca1F/F trp53F/F K14-Cre mice. The tumor cohorts were maintained on a congenic FVB/N background. Mice were housed and handled according to local, state, and federal regulations, and all experimental procedures were carried out according to the guidelines of the Institutional Animal Care and Use Committee at the University of Cincinnati. For transplantation of BRCA1-deficient mammary tumors, cells were prepared in DMEM:Matrigel (Gibco, 11,995–065; Corning, 354,230) at a 1:1 ratio and 1 × 10⁶ cells were injected in a 50-μl volume orthotopically into the fourth inguinal mammary fat pads of athymic Nude mice (Envigo, Hsd:Athymic Nude-Foxn1nu). Mice with transplanted tumors were randomized into respective treatment groups when the volume of tumors reached ≥ 50 mm3. Spautin-1 and metformin were prepared in vehicle for daily intraperitoneal injections at doses of 40 mg/kg and 100 mg/kg, respectively. Vehicle consisted of phosphate-buffered saline (PBS; Gibco, 14,190–144), 5% Tween-80 (Sigma-Aldrich, P1754), and 5% PEG400 (Sigma-Aldrich, 202,398). Spautin-1 was pre-dissolved in dimethyl sulfoxide (DMSO; Fisher Chemical, BP231) before dilution with vehicle. Rapamycin was prepared in the same vehicle for intraperitoneal injections every other day at doses of 5 mg/kg. Tumors were measured using calipers and volume was calculated as (1/2)(length)(width)2.
Histology and immunohistochemistry
For immunofluorescence of cultured cells, fixation was carried out with 4% paraformaldehyde-DPBS (Sigma, P6148; HyClone, SH30013.03) for 15 min, permeabilization with 0.3% Triton X-100 (Sigma-Aldrich, X100) in PBS for 15 min, blocking with 2% bovine serum albumin (BSA; Sigma-Aldrich, A7030) and 0.3% Triton X-100 in PBS for 30 min and incubation with primary antibody at a dilution of 1:200 in 2% BSA overnight at 4°C. This was followed by incubation with anti-rabbit-Texas Red secondary antibody (1:200; Jackson ImmunoResearch, 111–075-003) for 1 h at room temperature and slides were mounted with Diamond Prolong Antifade reagent with DAPI (Invitrogen, P36966). Images were then acquired with a fixed-thickness section on a Zeiss LSM710 confocal microscope with a Zeiss AxioObserver Z1 stand (Carl Zeiss Microscopy, Thornwood, NY, USA). For histological analysis of tissues, samples were fixed overnight in 10% phosphate-buffered formalin (Fisher Chemical, SF98-4), dehydrated in alcohol gradients, xylene and paraffin before being embedded. Next, they were sectioned into 5-μm thick slices and subjected to immuno-histochemistry as previously described [Citation23].
Immunoblotting
Lysates were prepared using modified radio immunoprecipitation assay (RIPA) buffer as described previously [Citation23] with the addition of Halt protease and phosphatase inhibitors (Thermo Scientific, 78,425; 78,428). Protein concentrations were then quantified by the bicinchoninic acid method, subjected to SDS-PAGE and analyzed by immunoblotting as described previously [Citation23].
Quantitative PCR
Total RNA was isolated from cells using an RNAeasy kit (Qiagen, 74,004) per the manufacturer’s instructions. Equal amounts of RNA were then reverse-transcribed using SuperScript III first-strand synthesis kit (Invitrogen, 18,080–044) using random hexamers as primers. cDNA samples were then subjected to qRT-PCR analysis with SYBR Green (BioRad, 1,725,121) in a BioRad CFXConnect (Bio-Rad, Hercules, CA, USA) thermo-cycler. The primers used for mitochondrial biogenesis genes were as previously listed [Citation50].
Extracellular flux metabolic assays
OCR and ECAR measurements were collected using a Seahorse XF24 Extracellular Flux Analyzer as described previously [Citation51]. Briefly, 20,000 cells per well were seeded in Seahorse 24-well XF Cell Culture Microplates (Seahorse Bioscience, 100,777–004) and incubated overnight at 37°C with 5% CO2. Mitochondria stress tests were initiated according to the manufacturer’s instructions by replacing the growth medium in each well with 500 µl of Seahorse XF Base Medium (Seahorse Bioscience, 102,353–100) supplemented with 10 mM glucose (Sigma-Aldrich, G8769), 2 mM L-glutamine (Corning, 25–005-Cl) and 1 mM sodium pyruvate (HyClone, SH30239.01) pre-warmed at 37°C. Cells were then incubated at 37°C in a non-CO2 incubator for 60 min to allow temperature and pH equilibration. After an OCR baseline measurement, the minimum oxygen consumption was determined by injection of 4 µM oligomycin and sequentially the maximal respiration rate was assessed upon injection of 0.5 µM carbonyl cyanide 4-(trifluoromethoxy)phenylhydrazone (FCCP; Sigma Aldrich, C2920). Finally, the non-mitochondrial oxygen consumption was evaluated after injection of both 0.5 µM rotenone and antimycin A (Sigma Aldrich, A8674). The measurements were normalized to cell number, which were quantified using CyQuant DNA dye (Invitrogen, C7026). Analysis of data was carried out using Wave software and the XF Mito/Glycolysis stress test report generator (Seahorse Bioscience/Agilent, Santa Clara, CA, USA).
Statistical analysis
Data were plotted as means ± SEM and statistical significance was determined using a two-tailed t-test. For tumor-free survival curves, statistical significance was determined using a Log-Rank test (Mantel-Cox). For tumor growth curves, ANCOVA test was used to determine significance. The threshold for significance of p values was 0.05.
Abbreviations
| BPK | = | brca1F/F;trp53F/F;K14-Cre |
| BRCA1 | = | BRCA1, DNA repair associated |
| CSC | = | cancer stem cell |
| LP | = | luminal progenitors |
| MMTV | = | mouse mammary tumor virus |
| MTOR | = | mechanistic target of rapamycin kinase |
| OCR | = | oxygen consumption rate |
| PBS | = | phosphate-buffered saline |
| PyMT | = | polyoma middle T antigen |
| RB1CC1/FIP200 | = | RB1 inducible coiled-coil 1 |
| SQSTM1 | = | sequestosome 1 |
Supplemental Material
Download Zip (666.1 KB)Acknowledgments
We would like to thank Dylan Gierok and Rose Copley for help with genotyping and the University of Cincinnati LAMS staff for their support with regards to mouse colony maintenance and husbandry. Brca1F/F Trp53F/F mice were kindly provided by Dr. Jos Jonkers from the Netherlands Cancer Institute. We appreciate the help from Glenn Doerman in preparation of figures. We are grateful to members of the Guan lab for critical appraisal and suggestions in the preparation of this manuscript. This research was supported by NIH grants to J.-L. Guan.
Disclosure statement
No potential conflict of interest was reported by the authors.
Supplemental material
Supplemental data for the article can be accessed here
Additional information
Funding
Related Research Data
References
- Birgisdottir V, Stefansson OA, Bodvarsdottir SK, et al. Epigenetic silencing and deletion of the BRCA1 gene in sporadic breast cancer. Breast Cancer Res. 2006;8(4):R38. PubMed PMID: 16846527; PubMed Central PMCID: PMC1779478. eng.
- Lord CJ, Ashworth A. BRCAness revisited. Nat Rev Cancer. 2016 Feb;16(2):110–120. PubMed PMID: 26775620; eng.
- Venkitaraman AR. Cancer susceptibility and the functions of BRCA1 and BRCA2. Cell. 2002 Jan;108(2):171–182. PubMed PMID: 11832208; eng.
- Sorlie T, Tibshirani R, Parker J, et al. Repeated observation of breast tumor subtypes in independent gene expression data sets. Proc Natl Acad Sci U S A. 2003 Jul;100(14):8418–8423. PubMed PMID: 12829800; PubMed Central PMCID: PMCPMC166244. eng.
- Lim E, Vaillant F, Wu D, et al. Aberrant luminal progenitors as the candidate target population for basal tumor development in BRCA1 mutation carriers. Nat Med. 2009 Aug;15(8):907–913. PubMed PMID: 19648928; eng.
- Nolan E, Vaillant F, Branstetter D, et al. RANK ligand as a potential target for breast cancer prevention in BRCA1-mutation carriers. Nat Med. 2016 Aug;22(8):933–939. PubMed PMID: 27322743; eng.
- Proia TA, Keller PJ, Gupta PB, et al. Genetic predisposition directs breast cancer phenotype by dictating progenitor cell fate. Cell Stem Cell. 2011 Feb;8(2):149–163. PubMed PMID: 21295272; PubMed Central PMCID: PMCPMC3050563. eng.
- Sau A, Lau R, Cabrita MA, et al. Persistent Activation of NF-κB in BRCA1-Deficient Mammary Progenitors Drives Aberrant Proliferation and Accumulation of DNA Damage. Cell Stem Cell. 2016 Jul;19(1):52–65. PubMed PMID: 27292187; eng.
- Sawyer SL, Tian L, Kähkönen M, et al. Biallelic mutations in BRCA1 cause a new Fanconi anemia subtype. Cancer Discov. 2015 Feb;5(2):135–142. PubMed PMID: 25472942; PubMed Central PMCID: PMCPMC4320660. eng.
- Sedic M, Skibinski A, Brown N, et al. Haploinsufficiency for BRCA1 leads to cell-type-specific genomic instability and premature senescence. Nat Commun. 2015 Jun;6:7505. PubMed PMID: 26106036; PubMed Central PMCID: PMCPMC4491827. eng.
- Gorrini C, Baniasadi PS, Harris IS, et al. BRCA1 interacts with Nrf2 to regulate antioxidant signaling and cell survival. J Exp Med. 2013 Jul;210(8):1529–1544. PubMed PMID: 23857982; PubMed Central PMCID: PMCPMC3727320. eng.
- Gorrini C, Gang BP, Bassi C, et al. Estrogen controls the survival of BRCA1-deficient cells via a PI3K-NRF2-regulated pathway. Proc Natl Acad Sci U S A. 2014 Mar;111(12):4472–4477. PubMed PMID: 24567396; PubMed Central PMCID: PMCPMC3970526. eng.
- Martinez-Outschoorn UE, Balliet R, Lin Z, et al. BRCA1 mutations drive oxidative stress and glycolysis in the tumor microenvironment: implications for breast cancer prevention with antioxidant therapies. Cell Cycle. 2012 Dec;11(23):4402–4413. PubMed PMID: 23172369; PubMed Central PMCID: PMCPMC3552923. eng.
- Cuyàs E, Fernández-Arroyo S, Alarcón T, et al. Germline BRCA1 mutation reprograms breast epithelial cell metabolism towards mitochondrial-dependent biosynthesis: evidence for metformin-based “starvation” strategies in BRCA1 carriers. Oncotarget. 2016 May. PubMed PMID: 27259235; ENG. DOI:10.18632/oncotarget.9732
- Sumpter R, Sirasanagandla S, Fernández Á, et al. Fanconi Anemia Proteins Function in Mitophagy and Immunity. Cell. 2016 May;165(4):867–881. PubMed PMID: 27133164; PubMed Central PMCID: PMCPMC4881391. eng.
- Brunet J, Vazquez-Martin A, Colomer R, et al. BRCA1 and acetyl-CoA carboxylase: the metabolic syndrome of breast cancer. Mol Carcinog. 2008 Feb;47(2):157–163. PubMed PMID: 17620310; eng.
- Moreau K, Dizin E, Ray H, et al. BRCA1 affects lipid synthesis through its interaction with acetyl-CoA carboxylase. J Biol Chem. 2006 Feb;281(6):3172–3181. PubMed PMID: 16326698; eng.
- Mizushima N, Komatsu M. Autophagy: renovation of cells and tissues. Cell. 2011;147:728–741.
- Lock R, Roy S, Kenific CM, et al. Autophagy facilitates glycolysis during Ras-mediated oncogenic transformation. Mol Biol Cell. 2011 Jan;22(2):165–178. PubMed PMID: 21119005; PubMed Central PMCID: PMCPMC3020913. eng.
- Guo JY, Teng X, Laddha SV, et al. Autophagy provides metabolic substrates to maintain energy charge and nucleotide pools in Ras-driven lung cancer cells. Genes Dev. 2016 Aug;30(15):1704–1717. PubMed PMID: 27516533; PubMed Central PMCID: PMCPMC5002976. eng.
- Karantza-Wadsworth V, Patel S, Kravchuk O, et al. Autophagy mitigates metabolic stress and genome damage in mammary tumorigenesis. Genes Dev. 2007 Jul;21(13):1621–1635. PubMed PMID: 17606641; PubMed Central PMCID: PMCPMC1899472. eng.
- Strohecker AM, White E. Autophagy promotes BrafV600E-driven lung tumorigenesis by preserving mitochondrial metabolism. Autophagy. 2014 Feb;10(2):384–385. PubMed PMID: 24362353; eng.
- Wei H, Wei S, Gan B, et al. Suppression of autophagy by FIP200 deletion inhibits mammary tumorigenesis. Genes Dev. 2011;25:1510–1527.
- White E. Deconvoluting the context-dependent role for autophagy in cancer. Nat Rev Cancer. 2012 Jun;12(6):401–410. PubMed PMID: 22534666; PubMed Central PMCID: PMCPMC3664381. eng.
- Cicchini M, Chakrabarti R, Kongara S, et al. Autophagy regulator BECN1 suppresses mammary tumorigenesis driven by WNT1 activation and following parity. Autophagy. 2014;10(11):2036–2052. PubMed PMID: 25483966; PubMed Central PMCID: PMCPMC4502817. eng.
- Huo Y, Cai H, Teplova I, et al. Autophagy opposes p53-mediated tumor barrier to facilitate tumorigenesis in a model of PALB2-associated hereditary breast cancer. Cancer Discov. 2013 Aug;3(8):894–907. PubMed PMID: 23650262; PubMed Central PMCID: PMCPMC3740014. eng.
- Lozy F, Cai-McRae X, Teplova I, et al. ERBB2 overexpression suppresses stress-induced autophagy and renders ERBB2-induced mammary tumorigenesis independent of monoallelic Becn1 loss. Autophagy. 2014 Apr;10(4):662–676. PubMed PMID: 24492513; PubMed Central PMCID: PMCPMC4091153. eng.
- Liu X, Holstege H, Van Der Gulden H, et al. Somatic loss of BRCA1 and p53 in mice induces mammary tumors with features of human BRCA1-mutated basal-like breast cancer. Proc Natl Acad Sci U S A. 2007 Jul;104(29):12111–12116. PubMed PMID: 17626182; PubMed Central PMCID: PMCPMC1924557. ENG.
- Cunningham JT, Rodgers JT, Arlow DH, et al. mTOR controls mitochondrial oxidative function through a YY1-PGC-1alpha transcriptional complex. Nature. 2007 Nov;450(7170):736–740. PubMed PMID: 18046414; eng.
- Morita M, Gravel SP, Chénard V, et al. mTORC1 controls mitochondrial activity and biogenesis through 4E-BP-dependent translational regulation. Cell Metab. 2013 Nov;18(5):698–711. PubMed PMID: 24206664; eng.
- Sulkowski PL, Corso CD, Robinson ND, et al. 2-Hydroxyglutarate produced by neomorphic IDH mutations suppresses homologous recombination and induces PARP inhibitor sensitivity. Sci Transl Med. 2017 Feb;9(375). PubMed PMID: 28148839; eng. DOI:10.1126/scitranslmed.aal2463
- Lu Y, Kwintkiewicz J, Liu Y, et al. Chemosensitivity of IDH1-Mutated Gliomas Due to an Impairment in PARP1-Mediated DNA Repair. Cancer Res. 2017 Apr;77(7):1709–1718. PubMed PMID: 28202508; PubMed Central PMCID: PMCPMC5380481. eng.
- Chourasia AH, Tracy K, Frankenberger C, et al. Mitophagy defects arising from BNip3 loss promote mammary tumor progression to metastasis. EMBO Rep. 2015 Sep;16(9):1145–1163. PubMed PMID: 26232272; PubMed Central PMCID: PMCPMC4576983. eng.
- Oliveras-Ferraros C, Vazquez-Martin A, Cuyàs E, et al. Acquired resistance to metformin in breast cancer cells triggers transcriptome reprogramming toward a degradome-related metastatic stem-like profile. Cell Cycle. 2014;13(7):1132–1144. PubMed PMID: 24553122; PubMed Central PMCID: PMCPMC4013163. eng.
- Janzer A, German NJ, Gonzalez-Herrera KN, et al. Metformin and phenformin deplete tricarboxylic acid cycle and glycolytic intermediates during cell transformation and NTPs in cancer stem cells. Proc Natl Acad Sci U S A. 2014 Jul;111(29):10574–10579. PubMed PMID: 25002509; PubMed Central PMCID: PMCPMC4115496. eng.
- Wu L, Zhou B, Oshiro-Rapley N, et al. An ancient, unified mechanism for metformin growth inhibition in C. elegans and cancer. Cell. 2016 Dec;167(7):1705–1718.e13. PubMed PMID: 27984722; eng.
- Goodwin PJ, Parulekar WR, Gelmon KA, et al. Effect of metformin vs placebo on and metabolic factors in NCIC CTG MA.32. J Natl Cancer Inst. 2015 Mar;107(3). PubMed PMID: 25740979; PubMed Central PMCID: PMCPMC4565534. eng. DOI:10.1093/jnci/djv006
- Lalau JD, Lemaire-Hurtel AS, Lacroix C. Establishment of a database of metformin plasma concentrations and erythrocyte levels in normal and emergency situations. Clin Drug Investig. 2011;31(6):435–438. PubMed PMID: 21401215; eng.
- Hirsch HA, Iliopoulos D, Tsichlis PN, et al. Metformin selectively targets cancer stem cells, and acts together with chemotherapy to block tumor growth and prolong remission. Cancer Res. 2009 Oct;69(19):7507–7511. PubMed PMID: 19752085; PubMed Central PMCID: PMCPMC2756324. eng.
- Brooks MD, Burness ML, Wicha MS. Therapeutic implications of cellular heterogeneity and plasticity in breast cancer. Cell Stem Cell. 2015 Sep;17(3):260–271. PubMed PMID: 26340526; PubMed Central PMCID: PMCPMC4560840. eng.
- Yeo SK, Wen J, Chen S, et al. Autophagy differentially regulates distinct breast cancer stem-like cells in murine models via EGFR/Stat3 and Tgfβ/Smad Signaling. Cancer Res. 2016 Jun;76(11):3397–3410. PubMed PMID: 27197172; PubMed Central PMCID: PMCPMC4990205. eng.
- Cufi S, Vazquez-Martin A, Oliveras-Ferraros C, et al. Autophagy positively regulates the CD44(+) CD24(-/low) breast cancer stem-like phenotype. Cell Cycle. 2011;10(22):3871–3885.
- Gong C, Bauvy C, Tonelli G, et al. Beclin1 and autophagy are required for the tumorigenicity of breast cancer stem-like/progenitor cells. Oncogene. 2013;32(18):2261–2272.
- Maycotte P, Jones KL, Goodall ML, et al. Autophagy supports breast cancer stem cell maintenance by regulating IL6 secretion. Mol Cancer Res. 2015 Apr;13(4):651–658. 10.1158/1541-7786.MCR-14-0487. PubMed PMID: 25573951; eng.
- Liang XH, Jackson S, Seaman M, et al. Induction of autophagy and inhibition of tumorigenesis by beclin 1. Nature. 1999 Dec;402(6762):672–676. PubMed PMID: 10604474; eng.
- Qu X, Yu J, Bhagat G, et al. Promotion of tumorigenesis by heterozygous disruption of the beclin 1 autophagy gene. J Clin Invest. 2003 Dec;112(12):1809–1820. PubMed PMID: 14638851; PubMed Central PMCID: PMCPMC297002. eng.
- Laddha SV, Ganesan S, Chan CS, et al. Mutational landscape of the essential autophagy gene BECN1 in human cancers. Mol Cancer Res. 2014 Apr;12(4):485–490. 10.1158/1541-7786.MCR-13-0614. PubMed PMID: 24478461; PubMed Central PMCID: PMCPMC3989371. eng.
- Chen S, Wang C, Yeo S, et al. Distinct roles of autophagy-dependent and -independent functions of FIP200 revealed by generation and analysis of a mutant knock-in mouse model. Genes Dev. 2016 Apr;30(7):856–869. PubMed PMID: 27013233; PubMed Central PMCID: PMCPMC4826400. eng.
- Wei H, Gan B, Wu X, et al. Inactivation of FIP200 leads to inflammatory skin disorder, but not tumorigenesis, in conditional knock-out mouse models. J Biol Chem. 2009 Feb;284(9):6004–6013. PubMed PMID: 19106106; PubMed Central PMCID: PMCPMC2645843. eng.
- Bonnard C, Durand A, Peyrol S, et al. Mitochondrial dysfunction results from oxidative stress in the skeletal muscle of diet-induced insulin-resistant mice. J Clin Invest. 2008 Feb;118(2):789–800. PubMed PMID: 18188455; PubMed Central PMCID: PMCPMC2176186. eng.
- Wu M, Neilson A, Swift AL, et al. Multiparameter metabolic analysis reveals a close link between attenuated mitochondrial bioenergetic function and enhanced glycolysis dependency in human tumor cells. Am J Physiol Cell Physiol. 2007 Jan;292(1):C125–36. PubMed PMID: 16971499; eng.