
ABSTRACT
Mutations in the genes necessary for the structure and function of vertebrate photoreceptor cells are associated with multiple forms of inherited retinal degeneration. Mutations in the gene encoding RHO (rhodopsin) are a common cause of autosomal dominant retinitis pigmentosa (adRP), with the Pro23His variant of RHO resulting in a misfolded protein that activates endoplasmic reticulum stress and the unfolded protein response. Stimulating macroautophagy/autophagy has been proposed as a strategy for clearing misfolded RHO and reducing photoreceptor death. We found that retinas from mice heterozygous for the gene encoding the RHOP23H variant (hereafter called P23H) exhibited elevated levels of autophagy flux, and that pharmacological stimulation of autophagy accelerated retinal degeneration. In contrast, reducing autophagy flux pharmacologically or by rod-specific deletion of the autophagy-activating gene Atg5, improved photoreceptor structure and function. Furthermore, proteasome levels and activity were reduced in the P23H retina, and increased when Atg5 was deleted. Our findings suggest that autophagy contributes to photoreceptor cell death in P23H mice, and that decreasing autophagy shifts the degradation of misfolded RHO protein to the proteasome and is protective. These observations suggest that modulating the flux of misfolded proteins from autophagy to the proteasome may represent an important therapeutic strategy for reducing proteotoxicity in adRP and other diseases caused by protein folding defects.
Introduction
Autosomal dominant retinitis pigmentosa (adRP) is a major category of inherited retinal degeneration [Citation1], a heterogeneous group of blinding diseases culminating in photoreceptor (PR) cell death. Mutations in the RHO (rhodopsin) gene are a frequent cause of adRP, with a number of these mutations resulting in protein misfolding [Citation2–Citation4]. One of the most common causes of adRP in the United States is due to a missense mutation in the RHO gene, the light-sensing protein in rod cells, which results in the substitution of histidine for proline at amino acid residue 23 (RHOP23H) [Citation1,Citation5]. In both the human disease and the P23H transgenic mouse model, the misfolding of RHO results in intracellular accumulation of mutant protein, increased endoplasmic reticulum (ER) stress, and destabilization of rod PR disk membranes [Citation6–Citation10]. Accordingly, the RHOP23H form of adRP is classified as a proteopathy, a clinically important category of diseases resulting from folding defects affecting a wide range of proteins, and which constitute a major health burden [Citation11].
A major gap in our knowledge is an understanding of the mechanism by which folding mutations in RHO lead to PR death. Misfolded proteins are typically degraded by 1 of 2 mechanisms. The first involves translocation of the misfolded protein out of the ER and shuttling to the proteasome [Citation12]. The second involves the induction of autophagy, a catabolic process in which cellular elements are encapsulated within double-membrane vesicles called autophagosomes that fuse with lysosomes for degradation of the engulfed material [Citation12]. Both the proteasome and autophagy pathways are activated by accumulation of misfolded RHO, yet the intrinsic response is insufficient to prevent cell death and retinal degeneration [Citation6–Citation8,Citation13,Citation14].
In a number of disease model systems, autophagy is activated by ER stress and contributes to the clearance of cellular debris [Citation15,Citation16]. For adRP due to RHOP23H, it has been suggested that further increasing autophagy may be an important strategy for improving PR survival by reducing cellular stress caused by protein misfolding [Citation8,Citation14]. Autophagy plays a critical role in maintaining PR homeostasis [Citation17,Citation18]. The purpose of our studies was to define the role of autophagy in adRP caused by RHO misfolding. We found that although autophagy functions in the clearance of mutant RHO, activation of this fundamentally catabolic pathway contributes to PR cell death. Furthermore, the increased PR survival observed when autophagy activity was reduced correlated with increased proteasome activity, consistent with shunting of misfolded protein degradation to this more selective pathway. These findings run counter to suggestions that increasing autophagy will reduce misfolded protein accumulation and PR death [Citation8,Citation14], and identify a critical need to reevaluate therapeutic strategies targeting autophagy in retinal degeneration.
Results
Autophagy flux is increased early in the P23H mouse retina
We have previously shown that mice reared in a typical light-dark cycle environment have a bimodal pattern of autophagy activation in PR cells, with one peak occurring approximately at mid-day and one at mid-night [Citation17]. This pattern of activation results, at least in part, from the light-/dark-driven translocation of the phototransduction proteins, transducin and ARR/arrestin, from the outer segment (OS) of the photoreceptor into the inner segment (IS) [Citation17]. Defects in PR autophagy result in accumulation of these proteins in the IS, which leads to PR degeneration [Citation18]. In contrast, the elimination of autophagy from the PR cell does not result in accumulation of RHO itself [Citation18], presumably because RHO is efficiently transported to the OSs, and thus does not accumulate in the IS, as do transducin and ARR/arrestin.
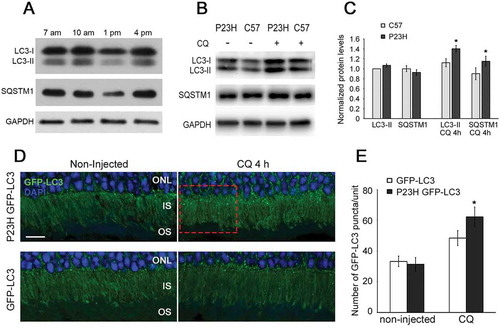
The Pro23His variant of RHO is not appropriately trafficked to the OS, resulting in the formation of IS aggregates and ER stress [Citation6–Citation10]. We sought to measure whether this alteration in trafficking changed the normal pattern or extent of autophagy activation in the PR cells. Our experiments focused on analysis of mice heterozygous for the Pro23His mutation (hereafter referred to as P23H mice), as they model the genetic status of the majority of individuals with this mutation. To quantify the level of autophagy activation in P23H mice as a function of age, we evaluated the conversion of MAP1LC3/LC3-I (microtubule-associated protein 1 light chain 3) to LC3-II, a standard measure of autophagy activation. Our previous studies showed that in the wild-type retina, the peak LC3-II:LC3-I ratio occurs mid-day at approximately 1pm [Citation17]. However, when we performed a time course evaluation of autophagy activation in retinas from 1-month-old P23H mice, we did not observe this expected peak, but rather a marked decrease in the level of both LC3-I and LC3-II relative to that present at other times of day ()). We hypothesized that this was due to increased autophagy flux at this time point. To test this, autophagy flux was acutely inhibited by treatment of 1-month-old P23H mice with an intraperitoneal injection of chloroquine (CQ), which inhibits lysosomal processing of the autophagosome and can allow for autophagosomal accumulation. As predicted by our hypothesis, we observed an increase in the total LC3 level, consistent with a higher autophagy flux at the 1 pm time point (). In addition, the ratio of LC3-II to LC3-I in P23H mice was greater than in wild-type (C57BL/6J) mice (). Together, these findings are consistent with increased autophagy activation in the retinas of the mutant mice.
Figure 1. Autophagy flux is elevated in the P23H mouse retina. (a) Retinal samples from P23H mice collected at various time points during the day, and probed with antibodies against LC3, SQSTM1, and loading control GAPDH (n = 6). (b) Western blot and (c) quantification of samples from 1-month-old P23H mice pretreated with chloroquine (CQ) or vehicle-only for 4 h, and age-matched C57BL/6J controls (C57), probed with antibodies against LC3, SQSTM1, and loading control GAPDH (n = 4). Samples collected at 1pm time point. (d) Representative fluorescence images of retinas from 1-month-old P23H GFP-LC3 and control GFP-LC3 mice not injected or injected with CQ showing a punctate pattern of GFP-LC3. The LC3 localizes primarily to the photoreceptor inner segment (IS). Photoreceptor nuclei in the outer nuclear layer (ONL) were stained with DAPI (blue). Scale bar: 10 µm. (e) Quantification of the number of GFP-LC3 puncta per counting unit indicated in (d) as a red dashed rectangle, as a measure of autophagy flux. Data are presented as mean ± SD. *, p < 0.05. N = 5.
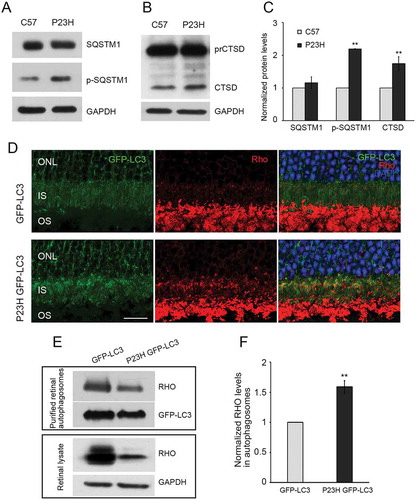
As a second approach to evaluating autophagy activation, we crossed the P23H mouse with the GFP-LC3 mouse, in which LC3 is tagged with green fluorescent protein [Citation19], and performed histological analysis of LC3 puncta formation. Expression of GFP-LC3 in and of itself does not affect the pattern of autophagy activation in the retina, nor does it affect P23H-induced retinal degeneration (Figure S1). As seen in , we observed significantly more LC3-positive puncta in the PR cells of P23H GFP-LC3 mice, as compared to control GFP-LC3 mice, in animals treated with chloroquine. We also observed increased levels of mature CTSD (cathepsin D) and phosphorylated SQSTM1 (sequestosome 1) (), consistent with increased lysosomal activity and tagging of material for uptake by the phagophore (the precursor to the autophagosome), respectively [Citation20,Citation21]. Immunostaining of retinal sections showed significantly more accumulated RHO in the PR inner segments of P23H GFP-LC3 mice, as compared to those of GFP-LC3 mice, and the accumulated RHO colocalized with the autophagosome marker, LC3 ()). To further verify the presence of RHO in the autophagosome, we isolated the autophagosomes, as previously described [Citation22], and analyzed their contents by western blot analysis. We found that the amount of RHO present in the autophagosomes normalized to the amount of RHO present in the retinal lysate was significantly increased in the P23H GFP-LC3 mice as compared with GFP-LC3 mice (). Normalization of RHO levels in the autophagosome is relative to total amount of RHO in retinal lysate, as this represents the proportion of RHO being degraded. The RHO signal in the lysate appears saturated, but this amount of protein loading was required to obtain a meaningful signal from the P23H GFP-LC3 sample. Taken together, these data support the conclusion that there is increased autophagy flux in the PR cells of P23H mice, particularly at 1 month of age, which serves to increase the targeting of misfolded RHO to the phagophore.
Figure 2. Autophagy in photoreceptors of P23H mice results in increased degradation of RHO through the autophagosome-lysosome pathway. Representative western blots probed for SQSTM1, p-SQSTM1 (a), precursor CTSD (prCTSD) and mature CTSD (b) in retinas of 1-month-old P23H and control C57BL/6J (C57) mice. (c) Quantification of intensities of immunoblot bands from A and B normalized to loading control GAPDH (n = 6), with C57 values set to 1. (d) Retinal cryosections from 1-month-old GFP-LC3 and P23H GFP-LC3 mice probed for RHO (red), with DAPI staining of nuclei (blue). IS, inner segment; ONL, outer nuclear layer; OS, outer segment. Scale bar: 20 µm. (e) Immunoblot and (f) quantification of RHO levels in autophagosomes isolated from retinas of GFP-LC3 and P23H GFP-LC3 mice (E, upper panel) versus from total retinal lysate (E, lower panel). Normalization of RHO levels in the autophagosome is relative to total amount of RHO in retinal lysate, as this represents the proportion of RHO being taken up by the autophagosome (n = 4). Data are presented as mean ± SD. **, p < 0.01, unpaired t-test.
Increasing autophagy promotes retinal degeneration in the P23H mouse
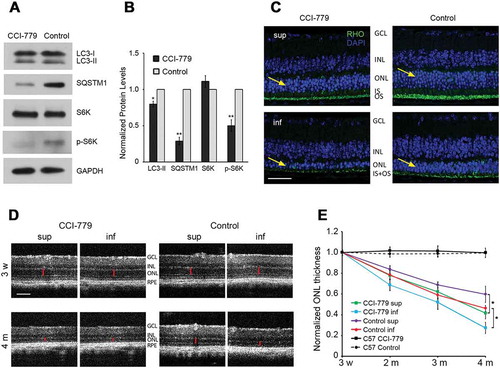
As the RHOP23H variant results in RHO misfolding, ER retention of the mutant protein and increased ER stress [Citation6–Citation10], we sought to directly test the prediction that increasing autophagy would improve RHO clearance and reduce retinal degeneration. To increase autophagy, we treated P23H mice with CCI-779, an analog of rapamycin that activates autophagy by inhibiting MTOR (mechanistic target of rapamycin kinase) [Citation23]. As expected from the increase in autophagy flux, the levels of LC3-II and SQSTM1 appeared decreased in the retinas of CCI-779-treated mice (). The rate of retinal degeneration in CCI-779 treated versus vehicle-only treated P23H mice was then assessed by measuring the thickness of the outer nuclear layer (ONL), the layer of the retina in which the PR nuclei reside. In the P23H mice, there is a linear rate of PR degeneration, with those in the inferior retina degenerating more rapidly than those in the superior retina [Citation8]. As expected, eyes from vehicle-only treated P23H mice exhibited this same pattern of PR degeneration (). However, contrary to our expectations, CCI-779 treatment of P23H mice resulted in more rapid retinal degeneration (). The thickness of the ONL was decreased by approximately 30–50% in CCI-779-treated P23H mice by 4 months of age, as compared to untreated, age-matched controls. Optical coherence tomography (OCT), a noninvasive technique for measuring ONL thickness in vivo, demonstrated that CCI-779-increased degeneration occurred in both the superior and inferior retina. Of note, treatment with CCI-779 had no effect on the thickness of wild-type, C57, retinas ()).
Figure 3. Increasing autophagy accelerated retinal degeneration in P23H mice. (a) MTOR inhibition and increased autophagic activity by CCI-779 was shown by representative western blots probed for LC3, SQSTM1, RPS6KB (S6K), p-RPS6KB (p-S6K), and loading control GAPDH in retinas of P23H mice after 3 months of CCI-779 treatment and control group treated with vehicle only. (b) Quantification of the bands in panel A normalized to loading control GAPDH (n = 5), with control P23H values set to 1. (c) Images of superior (sup) and inferior (inf) retina of 4-month-old CCI-779-treated P23H and control mice probed for RHO (green), with DAPI staining (blue). Yellow arrows point to the ONL, where the photoreceptor nuclei reside. Scale bar: 50µm. (d) Representative optical coherence tomography (OCT) images of superior and inferior retina of CCI-779-treated and control P23H mice at the indicated ages. OCT was used to measure the ONL thickness (red bar) of the retina in vivo. All measurements were at 500 µm from the optic nerve head. Scale bar: 100µm. GCL, ganglion cell layer; INL, inner nuclear layer; ONL, outer nuclear layer; IS, inner segment; OS, outer segment; RPE, retinal pigment epithelium. (e) Line graph showing the ONL thickness (represented by red bar in panel D) of superior and inferior retina measured by OCT for the CCI-779-treated and control group (n = 12–15). Data are presented as mean ± SD, *, p < 0.05, **, p < 0.01, unpaired t-test.
Decreasing autophagy reduces retinal degeneration in the P23H mouse
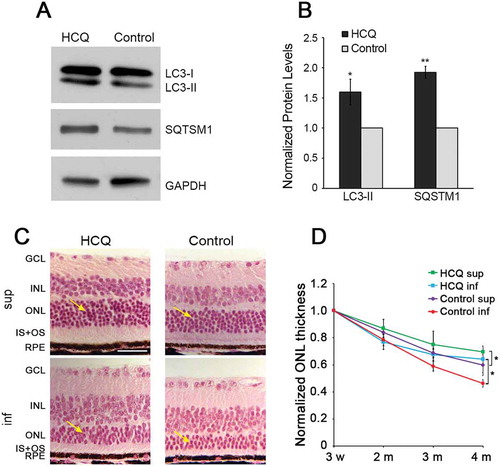
Given the increase in PR cell death observed when autophagy was increased, we next sought to test the effect of decreasing autophagy activity on PR cell survival. To decrease autophagy activity in the retinas of P23H mice, we used both pharmacological and genetic approaches. While there are few pharmacological inhibitors of autophagy available for use in vivo, one common approach is to decrease autophagy flux by treatment with hydroxychloroquine (HCQ) [Citation24]. When administered via the drinking water, HCQ was effective in reducing flux as evidenced by accumulation of LC3-II and SQTSM1 (). Treatment with HCQ resulted in significant preservation of ONL thickness in both the superior and inferior retina (). In the inferior half, where degeneration was most rapid in untreated P23H mice, we observed a significant increase in the ONL thickness of HCQ-treated mice (p < 0.05) of approximately 40% at 4 months of age (). In the superior retina, where the degeneration was less severe in untreated P23H mice, the increase in ONL thickness resulting from HCQ treatment was less pronounced, but still significant. At the dose tested in this work, HCQ did not alter thickness of the C57 retina (data not shown).
Figure 4. Decreasing autophagy by hydroxychloroquine (HCQ) treatment increased photoreceptor survival in P23H mice. (a) Representative western blots, with quantification of bands (b), probed with LC3 and SQSTM1, normalized to loading control GAPDH in retinas of P23H mice after 3 months of HCQ treatment via drinking water, with untreated P23H controls set as 1. (c) Hematoxylin and eosin (H&E) stained images of superior (sup) and inferior (inf) retina from 4-month-old HCQ-treated P23H and control mice. Retinal cell layers labeled as in . Yellow arrows point to the ONL, where the photoreceptor nuclei reside. Scale bar: 50 µm. (d) Line graph showing the ONL thickness of superior and inferior area of the retinas, as measured by OCT at 500 µm from the optic nerve head, in the HCQ-treated P23H and control group (n = 4–16). Data presented as mean ± SD, *, p < 0.05, **, p < 0.01, unpaired t-test.
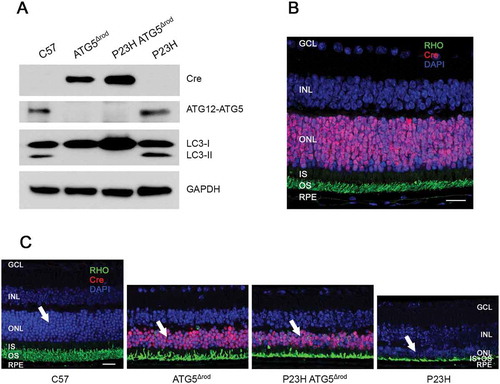
To further assess the effect of reducing autophagy activation in the P23H mouse retina, we crossed the P23H mouse with the ATG5Δrod mouse, which has a rod cell-specific deletion of the Atg5 gene [Citation18]. Western blot analysis of retinal lysates shows that this new strain (designatedP23H ATG5Δrod) did not produce ATG5, nor did it convert LC3-I to LC3-II ()). Immunohistochemistry confirmed the rod-specific expression of the Cre-recombinase ()). Retinal sections from 6-month-old C57, ATG5Δrod, P23H ATG5Δrod, and P23H mice show that while the ATG5Δrod retina exhibited some degeneration compared to C57, the absence of ATG5 in the rod cells of the P23H retina resulted in significant preservation of the ONL as compared to the P23H retina in which ATG5 expression was retained ()).
Figure 5. Genetic deletion of autophagic gene Atg5 specifically in rod photoreceptors of P23H mice to generate P23H ATG5Δrod mice. (a) Representative western blots probed for LC3, ATG12–ATG5 conjugate, SQSTM1, and loading control GAPDH from retinas of C57, ATG5Δrod, P23H ATG5Δrod, and P23H mice at 2 months of age (n = 4). (b) Retinal section from a 2-month-old P23H ATG5Δrod mouse probed for RHO (green) and Cre (red), with DAPI staining (blue). (c) Retinal sections from 6-month-old C57, ATG5Δrod, P23H ATG5Δrod, and P23H mice probed for RHO (green) and Cre (red), with DAPI staining (blue). White arrows point to the ONL, where the photoreceptor nuclei reside. Scale bar: 20 µm. Retinal cell layers labeled as in .
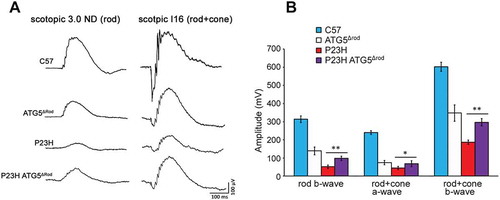
Compared to the retinas of ATG5Δrod littermate controls, the ONL of P23H ATG5Δrod mice underwent significantly less degeneration ()). OCT heat map analysis showed marked preservation of retinal thickness in the P23H ATG5Δrod mice ()). At 2 weeks of age, the earliest time point measured, the ONL was relatively equal in thickness between the 2 cohorts of mice (). By 6 months of age, however, the ONL in P23H ATG5Δrod mice was significantly thicker (p < 0.05), by approximately 4-fold in the inferior retina and 3-fold in the superior retina. Interestingly, the rate of degeneration was greatest between 2 weeks and 1 month of age ()). Electroretinography (ERG) showed a significant increase in retinal function in P23H ATG5Δrod mice, as compared to littermate P23H controls; however, responses were significantly reduced compared to those observed in age-matched C57BL/6J controls (). In total, these findings demonstrate that reducing autophagy activity in the P23H mouse retina results in decreased PR death and improved retinal function.
Figure 6. Genetic ablation of Atg5 in rod photoreceptors of P23H mice decreased photoreceptor degeneration. (a) Representative H&E staining images of retinal paraffin sections from 6-month-old P23H ATG5Δrod and control P23H and C57 mice. High magnification images represent superior (sup) and inferior (inf) area of the retinas indicated by red rectangles in low magnification images. Yellow arrows point to the ONL, where the photoreceptor nuclei reside. Scale bar: 500 µm in the low magnification image and 50 µm in the high magnification image. (b) Heat maps of retinal thickness generated from optical coherence tomography (OCT) scans, in false colors with matching grids (diameter = 1.5 mm) centered on the optic nerve (ON). Mice were 4 months of age. sup: superior; inf: inferior. (c) Representative OCT images crossing the optic nerve from P23H ATG5Δrod and control P23H and C57 mice at the indicated ages. Red bars indicate the ONL that was measured for each mouse. Scale bar: 200 µm. (d) Line graph showing the ONL thickness (represented by red bars in panel C) of both superior and inferior retinal regions from P23H ATG5Δrod and control P23H mice measured by OCT at the indicated ages (n = 10–12). Data for C57 mice are provided for reference. Data are presented as mean ± SD, **, p < 0.01, unpaired t-test. Retinal cell layers labeled as in .
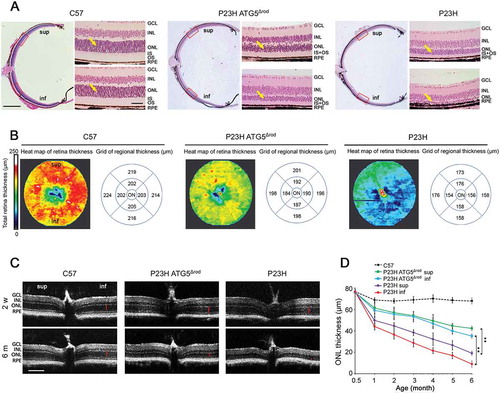
Figure 7. Genetic ablation of Atg5 in rod photoreceptors improved photoreceptor function in P23H mice. (a) Representative electroretinogram (ERG) traces, with scotopic 3.0 ND indicating rod function, and scotopic I16 indicating mixed rod and cone functions, for P23H ATG5Δrod, control P23H, ATG5Δrod, and C57BL/6J mice at 6 months of age. (b) Quantification of peak amplitudes of rod b-wave, rod + cone a-wave, and rod + cone b-wave at 6 months of age (n = 5). Data are presented as mean ± SD; *, p < 0.05; **, p < 0.01; unpaired t-test.
RHO misfolding results in increased expression of BECN1
The increased protein accumulation observed in the PR cells of P23H mice is accompanied by activation of ER stress and the unfolded protein response (UPR) [Citation6–Citation10]. It was previously reported that the activation of the UPR did not result in activation of apoptotic cell death pathways in the P23H mouse retina [Citation25,Citation26]. We analyzed the transcript levels for several of the classic UPR pathway regulators, and found that only XBP1s (X-box binding protein 1 spliced) transcripts were increased in the P23H mouse retina relative to age-matched C57BL/6J controls ()). In contrast, transcript levels for HSPA5/GRP78 (heat shock proein 5), DDIT3/CHOP (DNA-damage inducible transcript 3), and ATF4 (activating transcription factor 4) were similar between the 2 strains. One known downstream target of the transcription factor XBP1s is the gene encoding for the autophagy activator, BECN1 (beclin 1) [Citation27]. We detected a significant increase in the level of BECN1 in the P23H mouse retina relative to C57BL/6J controls (), consistent with selective activation of autophagy by the UPR.
Figure 8. Autophagy activation in P23H retina in response to Xbp1 mRNA splicing and increased BECN1 production. (a) Transcript levels of unfolded protein response (UPR) regulators in retinas of P23H and control C57BL/6J (C57) mice analyzed by RT-PCR (n = 6). (b and c) Representative western blots and quantification of protein levels of BECN1 (a downstream target of XBP1s) and loading control GAPDH. (n = 4). Data are presented as mean ± SD; *, p < 0.05; **, p < 0.01; unpaired t-test. All mice are 1 month old.
Reduced proteasome activity in the P23H mouse retina is rescued by ablation of autophagy
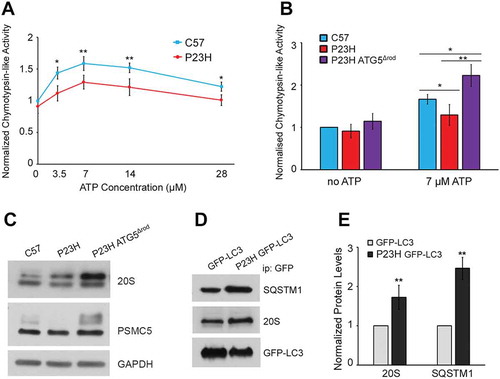
Although a significant reduction in the rate of PR cell death was observed in P23H ATG5Δrod mice compared to P23H mice, this appeared to be a paradoxical finding, as loss of autophagy might be expected to result in worsening accumulation of mutant RHO. One possibility to explain our findings is that mice with the Atg5Δrod allele now have increased shunting of misfolded RHO to the proteasome degradation pathway. To assess this, we compared the proteasome activity of P23H, P23H ATG5Δrod, and C57BL/6J mouse retinas (). Proteasome activity in the P23H mouse retina was decreased compared to age-matched C57BL/6J controls ()). This finding is consistent with a previous report suggesting that PR degeneration in P23H mice results from proteasome insufficiency [Citation28]. However, the absence of autophagy in P23H ATG5Δrod mice resulted in increased proteasome activity relative to that in P23H mice (p < 0.05) ()). Consistent with this, we found increased levels of the proteasome 20S core subunit and the 19S regulatory subunit in the retinas of P23H ATG5Δrod mice, as compared to retinas of P23H mice ()), suggesting that PR cells have sufficient proteasome capacity to degrade misfolded RHO. However, autophagy activation in P23H rod cells has the potential to cause increased degradation of the proteasome, in a process termed proteophagy [Citation29], which would give the impression of insufficient proteasome capacity. To evaluate this possibility, we isolated autophagosomes using a method we developed previously [Citation22], and found significantly more 20 and 19S proteasome subunit in autophagosomes prepared from P23H mouse retinas than from age-matched C57BL/6J mouse retinas, suggesting increased proteasome degradation by the autophagy process itself ().
Figure 9. Proteasome degradation and decreased activity in the P23H mouse retina rescued by ablation of Atg5. (a) Cytosolic proteins from retinas of P23H and C57BL/6J mice assayed for proteasome peptidase activity over a range of ATP concentrations. Chymotrypsin-like activity was measured as the difference in fluorescence in the presence and absence of the specific inhibitor lactacystin (18 μM). N = 12, 2-way ANOVA. (b) Chymotrypsin-like activities of cytosolic retinal proteins without ATP or with ATP (7 µM) from P23H ATG5Δrod, P23H, and control C57BL/6J (C57) mice. (n = 8), unpaired t-test. (a–b) Data were normalized to chymotrypsin-like activity of the C57BL/6J sample without ATP. (c) Western blots probed for proteasome subunits 20S and PSMC5, and loading control GAPDH, in retinas of P23H ATG5Δrod, P23H, and control C57BL/6J mice. (d) Representative western blots and (e) quantification of autophagosome contents from retinas of P23H GFP-LC3 and control GFP-LC3 mice. Blots were probed for SQSTM1, 20S, and loading control GFP-LC3. (n = 4), unpaired t-test. Data are presented as mean ± SD; *, p < 0.05; **, p < 0.01. All mice were 1 month old.
Discussion
The accumulation or aggregation of proteins within cells has been demonstrated in numerous diseases, including Alzheimer, Parkinson, and Huntington diseases, to result in proteotoxicity and cell death [Citation30,Citation31]. This aggregation phenotype has resulted in an interest in autophagy regulation as a potential path to the development of strategies for therapeutic intervention in these diseases [Citation32]. Within PR cells of the retina, autophagy is critical for maintaining homeostasis under both normal and stress conditions. We have previously shown that autophagy plays a central role in degrading ARR/arrestin and transducin, visual transduction proteins that undergo light-induced translocation between PR cell inner and outer segments, and which can lead to retinal degeneration if allowed to accumulate [Citation17,Citation21,Citation24]. Our studies also have shown that autophagy is critical in regulating PR survival after retinal detachment, which if left unchecked, results in FAS/fragment apoptosis stimulator-mediated cell death [Citation33]. Mutations in the RHO gene are a frequent cause of adRP, with a significant number of these mutations resulting in protein misfolding and accumulation [Citation1,Citation5]. Previous studies have shown that both ER stress and the UPR are activated by RHOP23H, but have not shown evidence of increased activation of apoptotic cell death [Citation25,Citation26]. Thus, the mechanism by which this mutation leads to cell death is not fully understood. Our work now shows, for the first time, that the misfolding of RHO results in a state of increased autophagy that contributes to PR cell death.
Recent consensus papers from the Nomenclature Committee on Cell Death (NCCD) suggest that the term ‘autophagic cell death’ be reserved for cases in which cell death results, at least in part, from the activation of autophagy, and can be prevented or significantly reduced by the inhibition of autophagy [Citation34,Citation35]. We find that rod PR cells with RHOP23H exhibit increased autophagy flux and autophagosome number. Furthermore, interventions resulting in autophagy gain of function or loss of function result in increased or decreased PR cell death, respectively. Together, our data are consistent with the definition set forth by the NCCD, and thus identify autophagic cell death as a contributing factor in retinal degeneration caused by RHOP23H.
RHO misfolding has been previously shown to activate ER stress responses, including the UPR [Citation6–Citation10]. Consistent with previous studies, we find increased expression of XBP1s in the P23H mouse retina, and find that it correlates with increased expression of BECN1, suggesting that this may be one pathway by which misfolded RHO increases autophagy activation. This interpretation is consistent with previous reports of protection of P23H mouse PR cells by inhibitors of ER stress activation [Citation26]. It has also been reported that RHOP23H is associated with the activation of calpains and CASP12 (caspase 12), suggesting a role for intrinsic (mitochondrial) apoptosis in the associated retinal degeneration [Citation9,Citation26]. In addition, activation of both RIPK1 (receptor [TNFRSF]-interacting serine-threonine kinase 1) and RIPK3 (receptor-interacting serine-threonine kinase 3) has been demonstrated in a rat P23H model, in which inhibition with necrostatin-1 leads to improved PR cell survival [Citation25], suggesting that necroptosis is also a contributing factor in PR cell death caused by misfolded RHO. Autophagic cell death has been implicated in the degeneration of various retinal cell types in response to various stimuli [Citation36–Citation39]. The relationship between increased autophagy flux and activation of multiple cell death pathways is an area requiring further study that will be critical for developing a full understanding of disease pathogenesis caused by protein misfolding.
The contribution of the proteasome to PR cell homeostasis in the retina is also likely to be subject to complex regulation. The proteasome contributes to degradation of misfolded RHOP23H [Citation6,Citation40]; however, ubiquitinated protein aggregates impair the proper function of the proteasome complex [Citation6]. It has also been suggested that there is overload of the proteasome in the RHOP23H retina, resulting in a relative proteasome insufficiency that cannot adequately clear the misfolded RHO [Citation28]. Consistent with these reports, we find that the P23H mouse retina has relatively low proteasome activity compared to the wild-type. However, when autophagy function is disrupted in rod PR cells, we find that the proteasome activity increases to well above the wild-type level. Furthermore, in P23H retinas, we find that components of the proteasome are isolated with autophagosomes. This copurification likely explains the lower proteasome activity we observe in this model, and the relative proteasome insufficiency reported [Citation28], as the proteasome is presumably being degraded by the autophagic process itself. It follows that blocking autophagy results in increased proteasome activity and degradation of the misfolded RHO.
Our findings suggest that shifting protein degradation away from autophagy and towards the proteasome has the potential to reduce retinal degeneration in patients with adRP secondary to misfolded RHO. Previous attempts have been made to screen for chaperone compounds capable of reducing RHO misfolding [Citation14]. The bases of these screens have been to assess the ability of agents to improve the RHO conformation or to reduce its accumulation. Our data suggest, but do not prove, that increasing proteasome degradation of the misfolded RHO would be protective. Thus this approach would need to be tested. Future screens would likely benefit from evaluating the ability of promising compounds to shift protein degradation away from autophagy, as it is the over-activation of this relatively nonspecific and high capacity catabolic process that appears to be most contributory to PR cell death resulting from defects in protein folding.
Materials and methods
Animals
The RHOP23H/P23H mice [Citation8] were purchased from Jackson Laboratory (017628). The RHOP23H/P23H mice were crossed with wild-type C57BL/6J (Rho+/+) mice (Jackson Laboratory, 380,050) to produce P23H heterozygotes, and with GFP-LC3 mice [Citation19] (Riken Laboratories, RBRC01413) to produce P23H GFP-LC3 mice for autophagosome isolation.
The ATG5Δrod mouse contains a rod-specific deletion of the Atg5 gene, and was originally generated by crossing the Atg5flox/flox mouse with a (Rho)-Cre mouse [Citation18]. This strain was bred with RHOP23H/P23H to generate P23H ATG5Δrod (P23H; Atg5flox/flox; [Rho]-Cre) mice. Genotyping for all strains was conducted by Transnetyx, Inc. (Cordova, TN, USA). All mice used in this study were negative for mutation in the Crb1rd8 gene [Citation41]. The mouse strains are summarized in . Mice were bred and housed under standard 12-h light/12-h dark conditions in the University of Michigan, Kellogg Eye Center animal facility. All animal experiments were approved by the University of Michigan Animal Care Committee and conformed to the Association for Research in Vision and Ophthalmology guidelines.
Table 1. Description of the mouse strains used in this study.
CCI-779 and HCQ treatment in P23H mice
There were no significant differences in the mice and their sex ratios between the treatment and control groups. Mice were given treatment from the ages of 3 weeks to 4 months. For CCI-779 (LC Laboratories, T-8040) treatment, mice were injected intraperitoneally 3 times a week with 2 mg/ml of CCI-779 at a dosage of 20 mg per kg body weight, or with vehicle alone (equivalent solution without CCI-779). Stock solution of CCI-779 was prepared in ethanol at 50 mg/ml and diluted to working solution in 0.15 M NaCl, 5% Tween 20 (Sigma, P7949) and 5% PEG 400 (Tokyo Chemical Industry Co, Ltd., N0443) before injection. For hydroxychloroquine (HCQ; Tokyo Chemical Industry Co., LTD, H1306) treatment [Citation42,Citation43], HCQ was administered in the drinking water at a concentration of 1.2 mg/mL. Mice were monitored daily.
Tissue collection
Retinal tissue was obtained from mice by dissection at various ages, as previously described [Citation17]. Due to the bimodal variation in basal levels of autophagy in mouse photoreceptor (PR) cells, all tissue collections were performed at the same time of the day, 1:00 pm, unless the time course was specifically indicated. For experiments measuring autophagy flux, some mice were given an intraperitoneal injection of 50 mg/kg body weight chloroquine (CQ; Sigma-Aldrich, C6628) 5 h before tissue collection. Briefly, the harvesting technique was as follows: mice were euthanized and eyes were immediately enucleated. The connective tissue, muscle, and optic nerve were removed under a dissecting microscope. The cornea and lens were then removed to form an eye cup, and the retina was dissected free of the retinal pigment epithelium.
Western blot analysis
Retina samples were homogenized in RIPA buffer (Thermo Scientific, 89,900), and proteins were separated by 4–15% SDS-PAGE (Mini-PROTEAN TGX Precast Protein Gels; Bio-Rad Laboratories, 4,561,086) and transferred to polyvinylidene fluoride membranes (Bio-Rad Laboratories, 162–0177). After blocking with 5% milk in Tris-buffered saline (Bio-Rad, 170–6435) containing 0.1% Tween 20 for 1 h, the membranes were incubated with primary antibodies at 4ºC, overnight. A full list of antibodies is shown in . After washing, membranes were incubated with secondary antibodies (Dako, P0488 [goat anti-rabbit HRP] or P0447 [goat anti-mouse HRP]) for 1 h at room temperature. Blots were developed using SuperSignal West Dura Substrate (Thermo Scientific, 34,075). Quantitative densitometry of the bands was performed using ImageJ software. All experiments were performed a minimum of 3 times.
Table 2. List of antibodies used in this study.
Real-time polymerase chain reaction (RT-PCR)
Mouse retina total RNA was isolated using the RNeasy Mini Kit (Qiagen, 74,104). Total RNA (500 ng) was converted into cDNA using the SuperScript III Reverse Transcriptase Kit (ThermoFisher Scientific, 18,080,093). The transcript levels of target genes were assessed using Bio-Rad CFX96 Real-Time PCR Detection System (Bio-Rad, 1,855,196). Cycling parameters were: 95°C for 5 min, 95°C for 10 sec, 60°C for 10 sec, 72°C for 10 sec, with 45 cycles of amplification. Specific primers were as follows: Hspa5/Grp78/BiP (Forward 5ʹ-TGCAGCAGGACATCAAGTTC-3ʹ, Reverse 5ʹ-CAGCTGCTGTAGGCTCATTG); Ddit3/Chop (Forward 5ʹ-CGGAACCTGAGGAGAGAGTG-3ʹ, Reverse: 5ʹ-CTGTCAGCCAAGCTAGGGAC-3ʹ); Atf4 (Forward 5ʹ-CCTTCGACCAGTCGGGTTTG-3ʹ, Reverse 5ʹ-CTGTCCCGGAAAAGGCATCC-3ʹ); Xbp1s (the spliced form of Xbp1; Forward 5ʹ-GAGTCCGCAGCAGG TG-3ʹ, Reverse 5ʹ-GTGTCAGAGTCCATGGGA-3ʹ); and Rpl19 (Forward 5ʹ-ATGCCAACTCCCGTCAGCAG-3ʹ, Reverse 5ʹ-TCATCCTTCTCATCCAGGTCACC-3ʹ). Target gene expression levels were normalized to the expression of Rpl19 [Citation10], a transcript with levels unaltered by ER stress, and fold change values were calculated by the comparative Ct method.
Histology and immunohistochemistry
The superior region of each eye was marked by a burn (GEMINI Cautery System, GEM5917) before enucleation for orientation. To obtain cryosections, enucleated eyes were fixed overnight in freshly prepared 4% paraformaldehyde solution, and subsequently processed as previously described [Citation17]. Briefly, the cornea and lens were removed, and the eyecup was rinsed 3 times in phosphate-buffered saline (PBS; Sigma Life Science, P4417), and transitioned through 5%, 10%, and 20% sucrose (Sigma, S9378) in PBS for 2 h each. Eye cups were then embedded in an orientation-specific manner in the embedding mixture containing Tissue-Tek embedding medium (Sakura Finetek, 4583) and 20% sucrose at a 1:1 ratio. A cryostat was used to obtain sections of 10-µm thickness.
To obtain paraffin sections, eyes were prepared using a fixation method involving freeze substitution as previously described [Citation22]. Briefly, each enucleated eye was snap frozen in dry ice-cooled liquid propane for 30 sec and then transferred to dry ice-cooled methanol containing 3% glacial acetic acid. Eyes were kept at −80°C for 48 h in this fixative, followed by overnight at −20°C. After warming to room temperature, eyes were transferred into 100% ethanol, and the cornea and lens were carefully removed. Eye cups were left for 1–2 h in 100% ethanol, then transitioned through 2 × 30 min in 100% ethanol, 2 × 30 min in citrate solvent (Fisher, 22–143-975), and 3 × 40 min in paraffin. Eyes were embedded in paraffin in an orientation-specific manner. Sections were cut using a microtome (Shandon AS325, Thermo Scientific) at 6 μm. Representative sagittal sections crossing the optic nerve from each eye were used for immunohistochemistry, and hematoxylin (Fisher Scientific, 3536–16) and eosin (Fisher Scientific, E511) staining.
For immunohistochemistry, retinal sections were incubated with primary antibodies overnight at 4ºC in a humidity chamber, followed by washing and incubation for 1 h at room temperature with secondary antibodies. Sections were counterstained with ProLong Gold with DAPI (Invitrogen, P36941). Images were obtained using a confocal microscope (Leica SP5, Leica Corp., Germany) and were taken at comparable areas on sections with a fixed detection gain.
Quantification of GFP-LC3 puncta in PR inner segments
Cryosections crossing the optic nerve were collected from each eye, and 3 representative sections (second, 10th, and 18th) were used to avoid double counting. Retinal images were obtained using confocal microscopy with a fixed magnification. The number of GFP-LC3 puncta in each section was counted in 5 non-overlapping areas of 30-µm length of retina. The counted areas comprised the inner segment region up to the first row of PR nuclei above the external limiting membrane. At least 5 animals were used for each experimental group.
Autophagosome isolation from mouse retinas
For preparation of retinal lysates, P23H GFP-LC3 and GFP-LC3 mice were given intraperitoneal injection of 50 mg/kg body weight chloroquine. Five h after treatment, retinas were collected, briefly homogenized using a pellet pestle motor (Kontes, 749,540–0000) for 3–5 pulses in cold separation buffer containing protease inhibitors: 250 mM sucrose (Sigma-Aldrich, S0389), 1 mM EDTA (Thermo Fisher Scientific, AM9262), 10 mM HEPES (Sigma-Aldrich, H3375), pH 7.4, complete protease inhibitor tablet (Roche, 11,697,498,001). The lysate was then passed through a needle attached to a 1-mL syringe; 4–5 times through a 25-gauge needle (BD, 305,125), and 3 times through a 30-gauge needle (BD, 305,106). GFP-based immunoisolation of autophagosomes was performed using µMACS Anti-GFP Microbeads (Miltenyi Biotec, 130–091-125), as described previously [Citation22]. Briefly, retinal lysate was centrifuged at 1,000 x g for 10 min at 4°C. The post-nuclear supernatant fraction was centrifuged at 17,000 x g for 20 min, and the supernatant fraction was discarded to remove residual cytosolic GFP-LC3-I. The pellet fraction was suspended in lysis buffer and then incubated with µMACS anti-GFP magnetic microbeads for 1 h on ice with mixing. The lysate-bead mixture was applied to a µ column (MACS Miltenyi Biotec, 130–042-701), which was placed in a magnetic µMACS Separator (MACS Miltenyi Biotec, 130–042-602). The column was washed, and then the immunoprecipitate was eluted by pH shift using trimethylamine (pH 11.8; Sigma-Aldrich, 243,205), followed by neutralizing with 1 M MES (Sigma-Aldrich, M5287). The protein content of the preparation was evaluated by western blot analysis.
Electroretinography
Electroretinography (ERG) was performed using the Espion e2 recording system (Diagnosys, Lowell, MA, USA), as described previously [Citation44]. Mice were anesthetized with an intra-peritoneal injection of ketamine (Hospira, 0409–2051-05) at 80 mg/kg and xylazine (NAND, 139–236) at 10 mg/kg. Body temperature was maintained at 37°C with a heating pad. After pupil dilation with topical 2.5% phenylephrine (Paragon BioTeck, Inc., 42702–102-15) and 1% tropicamide (Akorn, Inc., 17478–101-12), corneal ERGs were recorded from both eyes using gold wire loops mounted in a contact lens electrode (Mayo Corporation, Japan) and a drop of 2.5% hypromellose (AKORN, 17478–064-12) for corneal hydration. The dark-adapted ERG was recorded at −2.31 and 1.09 log cd.s/m2 (candle seconds per meter squared) to document rod function, and rod plus cone function, respectively.
Spectral domain optical coherence tomography
After anesthesia and pupil dilation, mice were given Systane Lubricant eye drops (Alcon, 9,004,494–0109) for corneal hydration. Optical coherence tomography (OCT) analysis was performed with a spectral domain optical coherence tomography system (Bioptigen Inc., Durham, NC). Volume analysis centered on the optic nerve head was performed, using 100-horizontal, raster, and consecutive B scan lines, each one composed of 1200 A-scans. The volume size was 1.2 x 1.2 mm. Outer nuclear layer (ONL) thickness was assessed at areas of superior and inferior retina at distances of 250 and 500 µm from the optic nerve head. Heat maps of the ONL were generated using InVivoVue TM Diver 2.4 software (Bioptigen Inc.).
Chymotrypsin-like proteasome activity assay
An optimized method was used for determining chymotrypsin-like activity in the retinas of P23H ATG5Δrod, control P23H, and control C57BL/6 mice at 1 month of age using proteasome substrate Suc-LLVY-AMC (Enzo Life sciences, BML-P802-0005) [Citation45]. Cytosolic protein from pooled retina (n = 6) samples was freshly homogenized as described above in assay buffer (50 mM HEPES, pH 7.5, 20 mM KCl, 5 mM MgCl2, 1 mM 1,4-dithiothreitol [Sigma-Aldrich, 10,708,984,001]). The retinal lysate was centrifuged at 10,000 x g for 10 min at 4°C. Cytosolic protein (60 µg) was assayed over a range of ATP (Dot Scientific, DSA30030-5) concentrations (0, 3.5, 7, 14, and 28 µmol/L), in the presence or absence of the inhibitor lactacystin (Enzo Life Sciences, BML-PI104-1000) in a black walled 96-well plate (Corning Incorporated, 3603) with a final volume of 250 μL/well. The plate was scanned once per min for 45 min at an excitation wavelength of 380 nm and emission wavelength of 440 nm in a FlexStation-II plate reader (Molecular Diagnostics). Data were reported as readings at 40 min, as cleavage of the substrate was linear over this time period. The triplicates of each condition were averaged and the differences between with and without inhibitor at each concentration of ATP were used for analysis. All assays were performed a minimum of 3 times.
Statistical analysis
Experimental results are expressed as mean ± standard deviation (SD). ONL thickness measured by OCT at different age points, and chymotrypsin-like activity of 26S proteasome over a range of ATP concentrations, were analyzed using 2-way ANOVA with replicates for multiple comparisons. Comparison of chymotrypsin-like activity between no-ATP and 7 µM ATP among groups was analyzed using unpaired t-tests. Differences were considered significant at P < 0.05.
Abbreviations
| adRP | = | autosomal dominant retinitis pigmentosa |
| ATG5Δrod | = | rod cell-specific deletion of the Atg5 gene |
| BECN1 | = | beclin 1 autophagy related |
| CQ | = | chloroquine |
| ERG | = | electroretinography |
| ER | = | endoplasmic reticulum |
| GFP | = | green fluorescent protein |
| HCQ | = | hydroxychloroquine |
| IS | = | inner segment; |
| MAP1LC3/LC3 | = | microtubule-associated protein 1 light chain 3 |
| OCT | = | optical coherence tomography |
| ONL | = | outer nuclear layer |
| OS | = | outer segment |
| PR | = | photoreceptor |
| RHO | = | rhodopsin |
| SQSTM1 | = | sequestosome 1 |
| UPR | = | unfolded protein response |
Commercial Interest
None.
Supplemental Material
Download Zip (755.4 KB)Disclosure statement
No potential conflict of interest was reported by the authors.
supplemental data
Supplemental data can be accessed here.
Additional information
Funding
Related Research Data
References
- RetNet – retinal information network. Accepted on 18 September 2017. Available from: https://sph.uth.edu/retnet/
- Liu X, Garriga P, Khorana HG. Structure and function in rhodopsin: correct folding and misfolding in two point mutants in the intradiscal domain of rhodopsin identified in retinitis pigmentosa. Proc Nat Acad Sci USA. 1996;93:4554–4559.
- Garriga P, Liu X, Khorana HG. Structure and function in rhodopsin: correct folding and misfolding in point mutants at and in proximity to the site of the retinitis pigmentosa mutation Leu-125–>arg in the transmembrane helix C. Proc Natl Acad Sci USA. 1996;93:4560–4564.
- Saliba RS, Munro PM, Luthert PJ, et al. The cellular fate of mutant rhodopsin: quality control, degradation and aggresome formation. J Cell Sci. 2002;115:2907–2918.
- Sohocki MM, Daiger SP, Browne SJ, et al. Prevalence of mutations causing retinitis pigmentosa and other inherited retinopathies. Hum Mutat. 2001;17:42–51.
- Illing ME, Rajan RS, Bence NF, et al. A rhodopsin mutant linked to autosomal dominant retinitis pigmentosa is prone to aggregate and interacts with the ubiquitin proteasome system. J Biol Chem. 2002;277:34150–34160.
- Tam BM, Moritz OL. Characterization of rhodopsin P23H-induced retinal degeneration in a Xenopus laevis model of retinitis pigmentosa. Invest Ophthalmol Vis Sci. 2006;47:3234–3241.
- Sakami S, Maeda T, Bereta G, et al. Probing mechanisms of photoreceptor degeneration in a new mouse model of the common form of autosomal dominant retinitis pigmentosa due to P23H opsin mutations. J Biol Chem. 2011;286:10551–10567.
- Sizova OS, Shinde VM, Lenox AR, et al. Modulation of cellular signaling pathways in P23H rhodopsin photoreceptors. Cell Signal. 2014;26:665–672.
- Chiang WC, Kroeger H, Sakami S, et al. Robust endoplasmic reticulum-associated degradation of rhodopsin precedes retinal degeneration. Mol Neurobiol. 2015;52:679–695.
- Ganguly G, Chakrabarti S, Chatterjee U, et al. Proteinopathy, oxidative stress and mitochondrial dysfunction: cross talk in Alzheimer’s disease and Parkinson’s disease. Drug Des Devel Ther. 2017 Mar;16(11):797–810.
- Pisoni GB, Molinari M. Five questions (with their answers) on ER-associated degradation. Traffic. 2016;17:341–350.
- Mohlin C, Taylor L, Ghosh F, et al. Autophagy and ER-stress contribute to photoreceptor degeneration in cultured adult porcine retina. Brain Research. 2014;1585:167–183.
- Mendes HF, Cheetham ME. Pharmacological manipulation of gain-of-function and dominant-negative mechanisms in rhodopsin retinitis pigmentosa. Hum Mol Genet. 2008;17:3043–3054.
- Senft D, Ronai ZA. UPR, autophagy, and mitochondria crosstalk underlies the ER stress response. Trend Biochem Sci. 2015;40:141–148.
- Cai Y, Arikkath J, Yang L, et al. Interplay of endoplasmic reticulum stress and autophagy in neurodegenerative disorders. Autophagy. 2016;12:225–244.
- Yao J, Jia L, Shelby SJ, et al. Circadian and noncircadian modulation of autophagy in photoreceptors and retinal pigment epithelium. Invest Ophthalmol Vis Sci. 2014;55:3237–3246.
- Zhou Z, Doggett TA, Sene A, et al. Autophagy supports survival and phototransduction protein levels in rod photoreceptors. Cell Death Differ. 2015;22:488–489.
- Mizushima N, Kuma A. Autophagosomes in GFP-LC3 transgenic mice. Meth Mol Biol. 2008;445:119–124.
- Uchiyama Y. Autophagic cell death and its execution by lysosomal cathepsins. Arch Histol Cytol. 2001;64:233–246.
- Matsumoto G, Wada K, Okuno M, et al. Serine 403 phosphorylation of p62/SQSTM1 regulates selective autophagic clearance of ubiquitinated proteins. Mol Cell. 2011;44:279–289.
- Yao J, Jia L, Feathers K, et al. Autophagy-mediated catabolism of visual transduction proteins prevents retinal degeneration. Autophagy. 2016;12:2439–2450.
- Hartford CM, Ratain MJ. Rapamycin: something old, something new, sometimes borrowed and now renewed. Clin Pharmacol Ther. 2007;82:381–388.
- Klionsky DJ, Abdelmohsen K, Abe A, et al. Guidelines for the use and interpretation of assays for monitoring autophagy (3rd edition). Autophagy. 2016;11:939–953.
- Viringipurampeer IA, Metcalfe AL, Bashar AE, et al. NLRP3 inflammasome activation drives bystander cone photoreceptor cell death in a P23H rhodopsin model of retinal degeneration. Hum Mol Genet. 2016;25:1501–1516.
- Comitato A, Di Salvo MT, Turchiano G, et al. Dominant and recessive mutations in rhodopsin activate different cell death pathways. Hum Mol Genet. 2016;25:2801–2812.
- Margariti A, Li H, Chen T, et al. XBP1 mRNA splicing triggers an autophagic response in endothelial cells through BECLIN-1 transcriptional activation. J Biol Chem. 2013;288:859–872.
- Lobanova ES, Finkelstein S, Skiba NP, et al. Proteasome overload is a common stress factor in multiple forms of inherited retinal degeneration. Proc Natl Acad Sci USA. 2013;110:9986–9991.
- Minina EA, Moschou PN, Bozhkov PV. Limited and digestive proteolysis: crosstalk between evolutionary conserved pathways. New Phytol. 2017;215:958–964.
- Wemheuer WM, Wrede A, Schulz-Schaeffer WJ. Types and strains: their essential role in understanding protein aggregation in neurodegenerative diseases. Front Aging Neurosci. 2017;9:187. eCollection 2017.
- Remondelli P, Renna M. The endoplasmic reticulum unfolded protein response in neurodegenerative disorders and its potential therapeutic significance. Front Mol Neurosci. 2017;10:187. eCollection 2017.
- Rubinsztein DC, Gestwicki JE, Murphy LO, et al. Potential therapeutic applications of autophagy. Nat Rev Drug Discov. 2007;6:304–312.
- Chinskey ND, Besirli CG, Zacks DN. Retinal cell death and current strategies in retinal neuroprotection. Curr Opin Ophthalmol. 2014;25:228–233.
- Galluzzi L, Bravo-San Pedro JM, Vitale I, et al. Essential versus accessory aspects of cell death: recommendations of the NCCD 2015. Cell Death Differ. 2015;22:58–73.
- Galluzzi L, Vitale I, Abrams JM, et al. Molecular definitions of cell death subroutines: recommendations of the Nomenclature Committee on Cell Death 2012. Cell Death Differ. 2012;19:107–120.
- Giansanti V, Rodriguez GE, Savoldelli M, et al. Characterization of stress response in human retinal epithelial cells. J Cell Mol Med. 2013;17:103–115.
- Murakami Y, Notomi S, Hisatomi T, et al. Photoreceptor cell death and rescue in retinal detachment and degenerations. Prog Retin Eye Res. 2013;37:114–140.
- Park HY, Kim JH, Park CK. Activation of autophagy induces retinal ganglion cell death in a chronic hypertensive glaucoma model. Cell Death Dis. 2012;3:e290.
- Piras A, Gianetto D, Conte D, et al. Activation of autophagy in a rat model of retinal ischemia following high intraocular pressure. PLoS One. 2011;6(7):e22514.
- Chiang WC, Messah C, Lin JH. IRE1 directs proteasomal and lysosomal degradation of misfolded rhodopsin. Mol Biol Cell. 2012 Mar;23(5):758–770.
- Mattapallil MJ, Wawrousek EF, Chan CC, et al. The Rd8 mutation of the Crb1 gene is present in vendor lines of C57BL/6N mice and embryonic stem cells, and confounds ocular induced mutant phenotypes. Invest Ophthalmol Vis Sci. 2012;53:2921–2927.
- Lewis MD, Pfeil J, Mueller AK. Continuous oral chloroquine as a novel route for Plasmodium prophylaxis and cure in experimental murine models. BMC Res Notes. 2011;4:262.
- Cook KL, Wärri A, Soto-Pantoja DR, et al. Hydroxychloroquine inhibits autophagy to potentiate antiestrogen responsiveness in ER+ breast cancer. Clin Cancer Res. 2014;20:3222–3232.
- Yao J, Jia L, Khan N, et al. Deletion of autophagy inducer RB1CC1 results in degeneration of the retinal pigment epithelium. Autophagy. 2015;11:939–953.
- Powell SR, Davies KJ, Divald A. Optimal determination of heart tissue 26S-proteasome activity requires maximal stimulating ATP concentrations. J Mol Cell Cardiol. 2007;42:265–269.