
ABSTRACT
While the advent of combination antiretroviral therapy (cART) has dramatically increased the life expectancy of HIV-1 infected individuals, paradoxically, however, the prevalence of HIV-1-associated neurocognitive disorders is on the rise. Based on the premise that the cytotoxic HIV-1 protein, transactivator of transcription (TAT), a known activator of glial cells that is found to persist in the central nervous system (CNS) despite cART, we sought to explore the role of defective mitophagy in HIV-1 TAT-mediated microglial activation. Our results demonstrated that exposure of mouse primary microglia to HIV-1 TAT resulted in cellular activation involving altered mitochondrial membrane potential that was accompanied by accumulation of damaged mitochondria. Exposure of microglia to HIV-1 TAT resulted in increased expression of mitophagy signaling proteins, such as PINK1, PRKN, and DNM1L, with a concomitant increase in the formation of autophagosomes, as evidenced by increased expression of BECN1 and MAP1LC3B-II. Intriguingly, exposure of cells to HIV-1 TAT also resulted in increased expression of SQSTM1, signifying thereby a possible blockade of the mitophagy flux, leading, in turn, to the accumulation of mitophagosomes. Interestingly, HIV-1 TAT-mediated activation of microglia was associated with decreased rate of extracellular acidification and mitochondrial oxygen consumption and increased expression of proinflammatory cytokines, such as Tnf, Il1b, and Il6. HIV-1 TAT-mediated defective mitophagy leading to microglial activation was further validated in vivo in the brains of HIV-1 transgenic rats. In conclusion, HIV-1 TAT activates microglia by increasing mitochondrial damage via defective mitophagy.
Abbreviations: 3-MA: 3-methyladenine; Δψm: mitochondrial membrane potential; ACTB: actin, beta; AIF1: allograft inflammatory factor 1; ATP: adenosine triphosphate; BAF: bafilomycin A1; BECN1: beclin 1, autophagy related; cART: combined antiretroviral therapy; CNS: central nervous system; DNM1L: dynamin 1 like; DMEM: Dulbecco modified Eagle medium; DAPI: 4,6-diamidino-2-phenylindole; ECAR: extracellular acidification rate; FBS: fetal bovine serum; FCCP: trifluoromethoxy carbonylcyanide phenylhydrazone; GAPDH: glyceraldehyde-3-phosphate dehydrogenase; HAND: HIV-1-associated neurocognitive disorders; HIV-1 TAT: human immunodeficiency virus-1 transactivator of transcription; IL1B: interleukin 1, beta; IL6: interleukin 6; ITGAM: integrin subunit alpha M; MAP1LC3B: microtubule-associated protein 1 light chain 3 beta; mPMs: mouse primary microglial cells; MRC: maximal respiratory capacity; mt-CO1: mitochondrially encoded cytochrome c oxidase; mt-ND6: mitochondrially encoded NADH:ubiquinone oxidoreductase core subunit 6; NFKB1: nuclear factor kappa B subunit 1; NLRP3: NLR family pyrin domain containing 3; OCR: oxygen consumption rate; PBS: phosphate-buffered saline; PINK1: PTEN induced putative kinase 1; PRKN: parkin RBR E3 ubiquitin protein ligase; ROS: reactive oxygen species; siRNA: small interfering RNA; SQSTM1: sequestosome 1; TNF: tumor necrosis factor
Introduction
Recent advances in combined antiretroviral therapy (cART) have resulted in successful control of human immunodeficiency virus-1 (HIV-1) replication and transmission resulting in significant reduction of HIV-1-associated morbidity and mortality in infected patients. In 2016 it was estimated that about 36.7 million people were living with HIV-1 globally, out of which almost half of them received cART [Citation1]. Despite the effectiveness of cART in controlling viremia, nearly 50% of the infected individuals continue to be afflicted with a spectrum of neurological symptoms, including cognitive and motor dysfunction, collectively termed as HIV-1-associated neurocognitive disorders (HAND) [Citation2,Citation3]. It is suggested that in the CNS factors such as impaired antiretroviral penetration, neurotoxicity associated with antiretrovirals, persistent low-level viral replication from virus reservoirs, release of viral proteins such as HIV-1 transactivator of transcription (TAT) and/or cellular factors such as the proinflammatory cytokines secreted by infiltrated or infected cells collectively play a role in neurodegeneration [Citation4–Citation7]. Among the nine HIV-1-encoded proteins, HIV-1 TAT that is a potent viral neurotoxin has received much attention due to its toxic effects on various CNS cells, and has been widely suggested as an underlying factor for the ongoing neuroinflammation associated with HIV-1 [Citation8–Citation11]. HIV-1 TAT is secreted by the infected cells of the CNS [Citation12], and can also be transported into the brain from the periphery across the blood-brain barrier [Citation13]. HIV-1 TAT can enter the cells via endocytosis either through nonspecific interactions with the cellular membrane or via interaction with specific receptors such as integrins, LRP1 (LDL receptor related protein), FLT1/vascular endothelial growth factor receptor-1 or chemokine receptors such as CCR2 (C-C motif chemokine receptor 2) and CCR3 [Citation14–Citation18]. Several studies have reported the presence of HIV-1 TAT protein and elevated expression of its mRNA in the brains of HIV-1-infected patients [Citation19,Citation20]. Presence of HIV-1 TAT in the CNS can be attributed to the fact that cART therapy has no effect on its expression once the pro-viral DNA is formed [Citation9]. HIV-1 TAT plays an essential role in neuroinflammation by not only activating glial cells such as the microglia [Citation12], but also by stimulating viral replication in latently infected cells by serving as a viral growth factor [Citation21]. Numerous studies have demonstrated the mechanisms by which HIV-1 TAT effects microglial function specifically via modulation of several signaling pathways that control cyclic adenosine monophosphate levels, intracellular Ca2+, leading in turn, to the synthesis of potentially neurotoxic mediators such as reactive oxygen species (ROS) and proinflammatory cytokines [Citation10,Citation22]. The role of mitochondria in HIV-1 TAT-mediated activation of microglia, and its sequelae of neuroinflammation, however, has not yet been explored.
Microglia, the predominant brain resident macrophages, play a major role in brain tissue repair, neurogenesis, and innate immunity. They are the key target cells for HIV-1 infection in the CNS and have been shown to support low-level virus replication in the brain [Citation23]. Recent studies have reported detectable levels of HIV-1 RNA and DNA in autopsied brain samples from cART-treated subjects [Citation24,Citation25]. In another study, abnormal levels of microglial activation persist in HIV-1 infected subjects on cART that had successful plasma viremia suppression and, that exhibited asymptomatic neurocognitive impairment [Citation26]. Notably, glial cells have been shown to get activated both following HIV-1 infection and also via exposure to viral proteins secreted from neighboring infected cells, leading to reactive gliosis. Reactive gliosis, in turn, plays a fundamental role in neuronal injury, one of the hallmark features of HIV-1/HIV-1 protein-mediated impairment of the CNS [Citation27,Citation28]. There have been extensive reports implicating the activation of critical upstream mediators such as NADPH oxidase family-derived ROS, mitogen-activated protein kinases and family of NFKB1 (nuclear factor kappa B subunit 1) members in reactive microgliosis, under various experimental settings [Citation29–Citation32]. Interestingly, mitochondrial ROS has been shown to play a critical role in modulating the inflammatory responses in microglia stimulated with lipopolysaccharides [Citation29,Citation33]. Mitochondrial abnormalities with impaired metabolic capacity are associated with various disease processes since mitochondria are the major energy source for cellular functions [Citation32,Citation34,Citation35]. While the role of HIV-1 TAT in microglial activation has been well documented [Citation8,Citation10,Citation11,Citation36–Citation38], whether HIV-1 TAT mediated microglial activation involves impairment of mitochondrial function has not yet been explored.
Mitochondria, important cellular organelles, play a central role in adenosine triphosphate (ATP) formation via the mitochondrial respiratory chain, and consequently, produce excessive ROS via the incomplete redox reactions, thereby exacerbating the cellular oxidative stress burden [Citation39–Citation41]. Under physiological conditions, mitochondrial oxidative stress is quenched by complex interactions with antioxidant defense systems, which in turn, keep the cellular inflammatory responses in check [Citation39–Citation41]. Under pathological conditions, however, such as in various neurodegenerative diseases, in addition to increased mitochondrial ROS, mitochondrial damage and defective mitophagy have also been shown to play key roles in mediating disease pathogenesis [Citation42]. Mitophagy, a selective form of autophagy, mainly regulates mitochondrial quality control by specifically targeting and eliminating damaged mitochondria via a cross-talk with the autophagic machinery. Initially, the damaged mitochondria are segregated from the healthy mitochondrial network via mitochondrial fission mediated by DNM1L/Drp1 (dynamin 1 like) protein [Citation43,Citation44]. Subsequently, the damaged mitochondria with altered membrane potential impair the translocation of cytosolic PINK1 (PTEN induced putative kinase 1) into the mitochondrial matrix, thereby leading to stabilization of PINK1 on the outer membrane of the damaged mitochondria. Owing to the kinase activity, the stabilized PINK1 autophosphorylates and recruits PRKN/PARK2 (parkin RBR E3 ubiquitin protein ligase) onto the damaged mitochondrial membrane. The recruited PRKN, in turn, ubiquitinates mitochondrial membrane proteins, and the ubiquitinated proteins then recruit a ubiquitin-binding autophagic receptor protein such as SQSTM1/p62 (sequestosome 1) to engulf the damaged mitochondria with MAP1LC3B/LC3B (microtubule associated protein 1 light chain 3 beta) thereby resulting in formation of the mitophagosome [Citation45–Citation47].
Recently, several studies have reported that inefficient removal of dysfunctional mitochondria, due to the defective mitophagy pathway, leads to increased cellular generation of ROS, oxidative stress, and neuroinflammation that in turn, underly the pathogenesis of various neurodegenerative diseases [Citation48–Citation50]. Whether HIV-1 TAT-induced microglial activation involves mitochondrial dysfunction and defective mitophagy, however, remains less understood. In light of this, the present study was aimed at exploring the molecular mechanism(s) by which HIV-1 TAT-mediates mitochondrial dysfunction and defective mitophagy resulting in microglial activation and neuroinflammation.
Results
HIV-1 TAT alters mitochondrial membrane potential and initiates mitophagy in mouse primary microglial cells (mPMs)
To determine whether exposure to HIV-1 TAT could induce microglial mitophagy, mPMs were exposed to varying doses of HIV-1 TAT (25, 50, 100 and 200 ng/mL) for 24 h, following which, the expression levels of mitophagy markers such as PINK1, PRKN, and DNM1L were determined using western blotting. Interestingly, following exposure of mPMs to HIV-1 TAT the expression levels of PINK1 ()), PRKN ()), and DNM1L ()) were upregulated in a dose-dependent manner. As shown in ), in the presence of 50 ng/mL of HIV-1 TAT expression of mitophagy marker proteins peaked significantly (P < 0.05) in mPMs. This concentration of HIV-1 TAT was thus chosen for the subsequent experiments. Previous reports have shown that the circulating levels of HIV-1 TAT in serum and the cerebrospinal fluid of HIV-1-infected patients ranges from 1 to 40 ng/mL [Citation51,Citation52]. Furthermore, it has been suggested that the local extracellular concentrations of HIV-1 TAT in the CNS could be even higher, especially in the vicinity of HIV-1 positive perivascular cells [Citation53]. In contrast, and as expected, mPMs exposed to heat-inactivated HIV-1 TAT (50 ng/mL) did not show any significant effects on the mitophagy marker proteins (–)). Next, we performed the time-course experiments to determine the optimal time for the expression of the above-mentioned mitophagy marker proteins in the mPMs exposed to HIV-1 TAT (50 ng/mL) for the indicated time points (0, 3, 6, 12, 24 and 48 h). Exposure of cells to HIV-1 TAT resulted in significantly (P < 0.05) increased expression of PINK1 ()) and DNM1L ()) starting at 6 h onwards with a sustained increase up to 24 h, following which, there was a downregulation of the protein expression at 48 h. As shown in ), the expression of PRKN protein, conversely, was significantly (P < 0.05) upregulated starting at 24 h in mPMs exposed to HIV-1 TAT (50 ng/mL). Additionally, we also isolated both mitochondrial as well as cytosolic fractions from HIV-1 TAT (50 ng/mL for varying time points) exposed mPMs and assessed expression of PINK1, DNM1L and PRKN in each of the fractions by western blotting. As shown in –l), HIV-1 TAT exposed mPMs exhibited significant (P < 0.05) upregulation of PINK1, DNM1L (starting at 6 h onwards) and PRKN (starting at 24 h onwards) in both the mitochondrial as well as cytosolic fractions.
Figure 1. HIV-1 TAT initiates mitophagy in mPMs. (a–c) HIV-1 TAT dose-dependently upregulated the expression of mitophagy markers – PINK1 (a), PRKN (b), and DNM1L (c) in mPMs. (d–f) HIV-1 TAT time-dependently upregulated the expression of mitophagy markers such as PINK1 (d), PRKN (e), and DNM1L (f) in mPMs. (g–i) Time-dependent upregulation of the mitophagy markers – PINK1 (g), PRKN (h), and DNM1L (i) in the mitochondria isolated from mPMs exposed to HIV-1 TAT (50 ng/mL). (j–l) Time-dependent upregulation of the mitophagy markers – PINK1 (j), PRKN (k), and DNM1L (l) in the cytosolic fractions of mPMs exposed to HIV-1 TAT (50 ng/mL). Either ACTB (for total and cytosolic) or VDAC (for mitochondria) was probed as a protein loading control. The data are presented as mean ± SEM from 6 independent experiments. Nonparametric Kruskal-Wallis One-way ANOVA followed by the Dunn post hoc test was used to determine the statistical significance between multiple groups. *, P < 0.05 vs. control
Mitophagy is a two-step process by which the damaged mitochondria are first primed by PINK1/PRKN proteins and are then eliminated via the autophagic machinery. We thus sought also to examine the expression levels of macroautophagy/autophagy proteins such as BECN1/Beclin1 (beclin 1, autophagy related), an autophagosome initiation marker, MAP1LC3B-II, an autophagosome formation marker and SQSTM1, an autophagy degradation marker in mPMs exposed to HIV-1 TAT (50 ng/mL) for varying times. As shown in –), in mPMs exposed to HIV-1 TAT there was a significant time-dependent increase up to 48 h, in the expression levels of the autophagy markers, BECN1 ()), MAP1LC3B-II ()) and SQSTM1 ()).
Figure 2. HIV-1 TAT alters mitochondrial membrane potential and initiates mitophagy in mPMs. (a–c) HIV-1 TAT time-dependently upregulated the expression of autophagy markers such as BECN1 (a), MAP1LC3B-II (b), and SQSTM1 (c) in mPMs. (d and e) HIV-1 TAT decreases mitochondrial membrane potential in mPMs. (d) Exposure with HIV-1 TAT (50 ng/mL; 24 h) resulted in a reduction of the JC-1 dye aggregation in the mitochondria and decreased ratio of the aggregate (red) to monomer JC-1 (green) in mPMs. Scale bar: 100 µm. (e) Quantification of JC-1 staining in mPMs exposed to HIV-1 TAT (50 ng/mL) for 24 h. The data are presented as mean ± SEM from 6 independent experiments. Nonparametric Kruskal-Wallis One-way ANOVA followed by the Dunn post hoc test was used to determine the statistical significance between multiple groups and Wilcoxon test was used to compare between 2 groups. *, P < 0.05 vs. control
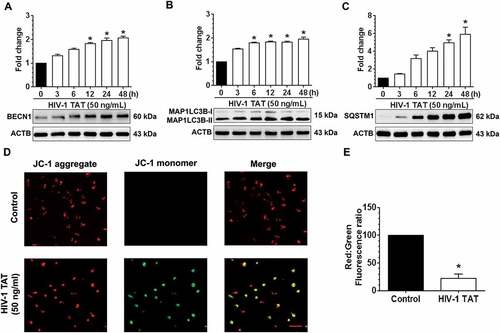
The next step was to examine whether exposure of mPMs to HIV-1 TAT could lead to alteration of the mitochondrial membrane potential (Δψm). Mitochondrial Δψm is one of the known key mediators responsible for the stabilization of PINK1 and for the initiation of the mitophagy pathway [Citation47]. JC-1 assay was used to determine mitochondrial Δψm in mPMs exposed to HIV-1 TAT (50 ng/mL for 24 h). JC-1 dye when exposed to cells with healthy mitochondria forms aggregates and emits a bright red fluorescence. Conversely, when exposed to cells with depolarized mitochondria, the dye disperses as a monomer and emits a green fluorescence [Citation54]. As shown in ,), control mPMs exhibited normal mitochondrial Δψm, characterized by increased red fluorescence (JC-1 aggregate) with a lesser green fluorescence (JC-1 monomer). In contrast, HIV-1 TAT (50 ng/mL for 24 h) exposed mPMs exhibited decreased Δψm, as shown by increased shift in red to green fluorescence. In addition, we also determined dose- and time-dependent changes in mitochondrial Δψm, using the JC-1 probe, in mPMs exposed to HIV-1 TAT. As shown in Figure S1A and S1B, exposure of mPMs to HIV-1 TAT resulted in both time- and dose-dependent reduction of mitochondrial Δψm.
HIV-1 TAT-mediated decrease of mitochondrial function and increased mitophagosome formation in mPMs
Based on the fact that exposure of mPMs to HIV-1 TAT significantly affected the mitochondrial Δψm, we next sought to determine the effect of HIV-1 TAT on mitochondrial function such as extracellular acidification rate (ECAR) and mitochondrial oxygen consumption rate (OCR). Specifically, the ECAR is an indicator of the glycolytic activity of cells that exhibit higher rates of proton production (anaerobic glycolysis), while the OCR is an indicator of mitochondrial function (aerobic glycolysis/oxidative phosphorylation) [Citation55]. Herein we assessed both OCR and ECAR, using a Seahorse XFp Extracellular Flux Analyzer, in mPMs exposed to HIV-1 TAT (50 ng/mL) for 24 h. Intriguingly, HIV-1 TAT exposure significantly altered both the OCR ()) and ECAR ()) in mPMs, underscoring thereby the occurrence of mitochondrial dysfunction in mPMs. Our results also demonstrated that in mPMs exposed to HIV-1 TAT, there was significant (P < 0.05) reduction in mitochondrial basal respiration, ATP production, maximal respiratory capacity (MRC), spare capacity as well as nonmitochondrial respiration compared with the control mPMs ()). Interestingly, exposure of mPMs to HIV-1 TAT did not show any significant change in the proton leak compared with the control cells ()). As a next step, we also isolated mitochondria from the frontal cortices of both wild-type and HIV-1 transgenic rats and performed mitochondrial function analyses using a Seahorse XFp Extracellular Flux Analyzer. Our findings demonstrated decreased levels of OCR such as basal respiration, ATP production, MRC, spare capacity, proton leak and nonmitochonadrial respiration in mitochondria isolated from HIV-1 transgenic rats compared with the wild-type controls, while no change was found in the levels of ECAR between these groups (Figure S2A to S2C). We also performed qPCR analysis to determine mitochondrial mass by evaluating mitochondrial copy number in mPMs exposed to varying doses of HIV-1 TAT for 24 h. Intriguingly, there was no significant change in mitochondrial copy number – in terms of expression of mitochondrial genes such as mt-Co1/cox1 (mitochondrially encoded cytochrome c oxidase I) and mt-Nd6/Nd6 (mitochondrially encoded NADH:ubiquinone oxidoreductase core subunit 6) in mPMs exposed to varying doses of HIV-1 TAT for 24 h (Figure S3A and S3B). Next, we performed transmission electron microscopy to study the formation and accumulation of autophagic vesicles containing mitochondria in mPMs exposed to HIV-1 TAT. As expected, in control mPMs we observed normal intact, healthy mitochondrial structures. In HIV-1 TAT exposed mPMs, however, there was the presence of several multivesicular bodies and an apparent increase of autophagosomes containing mitochondrial-like structures ()) compared with the control mPMs.
Figure 3. HIV-1 TAT-mediated mitochondrial dysfunction and increased mitophagosome formation in mPMs. (a–c) HIV-1 TAT significantly impaired mitochondrial function. (a) mitochondrial OCR and (b) ECAR were determined using a Seahorse XFp Extracellular Flux Analyzer in mPMs exposed to HIV-1 TAT (50 ng/mL) for 24 h. (c) Bar graph showing individual mitochondrial function parameters calculated from data in panel A. The data are presented as mean ± SEM from 6 independent experiments. The Wilcoxon test was used to compare between 2 groups. *, P < 0.05 vs. control. (d) Transmission electron microscopic images of mitochondrial ultrastructure and mitophagosomes in mPMs exposed to HIV-1 TAT (50 ng/mL) for 24 h. N, nucleus; M, mitochondria; ER, endoplasmic reticulum; AV, autophagic vesicle; AL, autolysosome. (e) Representative fluorescence images showing the accumulation of mitophagosomes in mPMs transfected with GFP- MAP1LC3 and pLV-mitoDsRed followed by exposure to HIV-TAT (50 ng/mL), and in cells treated with rotenone (1 μM) for 24 h. Scale bar: 5 μm
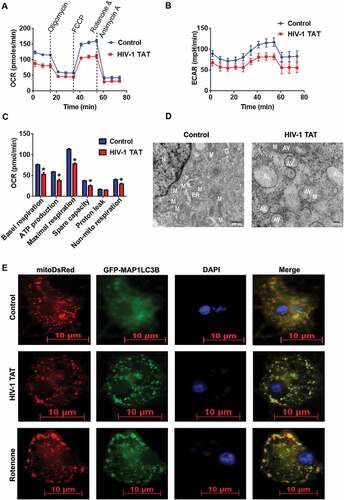
We next sought to confirm whether there was a link between HIV-1 TAT-mediated upregulation of mitophagy proteins and formation of the mitophagosome in mPMs. For this mPMs were first dually transfected with both pLV-mitoDsRed and GFP-MAP1LC3B, following which at 24 h the cells were exposed to either HIV-1 TAT or rotenone, a known inducer of mitophagy [Citation56], for another 24 h. As shown in ), in mPMs exposed to HIV-1 TAT there was increased presence of MAP1LC3B puncta throughout the mPMs and notably, these puncta prominently colocalized with pLV-mitoDsRed, indicating the formation of mitophagosomes. The results obtained with HIV-1 TAT were comparable to that of mPMs exposed to rotenone ()). Next, we wanted to confirm whether the accumulation of mitophagosomes in mPMs exposed to HIV-1 TAT was due to upregulation of mitophagy with a concomitant block in fusion with the lysosomes. For this, mPMs cultured in the presence or absence of HIV-1 TAT (50 ng/mL) were stained for both mitochondria (MitoTracker Red) as well as lysosomes (LysoTracker Green) to assess fusion of mitochondria with the lysosomes. As shown in Figure S4A, in mPMs exposed to HIV-1 TAT, there was reduced LysoTracker Green staining, and thereby reduced colocalization of MitoTracker Red and LysoTracker Green staining compared with the control cells. In addition, we also performed western blotting to determine the expression levels of LAMP2 (lysosomal associated membrane protein 2), a well-known marker protein whose expression regulates the fusion of lysosomes with the autophagosomes [Citation57]. Interestingly, the expression of LAMP2 was also downregulated (both dose- and time-dependently) in mPMs exposed to HIV-1 TAT protein (Figure S4B and S4C).
HIV-1 TAT-mediated increased autophagosome formation and decreased autophagic flux in mPMs
We next wanted to demonstrate whether the increased accumulation of mitophagosomes was due to increased formation of mitophagosomes and/or decreased autophagic flux. For this, we performed MAP1LC3B turnover and SQSTM1 degradation assays in mPMs exposed to HIV-1 TAT. Several studies have demonstrated that impaired autophagosome-lysosome fusion leads to decreased autophagic clearance, which, in turn, results in enhanced neurotoxicity [Citation58]. Following activation of the autophagic pathway, lipidation of MAP1LC3B-I leads to the processed form of phosphatidylethanolamine-conjugated MAP1LC3B-II, which specifically associates with the fully formed autophagosome. Expression of MAP1LC3B-II is thus a direct measure of the autophagosome number. The autophagic flux assay, instead, detects whether the processed MAP1LC3B-II accumulates in the presence of bafilomycin A1 (BAF), which is a known inhibitor of the autophagosome-lysosome fusion [Citation59]. In the present study, mPMs were exposed to HIV-1 TAT (50 ng/mL) for 24 h followed by treatment with or without BAF (400 nM, saturating concentration) for 4 h prior to harvesting of cells. As shown in ), no significant difference in the accumulation of MAP1LC3B-II was observed in mPMs exposed to HIV-1 TAT in the presence or absence of BAF.
Figure 4. HIV-1 TAT increases autophagosome formation and decreases autophagic flux in mPMs. (a and b) Representative western blots showing the expression of MAP1LC3B-II (a) and SQSTM1 (b) in mPMs exposed to HIV-1 TAT (50 ng/mL) for 24 h followed by treatment with 400 nM BAF, added in the last 4 h of the 24 h treatment period. ACTB was probed as a loading control for all experiments. (c) mPMs transfected with tandem fluorescent-tagged MAP1LC3B plasmid followed by HIV-1 TAT (50 ng/mL) and treated with rapamycin (10 nM) for 24 h. Scale bar: 5 μm. (d and e) Bar graph showing the number of autophagosomes (d) and autolysosomes (e) in mPMs transfected with tandem fluorescent-tagged MAP1LC3B plasmid and treated with HIV-1 TAT and rapamycin for 24 h. The data are presented as mean ± SEM from 6 independent experiments. Nonparametric Kruskal – Wallis One-way ANOVA followed by the Dunn post hoc test was used to determine the statistical significance between multiple groups and the Wilcoxon test was used to compare between 2 groups: *, P < 0.05 vs. control
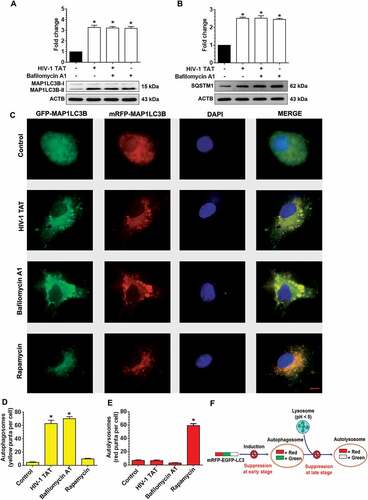
Next, we also performed the SQSTM1 degradation assay. SQSTM1 is a receptor protein that binds to ubiquitin and recruits the MAP1LC3B protein to form the autophagosome resulting in selective degradation of the autophagosome cargo. Impaired degradation and accumulation of SQSTM1 protein have been shown to directly correlate with the rate of autophagic vesicle degradation [Citation60]. Similar to the findings above on MAP1LC3B-II ()), there was no significant change in the accumulation of SQSTM1 in mPMs exposed to HIV-1 TAT in the presence or absence of BAF ()).
To further validate HIV-1 TAT mediated dysregulation of the autophagy flux, mPMs were transfected with a plasmid encoding the tandem fluorescent-tagged MAP1LC3B plasmid followed by exposure to HIV-1 TAT. Following formation of the autophagosomes, this tandem plasmid emits both red and green fluorescence that appears as merged yellow puncta due to the colocalization of mRFP and GFP-MAP1LC3B. Under acidic pH conditions in the lysosomes, however, the GFP signal of the tandem fluorescent-tagged MAP1LC3B fusion protein is quenched, whereas the red fluorescence remains stable and appears as the red puncta. Increased accumulation of the yellow puncta is thus an indicator of impaired autophagy while increased accumulation of the red puncta indicates increased autophagy flux ()). As shown in –), mPMs transfected with the tandem fluorescent-tagged MAP1LC3B reporter plasmid followed by exposure to HIV-1 TAT (50 ng/mL) for 24 h, exhibited a significant increase in the yellow puncta with a concomitant decrease in the red puncta, indicating thereby incomplete autophagosome maturation. Increased numbers of yellow puncta were also seen in mPMs exposed with BAF (400 nM), an autophagy flux inhibitor. In contrast, cells exposed to an autophagy inducer, rapamycin (100 nM), demonstrated increased formation of red puncta (–)), indicating increased autophagy flux.
Inhibition of mitophagosome initiation prevents HIV-1 TAT-mediated mitophagy signaling
Next, we sought to investigate the association between mitophagy and autophagy signaling in response to HIV-1 TAT. To answer this, we used both the pharmacological blocking approach using the autophagy inhibitors 3-methyladenine (3-MA) and wortmannin as well as the gene silencing approach involving transfection of cells with Becn1 siRNA followed by exposure to HIV-1 TAT. For the former approach mPMs were pretreated with either 5 mM of 3-MA or 100 nM of wortmannin for 1 h, followed by exposure to HIV-1 TAT for 24 h. At the end of the study, expression levels of mitophagy and autophagy markers were determined using western blotting. As shown in –), HIV-1 TAT-mediated induction of mitophagy markers such as PINK1 ()), PRKN ()), and DNM1L ()) as well as autophagy markers, BECN1 ()), MAP1LC3B-II ()), and SQSTM1 ()) were significantly (P < 0.05) inhibited in mPMs pretreated with either 3-MA or wortmannin, which was comparable to that observed in mPMs not exposed to HIV-1 TAT. These findings were further validated using the gene silencing approach. Herein mPMs were transfected with either Becn1 siRNA or scrambled siRNA followed by exposure to HIV-1 TAT (50 ng/mL) for 24 h and assessed for expression of mitophagy and autophagy marker proteins by western blotting. As expected, mPMs transfected with Becn1 siRNA and exposed to HIV-1 TAT failed to induce the mitophagy markers, PINK1 ()), PRKN ()), and DNM1L ()), as well as autophagy markers, BECN1 ()), MAP1LC3B-II ()), and SQSTM1 ()). Cells transfected with scrambled siRNA, however, demonstrated HIV-1 TAT-mediated upregulation of the mitophagy and autophagy markers (–l)).
Figure 5. Pharmacological and gene silencing of autophagy blocks HIV-1 TAT-mediated mitophagy. (a–f) Representative western blots showing expression of mitophagy markers such as PINK1 (a), PRKN (b), and DNM1L (c) and autophagy markers such as BECN1 (d), MAP1LC3B-II (e), and SQSTM1 (f) in mPMs pretreated with 5 mM 3-methyladenine (3-MA) and 100 nM of wortmannin for 1 h following exposure with HIV-1 TAT (50 ng/mL) for 24 h. (g–l) Representative western blots showing the protein expression of PINK1 (g), PRKN (h), and DNM1L (I), BECN1 (j), MAP1LC3B-II (k), and SQSTM1 (l) in mPMs transfected with Becn1 siRNA and scrambled siRNA following exposure with HIV-1 TAT (50 ng/mL) for 24 h. ACTB was probed as a protein loading control for all experiments. The data are presented as mean ± SEM from 6 independent experiments. Nonparametric Kruskal-Wallis One-way ANOVA followed by the Dunn post hoc test was used to determine the statistical significance between multiple groups. P < 0.05 vs. control; #, P < 0.05 vs. HIV-1 TAT
Next, we wanted to validate the findings using a specific pharmacological inhibitor of mitophagy, Mdivi-1, that acts on DNM1L and inhibits mitochondrial fission, thereby preventing HIV-1 TAT-mediated mitophagy in mPMs. For this mPMs were pretreated with Mdivi-1 (25 mM) for 1 h followed by exposure of cells to HIV-1 TAT for 24 h and assessed for expression of mitophagy and autophagy markers by western blotting. As shown in –), in cells pretreated with Mdivi-1, HIV-1 TAT failed to induce both the mitophagy markers, PINK1 ()), PRKN ()), and DNM1L ()) as well as the autophagy markers, MAP1LC3B-II ()), and SQSTM1 ()). Intriguingly, mPMs pretreated with Mdivi-1 failed to inhibit HIV-1 TAT-mediated upregulation of BECN1 ()) protein expression, indicating thereby that initiation of autophagy was upstream of priming of the damaged mitochondria and that HIV-1 TAT simultaneously induced mitochondrial priming as well as initiation of autophagosome machinery. These findings were further validated using the gene silencing approach. Cells were transfected with either Pink1 siRNA or scrambled siRNA followed by exposure to HIV-1 TAT (50 ng/mL) for 24 h and monitored for expression levels of mitophagy and autophagy markers by western blotting. As expected, similar to the pharmacological inhibition approach, cells transfected with Pink1 siRNA failed to induce HIV-1 TAT-mediated upregulation of mitophagy markers, PINK1 ()), PRKN ()), and DNM1L ()) as well as the autophagy markers, MAP1LC3B-II ()), and SQSTM1 ()) but failed to inhibit the autophagy initiation marker, BECN1 ()).
Figure 6. Pharmacological and gene silencing of mitophagy blocks HIV-1 TAT-mediated mitophagy. (a–f) Representative western blots showing expression of mitophagy markers such as PINK1 (a), PRKN (b), and DNM1L (c) and autophagy markers such as MAP1LC3-II (d), SQSTM1 (e), and BECN1(f) in mPMs pretreated with 25 μM Mdivi-1 (a mitophagy inhibitor) for 1 h following exposure with HIV-1 TAT (50 ng/mL) for 24 h. (g–l) Representative western blots showing expression of PINK1 (g), PRKN (H), and DNM1L (I), MAP1LC3B-II (j), SQSTM1 (k), and BECN1 (l) in mPMs transfected with either Pink1 siRNA or scrambled siRNA, following exposure to HIV-1 TAT (50 ng/mL) for 24 h. ACTB was probed as a protein loading control for all experiments. Nonparametric Kruskal-Wallis One-way ANOVA followed by the Dunn post hoc test was used to determine the statistical significance between multiple groups. P < 0.05 vs. control; #, P < 0.05 vs. HIV-1 TAT
HIV-1 TAT-mediated defective mitophagy increases microglial activation and elevates proinflammatory cytokines in mPMs
Having demonstrated HIV-1 TAT exposure resulted in defective mitophagy in mPMs, we next sought to explore whether the accumulation of mitophagosomes could lead to microglial activation by increasing the release of proinflammatory cytokines, a characteristic feature of microglial activation. For this mPMs were pretreated with either 3-MA (5 mM), wortmannin (100 nM) or Mdivi-1 (25 mM) for 1 h, followed by exposure to HIV-1 TAT (50 ng/mL) for 24 h and assessed for the expression of AIF1 (allograft inflammatory factor 1; a marker for microglial activation), and the proinflammatory cytokines. As shown in ,), pharmacological inhibition of either autophagy or mitophagy significantly (P < 0.05) inhibited HIV-1 TAT-mediated induction of AIF1 in mPMs. In keeping with this, the mRNA expression of Tnf (tumor necrosis factor), Il1b (interleukin 1 beta), and Il6 (interleukin 6) was also significantly (P < 0.05) inhibited in HIV-1 TAT-exposed mPMs pretreated either with the inhibitors of autophagy ()) or mitophagy ()). Similar to the pharmacological inhibition approach, gene silencing of Becn1 and Pink1 also significantly (P < 0.05) attenuated HIV-1 TAT-mediated induction of AIF1 protein (,)) as well as mRNA expression of proinflammatory cytokines, such as Tnf, Il1b, and Il6 (,)), underscoring thereby HIV-1 TAT-mediated defective mitophagy leading to accumulation of mitophagosomes resulting ultimately in increased microglial activation, as evidenced by increased expression of AIF1 and proinflammatory cytokines, in cells exposed to HIV-1 TAT.
Figure 7. HIV-1 TAT-mediated defective mitophagy increases microglial activation and elevates proinflammatory cytokines. (a and b) Representative western blots showing the increased expression of AIF1, a microglial activation marker in mPMs pretreated with 5mM 3-MA and 100 nM wortmannin (a), or in cells pretreated with 25 μM Mdivi-1 (b) for 1 h following exposure to HIV-1 TAT for 24 h. (c and d) Representative western blots showing increased expression of AIF1 in mPMs transfected with either Becn1 siRNA or scrambled siRNA (c) or with Pink1 siRNA or scrambled siRNA (d) following exposure to HIV-1 TAT for 24 h. ACTB was probed as a protein loading control for all experiments. (e and f) Representative bar graphs showing the mRNA expression profile of proinflammatory cytokines such as Tnf, Il1b, and Il6 using qPCR in mPMs pretreated with 5 mM of 3-MA and 100 nM of wortmannin (e) or pretreated with 25 μM Mdivi-1 (f) for 1 h following exposure with HIV-1 TAT for 24 h. (g and h) Representative bar graphs showing the mRNA expression profile of proinflammatory cytokines such as Tnf, Il1b, and Il6 using qPCR in mPMs transfected with either Becn1 siRNA and scrambled siRNA (g) or transfected with either Pink1 siRNA or scrambled siRNA (h) following exposure with HIV-1 TAT for 24 h. Gapdh was used as an internal control to normalize the gene expression for all experiments. Nonparametric Kruskal-Wallis One-way ANOVA followed by the Dunn post hoc test was used to determine the statistical significance between multiple groups. P < 0.05 vs. control; #, P < 0.05 vs. HIV-1 TAT
Silencing of pink1 and becn1 failed to prevent HIV-1 TAT-mediated decreased energy production in mPMs
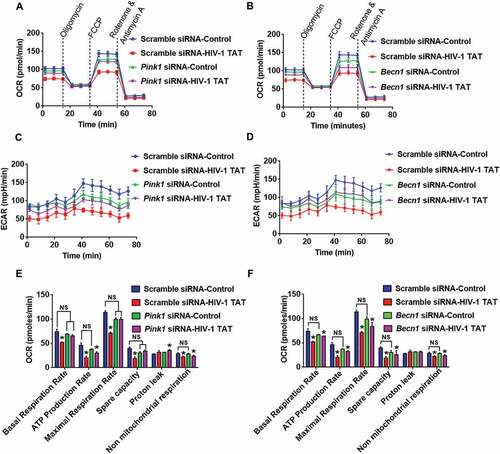
Next, we wanted to explore whether silencing of Pink1 and Becn1 genes could alleviate mitochondrial dysfunction. Herein mitochondrial functions such as mitochondrial OCR and ECAR were assessed in HIV-1 TAT exposed mPMs transfected with either Pink1 siRNA or Becn1 siRNA. OCR and ECAR were determined both at baseline as well as following sequential injections of oligomycin, carbonyl cyanide 4-(trifluoromethoxy)phenylhydrazone (FCCP), rotenone and antimycin A using a Seahorse XFe96 Analyzer. Intriguingly, HIV-1 TAT-mediated alteration in OCR (,)) and ECAR (,)) were restored to some extent in mPMs transfected with either Pink1 siRNA or Becn1 siRNA. Indeed, exposure to HIV-1 TAT resulted in mitochondrial dysfunction as evidenced by decreased levels of basal respiration, decreased rate of ATP production, maximal respiratory capacity (MRC), spare capacity of the mitochondria and nonmitochondrial respiration with a concomitant modest increase in proton leak, compared to untreated microglia (,)). Interestingly, knockdown of Pink1 did not affect the basal respiration or the nonmitochondrial respiration, but resulted in decreased (but statistically not significant) ATP production rate, MRC, spare capacity of the mitochondria and an increase in proton leak ()), thereby underscoring the role of PINK1 in normal mitochondrial quality control with the involvement of mitophagy. A possible explanation for this could be attributed to the fact that absence of PINK1 results in defective clearance of old or damaged mitochondria via the normal metabolic stress, leading, in turn, to the reduction of total mitochondrial capacity in response to stress. In Pink1 siRNA-transfected mPMs, the presence of HIV-1 TAT did not result in a further decrease in basal respiration rate, MRC as well as spare capacity compared to Pink1 siRNA-transfected cells not exposed to HIV-1 TAT. Interestingly in Pink1 siRNA-transfected cells, HIV-1 TAT did exhibit a significant reduction in the rate of ATP production and nonmitochondrial respiration compared to scrambled siRNA-transfected control mPMs ()). In contrast, knockdown of Becn1 was accompanied by decreased levels (but statistically not significant) of basal respiration, ATP production rate, MRC and spare capacity of the mitochondria with a modest increase in proton leak ()). In Becn1 siRNA-transfected mPMs, the presence of HIV-1 TAT resulted in a further decrease (but statistically not significant) in basal respiration rate, ATP production rate, MRC and spare capacity of the mitochondrial and nonmitochondrial respiration compared to Becn1 siRNA-transfected cells not exposed to HIV-1 TAT. Interestingly, Becn1 siRNA-transfected cells exposed to HIV-1 TAT did exhibit a significant reduction in all these parameters compared to scrambled siRNA-transfected control mPMs ()). Overall while silencing of Pink1 and Becn1 failed to prevent HIV-1 TAT-mediated decreased ATP production, there still was partial prevention of basal respiration, MRC and spare capacity. Next, we sought to assess whether the dissipation of mitochondrial membrane potential was upstream or downstream of the mitophagy process. For this, mitochondrial Δψm using JC-1 probe was assessed in mPMs silenced for either Pink1 or Becn1 genes followed by exposure to HIV-1 TAT (50 ng/mL) for 24 h. Our findings demonstrated that in mPMs transfected with either Pink1 or Becn1 siRNAs, mitochondrial Δψm in the presence of HIV-1 TAT remained unchanged compared with HIV-1 Tat exposed mPMs transfected with scrambled siRNA (Figure S1C and S1D).
Figure 8. Gene silencing of Pink1 and Becn1 partially inhibited HIV-1 TAT-mediated mitochondrial dysfunction in mPMs. (a and b) Graphical representation of the OCR measurement over time in mPMs transfected with either Pink1 siRNA and scrambled siRNA (a) or transfected with either Becn1 siRNA or scrambled siRNA (b) following exposure to HIV-1 TAT for 24 h. (c and d) Graphical representation of the ECAR measurement over time in mPMs transfected with either Pink1 siRNA and scrambled siRNA (c) or transfected with either Becn1 siRNA and scrambled siRNA (d) following exposure to HIV-1 TAT for 24 h. (e and F) Bar graphs showing the relative parameters of the mitochondrial respiratory function in mPMs transfected with either Pink1 siRNA (e) or Becn1 siRNA (f) calculated from respective panel A or panel B. The data are presented as mean ± SEM from 6 independent experiments. Nonparametric Kruskal-Wallis One-way ANOVA followed by the Dunn post hoc test was used to determine the statistical significance between multiple groups. P < 0.05 vs. control; #, P < 0.05 vs. HIV-1 TAT. NS, not significant
HIV-1 TAT increases the expression of mitophagy markers, microglial activation and proinflammatory cytokines in vivo
Having demonstrated HIV-1 TAT-mediated defective mitophagy and microglial activation, we next sought to validate our findings in vivo using HIV-1 Transgenic (HIV-1 Tg) rats [Citation61]. For this 3-month-old HIV-1 Tg rats and age-matched wild-type rats were assessed for mitophagy and autophagy signaling. As shown in –), mitophagy markers PINK1 ()), PRKN ()), and DNM1L ()) as well as autophagy markers BECN1 ()), MAP1LC3B-II ()) and SQSTM1 ()) were significantly (P < 0.05) elevated in the frontal cortex of HIV-1 Tg rats compared to wild-type rats. As expected HIV-1 Tg rats also showed a significantly (P < 0.05) increased mRNA expression of the proinflammatory cytokines, such as Tnf ()), Il1b ()), and Il6 ()) compared with the wild-type rats.
Figure 9. HIV-1 mediated upregulation of mitophagy markers and proinflammatory cytokines in vivo. (a–f) Representative western blots showing the activation of mitophagy markers such as PINK1 (a), PRKN (b), and DNM1L (C) and autophagy markers such as BECN1 (d), MAP1LC3B-II (e), and SQSTM1 (f) in the frontal cortex of wild-type and HIV-1 Tg rats (n = 3). ACTB was probed as a protein loading control for all experiments. (g–i) Representative bar graphs showing the mRNA expression profile of proinflammatory cytokines such as Tnf (g), Il1b (h), and Il6 (I) using qPCR in the frontal cortex of wild-type and HIV-1 Tg rats (n = 3). Gapdh was used as an internal control to normalize the gene expression for all experiments. The data are presented as mean ± SEM from 3 independent experiments. An unpaired Student t test was used to determine the statistical significance. *, P < 0.05 vs. WT
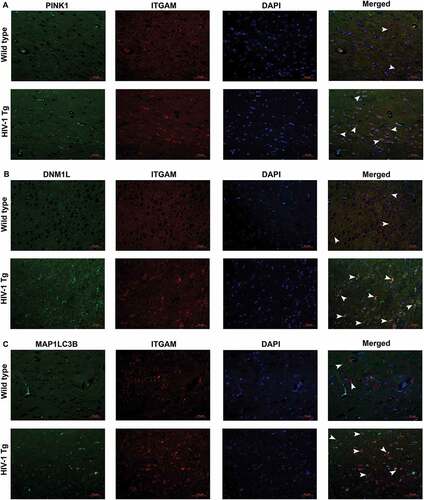
To further confirm the role of increased mitophagy and autophagy in microglial activation, we next performed immunofluorescence staining for mitophagy markers PINK1, DNM1L, and MAP1LC3B-II with ITGAM/CD11b (integrin subunit alpha M; microglial activation marker) in the HIV-1 Tg and wild-type rats. As shown in –), the intensity of PINK1 ()), DNM1L ()) as well as MAP1LC3B-II ()) puncta formation (green) were significantly increased in the frontal cortex of HIV-1 Tg rats compared to the wild-type rats. Furthermore, the intensity, as well as the number of cells expressing ITGAM (Red) was significantly increased and also colocalized with the mitophagy markers (green) in HIV-1 Tg rats. These findings thus underscore the effects of defective mitophagy in HIV-1 protein-mediated activation of microglia.
Figure 10. HIV-1 mediated upregulation of mitophagy markers and microglial activation in vivo. (a) Immunofluorescence staining for PINK1 (green), ITGAM, microglial activation marker (red), and DAPI (blue) in the frontal cortices of wild-type and HIV-1 Tg rats. (b) Immunofluorescence staining for DNM1L (green), ITGAM, microglial activation marker (red), and DAPI (blue) from frontal cortex area of wild-type and HIV-1 Tg rats. (c) Immunofluorescence staining for MAP1LC3 (green), ITGAM, microglial activation marker (red), and DAPI (blue) from frontal cortex area of wild-type and HIV-1 Tg rats. Scale bar: 10 μm
Discussion
Microglia represent a vital sentinel for the healthy central nervous system that can get chronically activated in various pathological neurodegenerative conditions such as Alzheimer disease, Parkinson disease, amyotrophic lateral sclerosis and HIV-associated neurological disorders (HAND) [Citation62–Citation67]. HAND is a spectrum of neurocognitive disorders ranging from asymptomatic impairment to minor cognitive motor disorders, that is increasing in prevalence in HIV-infected individuals on cART [Citation2,Citation3]. It has been well documented that despite the effectiveness of cART in suppressing viremia, CNS continues to harbor viral reservoirs with persistence of low-level virus replication [Citation9,Citation19,Citation20]. This lead, in turn, to the presence and accumulation of the early viral protein, HIV-1 TAT that is a well-recognized cytotoxic agent, contributing to glial activation. HIV-1 TAT-mediated activation of microglia has been shown to induce dysfunction and degeneration of surrounding and distant neurons [Citation11,Citation38,Citation68]. Indeed, the cytotoxic mediators such as proinflammatory cytokines, proteases and ROS secreted by the activated microglia have all been well-documented to cause neuronal injury, thereby promoting progression of HAND [Citation69]. It has also been suggested that systemic immune activation and/or inflammation possibly via the influx of peripheral macrophages can also contribute as a source of HIV-1 TAT in the CNS, leading to enhanced pathology of HAND [Citation70].
Mitophagy is an important cellular event wherein the depolarized or damaged mitochondria are selectively engulfed by phagophores, precursors to autophagosomes, and subsequently degraded by lysosomal fusion for clearance. This process maintains mitochondrial quality control and preserves cellular functions [Citation71]. Ample in vitro and in vivo evidence implicate the role of defective mitophagy leading to increased accumulation of ROS-generating damaged mitochondria, as critical mediators of both immune activation and inflammation in neuropathogenesis [Citation34,Citation35,Citation72,Citation73]. Recent research has demonstrated the role of impaired autophagy in neurons as a correlate of neurodegeneration in HAND [Citation74–Citation76]. Furthermore, Macho et al. [Citation77] have reported that in lymphoid cells, exposure to HIV-1 TAT leads to translocation of the viral protein from the nucleus to the mitochondria leading, in turn, to the dissipation of the mitochondrial membrane potential, increased generation of ROS and ultimately to apoptosis [Citation77]. Another study by Norman et al. [Citation78] has reported that in neurons HIV-1 TAT decreases free mitochondrial calcium levels, thereby interfering directly or indirectly with mitochondrial function, which in turn, negatively affects neuronal survival [Citation78]. In line with these findings, the present study was focused on determining the link between HIV-1 TAT-mediated mitochondrial damage, mitophagy and microglial activation.
In this study, we demonstrated that HIV-1 TAT mediated activation of mPMs involved alterations in the mitochondrial dynamics and mitophagy pathway. Our results showed that exposure of mPMs to HIV-1 TAT significantly downregulated the mitochondrial membrane potential and impaired mitochondrial function, as evidenced by increased number of depolarized mitochondria with decreased basal and maximal respiration rate, ATP production rate, spare capacity and the overall decreased OCR. These results are in agreement with previous reports demonstrating HIV-1 TAT-mediated depolarization of mitochondria and increased ROS generation and mitochondrial dysfunction that was accompanied with defective autophagy in neonatal rat ventricular cardiomyocytes [Citation79].
Our results also showed that in mPMs HIV-1 TAT significantly upregulated the expression of mitophagy markers – PINK1, PRKN, and DNM1L – as well as autophagic proteins – BECN1 and MAP1LC3B-II – indicating thereby HIV-1 TAT-mediated induction of mitophagy in mPMs. Intriguingly, assays using mitoDsRed and GFP-MAP1LC3B plasmid overexpression, as well as transmission electron microscopy, clearly demonstrated that upregulation of these proteins involved the formation of mitophagosomes that was accompanied by their accumulation in HIV-1 TAT treated mPMs. Under normal circumstances, following mitophagy induction, mitophagosomes are continually degraded by lysosomes via the lysosomal fusion pathway. In mPMs exposed to HIV-1 TAT, however, accumulation of mitophagosomes, possibly due to stress-mediated increased induction of mitophagy, did not lead to fusion with the lysosomes, likely due to a blockade in mitophagosome maturation and/or its clearance [Citation80]. Interestingly, our results showed a time-dependent upregulation of SQSTM1 following exposure to HIV-1 TAT, suggesting thereby that while the number of mitophagosomes increased, maturation of these vesicles was impaired. The MAP1LC3B turnover assay, as well as the SQSTM1 degradation assay, also indicated blockage of the autophagic flux as evidenced by the accumulation of MAP1LC3B-II and SQSTM1 in HIV-1 TAT exposed mPMs. Furthermore, the addition of the autophagosome-lysosome fusion inhibitor, BAF to HIV-1 TAT treated mPMs failed to cause any further increase in the expression of MAP1LC3B-II and SQSTM1, likely due to maximal accumulation of these mediators by HIV-1 TAT. Overexpression of tandem fluorescent-tagged MAP1LC3B plasmid in HIV-1 TAT-treated mPMs further validated this phenomenon as evidenced by increased accumulation of autophagosomes but not autolysosomes in these cells.
To assess the role of HIV-1 TAT-mediated mitophagy in microglial activation, we employed both pharmacological as well as gene silencing approaches. Our findings demonstrated that pharmacological inhibition of autophagy using 3-MA and wortmannin as well as specific inhibition of mitophagy using either Mdivi-1 or gene silencing by Becn1 and Pink1 siRNA transfections, significantly abrogated HIV-1 TAT-mediated induction of mitophagy (evidenced by inhibition of mitophagy proteins) and, microglial activation (evidenced by decreased AIF1 expression) and, neuroinflammation (evidenced by significant reduction in proinflammatory cytokines) in HIV-1 TAT exposed mPMs. Intriguingly, inhibiting Pink1 or DNM1L (mediators of mitochondrial priming) had no effect on the autophagy initiator BECN1, suggesting thereby that autophagy machinery was upstream of the primed mitochondria. Conversely, inhibiting the initiation of autophagy by the gene silencing approach, significantly inhibited PINK1- and PRKN-mediated mitophagy. These findings are in agreement with earlier reports wherein knockdown of BECN1 or its partner, phosphatidylinositol 3-kinase catalytic subunit type 3 results in inhibition of PINK1 in mitophagy pathway, thereby suggesting an interaction of PINK1 with BECN1 [Citation81].
We also performed mitochondrial functional analyses by measuring OCR in mPMs transfected with either Becn1 or Pink1 siRNA in the presence or absence of HIV-1 TAT. Our findings demonstrated that HIV-1 TAT-mediated decline in mitochondrial OCR was restored to some extent by gene silencing of either Becn1 or Pink1. Intriguingly, in the absence of HIV-1 TAT, gene silencing using either Pink1 or Becn1 siRNA led to decrease in OCR, basal respiration, maximal respiration, spare capacity and ATP production (but statistically not significant) compared with cells transfected with scrambled siRNA, suggesting thereby that Pink1 and Becn1 gene expression was essential for basal mitophagy, which play critical roles in normal cellular function via the removal of unwanted protein aggregates and damaged organelles [Citation82]. Furthermore, it has been postulated that mutation in PINK1, PRKN and in Parkinsonism associated deglycase complex leads to neuronal damage due to the incomplete removal of dysfunctional mitochondria and oxidative stress – a leading cause of autosomal inherited parkinsonism [Citation5]. Our studies in mPMs demonstrated that silencing Pink1 and Becn1 resulted in abrogation of HIV-1 TAT-mediated induction of mitophagy, microglial activation, and secretion of inflammatory cytokines. However, knockdown of Pink1 or Becn1 failed to prevent HIV-1 TAT-mediated downregulation of ATP production rate, other parameters such as basal respiration, MRC, and spare capacity were indeed prevented in Pink1- and Becn1-silenced mPMs. We thus infer that oxygen consumption for basal respiration was independent of ATP generation.
Similar to in vitro studies, we also demonstrated upregulation of mitophagy markers PINK1, PRKN and DNM1L as well as autophagy machinery proteins BECN1, MAP1LC3B and SQSTM1 in the frontal cortex of HIV-1 Tg rats compared to wild-type rats. Immunofluorescence studies further validated increased expression of mitophagy markers that was accompanied by increased microglial activation as evidenced by upregulated expression of PINK1, DNM1L and MAP1LC3B and ITGAM. There was increased colocalization of mitophagy markers with ITGAM protein, thereby suggesting induction of mitophagy in microglial cells of the HIV-1 Tg rats compared with the wild-type rats.
In summary, it can thus be concluded that exposure of mPMs to HIV-1 TAT resulted in increased initiation of mitophagy but with a blockade in mitophagosome maturation, suggesting thereby impaired clearance and accumulation of mitophagosomes. Accumulation of damaged mitochondria containing mitophagosomes eventually resulted in activation of microglia, which in turn, contributed to neuroinflammation via secretion of proinflammatory cytokines. It is well-recognized that cytokine production and release is an energetically demanding process. Therefore, it is a conundrum as to how HIV-1 TAT on the one hand stimulates mPMs to generate cytokines while on the other hand also induces mitochondrial dysfunction and decreased OCAR and ECAR. One possible explanation for this could be that while resting microglia utilize mitochondrial respiration (oxidative phosphorylation) pathway for energy production as shown for anti-inflammatory M2 macrophages and regulatory T cells, activated microglia utilize the glycolytic pathway for energy generation, similar to that used by proinflammatory M1 macrophages and T cells [Citation83].
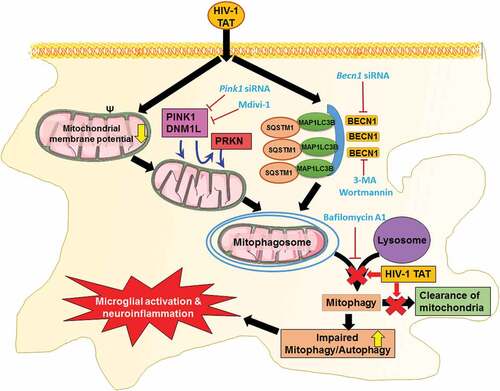
Several lines of evidence have also implicated the role of ROS and mitochondrial danger-associated molecular patterns such as mitochondrial DNA that are released from the damaged mitochondria, in activating inflammatory pathways such as NFKB1 and the NLRP3 (NLR family pyrin domain containing 3) inflammasome [Citation84,Citation85], that underlie neurodegeneration. Our recent findings have reported that in microglial cells, exposure to HIV-1 TAT mediates the priming and activation of the NLRP3 inflammasome and, that blocking of this pathway, results in abrogation of IL1B secretion [Citation37]. The molecular mechanism(s) underlying the impairment of mitophagosome-lysosome fusion and poor clearance of mitophagosomes, however, remain less understood. Other reports have demonstrated that accumulation of HIV-1 TAT in the endolysosomes, significantly affects the morphology, size, membrane integrity, pH and activity of several enzymes in neurons [Citation86], which in turn, could likely account for impaired mitophagosome fusion with the lysosome. Our results have established a novel link between mitochondrial dysfunction, defective mitophagy, and microglial activation, thereby suggesting that interventions aimed at blocking mitochondrial dynamics and/or increasing the clearance of damaged mitochondria () could provide promising therapeutic targets for abrogating HIV-1-mediated neuroinflammation and progression of HAND.
Figure 11. Schematic diagram outlining HIV-1 TAT-mediated defective mitophagy and microglial activation. Exposure of microglial to HIV-1 TAT decreases mitochondrial membrane potential, leading in turn, to mitochondrial dysfunction, that was followed by initiation of mitophagy and mitophagosomes formation. Exposure to HIV-1 TAT, however, blocked mitophagosome maturation, thereby leading to impaired clearance of damaged mitochondria. Accumulation of mitophagosome due to defective mitophagy resulted in microglial activation and increased the release of proinflammatory cytokines, leading to neuroinflammation
Materials and methods
Reagents
Endotoxin-free, HIV-1 recombinant Tat (1032–10) was purchased from ImmunoDX. Wortmannin (W3144), 3-MA (M9281), Mdivi-1 (M0199), rotenone (557368), rapamycin (R0395) and bafilomycin A1 (B1793) were purchased from Sigma-Aldrich. Anti-PINK1 (ab23707) was purchased from Abcam. Anti-DNM1L (611112) was obtained from BD Biosciences. Anti-PRKN (sc-32282), anti-BECN1 (sc-11427), Becn1 siRNA (sc-29798), Pink1 siRNA (sc-44599), and scrambled siRNA (sc-37007) were purchased from Santa Cruz Biotechnology. Anti-ITGAM (NB110-89474) and anti-MAP1LC3B (NB100-2220) were purchased from Novus Biological Company. Anti-AIF1 (019–19741) was obtained from Wako Pure Chemical Industries, Ltd. Anti-SQSTM1 (PM045) was purchased from MBL International. Anti-VDAC (4661S) was purchased from purchased from Cell Signaling Technology. Peroxidase-AffiniPure goat anti-rabbit IgG (H + L) (111–035-003) and peroxidase-conjugated AffiniPure goat anti-mouse IgG (H + L) (115–035-003) were from Jackson ImmunoResearch Inc.
Animals
HIV-1 Transgenic rats were created using a noninfectious provirus expressing 7 of the 9 HIV-1 viral proteins, such as Tat, Env, Rev, Nef, Vif, Vpr, and Vpu [Citation87]. Male Sprague Dawley (3-months old) HIV-1 transgenic rats (HIV-1, F344) and age, background-matched controls were used in this study. The animals were housed in clean polypropylene cages under conditions of constant temperature and humidity, with a 12–12 h day-night cycle, during which time they had free access to food and water ad libitum. Animal experiments were conducted according to the protocols approved by University of Nebraska Medical Center and the National Institutes of Health.
mPMs isolation
Pregnant C57BL/6N mice were purchased from Charles River Laboratories (Wilmington, MA USA). Primary cultures of mouse mixed glia were prepared from the cerebral cortices of 1- to 3-d-old C57BL/6 newborn pups as described previously [Citation88,Citation89]. Briefly, cerebral cortices from neonatal mice were dissected and freed of meninges. Mixed glial cultures were prepared by mild trypsinization of cortices by 0.25% trypsin (Invitrogen, 25300–054) followed by triturating and passing through a 40-µm nylon mesh. Cells were centrifuged and resuspended in Dulbecco modified Eagle medium (DMEM; Corning Cellgro®, 10–013-CV) supplemented with 10% fetal bovine serum (FBS; Atlanta Biologicals, S11150H), penicillin (100 U/ml)-streptomycin (100 μg/ml; Gibco, 15140122) and 0.25 ng/ml of CSF/macrophage colony-stimulating factor (Millipore Sigma, GF026). About 2 × 10⁷ cells were plated in 75-cm2 culture flasks containing 20 mL culture medium and were kept at 37°C in a humidified incubator gassed with 5% CO2. Approximately 5 to 10 ml of culture medium was added every 3rd day, after the first medium change on the third day. After mixed glial cultures had attained confluence (approximately 12–14 days), cultures were subjected to shaking at 37°C at 220 g for 2 h, to promote microglial detachment from the flasks. Detached microglia were plated and cultured for additional 24 h for further experimental use.
Mitochondria isolation
Mitochondrial isolation from cultured mPMs was performed using commercial Mitochondria Isolation Kit for Cultured Cells (Thermo Fisher Scientific, 89874) as per the manufacturer’s protocol. The manual isolation method as previously described by Luso et al. was followed to isolate mitochondria from brain tissues [Citation90]. Briefly, 50 mg of frontal cortices from wild-type and HIV-1 transgenic rats were homogenized (30 strokes at 500 rpm) with 5 mL of ice-cold mitochondrial isolation buffer 1 (MIB1). MIB1 was prepared by dissolving 210 mM D-mannitol (Fisher Scientific, BP686500), 70 mM sucrose (Fisher Scientific, S25590B), 5 mM HEPES (Fisher Scientific, 15630080), 1 mM EGTA (bioWORLD, 40520008–2), 0.5% (w:v) fatty acid-free BSA (Sigma-Aldrich, A8806) in ultrapure distilled water at a pH of 7.2. The homogenate was centrifuged at 800 × g for 10 min at 4°C in a swing-out rotor. The supernatant was recentrifuged at 8000 × g for 10 min at 4°C. The resulting pellet was washed twice with MIB1 and resuspended in a small volume of MAS1 containing the appropriate respiratory substrates such as 10 mM glutamate (Sigma-Aldrich, G8415), 10 mM malate (Sigma-Aldrich, M6413), and 10 mM succinate (Sigma-Aldrich, S2378). MAS1 buffer was prepared by dissolving 220 mM D-mannitol, 70 mM sucrose, 10 mM KH2PO4 (Sigma-Aldrich, P9791), 5 mM MgCl2 (Sigma-Aldrich, M1028), 2 mM HEPES, 1 mM EGTA, and 0.2% (w:v) fatty acid-free BSA in ultrapure distilled water at a pH of 7.2. The total protein content in the isolated mitochondria was determined by the BCA assay using the Pierce™ BCA Protein Assay Kit (Thermo Fisher Scientific, 23227) according to the manufacturer’s guidelines.
Analysis of mitochondrial membrane depolarization
Change in mitochondrial membrane potential in the mPMs exposed to HIV-1 TAT was monitored using the JC-1 Mitochondrial Membrane Potential Assay Kit (Cayman Chemicals, 10009172) according to the manufacturer’s instructions. Briefly, mPMs were seeded on sterile glass coverslips (11 mm) placed in a 24-well plate at a density of 1 × 10⁵ cells per well. The cells were then exposed to HIV-1 TAT protein followed by treatment with JC-1 reagent (100 µl/ml of medium) diluted in serum-free culture medium (1:10 dilution) and incubated for 20 min at 37°C in 5% CO2 incubator. After that, cells were rinsed once in 1× rinsing buffer provided in the kit. Fluorescence images were taken with a Zeiss Observer using a Z1 inverted microscope (Carl Zeiss, Thornwood, NY, USA) and the acquired images were analyzed using the AxioVs 40 Version 4.8.0.0 software (Carl Zeiss MicroImaging GmbH). The fluorescence intensities of mitochondrial JC‑1 monomers (λexcitation, 485 nm; λemission, 535 nm) and aggregates (λexcitation, 535 nm; λemission, 585 nm) were determined using a Synergy™ Mx Monochromator-Based Multi-Mode Microplate Reader (BioTek Instruments, Inc. Winooski, VT, USA). All experiments were repeated at least 6 times.
Staining of mitophagosome formation
mPMs were seeded in a 24-well plate containing sterile glass coverslips at a density of 5 × 10⁴ cells per well at 37°C in a humidified, 5% CO2 incubator. When attaining 70% confluence, the culture medium was replaced with Opti-MEM® I Reduced Serum Medium (Life Technologies, 31985070) and cells were transfected with the GFP-MAP1LC3B (a gift from Karla Kirkegaard; Addgene, 11546) [Citation91]. and pLV-mitoDsRed plasmid (a gift from Pantelis Tsoulfas; Addgene, 44386) [Citation86]. using Lipofectamine® 2000 Reagent (Invitrogen, 12566014) according to the manufacturer’s protocol. After 6 to 8 h the culture medium was replaced with DMEM supplemented with 10% heat-inactivated FBS. After 24 h, transfected mouse primary microglia cells were then exposed to HIV-1 TAT (50 ng/ml) and as a positive control, rotenone (1 μM) for 24 h. At the end of the experiment, cells were washed 3 times with phosphate-buffered saline (PBS; Hyclone Laboratories, SH3025801) at room temperature and fixed with 4% paraformaldehyde in PBS for 15 min at room temperature and followed by 3 times PBS wash. The coverslips were then mounted onto glass slides with ProLong Gold Antifade Reagent with 4,6-Diamidino-2-phenylindole (DAPI; Molecular Probes, P36935). Fluorescence images were taken with a Zeiss Observer using a Z1 inverted microscope, and the acquired images were analyzed for colocalization of red and green puncta using the Axio Vs 40 Version 4.8.0.0 software. All experiments were repeated at least 6 times.
Mitotracker red and Lysotracker green staining
mPMs were seeded onto sterile glass coverslips (11 mm; density of 1 × 10⁵ cells per coverslip) that were placed in a 24-well plate. The cells were then exposed to HIV-1 TAT (50 ng/mL) or rotenone (1 μM) for 24 h. Prior to harvest, mPMs were washed with phenol-free media and stained with 50 nM of MitoTracker™ Red FM (Thermo Fisher Scientific, M22425) and 50 nM LysoTracker™ Green DND-26 (Thermo Fisher Scientific, L7526) for 30 min at 37°C in 5% CO2 incubator. After that, cells were rinsed, and fluorescent images taken with a Zeiss Observer using a Z1 inverted microscope (Carl Zeiss, Thornwood, NY, USA).
Analyses of autophagosome formation and maturation
mPMs were seeded in a 24-well plate containing sterile glass coverslips at a density of 5 × 10⁴ cells per well at 37°C in a humidified, 5% CO2 incubator. Cells were transfected with the tandem fluorescent-tagged MAP1LC3B plasmid (ptfLC3; a gift from Tamotsu Yoshimori; Addgene, 21074) [Citation92]. using Lipofectamine® 2000 Reagent according to the manufacturer’s protocol. After 6 to 8 h, the culture medium was replaced with DMEM supplemented with 10% heat-inactivated FBS. After 24 h, transfected mouse primary microglia were exposed to HIV-1 TAT (50 ng/ml) and rapamycin (100 nM), a known autophagy inducer, for 24 h and BAF (400 nM), a known autophagosome-lysosome fusion inhibitor for 4 h before to the end of experimental period. Fluorescence images were taken with a Zeiss Observer using a Z1 inverted microscope (Carl Zeiss, Thornwood, NY, USA). Fluorescence images were analyzed by ImageJ software, the accumulation of autophagosomes (the number of colocalized red and green fluorescence dots) and autolysosomes (the number of red fluorescence dots). The percentages of cells with RFP-MAP1LC3B or RFP-GFP-MAP1LC3B dots were counted in 6 random nonoverlapping fields. All experiments were repeated 6 times.
Transmission electron microscopy
mPMs were seeded in 12-well plates containing sterile glass coverslips at a density of 5 × 10⁴ cells/well and placed overnight in a humidified, 5% CO2 incubator at 37°C. After overnight starvation, cells were exposed to HIV-1 TAT (50 ng/ml) for 24 h. Next, the cells were washed with PBS twice and flooded with EM grade glutaraldehyde fixative buffer (containing 2% glutaraldehyde, 2% paraformaldehyde, 0.1M cacodylate) for 30 min at room temperature. Samples were stored at 4°C until processing for electron microscopy. The images were taken with a FEI Tecnai G2 Spirit transmission electron microscope (FEI, Houston, TX, USA).
MAP1LC3B turnover and SQSTM1 degradation assays
mPMs were seeded in a 6-well plate at a density of 5 × 10⁵ cells/well and cultured in a humidified, 5% CO2 incubator at 37°C. After overnight starvation, cells were exposed to HIV-1 TAT (50 ng/ml) for 24 h and followed by exposure with 400 nM BAF, which was added in the last 4 h of the 24 h treatment period. At the end of experimental period, cells were harvested and used for western blotting analysis. All experiments were repeated at least 6 times.
SiRNA transfection
mPMs were transfected either with Becn1 or Pink1 siRNAs. Briefly, mPMs were seeded into 6-well plate at a density of 5 × 10⁵ cells/well and cultured in a humidified, 5% CO2 incubator at 37°C. On the next day, the culture medium was replaced with Opti-MEM® I Reduced Serum Medium. Meanwhile, the individual targeted siRNA and scrambled siRNA (120 pmol/ml) and Lipofectamine® 2000 (3 µl/ml) were incubated separately with Opti-MEM® I Reduced Serum Medium for 5 min at room temperature. After incubation, both individually targeted siRNAs and Lipofectamine® 2000 mix were mixed and subsequently, incubated at room temperature for another 20 min, mixed liquids were gently added to the culture medium. After 6 to 8 h the culture medium was replaced with DMEM supplemented with 10% heat-inactivated FBS. The transfected mouse primary microglia cells were then exposed to HIV-1 TAT (50 ng/ml) for 24 h, and transfection efficiency was analyzed by western blotting. All experiments were repeated at least 6 times.
Western blotting
At the end of each experiment, mPMs were harvested and lysed using the RIPA buffer supplemented with protease inhibitor cocktail (Thermo Fisher Scientific, 78429) and phosphatase inhibitor cocktail (Thermo Fisher Scientific, 78426). Cell lysates were centrifuged at 12000 g for 15 min at 4°C. The supernatant thus obtained was used for immunoblotting analysis. The protein concentration of each sample was determined by a BCA assay using the Pierce™ BCA Protein Assay Kit (Thermo Fisher Scientific, 23227) according to the manufacturer’s guidelines. Immunoblotting analyses were performed to determine the relative expression levels of proteins such as PINK1, PRKN, DNM1L, BECN1, MAP1LC3B-II, SQSTM1, and AIF1. Briefly, equal amounts of soluble proteins (10 μg) were subjected to sodium dodecyl sulfate-polyacrylamide gel electrophoresis following which they were transferred to a polyvinylidene fluoride membrane. Blotted membranes were blocked with 5% nonfat dry milk in 1× TTBS buffer (1.21 g Tris [Fisher Scientific, BP152-5], 8.77 g NaCl [Fisher Scientific, BP358-212], 500 μL Tween-20 [Fisher Scientific, BP337-500], pH 7.6 for 1 L) for 1 h at room temperature followed by an overnight incubation with the indicated primary antibodies at 4°C. Immunoreactive bands were identified using Super Signal West Pico Chemiluminescent Substrate (Thermo Fisher Scientific, 34078). ACTB (actin beta) was used as an internal control. The intensity of each band was measured using ImageJ analysis software [Citation93], and the data are presented as a relative fold change. All experiments were repeated at least 6 times.
Real-time qPCR
Total RNA was extracted from the mPMs and the brain tissues using Quick-RNATM MicroPrep kit (Zymo Research, R1051) as per the manufacturer’s protocol. Column purified, total RNA was then reverse transcribed into cDNA using a Verso cDNA Synthesis Kit (Thermo Fisher Scientific, AB-1453/B), according to the manufacturer’s instructions. Reverse transcribed RNA was then successively analyzed by 7500 Fast Real-Time PCR System (Applied Biosystems, Grand Island, NY) using the RT2 SYBR Green Fluor qPCR Mastermix (Qiagen, 330510). The amplification protocol comprised 1 cycle at 95°C for 3 min followed by 40 cycles at 95°C for 20 s, 60°C for 30 s, and then 72°C for 30 s, using relevant mouse primer sequences, such as Tnf forward 5′-CAGCCTCTTCTCCTTCCTGAT-3′, Tnf reverse 5′-GCCAGAGGGCTGATTAGAGA-3′, Il1b forward 5′-TACCTGTCCTGCGTGTTGAA-3′, Il1b reverse 5′-TCTTTGGGTAATTTTTGGGATCT-3′, Il6 forward 5′-GATGAGTACAAAAGTCCTGATCCA-3′, Il6 reverse 5′-CTGCAGCCACTGGTTCTGT-3′, Gapdh (glyceraldehyde-3-phosphate dehydrogenase) forward 5′-GGCACCCAGCACAATGAA-3′, Gapdh reverse 5′-GCCGATCCACACGGAGTACT-3′ and rat primer sequences, such as Tnf forward 5′-CAGCCTCTTCTCCTTCCTGAT-3′, Tnf reverse 5′-GCCAGAGGGCTGATTAGAGA-3′, Il1b forward 5′- GCACAGTTCCCCAACTGGTA-3′, Il1b reverse 5′- ACACGGGTTCCATGGTGAAG-3′, Il6 forward 5′- GGACCAAGACCATCCAACTCA-3′, Il6 reverse 5′-CCACAGTGAGGAATGTCCACA-3′, Gapdh forward 5′- TGCACCACCAACTGCTTAGC-3′, Gapdh reverse 5′- ATGCCAGTGAGCTTCCCGTT-3′ Normalization was done with Gapdh, as an internal control. Each reaction was carried out in triplicate, and 6 independent experiments were run. The fold change in expression was then obtained by the 2−ΔΔCT method.
Immunohistochemistry
Formalin-fixed, paraffin-embedded frontal cortex tissue sections from WT and HIV-1 Tg rats, were baked overnight at 55°C. The sections were deparaffinized in xylene and rehydrated in a graded series of alcohol. Next, the slides were boiled in Tris-EDTA buffer (pH 9) for approximately 20 min for efficient antigen retrieval. Slides were blocked in 10% goat serum (Fisher Scientific, NC9270494) in PBS at room temperature for 2 h. The slides were incubated with respective primary antibodies, such as anti-PINK1 or anti-PRKN and microglial marker anti-ITGAM at 4ºC overnight. Secondary Alexa Fluor 488 goat anti-rabbit IgG (Invitrogen, A-11008) or Alexa Fluor 594 goat anti-mouse (Invitrogen, A-11032) was added for 2 h, followed by mounting with ProLong Gold Antifade Reagent with DAPI. Fluorescent images were taken with a Zeiss Observer using a Z1 inverted microscope (Carl Zeiss, Thornwood, NY, USA) and the acquired images were analyzed for colocalization of red and green puncta using the Axio Vs 40 Version 4.8.0.0 software (Carl Zeiss MicroImaging GmbH). All experiments were repeated at least 3 times.
Analysis of mitochondrial function
The mitochondrial functions in terms of OCR and ECAR were measured using a Seahorse XFp Extracellular Flux Analyzer or Seahorse XFe96 Analyzer (Seahorse Bioscience, Billerica, MA, USA). MPMs were seeded in the density of 2 × 10⁵ cells/ml in Seahorse XFp or XFe96 cell culture plates and incubated at 37°C and 5% CO2 overnight. Next day, the cells were exposed to HIV-1 TAT (50 ng/ml) for 24 h. Meanwhile, a ‘Flux Pak’ cartridge (containing O2 and H+ sensitive fluorophores) was hydrated in an XF Calibrant solution (200 µl) and placed in non-CO2 overnight at 37°C. The following day, culture media was removed and washed with XF Assay medium (bicarbonate-free DMEM [Sigma-Aldrich, 102352]; supplemented with 10 mM glucose [Sigma-Aldrich, G7528], 2 mM pyruvate [Fisher Scientific, SH3023901], and 2 mM L-glutamine [Fisher Scientific, 25030081). Then 180 µl of XF assay medium was added to each well and incubated at 37°C in a non-CO2 incubator for degassing. For analyzing mitochondrial function from isolated mitochondria, mitochondria (10 μg/well) was diluted in 180 μL/well of MAS1 buffer and seeded in Seahorse XFp or XFe96 cell culture plates, followed by centrifugation at 2000 × g for 20 min at 4ºC. Following the Seahorse MitoStress Test® metabolic profiling protocol, mitochondrial complex inhibitor solutions were prepared according to manufacturer’s protocol and loaded into the hydrated Flux Pak as such: Port A: 20 μl oligomycin A ([stock] = 10 μM), Port B: 22 μl FCCP ([stock] = 20 μM), and Port C: 25 μl rotenone–antimycin A cocktail ([stock] = 10 μM). The Flux Pak was calibrated for 20 min in Seahorse XFp Extracellular Flux Analyzer. OCR and ECAR values were analyzed in the degassed cell culture plates using Mito Stress Test protocol. Analysis of data was done using the Seahorse Wave 2.2.0 software package (Seahorse Bioscience).
Analysis of mitochondrial DNA copy number
mPMs were seeded onto 6-well plates at a density of 5 × 10⁵ cells/well and placed overnight in a humidified, 5% CO2 incubator at 37°C. After overnight starvation, cells were exposed to varying doses of HIV-1 TAT for 24 h. Next, the cells were washed with PBS and genomic DNA isolated using Quick-DNA™ Miniprep Kit (Zymo Research, D3025). Mitochondrial DNA copy number was measured by comparing the relative levels of mitochondrial DNA with nuclear DNA copy number. Using qPCR, the mitochondrial DNA amplicons were determined from 2 distinct segments of the mitochondrial DNA genes: 1) gene encoded on the heavy strand i.e. mt-Co1, forward 5′-CCACTTCGCCATCATATTCGTAGG-3′ and reverse 5′-TCTGAGTAGCGTCGTGGTATTCC-3′; and 2) gene encoded on the light strand i.e. mt-Nd6, forward 5′-TCACCCAGCTACCACCATCATTC-3′; reverse 5′-CACTGAGGAGTACCCAGAGACTTG-3′. Actb (actin beta) was used as a nuclear amplicon as well as the internal control, forward 5′-GCAGGAGTACGATGAGTCCG-3′; reverse 5′-ACGCAGCTCAGTAACAGTCC-3′. Each reaction was carried out in triplicate, and 6 independent experiments were run. The fold change in expression was then obtained by the 2−ΔΔCT method.
Statistical analysis
The values are expressed as mean± SEM. Nonparametric Kruskal-Wallis One-way ANOVA followed by the Dunn post hoc test was used to compare the multiple experimental groups, and the Wilcoxon matched-pairs signed rank test was used to compare between 2 groups. For the in vivo experiments, the unpaired Student t test was used for comparing between 2 groups. All the statistical analyses were assessed using the GraphPad Prism software (Version 6.01). Values were considered statistically significant when P < 0.05.
Supplemental Material
Download MS Word (7.4 MB)Acknowledgments
We are grateful to Drs. Ming-Lei Guo, Guoku Hu, Ernest Chivero, and Susmita Sil for their useful discussions and to Dr. Kelly L. Stauch, Ms. Yeonhee Kook and Ms. Fang Niu for their technical assistances. The authors would like to thank Tom Bargar and Nicholas Conoan of the Electron Microscopy Core Facility (EMCF) at the University of Nebraska Medical Center for technical assistance. The EMCF is supported by state funds from the Nebraska Research Initiative (NRI) and the University of Nebraska Foundation, and institutionally by the Office of the Vice Chancellor for Research.
Disclosure statement
No potential conflict of interest was reported by the authors.
Supplemental data
Supplementary data can be accessed here
Additional information
Funding
Related Research Data
References
- WHO. Prevent HIV, test and treat all - WHO support for country impact, WHO reference number: WHO/HIV/2016.24 2016 [ updated 2016 Dec]. Available from: http://www.who.int/hiv/pub/progressreports/2016-progress-report/en/
- McArthur JC, Steiner J, Sacktor N, et al. Human immunodeficiency virus-associated neurocognitive disorders: mind the gap. Ann Neurol. 2010 Jun;67(6):699–714. PMID: 20517932.
- Saylor D, Dickens AM, Sacktor N, et al. HIV-associated neurocognitive disorder–pathogenesis and prospects for treatment. Nat Rev Neurol. 2016 Apr;12(4):234–248. PMID: 26965674. PMC4937456.
- Jayadev S, Garden GA. Host and viral factors influencing the pathogenesis of HIV-associated neurocognitive disorders. J Neuroimmune Pharmacol. 2009 Jun 4;2:175–189. PMID: 19373562. PMC2775061.
- Cookson MR. Parkinsonism due to mutations in PINK1, parkin, and DJ-1 and oxidative stress and mitochondrial pathways. Cold Spring Harb Perspect Med. 2012 Sep 1;2(9):a009415. PMID: 22951446. PMC3426824.
- Vassallo M, Dunais B, Durant J, et al. Relevance of lipopolysaccharide levels in HIV-associated neurocognitive impairment: the Neuradapt study. J Neurovirol. 2013 Aug;19(4):376–382. PMID: 23846287.
- Carroll A, Brew B. HIV-associated neurocognitive disorders: recent advances in pathogenesis, biomarkers, and treatment. F1000Res. 2017;6(312). DOI:10.12688/f1000research.10651.1 PMID: 28413625. PMC5365228.
- Nath A, Conant K, Chen P, et al. Transient exposure to HIV-1 Tat protein results in cytokine production in macrophages and astrocytes. A hit and run phenomenon. J Biol Chem. 1999 Jun 11;274(24):17098–17102. PMID: 10358063.
- Li W, Li G, Steiner J, et al. Role of Tat protein in HIV neuropathogenesis. Neurotox Res. 2009 Oct;16(3):205–220. PMID: 19526283.
- Bagashev A, Sawaya BE. Roles and functions of HIV-1 Tat protein in the CNS: an overview. Virol J. 2013 Dec 21;10:358. PMID: 24359561. PMC3879180.
- Paris JJ, Singh HD, Carey AN, et al. Exposure to HIV-1 Tat in brain impairs sensorimotor gating and activates microglia in limbic and extralimbic brain regions of male mice. Behav Brain Res. 2015 Sep;15(291):209–218. PMID: 26005128. PMC4497922.
- Ensoli B, Buonaguro L, Barillari G, et al. Release, uptake, and effects of extracellular human immunodeficiency virus type 1 Tat protein on cell growth and viral transactivation. J Virol. 1993 Jan;67(1):277–287. PMID: 8416373. PMC237361.
- Banks WA, Robinson SM, Nath A. Permeability of the blood-brain barrier to HIV-1 Tat. Exp Neurol. 2005 May;193(1):218–227. PMID: 15817280.
- Mann DA, Frankel AD. Endocytosis and targeting of exogenous HIV-1 Tat protein. EMBO J. 1991 Jul;10(7):1733–1739. PMID: 2050110. PMC452844.
- Barillari G, Gendelman R, Gallo RC, et al. The Tat protein of human immunodeficiency virus type 1, a growth factor for AIDS Kaposi sarcoma and cytokine-activated vascular cells, induces adhesion of the same cell types by using integrin receptors recognizing the RGD amino acid sequence. Proc Natl Acad Sci USA. 1993 Sep 1;90(17):7941–7945. PMID: 7690138. PMC47263.
- Mitola S, Sozzani S, Luini W, et al. Tat-human immunodeficiency virus-1 induces human monocyte chemotaxis by activation of vascular endothelial growth factor receptor-1. Blood. 1997 Aug 15;90(4):1365–1372. PMID: 9269752.
- Polazzi E, Levi G, Minghetti L. Human immunodeficiency virus type 1 Tat protein stimulates inducible nitric oxide synthase expression and nitric oxide production in microglial cultures. J Neuropathol Exp Neurol. 1999 Aug;58(8):825–831. PMID: 10446807.
- Liu Y, Jones M, Hingtgen CM, et al. Uptake of HIV-1 tat protein mediated by low-density lipoprotein receptor-related protein disrupts the neuronal metabolic balance of the receptor ligands. Nat Med. 2000 Dec 6;(12):1380–1387. DOI:10.1038/82199 PMID: 11100124.
- Wiley CA, Baldwin M, Achim CL. Expression of HIV regulatory and structural mRNA in the central nervous system. AIDS (London, England). 1996 Jul;10(8):843–847. PMID: 8828741.
- Hudson L, Liu J, Nath A, et al. Detection of the human immunodeficiency virus regulatory protein tat in CNS tissues. J Neurovirol 2000 Apr;6(2):145–155. PMID: 10822328.
- Frankel AD, Pabo CO. Cellular uptake of the tat protein from human immunodeficiency virus. Cell. 1988 Dec 23;55(6):1189–1193. PMID: 2849510.
- Minghetti L, Visentin S, Patrizio M, et al. Multiple actions of the human immunodeficiency virus type-1 Tat protein on microglial cell functions. Neurochem Res. 2004 May;29(5):965–978. PMID: 15139295.
- Chen NC, Partridge AT, Sell C, et al. Fate of microglia during HIV-1 infection: from activation to senescence? Glia. 2017 Mar;65(3):431–446. PMID: 27888531. PMC5263094.
- Kumar AM, Borodowsky I, Fernandez B, et al. Human immunodeficiency virus type 1 RNA Levels in different regions of human brain: quantification using real-time reverse transcriptase-polymerase chain reaction. J Neurovirol. 2007 Jun;13(3):210–224. PMID: 17613711.
- Lamers SL, Rose R, Maidji E, et al. HIV DNA is frequently present within pathologic tissues evaluated at autopsy from combined antiretroviral therapy-treated patients with undetectable viral loads. J Virol. 2016 Oct 15;90(20):8968–8983. PMID: 27466426. PMC5044815.
- Anthony IC, Ramage SN, Carnie FW, et al. Influence of HAART on HIV-related CNS disease and neuroinflammation. J Neuropathol Exp Neurol. 2005 Jun;64(6):529–536. PMID: 15977645.
- Rock RB, Gekker G, Hu S, et al. Role of microglia in central nervous system infections. Clin Microbiol Rev. 2004 Oct;17(4):942–964. table of contents. PMID: 15489356. PMC523558.
- Garvey LJ, Pavese N, Politis M, et al. Increased microglia activation in neurologically asymptomatic HIV-infected patients receiving effective ART. AIDS (London, England). 2014 Jan 2;28(1):67–72. PMID: 23887068.
- Park J, Min JS, Kim B, et al. Mitochondrial ROS govern the LPS-induced pro-inflammatory response in microglia cells by regulating MAPK and NF-kappaB pathways. Neurosci Lett. 2015 Jan;1(584):191–196. PMID: 25459294.
- Nayernia Z, Jaquet V, Krause KH. New insights on NOX enzymes in the central nervous system. Antioxid Redox Signal. 2014 Jun 10;20(17):2815–2837. PMID: 24206089. PMC4026375.
- Rojo AI, McBean G, Cindric M, et al. Redox control of microglial function: molecular mechanisms and functional significance. Antioxid Redox Signal. 2014 Oct 20;21(12):1766–1801. PMID: 24597893. PMC4186766.
- von Bernhardi R, Eugenin-von Bernhardi L, Eugenin J. Microglial cell dysregulation in brain aging and neurodegeneration. Front Aging Neurosci. 2015;7:124. PMID: 26257642. PMC4507468.
- Ye J, Jiang Z, Chen X, et al. Electron transport chain inhibitors induce microglia activation through enhancing mitochondrial reactive oxygen species production. Exp Cell Res. 2016 Jan 15;340(2):315–326. PMID: 26511505.
- Yang S, Xia C, Li S, et al. Defective mitophagy driven by dysregulation of rheb and KIF5B contributes to mitochondrial reactive oxygen species (ROS)-induced nod-like receptor 3 (NLRP3) dependent proinflammatory response and aggravates lipotoxicity. Redox Biol. 2014;3:63–71. PMID: 25462067. PMC4295565.
- Yue L, Yao H. Mitochondrial dysfunction in inflammatory responses and cellular senescence: pathogenesis and pharmacological targets for chronic lung diseases. Br J Pharmacol. 2016 Aug;173(15):2305–2318. PMID: 27189175. PMC4945771.
- Jin J, Lam L, Sadic E, et al. HIV-1 Tat-induced microglial activation and neuronal damage is inhibited via CD45 modulation: A potential new treatment target for HAND. Am J Transl Res. 2012;4(3):302–315. PMID: 22937208. PMC3426392.
- Chivero ET, Guo ML, Periyasamy P, et al. HIV-1 Tat primes and activates microglial NLRP3 inflammasome-mediated neuroinflammation. J Neuroscience. 2017 Mar 29;37(13):3599–3609. PMID: 28270571. PMC5373137.
- Duan M, Yao H, Cai Y, et al. HIV-1 Tat disrupts CX3CL1-CX3CR1 axis in microglia via the NF-kappaBYY1 pathway. Curr HIV Res. 2014;12(3):189–200. PMID: 24862326. PMC5003019.
- Munro D, Treberg JR. A radical shift in perspective: mitochondria as regulators of reactive oxygen species. J Exp Biol. 2017 Apr 1;220(Pt7):1170–1180. PMID: 28356365.
- Holmstrom KM, Kostov RV, Dinkova-Kostova AT, The multifaceted role of Nrf2 in mitochondrial function. Curr Opin Toxicol. 2016 Dec 1:80–91. PMID: 28066829. PMC5193490. DOI:10.1016/j.cotox.2016.10.002
- Islam MT. Oxidative stress and mitochondrial dysfunction-linked neurodegenerative disorders. Neurol Res. 2017 Jan;39(1):73–82. PMID: 27809706.
- Guo C, Sun L, Chen X, et al. Oxidative stress, mitochondrial damage and neurodegenerative diseases. Neural Regen Res. 2013 Jul 25;8(21):2003–2014. PMID: 25206509. PMC4145906.
- Twig G, Elorza A, Molina AJ, et al. Fission and selective fusion govern mitochondrial segregation and elimination by autophagy. EMBO J. 2008 Jan 23;27(2):433–446. PMID: 18200046. PMC2234339.
- Twig G, Shirihai OS. The interplay between mitochondrial dynamics and mitophagy. Antioxid Redox Signal. 2011 May 15;14(10):1939–1951. PMID: 21128700. PMC3078508.
- Narendra D, Tanaka A, Suen DF, et al. Parkin is recruited selectively to impaired mitochondria and promotes their autophagy. J Cell Biol. 2008 Dec 1;183(5):795–803. PMID: 19029340. PMC2592826.
- Geisler S, Holmstrom KM, Skujat D, et al. PINK1/Parkin-mediated mitophagy is dependent on VDAC1 and p62/SQSTM1. Nat Cell Biol. 2010 Feb;12(2):119–131. PMID: 20098416.
- Matsuda N, Sato S, Shiba K, et al. PINK1 stabilized by mitochondrial depolarization recruits Parkin to damaged mitochondria and activates latent Parkin for mitophagy. J Cell Biol. 2010 Apr 19;189(2):211–221. PMID: 20404107. PMC2856912.
- Sadeghian M, Mastrolia V, Rezaei Haddad A, et al. Mitochondrial dysfunction is an important cause of neurological deficits in an inflammatory model of multiple sclerosis. Sci Rep. 2016 Sep 14;(6):33249. DOI:10.1038/srep33249 PMID: 27624721. PMC5021937.
- Wilkins HM, Koppel SJ, Weidling IW, et al. Extracellular mitochondria and mitochondrial components act as damage-associated molecular pattern molecules in the mouse brain. J Neuroimmune Pharmacol. 2016 Dec;11(4):622–628. PMID: 27562848. PMC5097888.
- Adiele RC, Adiele CA. Mitochondrial regulatory pathways in the pathogenesis of Alzheimer’s disease. J Alzheimer’s Dis. 2016 Jul 6;53(4):1257–1270. PMID: 27392851.
- Westendorp MO, Frank R, Ochsenbauer C, et al. Sensitization of T cells to CD95-mediated apoptosis by HIV-1 Tat and gp120. Nature. 1995 Jun 8;375(6531):497–500. PMID: 7539892.
- Xiao H, Neuveut C, Tiffany HL, et al. Selective CXCR4 antagonism by Tat: implications for in vivo expansion of coreceptor use by HIV-1. Proc Natl Acad Sci USA. 2000 Oct 10;97(21):11466–11471. PMID: 11027346. PMC17223.
- Hayashi K, Pu H, Andras IE, et al. HIV-TAT protein upregulates expression of multidrug resistance protein 1 in the blood-brain barrier. J Cereb Blood Flow Metab. 2006 Aug;26(8):1052–1065. PMID: 16395283.
- Cossarizza A, Baccarani-Contri M, Kalashnikova G, et al. A new method for the cytofluorimetric analysis of mitochondrial membrane potential using the J-aggregate forming lipophilic cation 5,5ʹ,6,6ʹ-tetrachloro-1,1ʹ,3,3ʹ-tetraethylbenzimidazolcarbocyanine iodide (JC-1). Biochem Biophys Res Commun. 1993 Nov 30;197(1):40–45. PMID: 8250945.
- Zhang J, Nuebel E, Wisidagama DR, et al. Measuring energy metabolism in cultured cells, including human pluripotent stem cells and differentiated cells. Nat Protoc. 2012 May 10;7(6):1068–1085. PMID: 22576106. PMC3819135.
- Chu CT, Ji J, Dagda RK, et al. Cardiolipin externalization to the outer mitochondrial membrane acts as an elimination signal for mitophagy in neuronal cells. Nat Cell Biol. 2013 Oct;15(10):1197–1205. PMID: 24036476. PMC3806088.
- Huynh KK, Eskelinen EL, Scott CC, et al. LAMP proteins are required for fusion of lysosomes with phagosomes. EMBO J. 2007 Jan 24;26(2):313–324. PMID: 17245426.ZPMC1783450.
- Shacka JJ, Roth KA, Zhang J. The autophagy-lysosomal degradation pathway: role in neurodegenerative disease and therapy. Front Biosci. 2008 Jan 1;13:718–736. PMID: 17981582.
- Yamamoto A, Tagawa Y, Yoshimori T, et al. Bafilomycin A1 prevents maturation of autophagic vacuoles by inhibiting fusion between autophagosomes and lysosomes in rat hepatoma cell line, H-4-II-E cells. Cell Struct Funct. 1998 Feb;23(1):33–42. PMID: 9639028.
- Tanida I, Waguri S. Measurement of autophagy in cells and tissues. Methods Mol Biol (Clifton, NJ). 2010;648:193–214. PMID: 20700714.
- Avdoshina V, Bachis A, Mocchetti I. Synaptic dysfunction in human immunodeficiency virus type-1-positive subjects: inflammation or impaired neuronal plasticity? J Intern Med. 2013 May;273(5):454–465. PMID: 23600400. PMC3633109.
- Block ML, Hong JS. Microglia and inflammation-mediated neurodegeneration: multiple triggers with a common mechanism. Prog Neurobiol. 2005 Jun;76(2):77–98. PMID: 16081203.
- Dheen ST, Kaur C, Ling EA. Microglial activation and its implications in the brain diseases. Curr Med Chem. 2007;14(11):1189–1197. PMID: 17504139.
- Henkel JS, Beers DR, Zhao W, et al. Microglia in ALS: the good, the bad, and the resting. J Neuroimmune Pharmacol. 2009 Dec;4(4):389–398. PMID: 19731042.
- Perry VH, Holmes C. Microglial priming in neurodegenerative disease [Review]. Nat Rev Neurol. 2014 Apr;10(4):217–224. PMID: 24638131.
- Loane DJ, Kumar A, Stoica BA, et al. Progressive neurodegeneration after experimental brain trauma: association with chronic microglial activation. J Neuropathol Exp Neurol. 2014 Jan;73(1):14–29. PMID: 24335533. PMC4267248.
- Hoeijmakers L, Heinen Y, van Dam AM, et al. Microglial priming and Alzheimer’s disease: a possible role for (early) immune challenges and epigenetics? Front Hum Neurosci. 2016;10:398. PMID: 27555812. PMC4977314.
- Lipton SA, Gendelman HE. Seminars in medicine of the Beth Israel Hospital, Boston. Dementia associated with the acquired immunodeficiency syndrome. N Engl J Med. 1995 Apr 6;332(14):934–940. PMID: 7877652.
- Kaul M, Garden GA, Lipton SA. Pathways to neuronal injury and apoptosis in HIV-associated dementia. Nature. 2001 Apr 19;410(6831):988–994. PMID: 11309629.
- Glass JD, Fedor H, Wesselingh SL, et al. Immunocytochemical quantitation of human immunodeficiency virus in the brain: correlations with dementia. Ann Neurol. 1995 Nov;38(5):755–762. PMID: 7486867.
- Jin SM, Youle RJ. PINK1- and Parkin-mediated mitophagy at a glance. J Cell Sci. 2012;125(4):795.
- Gottlieb RA, Linton PJ. Indigestible mitochondria cause heartburn. Cell Res. 2012 Nov;22(11):1518–1520. PMID: 22710797. PMC3494386.
- Ahmad T, Sundar IK, Lerner CA, et al. Impaired mitophagy leads to cigarette smoke stress-induced cellular senescence: implications for chronic obstructive pulmonary disease. FASEB J. 2015 Jul;29(7):2912–2929. PMID: 25792665. PMC4478793.
- Alirezaei M, Kiosses WB, Fox HS. Decreased neuronal autophagy in HIV dementia: a mechanism of indirect neurotoxicity. Autophagy. 2008 Oct 4;4(7):963–966. PMID: 18772620. PMC2665179.
- El-Hage N, Rodriguez M, Dever SM, et al. HIV-1 and morphine regulation of autophagy in microglia: limited interactions in the context of HIV-1 infection and opioid abuse. J Virol. 2015 Jan 15;89(2):1024–1035. PMID: 25355898. PMC4300622.
- De Simone FI, Darbinian N, Amini S, et al. HIV-1 Tat and cocaine impair survival of cultured primary neuronal cells via a mitochondrial pathway. J Neuroimmune Pharmacol. 2016 Jun;11(2):358–368. PMID: 27032771. PMC5215880.
- Macho A, Calzado MA, Jimenez-Reina L, et al. Susceptibility of HIV-1-TAT transfected cells to undergo apoptosis. Biochemical mechanisms. Oncogene. 1999 Dec 9;18(52):7543–7551. PMID: 10602513.
- Norman JP, Perry SW, Kasischke KA, et al. HIV-1 trans activator of transcription protein elicits mitochondrial hyperpolarization and respiratory deficit, with dysregulation of complex IV and nicotinamide adenine dinucleotide homeostasis in cortical neurons. J Immunol (Baltimore, Md: 1950). 2007 Jan 15;178(2):869–876. PMID: 17202348.
- Tahrir FG, Shanmughapriya S, Ahooyi TM, et al. Dysregulation of mitochondrial bioenergetics and quality control by HIV-1 Tat in cardiomyocytes. J Cell Physiol. 2018 Feb;233(2):748–758. PMID: 28493473. PMC5673531.
- Mizushima N. Autophagy: process and function. Genes Dev. 2007 Nov 15;21(22):2861–2873. PMID: 18006683.
- Michiorri S, Gelmetti V, Giarda E, et al. The Parkinson-associated protein PINK1 interacts with Beclin1 and promotes autophagy. Cell Death Differ. 2010 Jun;17(6):962–974. PMID: 20057503.
- Cheng Y, Ren X, Hait WN, et al. Therapeutic targeting of autophagy in disease: biology and pharmacology. Pharmacol Rev. 2013 10;65(4):1162–1197. PMID: 23943849. PMC3799234.
- O’Neill LA, Kishton RJ, Rathmell J. A guide to immunometabolism for immunologists. Nat Rev Immunol. 2016 Sep;16(9):553–565. PMID: 27396447. PMC5001910.
- Bordt EA, Polster BM. NADPH oxidase- and mitochondria-derived reactive oxygen species in proinflammatory microglial activation: a bipartisan affair? Free Radic Biol Med. 2014 Nov;76:34–46. PMID: 25091898. PMC4252610.
- West AP, Shadel GS. Mitochondrial DNA in innate immune responses and inflammatory pathology. Nat Rev Immunol. 2017 Jun;17(6):363–375. PMID: 28393922.
- Hui L, Chen X, Haughey NJ, et al. Role of endolysosomes in HIV-1 Tat-induced neurotoxicity. ASN Neuro. 2012 Jun 20;4(4):243–252. PMID: 22591512. PMC3379000.
- Peng J, Vigorito M, Liu X, et al. The HIV-1 transgenic rat as a model for HIV-1 infected individuals on HAART. J Neuroimmunol. 2010 Jan 25;218(1–2):94–101. PMID: 19913921.
- Liao K, Guo M, Niu F, et al. Cocaine-mediated induction of microglial activation involves the ER stress-TLR2 axis. J Neuroinflammation. 2016 Feb 9;13(1):33. PMID: 26860188. PMC4748483.
- Periyasamy P, Liao K, Kook YH, et al. Cocaine-mediated downregulation of miR-124 activates microglia by targeting KLF4 and TLR4 signaling. Mol Neurobiol. 2017 May 6. DOI:10.1007/s12035-017-0584-5. PMID: 28478506. PMC5673594.
- Iuso A, Repp B, Biagosch C, et al. Assessing mitochondrial bioenergetics in isolated mitochondria from various mouse tissues using seahorse XF96 analyzer. Methods Mol Biol (Clifton, NJ). 2017;1567:217–230. PMID: 28276021.
- Jackson WT, Giddings TH Jr., Taylor MP, et al. Subversion of cellular autophagosomal machinery by RNA viruses. PLoS Biol. 2005 May;3(5):e156. PMID: 15884975. PMC1084330.
- Kimura S, Noda T, Yoshimori T. Dissection of the autophagosome maturation process by a novel reporter protein, tandem fluorescent-tagged LC3. Autophagy. 2007 Sep–Oct;3(5):452–460. PMID: 17534139.
- Schneider CA, Rasband WS, Eliceiri KW. NIH image to imagej: 25 years of image analysis. Nat Methods. 2012 Jul;9(7):671–675. PMID: 22930834. PMC5554542.