
ABSTRACT
To explore the anti-inflammatory activity of endogenous produced melatonin, a melatonin-enriched animal model (goat) with AANAT transfer was successfully generated with somatic cell nuclear transfer (SCNT) technology. Basically, a pIRES2-EGFP-AANAT expression vector was constructed and was transferred into the female fetal fibroblast cells (FFCs) via electrotransfection and then the nuclear of the transgenic FFC was transferred to the eggs of the donor goats. The peripheral blood mononuclear cells (PBMCs) of the transgenic offspring expressed significantly higher levels of AANAT and melatonin synthetic function than those PBMCs from the wild-type (WT) animals. After challenge with lipopolysaccharide (LPS), the transgenic PBMCs had increased autophagosomes and LC3B expression while they exhibited suppressed production of the proinflammatory cytokines, IL1B and IL12 (IL12A-IL12B/p70), compared to their WT. The mechanistic analysis indicated that the anti-inflammatory activity of endogenous melatonin was mediated by MTNR1B (melatonin receptor 1B). MTNR1B stimulation activated the MAPK14 signaling pathway to promote cellular macroautophagy/autophagy, thus, suppressing the excessive inflammatory response of cellular. However, when the intact animals challenged with LPS, the serum proinflammatory cytokines were significantly higher in the transgenic goats than that in the WT. The results indicated that endogenous melatonin inhibited the MAPK1/3 signaling pathway and ROS production, subsequently downregulated gene expression of BECN1, ATG5 in PMBCs and then suppressed the autophagy activity of PBMCs and finally elevated levels of serum proinflammatory cytokines in transgenic animals, Herein we provided a novel melatonin-enriched animal model to study the potential effects of endogenously produced melatonin on inflammatory responses and autophagy activity.
Introduction
Melatonin (N-acetyl-5-methoxytryptamine, MT) is a pleiotropic molecule that exhibits multiple physiological functions. These include circadian rhythm regulation, free radical detoxification, immunoenhancement, reproductive modulation and other pharmacological effects [Citation1–Citation5]. Thus, this molecule has important health and nutritional values, especially for elderly people who have the low melatonin levels. As to its health values, many studies have reported that a high level of melatonin in milk has a beneficial effect on sleep and stress [Citation6–Citation10]. This leads to a variety of melatonin-enriched milk or products popular in the market. However, not all of them are natural melatonin products and most of them were fortified with synthetic melatonin. To overcome this shortcoming, in the current study we used the advanced biomolecular methods to generate a transgenic animal model which can produce high level of endogenous melatonin.
A variety of studies have shown that melatonin regulates inflammatory responses [Citation11–Citation13]. Several reports have attributed the anti-inflammatory activity of this molecule to its role as an autophagy regulator either in animals or in plants [Citation14–Citation19]. Whether melatonin-enriched transgenic animals also exhibit regulated autophagy is currently unknown. In the current study, this possibility was also investigated.
To generate high-level melatonin-producing animals, the AANAT (aralkylamine N-acetyltransferase) gene was selected for transfer. AANAT is considered as the rate-limiting enzyme for melatonin biosynthesis in organisms [Citation20,Citation21]. The molecular structure of AANAT has been well documented. AANAT in goats localizes on chromosome 19 (NC_030826.1) with 624 base pairs (bp) encoding 207 amino acids. AANAT transgenic plants have been frequently reported recently. For example, Okazaki et al. [Citation22] have cloned a cDNA sequence of AANAT from Chlamydomonas reinhardtii and this AANAT has been transferred to ‘Micro-Tom’ tomato, which leads to production of high melatonin content in this plant. Kang et al. [Citation23] have cloned human AANAT and have transferred it to rice plants. The transgenic rice seedlings have a high level of melatonin and have elevated chlorophyll synthesis during cold stress, suggesting a role for melatonin in cold-stress resistance. Wang et al. [Citation24] have overexpressed ovine AANAT in ‘Micro-Tom’ tomato. These transgenic plants have a high melatonin and low indoleacetic acid content compared to the WT. In contrast, few AANAT transgenic livestock have been reported, except for a study by our group [Citation25]. In the current study, we used state-of-the-art methodologies to develop AANAT transgenic dairy goats and investigated the impact of AANAT transgenes on the anti-inflammatory activity of the animals.
The advanced technologies used here include pronuclear microinjection [Citation26–Citation29], somatic cell nuclear transfer (SCNT) [Citation30–Citation35], and the use of a viral vector [Citation36–Citation38]. Each of these methods has its advantages and disadvantages. For example, with the use of pronuclear microinjection, only a small proportion (~ 5%) or even lower of animals integrated the transgene DNA into their genome and it is easy to form chimeric animals [Citation26,Citation29,Citation39,Citation40]. The low efficiency and high costs are the major drawbacks of pronuclear microinjection. As to the viral vector technology safety is a major concern [Citation36–Citation38]. Among these methods, SCNT seems to be an optimal choice for producing transgenic livestock at present. It has been successfully used to produce transgenic cattle [Citation30,Citation41], sheep [Citation42], goats [Citation33,Citation43], pigs [Citation32,Citation44], and cats [Citation45,Citation46]. In SCNT, fetal fibroblast cells (FFCs) are the preferred donor, as they are easy to culture, grow fast and have a high efficiency for genetic modification [Citation30,Citation33]. The use of recombinant somatic cell lines for nuclear transfer allows the introduction of transgenes and leads to transgenic efficiency up to 100% [Citation33]. In addition, compared with in vivo embryo, the embryos produced in vitro are exposed to a relative ‘hypoxic’ environment [Citation47]. Therefore, melatonin was added in the culture medium to improve the embryo quality. Many studies reported that the melatonin has beneficial effects on embryo development in various mammalian species including bovine [Citation48–Citation50], murine [Citation51–Citation53], porcine [Citation54,Citation55] and ovine [Citation56]. For example, melatonin (10−10 M) significantly increases the cleavage and blastocyst rates of porcine SCNT embryos [Citation55] and melatonin at the range of 10−12–10−9 M enhances the development of porcine cloned embryos and improves embryo quality [Citation57]. Similar results have been observed by Su et al. [Citation58]. They report that melatonin treatment of bovine SCNT embryos significantly improves the developmental competence and enhances blastocyst quality, ultimately improving bovine cloning efficiency. In our study, the combination of SCNT technology and melatonin supplementation was applied for the first time to develop AANAT transgenic dairy goats.
Melatonin regulates inflammation and immune function acting as an immunostimulantor under basal conditions and as an anti-inflammatory agent in the presence of an exacerbated immune response [Citation11–Citation13], Melatonin affects the differentiation and function of effector and regulatory T cells both in vitro and in vivo [Citation59]. The influence of melatonin in immune cell biology is associated with its membrane and nuclear receptors as well as receptor-independent pathways [Citation60]. By modulation of immune cell responses, melatonin exerts beneficial effects in various inflammatory diseases [Citation60].
A crucial role of autophagy in the regulation of inflammatory processes has been revealed recently [Citation61–Citation63]. Evidence indicated the mutual relationships between autophagy and inflammasomes: 1) autophagy negatively regulates inflammasome activation; 2) autophagy plays a role in the biogenesis and secretion of the proinflammatory cytokine, IL1B (interleukin 1 beta) [Citation61,Citation64–Citation66]. The increased evidence shows that autophagy is involved in the fine control of inflammatory responses to prevent potential damage and pathogenic stimuli [Citation67]. A few studies show melatonin’s regulatory effects on autophagy [Citation14–Citation19]. Some report that melatonin alleviates the inflammatory diseases by reducing the level of autophagy [Citation68,Citation69]; while others report that melatonin elevates autophagy resulting in amelioration of symptoms [Citation14–Citation17] depending on the experimental models as well as the in vivo and in vitro conditions. Thus, the underlying molecular mechanisms require more research. Herein, a transgenic melatonin-enriched animal model was created and its influence on autophagy was thoroughly investigated in the in vitro and in vivo conditions.
Results
The cloning of the AANAT gene and construction of the expression vector
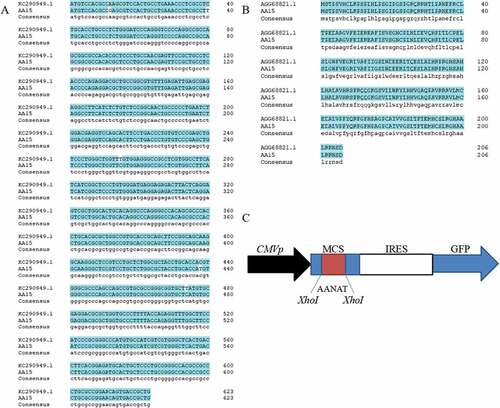
The sequenced AANAT was blasted with the NCBI sequence which showed shared nucleotide sequence homology of 99.84% ()), and an amino acid sequence homology of 100% [)]. The correct PCR products were digested with XhoI and cloned into pIRES2-EGFP for constructing the expression vector ()).
Figure 1. Blast result of the cloned AANAT gene and pIRES2-EGFP-AANAT expression vector construction. (A) The nucleic acid sequence of AANAT gene blasted with NCBI reference sequence; (B) Amino acid sequence alignment; (C) Construction of the pIRES2-EGFP-AANAT expression vector.
Preparation of AANAT transgenic ffcs as donor cells for SCNT
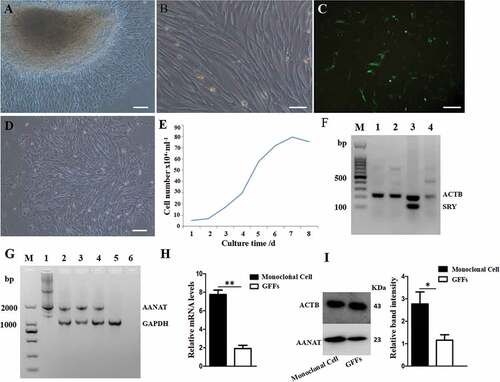
Two fetal fibroblast cell (FFC) lines from Laso-shan dairy goats (Capra hircus) were established by using the attaching tissue explant culture method (). A polymerase chain reaction (PCR) revealed that both of them were female ()). The growth curve analysis showed that the cells had a typical ‘S’ shape growth curve ()) and indicated that these cells are suitable as transgenic donors. The logarithmic growth phase of FFCs reached 80% positive rate at 48 h after electrotransfection ()). Via G418-resistant selection culture, 3 monoclonal transgenic cell lines were selected with identification at the DNA level (). Analysis showed that mRNA and protein expression of AANAT in the No. 6 of the monoclonal cells was significantly increased compared to the nontransgenic FFCs (,i)).
Figure 2. Preparation of AANAT transgenic FFCs as donor cells for SCNT. (A and B) Photos of cultured FFCs using attaching tissue explants method. (A) Cells grew out from tissue explants, scale bars: 50 μm. (B) Passaged FFCs, scale bars: 200 μm. (C) Positive rate of FFCs at 48 h after electrotransfection, scale bars: 200 μm. (D) Selected positive monocolonal cells, scale bars: 50 μm. (E) The ‘S’ shape of growth curve. (F) The SRY-PCR sex analysis of the 2 fetuses. M, Marker; 1and 2, fetus; 3, known male goat; 4, known female goat. (G) Positive monocolonal cell identification. M, Marker; 1, pIRES2-EGFP-AANAT expression vector; 2, the No. 4 monoclonal cells; 3, the No. 6 monoclonal cells; 4, the No. 7 monoclonal cells; 5, the nontransgenic FFCs; 6, blank control. (H) qRT-PCR analysis of the AANAT expression quantity of the No. 6 monoclonal cells. (I) Western blot analysis of the AANAT expression quantity of the No. 6 monoclonal cells. ‘*’Represents significant differences, P < 0.05; ‘**’represents highly significant differences, P < 0.01. The same applies to the following figures.
The production of transgenic goats overexpressing AANAT
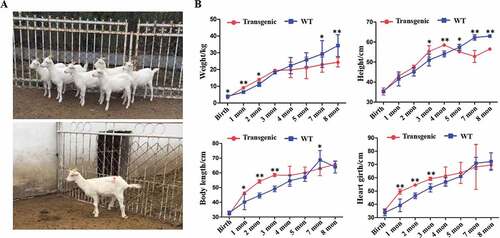
472 MII oocytes from 33 goat donors by multiple ovulations were collected, in which the qualified oocytes were 97.88% (462/472). The SCNT enucleating rate was 95.02% (439/462) and fusion rate was 84.90% (371/437). Half of the fused embryos were treated with melatonin and half without melatonin. The pregnancy and lambing rates in the melatonin-treated group were significantly increased compared with the control group, 37.5% vs. 6.25%, (P < 0.05) and 50% vs. 0, (P < 0.01), respectively (). Seven transgenic goats survived ()). The weight and growth parameters were measured every month. The results indicated that the transgenic goats grew faster compared with the WT in the first few months based on the body weight, body length and chest girth parameters; however, these differences disappeared with time ()).
Table 1. The effect of melatonin on SCNT efficiency.
Figure 3. General conditions of the goats. (A) Photo of the 7 transgenic cloned goats. (B) The weight and growth rate of the animals.
Identification of transgenic offspring
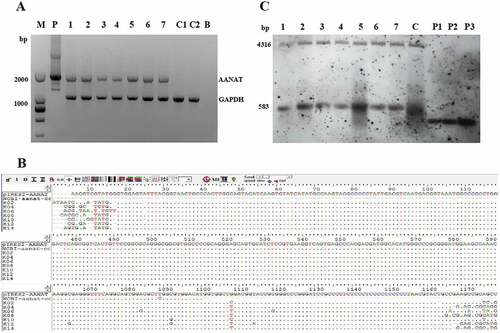
PCR-sequencing and Southern blot analysis demonstrated that all the 7 goats were AANAT transgenic-positive (. The use of 2 restriction enzymes, BamHI and HindIII, resulted in a 583-bp exogenous fragment and a 4316-bp endogenous fragment, with Southern blot analysis.
Figure 4. PCR-Sequencing and Southern blot analysis of transgenic goats. (A) The results from agarose gel electrophoresis of the PCR products. M, Marker; P, pIRES2-EGFP-AANAT; 1 to 7, 7 transgenic goats, respectively; C1 and C2, 2 negative control animals, respectively; B, Blank. (B) Sequenced and blasted results. (C) Southern blot analysis. 1 to 7, 7 transgenic goats, respectively; C, negative control; P1, pIRES2-EGFP-AANAT one copy; P2, pIRES2-EGFP-AANAT 2 copies; P3, pIRES2-EGFP-AANAT 3 copies.
The AANAT expression and serum melatonin level in transgenic offspring
The relative AANAT expression levels of pineal gland, uterus, mammary gland, ovary and liver of the transgenic goat were analyzed by qRT-PCR, respectively. The results showed that AANAT expression in theses organs were significantly elevated compared to the WT, except liver ()). The AANAT protein expression levels exhibited a similar tendency ()). Accordingly, the serum melatonin levels in transgenic goats also significantly increased compared to the WT (388.1 ± 75.18 vs. 167.4 ± 31.58 pg/mL, ()).
Figure 5. The levels of AANAT expression and serum melatonin in transgenic goats compared to the WT. (A) mRNA expression. (B) Protein levels. (C) Serum melatonin.
In PBMCs, in vitro synthesized melatonin can reduce the level of the proinflammatory factors induced by LPS
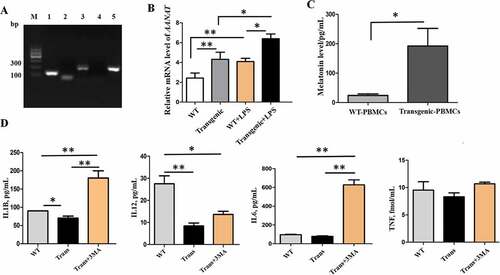
Semiquantitative RT-PCR analysis showed that peripheral blood mononuclear cells (PBMCs) expressed AANAT, ASMT and MTNR1B ()). qRT-PCR analysis indicated that the relative AANAT expression level was significantly higher in the transgenic PBMCs than that in the WT. In addition, the AANAT expression was further upregulated by LPS stimulation in the transgenic PBMCs ()). The melatonin synthetic function in the transgenic PBMCs was significantly higher than that in the WT when 5-hydroxytryptamine, a precursor of melatonin was added in the culture medium ()). In contrast, the concentrations of the proinflammatory factors were significantly lower in the transgenic goats than that in the WT with the LPS stimulation ()). To identify whether the anti-inflammatory effects were related to the process of autophagy, an autophagy inhibitor, 3-methyladenine (3-MA), was added into the PBMCs culture medium. It was observed that the suppressive effects of transgenic PBMCs on proinflammatory cytokines IL1B, IL6 and IL12 (IL12A-IL12B/p70) were significantly blunted; however, no effect was observed on TNF (tumor necrosis factor) ()).
Figure 6. The AANAT, ASMT and MTNR1B expression, levels of melatonin and proinflammatory cytokines in the PBMCs. (A) A representative gel of AANAT, ASMT and MTNR1B genes (M, Marker; 1, ACTB; 2, AANAT; 3, ASMT; 4, MTNR1A; 5, MTNR1B. (B) AANAT expression in transgenic and wild-type goats treated with or without LPS. (C) Melatonin level in the transgenic and wild-type goat PBMCs. (D) IL1B, IL12, IL6 and TNF levels in wild-type, transgenic goat and transgenic goat treated with 3MA.
Melatonin decreases inflammatory cytokines of pbmcs in vitro by increasing autophagy activity
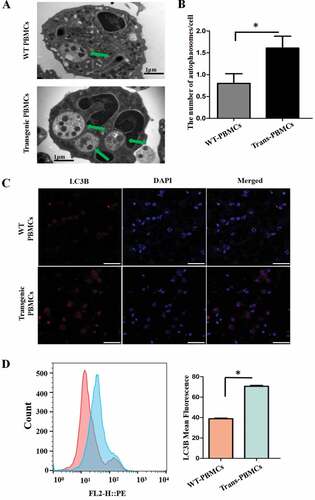
The autophagosomes in transgenic PBMCs were also significantly increased compared to the WT (. In addition, the protein levels of the autophagosomal marker MAP1LC3B/LC3B (microtubule associated protein 1 light chain 3 beta) in the transgenic PBMCs were also significantly increased compared to the WT ().
Figure 7. The autophagy indices in PBMCs. (A) Electron microscopy images of autophagosomes (green arrows point to autophagosomes); scale bars: 1 µm. (B) Statistical analysis of autophagosomes. (C) Immunofluorescence staining images of LC3B in the different treatments; scale bars: 50 µm. (D) Immunofluorescence staining of LC3B was measured with flow cytometry analysis.
Melatonin activated the mapk14/p38 signaling pathway to promote cellular autophagy to suppress the inflammatory response in vitro
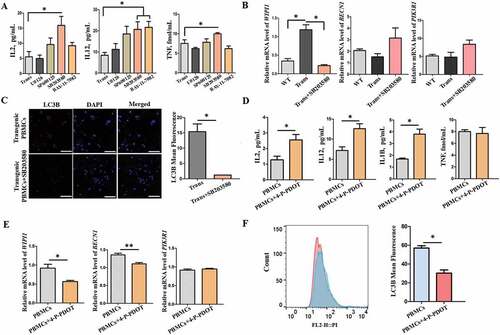
Mechanical analysis indicated that the mitogen-activated protein kinase (MAPK) and NFKB (nuclear factor kappa B)-related signaling pathways were involved the autophagy process. When SB203580, a specific inhibitor of MAPK14/p38 was added into the culture medium, IL2, IL12 (IL12A-IL12B/p70) and TNF were significantly increased in the transgenic PBMCs ()). In contrast, U0126, a specific inhibitor of MAPK1/ERK2-MAPK3/ERK1, SP600125, a specific inhibitor of MAPK8/JNK1-MAPK9/JNK2 and BAY 11–7082, a specific inhibitor of NFKBIA/IκBα, failed to alter the proinflammatory cytokines ()). qRT-PCR analysis also showed the relative expression level of WIPI1 and BECN1 was significantly downregulated by SB203580, whereas SB203580 did not influence the expression of PIK3R1 (phosphoinositide-3-kinase regulatory subunit 1) ()). Immunofluorescence staining indicated that LC3B was significantly reduced by SB203580 treatment in transgenic PBMCs ()). Blocking MTNR1B with its specific inhibitor 4-P-PDOT also resulted in a significant rise in the levels of IL1B, IL2 and IL12 (IL12A-IL12B/p70) but not TNF ()) and downregulation of the expression of WIPI1, BECN1 ()), and LC3B ()) in transgenic PBMCs. The results were similar to the SB203580 treatment.
Figure 8. The proinflammatory cytokines and autophagy levels in the PBMCs after adding different inhibitors. (A) The concentration of IL2, IL12, and TNF. (B) qRT-PCR analysis of autophagy-associated genes WIPI1, BECN1 and PIK3R1 in the PBMCs. (C) Immunofluorescence staining images of LC3B; scale bars: 50 μm. (D) The concentration of IL1B, IL2, IL12 and TNF with 4-P-PDOT. (E) WIPI1, BECN1 and PIK3R1 with 4-P-PDOT. (F) Immunofluorescence staining of LC3B with flow cytometry analysis after adding 4-P-PDOT.
Melatonin participates in inflammatory regulation by reducing autophagy of pbmcs in vivo
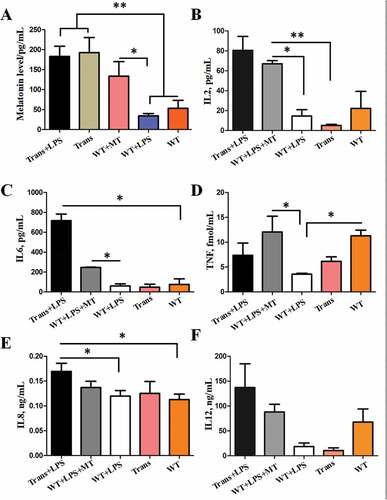
To confirm the results from cell culture, the in vivo studies were also performed. It was confirmed that the transgenic goats had a significantly higher level of blood melatonin than that of in WT. Also, a melatonin dose was selected to treat the WT to induce the similar melatonin level as in the transgenic goats ()). All these animals were treated with LPS to induce the inflammatory response. It was observed that the serum proinflammatory cytokines including TNF, IL2,IL6 and IL8 were significantly suppressed by LPS in WT. In contrast, these cytokines were significantly elevated in transgenic and WT plus melatonin-treated goats ().
Figure 9. The serum proinflammatory cytokines and melatonin level in wild-type and transgenic goats treated with or without LPS or LPS+ MT. (A) Melatonin levels. (B) IL2 levels. (C) IL6 levels. (D) TNF levels. (E) IL8 levels. (F) IL12 (IL12A-IL12B/p70) levels. MT, melatonin; Trans, transgenic goats; WT, wild-type goats.
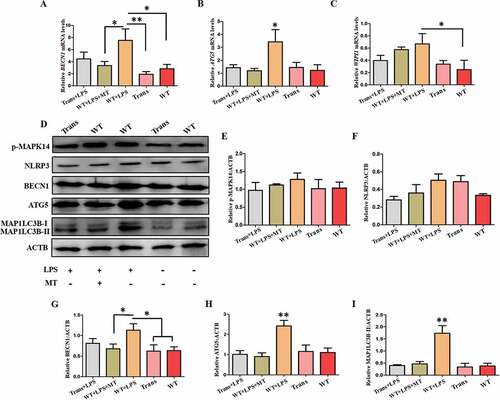
PBMCs were isolated from the goats with different treatments. qRT-PCR analysis showed that the relative mRNA expression levels of BECN1, ATG5 and WIPI1 in PBMCs obtained from WT goats treated with LPS was significantly upregulated when compared to WT. However, the expression of these autophagy-related genes in PBMCs from transgenic as well as melatonin-treated WT animals with LPS treatment were significantly lower than that from WT treated with LPS (). Their protein expressions exhibited the similar patterns (,h)). Interestingly, p-MAPK14/p38 and NLRP3 had no significant difference among the groups. This finding indicated that the regulatory mechanism of autophagy in the in vivo condition was not mediated by the MAPK14/p38 signaling pathway.
Figure 10. The autophagy level of the PBMCs from wild-type and transgenic goats treated with or without LPS/LPS+ MT. (A to C) Expression of BECN1, ATG5 and WIPI1 in the PBMCs. (D) Protein levels of BECN1, ATG5, LC3B, p-MAPK14/p38 and NLRP3. (E to I) Statistical analysis of protein levels.
Proteogenomic analysis of the in vivo effect of melatonin on lps-treated pbmcs
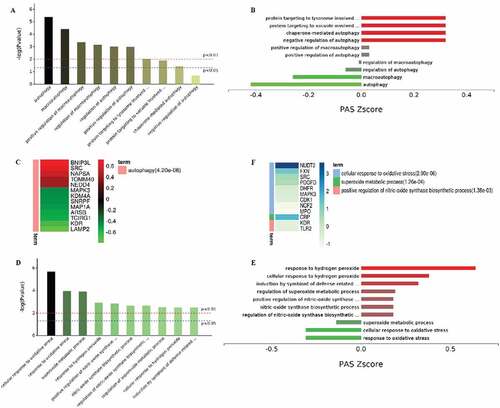
Proteogenomic analysis showed that in the PBMCs, 51 proteins were upregulated and 134 proteins were downregulated in LPS-treated transgenic goats compared with the LPS-treated WT ()). GO terms of Biological process (1491), Cell Component (190), and Molecular function (182) have been significantly enriched and also there were 26 significant different KEGG pathways (). By analysis of autophagy-related proteins of GO terms, it was found that some autophagy-related proteins in the transgenic PBMCs were significantly decreased. These included autophagy marker proteins and key proteins involved in lysosome formation, MAP1A (microtubule associated protein 1A) and LAMP2 (lysosomal associated membrane protein 2), respectively. While, MAPK1/3 in PBMCs from LPS-treated transgenic animals was also significantly reduced (). In addition, the oxidative stress-related proteins were analyzed and it was found that the transgenic PBMCs with elevated melatonin levels significantly promoted cellular responses to oxidative stress to upregulate the expression of intracellular peroxide metabolism related protein as well as other anti-oxidant proteins ().
Figure 11. Proteogenomic analysis. (A) Expression of proteins in PBMCs from LPS-treated transgenic and WT goats. (B) The number of GO terms and KEGG-enriched pathways. (C) Protein expression in GO terms (fold change> 1.3).
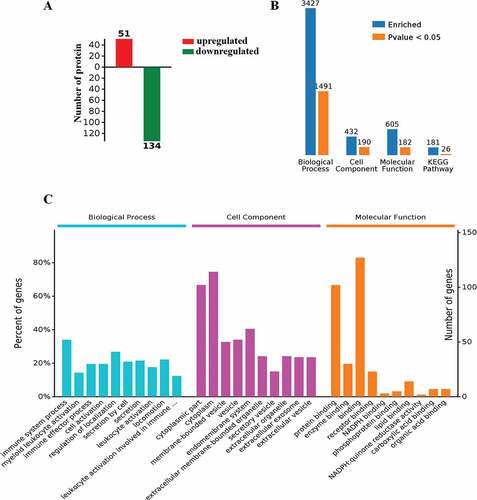
Figure 12. Functional analysis of the PBMCs from LPS-treated transgenic and WT goats. (A) Autophagy-related GO terms. (B) Autophagy-related GO terms. Red, upregulation; green, downregulation (Trans vs WT). (C) The expression of autophagy-related proteins. Red, upregulation; green, downregulation (Trans vs WT). (D) Oxidative stress-related GO terms. (E) Oxidative stress-related GO terms. Red, upregulation; green, downregulation. (F) The expression of oxidative stress-related proteins. Red, upregulation; green, downregulation (Trans vs WT).
Discussion
Melatonin, as a ubiquitous molecule, acts on cells, tissues and organs of organisms. It is a potent free radical scavenger and antioxidant. It enhances the immunoresponse, regulates reproductive activity and also modulates other physiological and pharmacological aspects [Citation1–Citation5]. The anti-inflammatory activity of melatonin has drawn great attention from researchers recently. Due to the reason that many health problems related to chronic inflammation to varying degrees. These include Alzheimer disease [Citation70,Citation71], heart disease [Citation72,Citation73], diabetes [Citation68,Citation74] and cancer [Citation75,Citation76]. A variety of studies have documented the anti-inflammatory effects of melatonin treatment in animals or patients [Citation77–Citation79]. However, few studies have documented anti-inflammatory activity of the endogenously produced melatonin. To achieve this goal, the melatonin-enriched animal model is necessary. A best way is probably via AANAT transgenes because AANAT is the rate limiting enzyme for melatonin synthesis. Many melatonin-enriched AANAT transgenic plants have been developed and the beneficial effects on these plants have also been reported [Citation22–Citation24,Citation80]. In mammals, few AANAT transgenic models have been reported except for one by Ma et al. [Citation25]. Compared to the plants, transgenic animals are complex and difficult to be developed. In the current study, by use of the state of the art methodologies, the AANAT transgenic goats were successfully developed. Simply, FFCs were selected as the nuclei donors and SCNT was used to transfer the AANAT into the genome of the animals. At the end, 7 clone goats with AANAT overexpression were obtained and the transgenic positive rate was 100%. The phenotypes of these animals are completely normal ()) during the period of the observation and the AANAT was stably expressed. For example, the AANAT expression in the pineal gland, uterus, mammary gland and ovary in the transgenic goats was significantly upregulated compared to the WT (,b)). This was also the case in their melatonin levels ()).
As mentioned previously, melatonin is a potent anti-inflammatory agent. Its anti-inflammatory effects may be mediated via the NFKB pathway [Citation81] or via suppression of the endoplasmic reticulum stress in cells and animal models [Citation79]. In addition, melatonin also stimulates or suppresses autophagy to produce its anti-inflammatory activity depending on the conditions [Citation14–Citation17,Citation68,Citation69,Citation79]. Thus, for the first time, the anti-inflammatory responses as well as the potential mechanisms were systemically studied in different levels of cells as well as and in intact transgenic animals. A high expression level of AANAT was detected in the transgenic PBMCs and these cells per se produced much more melatonin than their counterparts of WT cells. Under LPS incubation the transgenic PBMCs had significantly lower proinflammatory cytokines IL1B and IL12 (IL12A-IL12B/p70) than those of WT cells ()). This indicated that AANAT transgenic PBMCs have gained an additional capacity to response to the inflammatory reaction at the cellular level. This is important because excessive inflammatory reaction usually results in organ and tissue injuries [Citation82–Citation85]. It is well known that the autophagy pathway plays a crucial role for the inflammation [Citation61–Citation63]. Evidence showed melatonin could enhance autophagy in different disease models [Citation14,Citation86,Citation87]. This was confirmed in the PBMCs. When the autophagy inhibitor 3-MA was added into the medium, the suppressive effects of transgenic PBMCs on IL1B, IL6 and IL12 (IL12A-IL12B/p70) were diminished ()). In addition, several autophagy-related genes were selected as the indices of cellular autophagy in the study. These included WIPI1, BECN1, and LC3B. Due to its reliablility and stability, WIPI1 is a common marker of autophagy analyzed by the qRT-PCR method [Citation88,Citation89]. BECN1, a protein essential for autophagy, acts in cooperation with the PtdIns3K pathway to enhance the formation of the autophagic vacuole [Citation90,Citation91] and LC3B, one isoform of LC3 (a marker of autophagosomes), is most widely used [Citation92] and associated with phagophores [Citation93] (the precursor to the autophagosome). All of these genes were upregulated in transgenic PBMCs ()). It was reported that melatonin regulated the autophagy pathway probably via SIRT1 signaling [Citation16], NFE2L2/Nrf2 activation [Citation94] or MTOR (mechanistic target of rapamycin kinase) [Citation95]. However, we found that this was mediated via MAPK signaling pathways. In the study, a specific inhibitor of MAPK14/p38 (SB203580), was used and the inhibitory effects of the transgenic PBMCs on LPS induced IL2, IL12 (IL12A-IL12B/p70) and TNF were blunted, accordantly the relative expression levels of WIPI1, BECN1 and LC3B were significantly reduced with the SB203580 treatment (). The activation of the MAPK14/p38 signaling pathway is mediated by MTNR1B (melatonin receptor 1B). MTNR1B but not MTNR1A was identified in PBMCs ()) and MTNR1B-specific inhibitor, 4-P-PDOT, blocked the anti-inflammatory activity, autophagy as well as the MAPK signaling in transgenic PBMCs.
To confirm these observations in the in vivo condition, the transgenic animals as well as their WT counterparts were treated with LPS or melatonin. We observed that the transgenic and the WT goats with melatonin treatment after LPS injection exhibited better general health than that of WT goats treated with LPS. The body temperature in WT goats treated with LPS obviously increased, they ate and drank little and always lied on front and were spirits atrophy. The serum proinflammatory cytokines in transgenic and in melatonin-treated goats after LPS challenge were significantly higher than in the LPS-challenged WT (). The autophagy activity in the PBMCs from transgenic and melatonin-treated goats were suppressed by the LPS treatment rather than increased. We realized that the PBMCs treated with LPS and the PBMCs obtained from LPS-challenged animals experienced completely different microenvironments and it is reasonable that they may have different responses to the stress. We speculated that it was the high levels of serum proinflammatory cytokines which suppressed autophagy activity of PBMCs obtained from LPS-challenged transgenic animals. It has been reported that proinflammatory cytokines suppress autophagy activity [Citation96–Citation98] and several reports also report that melatonin elevates serum levels of some proinflammatory cytokines [Citation99,Citation100]. However, the exact mechanisms are currently unknown. This will be the subject of our future research.
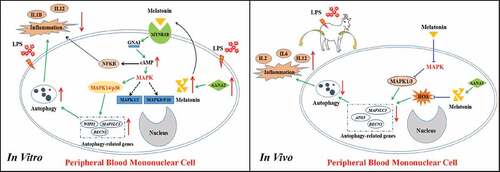
In summary, in the current study, using advanced technologies, we generated a melatonin-enriched transgenic animal model and this model was used to examine the anti-inflammatory effects of endogenously produced melatonin. It was found in the cellular level, LPS promoted autophagy activity of the transgenic PBMCs, In contrast, in the intact goats, the LPS challenge suppressed the autophagy activity of transgenic PBMCs. These observations explained the different activities of melatonin on autophagy reported by literature. Even though the exact mechanisms are unknown. Based on the results, we speculated that anti-inflammatory activity of endogenously produced melatonin were illustrated in .
Figure 13. The proposed pathway of the effects of melatonin on inflammation and autophagy in the in vitro and in vivo conditions. ATG, autophagy-related; BECN1/BECLIN1, beclin 1, MAPK1/3, mitogen-activated protein kinase 1/3; MAPK, mitogen-activated protein kinase; IL1B, interleukin 1 beta; IL2, interleukin 2; IL6, interleukin 6; IL12, interleukin 12 (IL12A-IL12B/p70), LPS, lipopolysaccharide; MAP1LC3B/LC3B, microtubule associated protein 1 light chain 3 beta; MAPK14/p38, mitogen-activated protein kinase 14; melatonin, N-acetyl-5-methoxytryptamine; MTNR1B, melatonin receptor 1B; NFKB, nuclear factor kappa B; ROS, reactive oxygen species; WIPI1, WD repeat domain, phosphoinositide interacting 1.
Materials and methods
Animals
All animal experiments and treatments were approved and supervised by the Animal Welfare Committee of China Agricultural University (Permit Number: XK662).
Expression vector construction of the AANAT gene
The construction of the pIRES2-EGFP-AANAT vector was performed as follows: In brief, total RNA was extracted from the pineal gland of Ovis aries using the TRIzol Reagent (Invitrogen, 15,596,018) and was immediately used for cDNA synthesis with a first-strand cDNA synthesis kit (TaKaRa, RR047) according to the manufacturer’s instructions. The complete open reading frames (ORFs) and partial up- and downstream noncoding regions of the AANAT gene were amplified using the PhantaTM Super-Fidelity DNA Polymerase (Vazyme, P501). The PCR products were subcloned into the pMDTM19-T vector (TaKaRa, 6013) and sequenced following the manufacturer’s instructions. The specific primers, which were designed by Primer Premier 5.0 software, were added the same restriction sites XhoI according to the sequences of AANAT (mRNA KC290949.1). The primers contained XhoI restriction enzyme site, Forward: 5ʹ CCGCTCGAGCCACCATGTCCACGCCAAGC 3ʹ;
Reverse: 5ʹ CCGCTCGAGCCACCTCAGCGGTCACTGTT 3ʹ. The expression vector pIRES2-EGFP was used as a backbone for preparation of gene constructs. AANAT which checked by sequencing was exited from the T-vector by XhoI and subsequently cloned into pIRES2-EGFP for construction. The recombinant vector was referred to as pIRES2-EGFP-AANAT.
Donor cell preparation
Fetal fibroblast cell lines were isolated from 2 Laso-shan dairy goat (Capra hircus) fetuses on day 40 of gestation using attaching tissue explants method. Simply, the trunk of the fetus was washed thrice with PBS (MacGene Biotech, CC008) containing 500 IU/mL penicillin-streptomycin (Sigma-Aldrich, P7794 and S1277). The tissues were cut into fine pieces (approximately 1 mm3) and cultured in 60-mm Petri dishes with 1 mL of DMEM/F12 (Life Technologies, 12,400) supplemented with 30% (v:v) fetal bovine serum (FBS, Life Technologies, 10,099) at 38.5℃ in a humidified atmosphere of 5% CO2. After 12 h we replenished 5 mL with DMEM/F12 supplemented with 10% (v:v) FBS. The medium was changed every 3 days. Once the culture was approximately 80% confluent, cells were trypsinized and the purified FFCs were frozen stored in liquid nitrogen for future use.
Prior to use, the cells were thawed and cultured. Some of them were used for sex analysis by the sex-determined region of Y-chromosome (SRY)-polymerase chain reaction (PCR). The specific primers are in . ACTB served as housekeeping gene. PCR products were resolved in 1.5% agarose gel for electrophoresis analysis. Some of them were used for growth curve analysis. The cells at the logarithmic growth phase were cultured in a 24-well culture plate at a density of 2 × 10⁴ cells/well. Cell density was measured every 24 h and plotted.
Table 2. Primers for SRY identification.
The remainder of the cells were used for electrotransfection. The cells at the logarithmic growth phase were trypsinized and the constructed AANAT plasmids were electrotransfected into the cells using an electrotransfer apparatus (Nucleofector II, Lonza, Koln, Germany) following the manufacturer’s instructions. The transfected cells were cultured in DMEM/F12 containing 15% (v:v) FBS for 48 h, then GFP expression (LX71; Olympus, Kawasaki, Japan) and statistical transfection efficiency were evaluated. We selected the monoclonal cells and assessed their DNA, mRNA and protein levels. Finally, AANAT positive monoclonal cells served as donor cells.
Superovulation and oocyte collection
The goats with a body weight of 40 ± 4.5 kg were selected and were primed with progesterone using a controlled internal drug release (CIDR) device, which contains 300 mg progesterone (EAZI-BREED®CIDR® Sheep and Goat Device Pfizer Animal Health, New Zealand). The superovulation was carried for the donor goats by injecting 6 times a dosage of 240 IU of follicle-stimulating hormone (Ning-bo Hormone Products CO., LTD, 110,044,648), every 12 h. The injections were initiated at 60 h before the CIDR was removed. Intramuscular injection of 0.1 mg prostaglandin (PG; Ning-bo Hormone Products CO., LTD, 110,041,439) was given at the time of CIDR removal and intramuscular injection of 100 IU luteinizing hormone (Ning-bo Hormone Products CO., LTD, 110,044,634) was given after a 38 h CIDR withdrawal to induce ovulation of the goats. CIDRs in recipients were removed at the same time that the donor’s CIDR were withdrawn and then recipients were injected with a single dose of 250 IU pregnant mare serum gonadotropin (Ning-bo Hormone Products CO., LTD, 110,044,564). At the time of 12 h after CIDR withdrawal, all donors and recipients were exposed to a vasectomized ram for a 6-h interval to detect their estrous onset.
All goats were deprived of food for 12 h before oocyte collection to facilitate surgery and reduce postoperative intestinal adhesions. A medial ventral incision was made to expose the reproductive tract and an ovulatory response was verified by laparoscopy. The goats that displayed corpora lutea were classified as responsive to superovulation treatment and were selected for oocyte collection, which carried at 62 h after CIDR removal. The oocytes were collected by oviduct flushing with a cannula that attached to a syringe and inserted into the lumen near the uterotubal junction. The oviduct was flushed with 20 mL of a warm solution (PBS+ 0.3% BSA) (Fraktion, 735,078; Sigma-Aldrich, A3311). The flush was observed with a stereomicroscope (SZ61; Olympus, Kawasaki, Japan) to search for oocytes at magnifications of 10 to 40. Next, the ova were transfer into holding medium (Immuno-Chemical Products Ltd., 160,118) and qualitatively evaluated with an inverted microscope (LX71; Olympus, Kawasaki, Japan). The number of corpora lutea and the total number of recovered oocytes were recorded for each goat.
Somatic cell nuclear transfer and pregnancy diagnosis
The qualified oocytes in the holding medium were transferred to TCM199 (with Earle salts; Gibco/Life Technologies Inc., 12,340). Then the oocytes with cumulus cells were incubated in TCM199 supplemented with 0.1% hyaluronidase (Sigma-Aldrich, H3506) for 5 min and the cumulus cells were removed by gently pipetting. The denuded oocytes were incubated in TCM199 containing 5 µg/mL Hoechst 33,342 (Sigma-Aldrich, 14,533) and 5 µg/mL cytochalasin B (Sigma-Aldrich, C6762) for 10 min. The first polar body and chromatin plate were removed with an enucleation needle mounted on the micromanipulators (Narishige, MMN-1, Tokyo, Japan) under an inverted fluorescence microscope (Nikon, C.SHG1, Tokyo, Japan). Successful enucleation oocytes were served as the nuclear transplant recipient cytoplasms. AANAT transgenic-positive cells were then trypsinized serving as the donor cells. An intact donor cell was then injected into the perivitelline space and led it to contact with the recipient cytoplasm using micromanipulation. Cytoplast-cell couplets were equilibrated in electrical fusion solution and were transferred to an electrofusion chamber containing the same medium. Cell fusion was induced by applying 2 direct current pulses of 2.0 kV/cm for 25 µs using an ECM2001 Electrocell Manipulator (BTX Inc., San Diego, CA, USA). Couplets were removed from the fusion chamber, washed, and incubated in TCM199 supplemented with 10% (v:v) FBS at 38.5℃ in a humidified atmosphere of 5% CO2. At 30 min after electrofusion, couplets’ fusion status was evaluated. If the fusion was not completed between the couplet the second electrofusion would be applied. The fused embryos were then incubated in TCM199 containing 10 µg/mL cycloheximide (Sigma-Aldrich, C7698) for 5 min, and were transferred into TCM199 containing 5 µg/mL cytochalasin B for incubation for 5 h. The activated embryos were incubated in TCM199 containing 10% (v:v) FBS supplemented with or without 10−7 M melatonin at 38.5°C in a humidified atmosphere of 5% CO2 overnight. These embryos were transplanted into the oviduct of the recipients. The recipients’ pregnancy status was assessed by ultrasonography 60 days after embryo transfer (ET).
Pcr-sequencing and southern blot identification of the transgenic cloned offspring
Genomic DNA was extracted from ears of the offspring to determine their transgenic status. The target gene and marker gene were analyzed by Genome PCR. The specific primers () were designed by Primer Premier 5.0 software. Products were sequenced by Sangon biotech, Beijing, and blasted in Gene Bank database.
Table 3. Primers for transgenic offspring identification.
Southern blotting was performed with the DIG High Prime DNA Labeling and DetectionStarter kit II (Roche, Inc., Pleasanton, CA, 11,585,614,910) under the manufacturer’s instruction as further detection. The probe was generated by PCR amplification with the following primer pair, forward: 5ʹ-TCCCTGCCAACGAGTTCCGCT-3ʹ; reverse: 5ʹ-CAGTGCATCTCCGTGAAGGTC-3ʹ, resulting in a 583-bp exogenous fragment and a 4316-bp endogenous fragment. Genomic DNA was digested by restriction enzyme BamHI (NEB, R0136) and HindIII (NEB, R0104).
Semiquantitative RT-PCR and real-time quantitative RT-PCR analysis
Total RNA was isolated with TRIzol reagent and was immediately reverse-transcribed using Prime Script™ RT reagent Kit with gDNA Eraser (TaKaRa Bio Inc., RR047). The abundance of AANAT, WIPI1, BECN1, ATG5 and PIK3R1 mRNA molecules was measured by qRT-PCR using the SYBR Green I Master (Roche, LightCycler 480, 20,033,920) on the CFX96 Touch apparatus (Bio-Rad, CA, USA). Semiquantitative RT-PCR analysis identified whether the AANAT, ASMT, MTNR1A and MTNR1B genes were expressed in the transgenic animals. ACTB was used as housekeeping gene. The primers are showed in . Relative mRNA expression was calculated by the 2−ΔΔCT method. The semiquantitative RT-PCR products were resolved in a 2.0% agarose gel for an electrophoresis analysis.
Table 4. Primers for qRT-PCR.
Western blotting
Cells or tissues were lysed with a lysis buffer (Huaxingbo, HX1862). Equal amounts of proteins were resolved using 12% SDS-PAGE gel and transferred to PVDF membranes (Millipore, ISEQ00010). After they were blocked with 5% nonfat milk or BSA (Sigma-Aldrich, A3311) at 37°C for 60 min, the membranes were incubated with primary antibodies against AANAT (1:200; Abcam, ab3505), MAP1LC3B (1:1000; abcam, ab51520), BECN1 (1:1000; Cell Signaling Technology, 3495), ATG5 (1:1000; Cell Signaling Technology, 9980), phospho-MAPK14/p38 (Thr180 and Tyr182; 1:1000; Cell Signaling Technology, 4511), MAPK14/p38 (1:1000; Cell Signaling Technology, 8690) and ACTB (1:1000; Huaxingbo, HX1827) at 4°C overnight. The membranes were then washed 3 times with TBST buffer (Huaxingbo, HX1893) and incubated with horseradish peroxidase (HRP)-conjugated secondary antibodies (1:2000; Cell Signaling Technology, 7074). Protein bands were then detected by chemiluminescence. Bands analyzed using ImageJ software (version 1.45; National Institutes of Health, Bethesda, MD, USA).
Melatonin assay
To evaluate the melatonin level in the goats, blood was collected from the jugular vein, and serum was obtained by centrifugation 850 g, 10 min. The supernatants were used for melatonin detection by radioimmunoassay (BAR-3900, LDN, Germany) following the manufacturer’s instructions.
In vivo study
The goats were divided into 5 groups: WT, Transgenic, WT+ LPS, WT+ LPS+ MT and Transgenic+ LPS groups (n = 3 in each group). LPS was dissolved in phosphate-buffered saline at a concentration of 0.04 mg/mL and 0.25 µg/kg was subcutaneously injected into goats. Melatonin was given (0.5 mg/kg) at the same time of LPS injection. Serum and PBMCs were collected at 2 h, 8 h and 48 h for tests of MT and the inflammatory cytokines. PBMCs were isolated for qRT-PCR (Bio-Rad, CA, USA), western blot and proteome detection.
Pbmcs isolation and culture
PBMCs were isolated from the blood of goats using goat PBMCs separation medium (Solarbio, P5290). The PBMCs were incubated at 37°C in an incubator with a 5% CO2 for 2 h and then the non-adherent cells (mostly lymphocytes) were washed out with PBS. The adherent cells were cultured with RPMI1640 (Gibco, 22,400) medium containing 10% FBS.
Analyses of the expression of AANAT, ASMT, MTNR1A and MTNR1B in pbmcs
After 12 h of incubation, a portion of cells were collected to identify whether the AANAT, ASMT, MTNR1A and MTNR1B genes were expressed in PBMCs. The remaining cells were treated with or without 1 µg/mL LPS for 12 h in the culture medium; then they were collected to measure the relative mRNA expression level of AANAT. Total RNA was isolated with TRIzol reagent and was immediately reverse-transcribed using Prime Script™ RT reagent Kit with gDNA Eraser (TaKaRa Bio Inc., RR047). Semiquantitative RT-PCR analysis identified whether the AANAT, ASMT, MTNR1A and MTNR1B genes were expressed in PBMCs. The abundance of AANAT mRNA was measured by qRT-PCR using the SYBR Green I Master (Roche, LightCycler 480, 20,033,920) on the CFX96 Touch apparatus (Bio-Rad, California, USA). ACTB was used as housekeeping gene. The primers are showed in . Relative mRNA expression was calculated by the 2−ΔΔCT method. The semiquantitative RT-PCR products were resolved in a 2.0% agarose gel for an electrophoresis analysis.
Autophagy and inflammatory cytokines analysis
PBMCs were treated with LPS (1 µg/mL) (Sigma-Aldrich, L6529) for 12 h, the supernatants were collected to measure the inflammatory cytokines (IL1B [interleukin 1B], eBioscience, 88–7261; IL2 [interleukin 2], eBioscience, 88–7025; IL6 [interleukin 6], eBioscience, 88–7066; IL8 [interleukin 8], eBioscience, 88–8086; IL12 [interleukin 12] (IL12A-IL12B/p70), eBioscience, 88–7126; and TNF [tumor necrosis factor], BNIBT, Beijing, C06PZB) by radioimmunoassay kit (BNIBT, Beijing, China) following the manufacturer’s instructions and the harvested cells were used to measure the level of autophagy by electron microscopy and immunofluorescence staining and flow cytometry analysis, respectively, the following A and B. For the inhibitory study, PBMCs were treated with LPS (1 µg/mL) for 12 h, then the autophagy inhibitor 3-methyladenine (3-MA; Sigma-Aldrich, L6529; 5 to 10 mM) was added and cultured for an additional 12 h.
A, electron microscopy: Simply, cells were pelleted in 2.5% glutaraldehyde (Sigma-Aldrich, G5882) for 24 h, and following several rinses with PBS, cells were postfixed in 1% osmium tetroxide (Sigma-Aldrich, O5500) for 2 h. Cells were dehydrated in a graded series of ethanol and embedded in epoxy resin (Sigma-Aldrich, 755,877). Ultrathin sections were mounted on nickel grids. Sections were examined under an H-7500 microscope (JEOL Ltd., Hitach, Tokyo, Japan) to identify the autophagosomes.
B, immunofluorescence staining and flow cytometry analysis of LC3B: The fixed goat PBMCs were used for immunofluorescence staining and also for flow cytometry analysis of LC3B. Following the treatment, the cells were washed twice with PBS, fixed with 4% paraformaldehyde (Sigma-Aldrich, P1110) for 1 h, and washed again with PBS. The cells then, were permeabilized in Triton X-100 (Sigma-Aldrich, 93,443) and were blocked with 1% BSA for 1 h. After incubating with antibody against LC3B (abcam, ab51520) at 4°C overnight, cells were washed thrice with PBS followed by incubation with the secondary antibody (1:200) and DAPI (1:1000) for 1 h. Coverslides with the fixed cells were examined using a confocal microscope (SP2; Leica, Wetzlar, Germany). Values of fluorescence intensity were analyzed with ImageJ software (version 1.45; National Institutes of Health, Bethesda, MD, USA). The flow cytometry sample treatment was the same as mentioned above. The fluorescence intensity was examined using a FACSCalibur flow cytometer (BD bioscience, San Jose, CA, USA). Values of fluorescence intensity were analyzed with FlowJo-V10 (Treestar Inc., CA, USA).
Detections of the signaling pathway of autophagy in pbmcs
To identify the signaling pathway, several MAPK- and NFKB-related signaling pathway inhibitors were used. They included: U0126 (10 μM; Sigma-Aldrich, U120), a specific inhibitor of MAPK1/ERK2-MAPK3/ERK1; SP600125 (10 µM; Sigma-Aldrich, S5567), a specific inhibitor of MAPK8/JNK1-MAPK9/JNK2; SB203580 (10 µM; Sigma-Aldrich, S8307), a specific inhibitor of MAPK14, BAY 11–7082 (5 µM; Beyotime, S1523), NFKBIA/IκBα inhibitor and 4-P-PDOT (10−7 M; Sigma-Aldrich, SML1189), an MTNR1B-specific inhibitor. The PBMCs were treated with these inhibitors, respectively and the supernatants were collected to measure the inflammatory cytokines and the harvested cells were used to measure the relative expression level of the autophagy-related genes WIPI1, BECN1 and PIK3R1. The intensity of immunofluorescence staining was used to quantity the autophagy levels.
Melatonin synthetic assay in pbmcs
To evaluate whether the PBMCs synthesize melatonin, the precursor of melatonin 5-hydroxytryptamine (10−5M) was added into the PBMCs culture medium, 24 h later, the supernatants were collected for melatonin assay by radioimmunoassay (BAR-3900, LDN, Germany).
Proteome analysis
Cells were lysed using protein extraction buffer (8 M urea, 0.1% SDS) containing an additional 1 mM of phenylmethylsulfonyl fluoride (Beyotime Biotechnology, China) and protease inhibitor cocktail (Roche, 4,693,132,001) on ice for 30 min and then centrifuged at 16,000 × g for 15 min at 4°C. The supernatant was collected and the concentration of proteins was measured with BCA assay (Pierce, 23,227). The cell lysate was stored at −80°C before further processing.
Tandem mass tags TMT6/10 (Pierce, 90113CH) with different reporter ions (126 to 131 Da) were applied as isobaric tags for relative quantification, and TMT labeling was performed according to the manufacturer’s instructions. Briefly 100 µg per condition were transferred into a new tube and 100 mM triethyl ammonium bicarbonate (TEAB; Sigma, T7408) buffer were added to the protein solution to a final volume of 100 µL. Then 5 µL of 200 mM tris(2-carboxyethyl)phosphine were added into the mixture, incubated at 55°C for 1 h following with adding 5 µL of 375 mM iodoacetamide and incubated for an additional 30 min in dark conditions, at room temperature. Proteins were precipitated by prechilled (−20°C) acetone. After resuspension with 100 µL of 100 mM TEAB, proteins were digested overnight at 37°C with 2.5 µg trypsin (Sigma, V5280). The digested samples were individually labeled with TMT6/10 reagents at room temperature for 1 h. Finally, the 3 labeled peptide aliquots were combined for subsequent fractionation.
For the fractionation of labeled peptides, samples were first lyophilized and reconstituted in solvent A (2% ACN, pH 10). Then, the samples were loaded onto an Xbridge PST C18 Column, 130Å, 5 µm, 250 × 4.6 mm column (Waters, USA) and resolved by basic RPLC method using a gradient of 5 to 95% solvent B (90% ACN, pH 10) in 40 min. A total of 40 fractions were collected which were then concatenated to 20 fractions, vacuum dried and stored at −80°C until further LC-MS analysis.
The LC-MS/MS analysis was carried out in Capitbalbio Technology by using an Q Exactive mass spectrometer (Thermo Scientific, Waltham, CA, USA). The peptide mixture was separated by reversed phase chromatography on a DIONEX nano-UPLC system (Thermo Scientific, Waltham, CA, USA) using an Acclaim C18 PepMap100 nano-Trap column (75 µm × 2 cm, 2 µm particle size) (Thermo Scientific, USA) connected to an Acclaim PepMap RSLC C18 analytical column (75 µm × 25 cm, 2 µm particle size) (Thermo Scientific, USA). Before loading, the sample was dissolved in sample buffer, containing 4% acetonitrile and 0.1% formic acid. A linear gradient of mobile phase B (0.1% formic acid in 99.9% acetonitrile) from 3 to 30% was achieved in 43 min and followed by a steep increase to 80% mobile phase B in 1 min at a flow rate of 300 nL/min. The nano-LC was coupled online with the Q Exactive mass spectrometer using a stainless steel Emitter coupled to a nanospray ion source. Mass spectrometry analysis was performed in a data dependent manner with full scans (350 to 1,600 m/z) acquired using an Orbitrap mass analyser at a mass resolution of 70,000 at 2400 m/z in Q Exactive (Thermo Scientific, Waltham, CA). Twenty most intense precursor ions from a survey scan were selected for MS/MS from each duty cycle and detected at a mass resolution of 35,000 at m/z of 2400 in Orbitrap analyser. All the tandem mass spectra were produced by higher-energy collision dissociation (HCD) method. Dynamic exclusion was set for 18s.
Proteome discoverer software (version 1.4) (Thermo Scientific, USA) was used to perform database searching against the Oryctolagus cuniculus database (46,601 proteins) using the Sequest algorithms. Following criteria were applied: precursor mass tolerance of 15 ppm, fragment mass tolerance of 20 mmu. Trypsin was specified as digesting enzyme and 2 missed cleavages are allowed. Cysteine carbamidomethylation and TMT modifications (N terminus and lysine residues) were defined as fixed modifications. Methionine oxidation and phosphorylation (serine, threonine and tyrosine) were variable modifications. The results were filtered using the following settings: only high confidence peptides with a global false discovery rate< 1% based on a target-decoy approach were included in the results. In the TMT quantification workflow the most confident centroid method was used with an integration window of 20 ppm. For protein quantification, only unique peptides were used to quantify proteins.
Radioimmunoassay and enzyme-linked immunosorbent assays
In addition to the melatonin assay, the supernatants were used for measuring IL1B (interleukin 1B, eBioscience, 88–7261), IL2 (interleukin 2, eBioscience, 88–7025), IL6 (interleukin 6, eBioscience, 88–7066), IL12 (interleukin 12; IL12A-IL12B/p70), eBioscience, 88–7126) and TNF (tumor necrosis factor, BNIBT, Beijing, C06PZB) by radioimmunoassay following the manufacturer’s instructions.
Statistics analysis
Data are expressed as mean± S.E.M. Statistical analyses were done using the univariate analysis of variance (ANOVA) followed by the Student t test with SPSS 21.0 statistical software. P < 0.05 was considered significant, and P < 0.01 was considered highly significant.
Abbreviations
| 3-MA | = | 3-methyladenine |
| AANAT | = | aralkylamine N-acetyltransferase |
| ACTB | = | actin beta |
| ASMT | = | acetylserotonin O-methyltransferase |
| ATG | = | autophagy related |
| BECN1 | = | beclin 1 |
| bp | = | base pairs |
| FFCs | = | fetal fibroblast cells |
| IL1B | = | interleukin 1 beta |
| IL2 | = | interleukin 2 |
| IL6 | = | interleukin 6 |
| IL8 | = | interleukin 8 |
| IL12 | = | interleukin12 (IL12A-IL12B/p70) |
| LPS | = | lipopolysaccharide |
| MAP1LC3B/LC3B | = | microtubule associated protein 1 light chain 3 beta |
| MAPK | = | mitogen-activated protein kinase |
| MAPK1/ERK2 | = | mitogen-activated protein kinase 1 |
| MAPK3/ERK1 | = | mitogen-activated protein kinase 3 |
| MAPK14/p38 | = | mitogen-activated protein kinase 14 |
| Melatonin/MT | = | N-acetyl-5-methoxytryptamine |
| MTNR1B | = | melatonin receptor 1B |
| NFKB | = | nuclear factor kappa B |
| PBMCs | = | peripheral blood mononuclear cells |
| PIK3R1 | = | phosphoinositide-3-kinase regulatory subunit 1 |
| qRT-PCR | = | quantitative real-time polymerase chain reaction |
| SCNT | = | somatic cell nuclear transfer |
| TNF | = | tumor necrosis factor |
| Trans/Transgenic | = | AANAT overexpression transgenic goats |
| WIPI1 | = | WD repeat domain, phosphoinositide interacting 1 |
| WT | = | wild-type |
Supplemental Material
Download Zip (5.1 MB)Acknowledgments
This research was supported by the National Creature Breeding Grand Project under grants 2014ZX08008002B and 2016ZX08008003.
Disclosure statement
No potential conflict of interest was reported by the authors.
Supplementary material
Supplemental data for this article can be accessed here.
Additional information
Funding
Related Research Data
References
- Tan DX, Reiter RJ, Manchester LC, et al. Chemical and physical properties and potential mechanisms: melatonin as a broad spectrum antioxidant and free radical scavenger. Curr Top Med Chem. 2002;2:181–197. PMID:11899100.
- Galano A, Tan DX, Reiter RJ. On the free radical scavenging activities of melatonin’s metabolites, AFMK and AMK. J Pineal Res. 2013;54:245–257. PMID:22998574.
- Melchiorri D, Reiter RJ, Attia AM, et al. Potent protective effect of melatonin on in vivo paraquat-induced oxidative damage in rats. Life Sci. 1995;56:83–89, PMID:7823762
- Zhang HM, Zhang Y. Melatonin: a well-documented antioxidant with conditional pro-oxidant actions. J Pineal Res. 2014;57:131–146. PMID:25060102.
- Manchester LC, Coto-Montes A, Boga JA, et al. Melatonin: an ancient molecule that makes oxygen metabolically tolerable. J Pineal Res. 2015;59:403–419. PMID:26272235.
- Eriksson L, Valtonen M, Laitinen JT, et al. Diurnal rhythm of melatonin in bovine milk: pharmacokinetics of exogenous melatonin in lactating cows and goats. Acta Vet Scand. 1998;39:301–310, PMID:9787493
- Valtonen M, Niskanen L, Kangas AP, et al. Effect of melatonin-rich night-time milk on sleep and activity in elderly institutionalized subjects. Nord J Psychiatry. 2005;59:217–221. PMID:16195124.
- Auldist MJ, Turner SA, McMahon CD, et al. Effects of melatonin on the yield and composition of milk from grazing dairy cows in New Zealand. J Dairy Res. 2007;74:52–57. PMID:16978437.
- Kimata H. Laughter elevates the levels of breast-milk melatonin. J Psychosom Res. 2007;62:699–702. PMID:17540228.
- Rowe SA, Kennaway DJ. Melatonin in rat milk and the likelihood of its role in postnatal maternal entrainment of rhythms. Am J Physiol Regul Integr Comp Physiol. 2002;282:R797–R804. PMID:11832401.
- Lissoni P, Rovelli F, Meregalli S, et al. Melatonin as a new possible anti-inflammatory agent. J Biol Regul Homeost Agents. 1997;11:157–159, PMID:9582617
- Carrillo-Vico A, Lardone PJ, Alvarez-Sanchez N, et al. Melatonin: buffering the immune system. Int J Mol Sci. 2013;14:8638–8683. PMID:23609496.
- Vilar A, De Lemos L, Patraca I, et al. Melatonin suppresses nitric oxide production in glial cultures by pro-inflammatory cytokines through p38 MAPK inhibition. Free Radic Res. 2014;48:119–128. PMID:24060108.
- Chen J, Wang L, Wu C, et al. Melatonin-enhanced autophagy protects against neural apoptosis via a mitochondrial pathway in early brain injury following a subarachnoid hemorrhage. J Pineal Res. 2014;56:12–19. PMID:24033352.
- Guo Y, Wang J, Wang Z, et al. Melatonin protects N2a against ischemia/reperfusion injury through autophagy enhancement. J Huazhong Univ Sci Technolog Med Sci. 2010;30:1–7. PMID:20155447.
- Jeong JK, Moon MH, Lee YJ, et al. Melatonin-induced autophagy protects against human prion protein-mediated neurotoxicity. J Pineal Res. 2012;53(138–46). PMID:22335252.
- Nopparat C, Sinjanakhom P, Govitrapong P. Melatonin reverses H2O2-induced senescence in SH-SY5Y cells by enhancing autophagy via sirtuin 1 deacetylation of the RelA/p65 subunit of NF-kappaB. J Pineal Res. 2017;63:PMID:28295567.
- Wang P, Sun X, Chang C, et al. Delay in leaf senescence of Malus hupehensis by long-term melatonin application is associated with its regulation of metabolic status and protein degradation. J Pineal Res. 2013;55:424–434. PMID:24103092.
- Wang P, Sun X, Wang N, et al. Melatonin enhances the occurrence of autophagy induced by oxidative stress in Arabidopsis seedlings. J Pineal Res. 2015;58:479–489. PMID:25788022.
- Zheng W, Scheibner KA, Ho AK, et al. Mechanistic studies on the alkyltransferase activity of serotonin N-acetyltransferase. Chem Biol. 2001;8::379–389. PMID:11325593.
- Blomeke B, Golka K, Griefahn B, et al. Arylalkylamine N-acetyltransferase (AANAT) genotype as a personal trait in melatonin synthesis. J Toxicol Environ Health A. 2008;71:874–876. PMID:18569588.
- Okazaki M, Higuchi K, Hanawa Y, et al. Cloning, characterization of a Chlamydomonas reinhardtii cDNA arylalkylamine N-acetyltransferase and its use in the genetic engineering of melatonin content in the Micro-Tom tomato. J Pineal Res. 2009;46:373–382. PMID:19552760.
- Kang K, Lee K, Park S, et al. Enhanced production of melatonin by ectopic overexpression of human serotonin N-acetyltransferase plays a role in cold resistance in transgenic rice seedlings. J Pineal Res. 2010. PMID:20586889. DOI:10.1111/j.1600-079X.2010.00783.x.
- Wang L, Zhao Y, Reiter RJ, et al. Changes in melatonin levels in transgenic ‘Micro-Tom’ tomato overexpressing ovine AANAT and ovine HIOMT genes. J Pineal Res. 2014;56:134–142. PMID:24138427.
- Ma T, Tao J, Yang M, et al. An AANAT/ASMT transgenic animal model constructed with CRISPR/Cas9 system serving as the mammary gland bioreactor to produce melatonin-enriched milk in sheep. J Pineal Res. 2017;63. PMID:28273380. DOI:10.1111/jpi.12406
- Hammer RE, Pursel VG, Rexroad CJ, et al. Production of transgenic rabbits, sheep and pigs by microinjection. Nature. 1985;315:680–683. PMID:3892305.
- Marh J, Stoytcheva Z, Urschitz J, et al. Hyperactive self-inactivating piggyBac for transposase-enhanced pronuclear microinjection transgenesis. Proc Natl Acad Sci USA. 2012;109:19184–19189. PMID:23093669.
- Ivics Z, Mates L, Yau TY, et al. Germline transgenesis in rodents by pronuclear microinjection of sleeping beauty transposons. Nat Protoc. 2014;9:773–793. PMID: 24625778.
- Wall RJ, Pronuclear microinjection. Cloning Stem Cells. 20013:209–220. PMID:11945231. DOI:10.1089/15362300152725936
- Cibelli JB, Stice SL, Golueke PJ, et al. Cloned transgenic calves produced from nonquiescent fetal fibroblasts. Science. 1998;280:1256–1258. PMID:9596577.
- McCreath KJ, Howcroft J, Campbell KH, et al. Production of gene-targeted sheep by nuclear transfer from cultured somatic cells. Nature. 2000;405:1066–1069. PMID:10890449.
- Lai L, Kolber-Simonds D, Park KW, et al. Production of alpha-1,3-galactosyltransferase knockout pigs by nuclear transfer cloning. Science. 2002;295:1089–1092. PMID:11778012.
- Lan G, Chang Z, Luo M, et al. Production of cloned goats by nuclear transfer of cumulus cells and long-term cultured fetal fibroblast cells into abattoir-derived oocytes. Mol Reprod Dev. 2006;73:834–840. PMID:16572465.
- Feng X, Cao S, Wang H, et al. Production of transgenic dairy goat expressing human α-lactalbumin by somatic cell nuclear transfer. Transgenic Res. 2015;24:73–85. PMID:25139669.
- Wang YS, He X, Du Y, et al. Transgenic cattle produced by nuclear transfer of fetal fibroblasts carrying Ipr1 gene at a specific locus. Theriogenology. 2015;84:608–616. PMID:25998271.
- Kirik D, Annett LE, Burger C, et al. Nigrostriatal alpha-synucleinopathy induced by viral vector-mediated overexpression of human alpha-synuclein: a new primate model of Parkinson’s disease. Proc Natl Acad Sci USA. 2003;100(2884–9):PMID:12601150.
- Wa R, King T, Neil C, et al. Transgenic sheep designed for transplantation studies. Mol Reprod Dev. 2009;76:61–64. PMID:18449866.
- Cornetta K, Tessanne K, Long C, et al. Transgenic sheep generated by lentiviral vectors: safety and integration analysis of surrogates and their offspring. Transgenic Res. 2013;22:737–745. PMID:23180364.
- Eyestone WH. Challenges and progress in the production of transgenic cattle. Reprod Fertil Dev. 1994;6:647–652. PMID:7569045.
- Damak S, Su H, Jay NP, et al. Improved wool production in transgenic sheep expressing insulin-like growth factor 1. Biotechnology (NY). 1996;14:185–188. PMID:9636321.
- Wall RJ, Powell AM, Paape MJ, et al. Genetically enhanced cows resist intramammary Staphylococcus aureus infection. Nat Biotechnol. 2005;23:445–451. PMID:15806099.
- Schnieke AE, Kind AJ, Ritchie WA, et al. Human factor IX transgenic sheep produced by transfer of nuclei from transfected fetal fibroblasts. Science. 1997;278:2130–2133. PMID:9405350.
- Huang YJ, Huang Y, Baldassarre H, et al. Recombinant human butyrylcholinesterase from milk of transgenic animals to protect against organophosphate poisoning. Proc Natl Acad Sci USA. 2007;104:13603–13608. PMID:17660298.
- Lee GS, Kim HS, Hyun SH, et al. Production of transgenic cloned piglets from genetically transformed fetal fibroblasts selected by green fluorescent protein. Theriogenology. 2005;63:973–991. PMID:15710186.
- Yin XJ, Lee HS, Yu XF, et al. Generation of cloned transgenic cats expressing red fluorescence protein. Biol Reprod. 2008;78:425–431. PMID:18003942.
- Cho SJ, Bang JI, Yu XF, et al. Generation of a recloned transgenic cat expressing red fluorescence protein. Theriogenology. 2010;73:848–855. PMID:20172599.
- Agarwal A, Said TM, Bedaiwy MA, et al. Oxidative stress in an assisted reproductive techniques setting. Fertil Steril. 2006;86:503–512. PMID:16860798.
- Papis K, Poleszczuk O, Wenta-Muchalska E, et al. Melatonin effect on bovine embryo development in vitro in relation to oxygen concentration. J Pineal Res. 2007;43:321–326. PMID:17910599.
- Wang F, Tian X, Zhou Y, et al. Melatonin improves the quality of in vitro produced (IVP) bovine embryos: implications for blastocyst development, cryotolerance, and modifications of relevant gene expression. PLoS One. 2014;9:e93641. PMID:24695534.
- Wang F, Tian X, Zhang L, et al. Beneficial effects of melatonin on in vitro bovine embryonic development are mediated by melatonin receptor 1. J Pineal Res. 2014;56:333–342. PMID:24666110.
- Ishizuka B, Kuribayashi Y, Murai K, et al. The effect of melatonin on in vitro fertilization and embryo development in mice. J Pineal Res. 2000;28:48–51. PMID:10626601.
- Gao C, Han H, Tian X, et al. Melatonin promotes embryonic development and reduces reactive oxygen species in vitrified mouse 2-cell embryos. J Pineal Res. 2012;52:305–311. PMID:22225541.
- Wang F, Tian X, Zhang L, et al. Melatonin promotes the in vitro development of pronuclear embryos and increases the efficiency of blastocyst implantation in murine. J Pineal Res. 2013;55:267–274. PMID:23772689.
- Rodriguez-Osorio N, Kim IJ, Wang H, et al. Melatonin increases cleavage rate of porcine preimplantation embryos in vitro. J Pineal Res. 2007;43:283–288. PMID:17803526.
- Choi J, Park SM, Lee E, et al. Anti-apoptotic effect of melatonin on preimplantation development of porcine parthenogenetic embryos. Mol Reprod Dev. 2008;75:1127–1135. PMID:18324672.
- Abecia JA, Forcada F, Zuniga O. The effect of melatonin on the secretion of progesterone in sheep and on the development of ovine embryos in vitro. Vet Res Commun. 2002;26:151–158. PMID:11922484.
- Pang Y, An L, Wang P, et al. Treatment of porcine donor cells and reconstructed embryos with the antioxidant melatonin enhances cloning efficiency. J Pineal Res. 2013;54:389–397. PMID:24325731.
- Su J, Wang Y, Xing X, et al. Melatonin significantly improves the developmental competence of bovine somatic cell nuclear transfer embryos. J Pineal Res. 2015;59:455–468. PMID:26331949.
- Farez MF, Mascanfroni ID, Mendez-Huergo SP, et al. Melatonin contributes to the seasonality of multiple sclerosis relapses. Cell. 2015;162:1338–1352. PMID:26359987.
- Ren W, Liu G, Chen S, et al. Melatonin signaling in T cells: functions and applications. J Pineal Res. 2017;62. PMID:28152213. DOI:10.1111/jpi.12394
- Levine B, Mizushima N, Virgin HW. Autophagy in immunity and inflammation. Nature. 2011;469:323–335. PMID:21248839.
- Deretic V, Saitoh T, Akira S. Autophagy in infection, inflammation and immunity. Nat Rev Immunol. 2013;13:722–737. PMID:24064518.
- Lapaquette P, Nguyen HT, Faure M. Regulation of immunity and inflammation by autophagy: <All is well, all is fine, all goes as well as possible>. Med Sci (Paris). 2017;33:305–311. PMID:28367818.
- Deretic V. Autophagy: an emerging immunological paradigm. J Immunol. 2012;189:15–20. PMID:22723639.
- Shi CS, Shenderov K, Huang NN, et al. Activation of autophagy by inflammatory signals limits IL-1beta production by targeting ubiquitinated inflammasomes for destruction. Nat Immunol. 2012;13:255–263. PMID:22286270.
- Yuk JM, Jo EK. Crosstalk between autophagy and inflammasomes. Mol Cells. 2013;36:393–399. PMID:24213677.
- Deretic V. Autophagy as an innate immunity paradigm: expanding the scope and repertoire of pattern recognition receptors. Curr Opin Immunol. 2012;24:21–31. PMID:22118953.
- Zhang WL, Meng HZ, Yang RF, et al. Melatonin suppresses autophagy in type 2 diabetic osteoporosis. Oncotarget. 2016;7:52179–52194. PMID:27438148.
- Feng D, Wang B, Wang L, et al. Pre-ischemia melatonin treatment alleviated acute neuronal injury after ischemic stroke by inhibiting endoplasmic reticulum stress-dependent autophagy via PERK and IRE1 signalings. J Pineal Res. 2017;62. PMID:28178380. doi:10.1111/jpi.12395
- Rosales-Corral SA, Acuña-Castroviejo D, Coto-Montes A, et al. Alzheimer’s disease: pathological mechanisms and the beneficial role of melatonin. J Pineal Res. 2012;52:167–202. PMID:22107053.
- Stefanova NA, Maksimova KY, Kiseleva E, et al. Melatonin attenuates impairments of structural hippocampal neuroplasticity in OXYS rats during active progression of Alzheimer’s disease-like pathology. J Pineal Res. 2015;59:163–177. PMID:25988948.
- Yang Y, Sun Y, Yi W, et al. A review of melatonin as a suitable antioxidant against myocardial ischemia-reperfusion injury and clinical heart diseases. J Pineal Res. 2014;57:357–366. PMID:25230580.
- Han D, Huang W, Li X, et al. Melatonin facilitates adipose-derived mesenchymal stem cells to repair the murine infarcted heart via the SIRT1 signaling pathway. J Pineal Res. 2016;60:178–192. PMID:26607398.
- Peschke E, Bähr I, Mühlbauer E. Experimental and clinical aspects of melatonin and clock genes in diabetes. J Pineal Res. 2015;59:1–23. PMID:25904189.
- Xin Z, Jiang S, Jiang P, et al. Melatonin as a treatment for gastrointestinal cancer: a review. J Pineal Res. 2015;58:375–387. PMID:25752643.
- Hevia D, González-Menéndez P, Quiros-González I, et al. Melatonin uptake through glucose transporters: a new target for melatonin inhibition of cancer. J Pineal Res. 2015;58:234–250. PMID:25612238.
- Gómez-Florit M, Ramis JM, Monjo M. Anti-fibrotic and anti-inflammatory properties of melatonin on human gingival fibroblasts in vitro. Biochem Pharmacol. 2013;86:1784–1790. PMID:24144630.
- Permpoonputtana K, Govitrapong P. The anti-inflammatory effect of melatonin on methamphetamine-induced proinflammatory mediators in human neuroblastoma dopamine SH-SY5Y cell lines. Neurotox Res. 2013;23:189–199. PMID:22903344.
- Chen Y, Zhang J, Zhao Q, et al. Melatonin induces anti-inflammatory effects to play a protective role via endoplasmic reticulum stress in acute pancreatitis. Cell Physiol Bioche. 2016;40:1094–1104. PMID:27960163.
- Yuan S, Huang Y, Liu S, et al. RNA-seq analysis of overexpressing ovine AANAT gene of melatonin biosynthesis in switchgrass. Front Plant Sci. 2016;7. PMID:27656186. doi:10.3389/fpls.2016.01289
- Forman K, Vara E, Garcia C, et al. Beneficial effects of melatonin on cardiological alterations in a murine model of accelerated aging. J Pineal Res. 2010;49:312–320. PMID:20738757.
- Nathan C, Ding A. Nonresolving inflammation. Cell. 2010;140:871–882. PMID:20303877.
- Li X, Long Q, Cheng X, et al. Shock wave induces biological renal damage by activating excessive inflammatory responses in rat model. Inflammation. 2014;37:1317–1325. PMID:24590377.
- Kim HJ, Lee JS, Kim A, et al. TLR2 signaling in tubular epithelial cells regulates NK cell recruitment in kidney ischemia-reperfusion injury. J Immunol. 2013;191:2657–2664. PMID:23904170.
- Rosas-Ballina M, Valdés-Ferrer SI, Dancho ME, et al. Xanomeline suppresses excessive pro-inflammatory cytokine responses through neural signal-mediated pathways and improves survival in lethal inflammation. Brain Behav Immun. 2015;44:19–27. PMID:25063706.
- Choi SI, Kim KS, Oh JY, et al. Melatonin induces autophagy via an mTOR-dependent pathway and enhances clearance of mutant-TGFBIp. J Pineal Res. 2013;54:361–372. PMID:23363291.
- Ding K, Xu J, Wang H, et al. Melatonin protects the brain from apoptosis by enhancement of autophagy after traumatic brain injury in mice. Neurochem Int. 2015;91:46–54. PMID:26527380.
- Tsuyuki S, Takabayashi M, Kawazu M, et al. Detection of WIPI1 mRNA as an indicator of autophagosome formation. Autophagy. 2014;10:497–513. PMID:24384561.
- Proikas-Cezanne T, Takacs Z, Donnes P, et al. WIPI proteins: essential PtdIns3P effectors at the nascent autophagosome. J Cell Sci. 2015;128:207–217. PMID:25568150.
- Sun T, Li X, Zhang P, et al. Acetylation of Beclin 1 inhibits autophagosome maturation and promotes tumour growth. Nat Commun. 2015;6:7215. PMID:26008601.
- Liang XH, Jackson S, Seaman M, et al. Induction of autophagy and inhibition of tumorigenesis by beclin 1. Nature. 1999;402:672–676. PMID:10604474.
- Mizushima N, Yoshimori T, Levine B. Methods in mammalian autophagy research. Cell. 2010;140:313–326. PMID:20144757.
- Klionsky DJ, Abdalla FC, Abeliovich H, et al. Guidelines for the use and interpretation of assays for monitoring autophagy. Autophagy. 2012;8:445–544. PMID:22966490.
- Ding K, Wang H, Xu J, et al. Melatonin stimulates antioxidant enzymes and reduces oxidative stress in experimental traumatic brain injury: the Nrf2-ARE signaling pathway as a potential mechanism. Free Radic Biol Med. 2014;73:1–11. PMID:24810171.
- Ding K, Wang H, Xu J, et al. Melatonin reduced microglial activation and alleviated neuroinflammation induced neuron degeneration in experimental traumatic brain injury: possible involvement of mTOR pathway. Neurochem Int. 2014;76:23–31. PMID:24995391.
- Qi Y, Zhang M, Li H, et al. Autophagy inhibition by sustained overproduction of IL6 contributes to arsenic carcinogenesis. Cancer Res. 2014;74:3740–3752. PMID:24830721.
- François A, Julian A, Ragot S, et al. Inflammatory stress on autophagy in peripheral blood mononuclear cells from patients with alzheimer’s disease during 24 months of follow-up. PLoS One. 2015;10(9):e0138326. PMID:26393801.
- Abdelaziz DH, Khalil H, Cormet-Boyaka E, et al. The cooperation between the autophagy machinery and the inflammasome to implement an appropriate innate immune response: do they regulate each other? Immunol Rev. 2015;265:194–204. PMID:25879294.
- Kalinichenko LS, Pertsov SS, Koplik EV. Melatonin effects on serum cytokine profiles of rats with different behavioral parameters in acute emotional stress. Bull Exp Biol Med. 2014;156:627–630. PMID:24770744.
- Effenberger-Neidnicht K, Brencher L, Broecker-Preuss M, et al. Immune stimulation by exogenous melatonin during experimental endotoxemia. Inflammation. 2014;37:738–744. PMID:24385237.