
ABSTRACT
Macroautophagy/autophagy is considered as an evolutionarily conserved cellular catabolic process. In this study, we aimed to elucidate the role of autophagy in vascular smooth muscle cells (SMCs) on atherosclerosis. SMCs cultured from mice with SMC-specific deletion of the essential autophagy gene atg7 (Atg7cKO) showed reduced serum-induced cell growth, increased cell death, and decreased cell proliferation rate. Furthermore, 7-ketocholestrerol enhanced apoptosis and the expression of CCL2 (chemokine [C-C motif] ligand 2) with the activation of TRP53, the mouse ortholog of human and rat TP53, in SMCs from Atg7cKO mice. In addition, Atg7cKO mice crossed with Apoe (apolipoprotein E)-deficient mice (apoeKO; Atg7cKO:apoeKO) showed reduced medial cellularity and increased TUNEL-positive cells in the descending aorta at 10 weeks of age. Intriguingly, Atg7cKO: apoeKO mice fed a Western diet containing 1.25% cholesterol for 14 weeks showed a reduced survival rate. Autopsy of the mice demonstrated the presence of aortic rupture. Analysis of the descending aorta in Atg7cKO:apoeKO mice showed increased plaque area, increased TUNEL-positive area, decreased SMC-positive area, accumulation of macrophages in the media, and adventitia and perivascular tissue, increased CCL2 expression in SMCs in the vascular wall, medial disruption, and aneurysm formation. In conclusion, our data suggest that defective autophagy in SMCs enhances atherosclerotic changes with outward arterial remodeling.
Introduction
Macroautophagy (hereafter autophagy) is a highly evolutionarily conserved dynamic recycling system that is essential for cellular renovation and homeostasis [Citation1]. Autophagy acts to selectively degrade long-lived proteins and remove dysfunctional organelles under basal conditions, as well as to promote cell survival by ensuring metabolic supply via degrading cytoplasmic components in bulk and by eliminating defective or damaged organelles during periods of nutrient deprivation or stress. Defective autophagy has been implicated in various human disease, including neurodegenerative diseases [Citation2], cancers [Citation3], heart failure [Citation4], diabetes mellitus [Citation5], and inflammatory bowel disease [Citation6].
Atherosclerosis is a chronic inflammatory disease that can lead to life-threatening diseases, such as myocardial infarction, stroke, and aortic aneurysm [Citation7]. In particular, myocardial infarction and stroke are triggered at least in part by the rupture of unstable plaques in atherosclerotic lesions, which have a thin fibrous cap comprising cells positive for vascular smooth muscle cell (SMC)-markers, and a thickened intima-media complex with an increased number of cells positive for macrophage markers. Whereas the progression of atherosclerosis involves multiple complex processes, the loss of SMCs plays a substantial role in the progression of vascular diseases. In fact, enhanced rates of SMC death are found in the fibrous cap of human atherosclerotic lesions [Citation8], leading to decreased stability of atherosclerotic plaques [Citation9]. Furthermore, chronic apoptosis of SMCs leads to an increase in the size of atherosclerotic lesions in mice [Citation10]. In addition, increased SMC death and decreased SMC density within the medial layer characterizes human arterial aneurysms [Citation11].
Whereas many disease-associated factors, including oxidative stress, reactive lipids, inflammation, mitogens, and metabolic stressors have been shown to induce autophagy in cultured SMCs [Citation12], previous studies demonstrate that the number of autophagosomes is increased in SMCs of the atherosclerotic lesions of humans and rabbits, as analyzed by transmission electron microscopy (TEM) [Citation13]. These data suggest that this change in autophagic activity may be involved in the pathogenesis of atherosclerosis. Previous studies demonstrate that autophagy induced by reactive lipids, such as 4-hydroxynonenal [Citation14], 7-ketocholesterol [Citation15], and excess free cholesterol [Citation16] in SMCs attenuates cell death. In addition, a recent study demonstrates that mice deficient specifically in SMC autophagy have enhanced vascular contractility, possibly through the dysregulation of calcium homeostasis in SMCs [Citation17]. Furthermore, mice deficient in autophagy specifically in SMCs show accelerated cell senescence, enhanced neointimal formation after ligation-induced injury, and enhanced atherosclerosis when crossed with Apoe (apolipoprotein E)-deficient mice (apoeKO) and fed a western-type diet [Citation18]. These data hence demonstrate the protective role of autophagy in SMCs for the progression of atherosclerosis. In this study, we further investigated the role of autophagy in SMCs on the progression of atherosclerosis and identified the unexpected role of SMC autophagy in preventing aortic aneurysm formation in vivo.
Results
Autophagy deficiency results in increased susceptibility of SMCs to cell death
To investigate the functional roles of autophagy in SMCs, we used a model with defective autophagy in SMCs. For this purpose, we generated mice with a tissue-specific deletion of Atg7, an essential gene for autophagy, in SMCs by crossing Atg7f/f mice with Tagln (transgelin)/Sm22αCre+/0 mice (Atg7cKO). It is of note that Tagln Cre+/0 mice are widely used to assess the function of vascular SMCs in vivo as TAGLN is expressed in all SMCs, including vascular SMCs [Citation19]. Then, we isolated primary SMCs from Atg7cKO mice, as well as Atg7f/f mice as a floxed control. SMCs isolated from Atg7cKO mice showed reduced expression of ATG7, and reduced levels of MAP1LC3B (microtubule-associated protein 1 light chain 3 beta)-II, which is a marker of autophagosomes [Citation20], together with the accumulation of SQSTM1 (sequestosome 1), a receptor protein that is degraded by autophagosomes (Figure 1(A)). In SMCs from control Atg7f/f mice, TEM demonstrated normal-shaped mitochondria and a small number of autophagic vacuoles ()). Compared with the ultrastructure of SMC mitochondria of control Atg7f/f mice, that of Atg7cKO mice were heterogenous; some were low in electron density and lacked cristae, whereas some were high in electron density ()). Furthermore, autophagic vacuoles containing mitochondria were occasionally found in the SMCs of control Atg7f/f mice, whereas autophagic vacuoles were not observed within the SMCs of Atg7cKO mice (,)). These data suggest that SMCs from Atg7cKO mice show defects in autophagy, which play important roles in the removal of dysfunctional organelles.
Figure 1. Autophagy deficiency in SMCs increases cell death. SMCs from control Atg7f/f and Atg7cKO mice at 10 weeks of age were isolated. (A) Western blot analysis of primary isolated SMCs for ATG7, MAP1LC3B-I, MAP1LC3B-II, and SQSTM1. Representative results from 3 independent experiments are shown. (B) TEM of primary isolated SMCs. The black arrow indicates an autophagosome. The black arrowheads indicate ultrastructure of mitochondria lacking cristae with low electron density. The white arrowhead indicates the ultrastructure of mitochondrion with high electron density. Scale bars: 1 μm. (C) Numbers of cultured cells. Data are the mean ± SEM of 5 independent experiments. *P < 0.05 vs control Atg7f/f mice. (D) Relative nucleosome concentration in SMCs after culturing for 24 h or 48 h. Data are shown as the mean ± SEM of 3 independent experiments. *P < 0.05 vs control Atg7f/f mice. The data from control SMCs was set to 1.0. (E) Western blot analysis of primary SMCs pretreated with or without N-acetylcysteine (NAC). Representative results from 3 independent experiments are shown. (F) Senescence-associated GLB1 staining of SMCs. Scale bars: 300 μm. (G) Relative BrdU uptake in SMCs. Data are shown as the mean ± SEM of 3 independent experiments. *P < 0.05 vs control Atg7f/f mice. Data from control SMCs was set to 1.0. (H) Relative increase in nucleosome concentration in SMCs treated with 100 μM H2O2 for 48 h. Data are shown as the mean ± SEM of 5 independent experiments. *P < 0.05 vs control Atg7f/f mice. The data from the control Atg7f/f and Atg7cKO without 100 μM H2O2 was set to 1.0 respectively. (I) Relative nucleosome concentration in SMCs pretreated with or without NAC for 48 h. Data are shown as the mean ± SEM of 3 independent experiments. *P < 0.05 vs control Atg7f/f mice. The data from the control SMCs was set to 1.0.
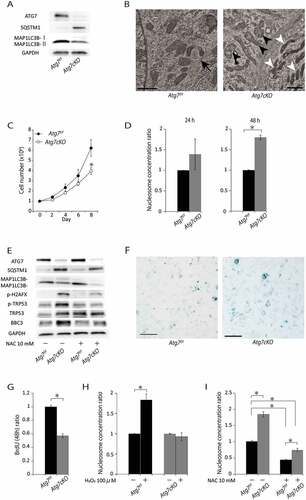
To investigate the effect of autophagy on cell growth, we counted the number of SMCs during their culture with serum. As shown in ), the number of SMCs from Atg7cKO mice, 8 days after the start of culture was significantly lower than that of control Atg7f/f mice. To calculate the cell death ratio during culture, we measured nucleosomes in cytosolic cell lysates. Relative nucleosome concentration of SMCs from Atg7cKO was numerically higher after 24 h of culture and significantly higher after 48 h of culture than the control Atg7f/f mice ()). Along with increased cell death, SMCs from Atg7cKO mice demonstrated higher expression of phosphorylated form of H2AFX (H2A histone family member X), a DNA damage marker, than the control Atg7f/f mice ()). In addition, phosphorylation of TRP53 and BBC3 (BCL2 binding component 3), which is a critical mediator of apoptosis, were significantly increased in SMCs from Atg7cKO. As TRP53 is an important regulator of cell senescence, we next performed senescence-associated GLB1 (galactosidase, beta 1) staining. Similar to a previous study [Citation18], Atg7cKO mice demonstrated stronger senescence-associated GLB1 staining than that of control Atg7f/f mice ()). Furthermore, SMCs from Atg7cKO mice showed decreased proliferation capacity evaluated by the bromodeoxyuridine (BrdU) incorporation assay ()).
Oxidative stress is involved in the pathogenesis of atherosclerosis, restenosis [Citation21], and aneurysm formation [Citation22], and was reported to induce SMC death [Citation23]. To investigate the effect of oxidative stress on cell death in SMCs from Atg7cKO mice, we analyzed cell numbers after the addition of 100 μM H2O2 for 48 h. Similar to a previous study [Citation18], SMCs from Atg7cKO mice were more resistant to exogenous high oxidative stress-induced cell death compared with control Atg7f/f mice ()). Next, we investigated the effect of the antioxidant N-acetylcysteine (NAC) on cytosolic nucleosome levels. Intriguingly, NAC treatment drastically reduced cytosolic nucleosome levels in both SMCs from Atg7cKO and control Atg7f/f mice, and its effect appeared to be stronger in Atg7cKO mice ()). Along with the reduction in cell death, NAC treatment significantly suppressed the expression of H2AFX, phosphorylated TRP53, and BBC3 in Atg7cKO mice ()). Although SMCs from Atg7cKO mice were much more resistant to exogenous high oxidative stress-induced cell death, cell death of SMCs induced by a defect in autophagy may be mediated at least in part by basal levels of oxidative stress.
Autophagy deficiency in SMCs increases cell death at an early stage of atherosclerosis
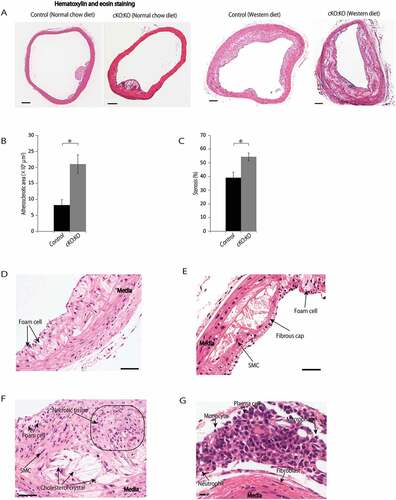
To investigate the role of autophagy in SMCs in our atherosclerosis model, we first analyzed the morphology of the descending aorta in Atg7cKO mice and control Atg7f/f mice. When Atg7cKO mice and control Atg7f/f mice were fed a normal chow diet for 24 weeks, no atherosclerotic lesions were found in both mice (data not shown). Thus, we next crossed Atg7cKO mice with apoeKO (Atg7cKO:apoeKO). At 10 weeks of age, atheromas were not found in both groups (Figure 2(A)). Whereas no SQSTM1-positive cells were observed in cells in the media of the aorta from floxed control Atg7f/f:apoeKO mice, most cells in the media of the aorta of Atg7cKO: apoeKO mice were SQSTM1-positive ()).
Figure 2. Autophagy deficiency in SMCs reduces medial cellularity. Sections of descending aortas from control Atg7f/f:apoeKO mice (Control) and Atg7cKO:apoeKO mice (cKO:KO) at 10 weeks of age were evaluated. (A) Representative histological sections of descending aortas stained with hematoxylin and eosin. Scale bars: 100 μm. (B) Representative histological sections of descending aortas stained with a SQSTM1 antibody and hematoxylin. Scale bars: 50 μm. (C) Representative photographs of sections of the descending aorta subjected to the TUNEL assay and stained with Red Counterstain C. Arrows indicate TUNEL-positive cells. Scale bars: 50 μm. (D) Medial SMC numbers were evaluated in the thoracic aorta and abdominal aorta by hematoxylin and eosin staining. Data are shown the mean ± SEM of 11. *P < 0.05 vs Control. (E) Representative histological sections of descending aortas stained with antibodies against PCNA (proliferating cell nuclear antigen) and with hematoxylin. Scale bars: 50 μm. (F) PCNA-positive cell numbers were analyzed in the descending aorta. Data are shown as the mean ± SEM of 11 samples. *P < 0.05 vs Control.
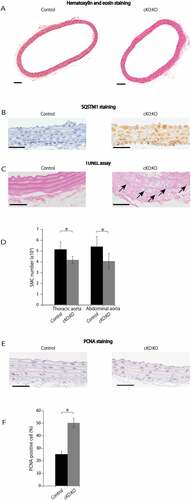
Next, we searched for apoptotic cells by TUNEL assay. Whereas TUNEL-positive cells were hardly observed in the media of control Atg7f/f:apoeKO mice aortas, we frequently found TUNEL-positive cells in the media of aortas from Atg7cKO:apoeKO mice ()). Probably reflecting this observation, the medial density of SMCs of both thoracic and abdominal aortas from Atg7cKO:apoeKO mice analyzed by hematoxylin and eosin staining ()) and ACTA2 (actin, alpha 2, smooth muscle, aorta) staining (Figure S1) were reduced. Conversely, the number of proliferating cells in the media of Atg7cKO:apoeKO mice aortas evaluated by proliferating cell nuclear antigen (PCNA) were increased compared with control Atg7f/f:apoeKO mice, probably due to a compensation mechanism [Citation24] (,)).
Atg7cKO:apoeKO mice fed a Western diet showed increased premature death
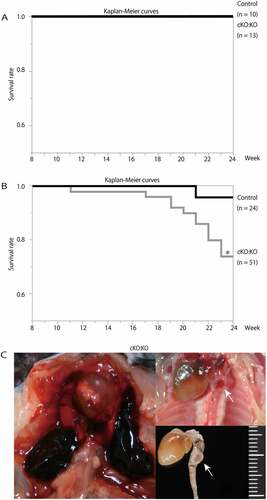
Control Atg7f/f:apoeKO mice and Atg7cKO:apoeKO mice fed a normal chow diet for 24 weeks did not show any differences in their survival rates (). Thus, to further investigate the roles of SMC autophagy in atherosclerosis, control Atg7f/f:apoeKO mice and Atg7cKO:apoeKO mice at the age of 10 weeks were fed a Western diet for 14 weeks. After a 14-week Western-diet load, body weight and food consumption of Atg7cKO:apoeKO mice were slightly decreased compared with control Atg7f/f:apoeKO mice (). In addition, Atg7cKO:apoeKO mice showed modest but significantly decreased levels of total cholesterol, high-density lipoprotein-cholesterol, and triglyceride (). These differences in lipid parameters may be associated with the small reduction in food consumption of Atg7cKO:apoeKO mice. Conversely, there was no significant difference in mean systemic arterial pressure between the 2 groups (). Intriguingly, Kaplan-Meier curves showed that the survival rates of Atg7cKO: apoeKO mice were significantly reduced compared with control Atg7f/f:apoeKO mice ()). Autopsy of some of the dead mice showed the coagulation of blood in the thoracic or abdominal cavity and cracks in the aorta, suggesting that these mice died of aortic rupture ()).
Table 1. Data in control Atg7f/f:apoeKO mice mice and Atg7cKO:apoeKO mice after 14-weeks of Western-diet load.
Figure 3. Survival rates of apoeKO mice and Atg7cKO: apoeKO mice fed a Western diet. (A) Kaplan-Meier curves of control Atg7f/f:apoeKO mice (Control; n = 10) and Atg7cKO:apoeKO mice (cKO:KO; n = 13) fed a normal chow diet. (B) Kaplan-Meier curves of control Atg7f/f:apoeKO mice (Control; n = 24) and Atg7cKO:apoeKO mice (cKO:KO; n = 51) fed a Western diet. *P < 0.05 vs Control. (C) Representative images upon autopsy of a Atg7cKO:apoeKO mice fed a Western diet. Arrows indicate cracks in the aorta.
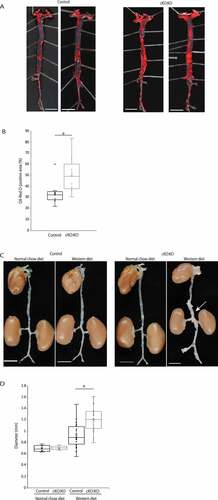
Next, we analyzed the whole aorta by oil-red O staining, as a marker of atherosclerotic area in Atg7cKO:apoeKO mice and control Atg7f/f:apoeKO mice fed a Western diet. As shown in Figure 4(A,), the area stained with oil-red O in Atg7cKO:apoeKO mice was larger than control Atg7f/f:apoeKO mice fed a Western diet. In addition, we measured maximum diameters of the suprarenal abdominal aorta, which is generally regarded as the main site of aneurysm formation [Citation25]. Although the maximal external diameter of the suprarenal aorta was similar between control Atg7f/f:apoeKO mice and Atg7cKO:apoeKO mice fed a normal chow diet, it was significantly larger in Atg7cKO:apoeKO mice than in the control Atg7f/f:apoeKO mice under Western diet (,)), supporting the idea that autophagy deficiency in SMCs induces the progression of atherosclerosis and a higher frequency of aneurysm formation.
Figure 4. Autophagy deficiency accelerates atherosclerosis and increases maximal external diameter in SMCs of mice fed a Western diet. (A) Representative en face view of the entire aorta of control Atg7f/f:apoeKO mice (Control) and Atg7cKO:apoeKO mice (cKO:KO) fed a Western diet, stained with oil-red O. Scale bars: 5 mm. (B) Oil-red O-positive areas of Control and cKO:KO fed a Western diet. Data are shown as a box plot of 9 mice in each group. *P < 0.05 vs Control. (C) Representative view of the entire aorta of Control and cKO:KO fed either a normal chow diet or a Western diet. The white arrow indicates the suprarenal aorta with an enlarged diameter. Scale bars: 5 mm. (D) Maximal external diameters of the suprarenal aorta of Control and cKO:KO fed a normal chow diet or a Western diet. Data are shown as a box plot of 6 Control and 5 cKO:KO fed a normal chow diet and 20 Control and 30 cKO:KO fed a Western diet. *P < 0.05 vs Control.
Atg7cKO:apoeKO mice fed a Western diet showed extensive morphological changes of the media and the progression of atherosclerosis
Next, we evaluated the morphology of atherosclerotic lesions, with a focus on the suprarenal aortas of control Atg7f/f:apoeKO mice and Atg7cKO:apoeKO mice fed a normal chow diet and a Western diet for 14 weeks (Figure 5(A)). In control Atg7f/f:apoeKO mice and Atg7cKO:apoeKO mice fed a normal chow diet, we only occasionally found very early stage and small atherosclerotic lesions in the suprarenal aorta that were difficult to quantitate for comparison. In contrast, control Atg7f/f:apoeKO mice and Atg7cKO:apoeKO mice fed a Western diet showed much larger atherosclerotic lesions than the same mice fed a normal chow diet ()). In mice fed a Western diet, plaque sizes in the abdominal aortic region of Atg7cKO:apoeKO mice were significantly larger than control Atg7f/f:apoeKO mice ()) and these changes resulted in luminal narrowing ()). Atherosclerotic lesions found in Atg7cKO:apoeKO mice mimic some of the features of the various stages of human atherosclerotic lesions, such as fatty streaks, which are composed of macrophage-derived foam cells ()), complicated plaques with thick fibrous caps ()), migration of SMCs into the sub-endothelial space in atherosclerotic plaque lesions (,)), and large areas necrotic tissue containing cholesterol crystals ()). In the adventitia and perivascular tissue of Atg7cKO:apoeKO mice, the accumulation of infiltrated monocytes, macrophages, neutrophils, plasma cells, and fibroblasts were found ()). These features of the lesions indicated chronic inflammation in the vasculature.
Figure 5. Morphological changes of atherosclerotic lesions in Atg7cKO:apoeKO mice fed a Western diet. Atherosclerotic lesions of control Atg7f/f:apoeKO mice (Control) and Atg7cKO:apoeKO mice (cKO:KO) fed a normal chow diet or a Western diet for 14 weeks were evaluated. (A) Representative histological sections of abdominal aortas stained with hematoxylin and eosin of Control and cKO:KO fed a normal chow diet and Western diet. (B) Percentage atherosclerotic areas of the aortas of Control and cKO:KO fed a Western diet. Data are shown as the mean ± SEM of 11 Control and 21 cKO:KO mice. *P < 0.05 vs Control. (C) Percentage luminal stenosis of Control and cKO:KO fed a Western diet. Data are shown as the mean ± SEM of 11 Control and 21 cKO:KO. *P < 0.05 vs Control. (D, E and F) Atherosclerotic lesions of cKO:KO fed a Western diet. Scale bars: 50 μm. (G) Adventitia and the perivascular tissue of an atherosclerotic lesion of cKO:KO fed a Western diet. Scale bar: 10 μm.
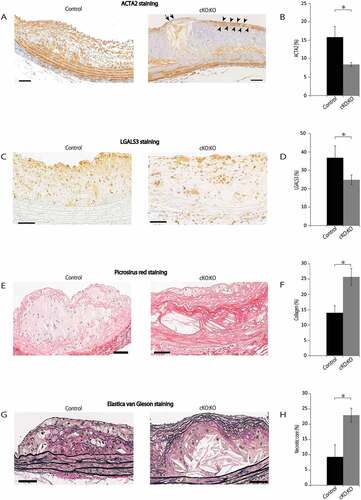
We further investigated the composition of the plaque lesions in control Atg7f/f:apoeKO mice and Atg7cKO:apoeKO mice fed a Western diet. The ACTA2-positive area in the atherosclerotic plaques of Atg7cKO:apoeKO mice was significantly reduced compared with that of control Atg7f/f:apoeKO mice (,)). The area positive for LGALS3 (lectin, galactose binding, soluble 3), a macrophage marker, was also reduced in the atherosclerotic plaques of Atg7cKO:apoeKO mice compared with control Atg7f/f:apoeKO mice (,)). Collagen-positive area and the necrotic core area were significantly larger in Atg7cKO:apoeKO mice (-)). Taken together, fibrous caps of the atherosclerotic lesions of Atg7cKO:apoeKO mice resembled features of human atherosclerotic lesions that were almost completely composed of ACTA2-positive cells ()). In addition, the thickened intima-media complex was composed of high amount of the extracellular matrix ()) with relatively fewer macrophage marker-positive cells ()). Intriguingly, although in general the fibrous caps were thicker in the atherosclerotic lesions of Atg7cKO:apoeKO mice (), in some of the advanced lesions of these mice, we found regions with thinner fibrous caps and fewer SMCs ()), implying the presence of vulnerable plaques [Citation26,Citation27]. These data suggest that Atg7cKO:apoeKO mice have more advanced atherosclerotic lesions than control Atg7f/f:apoeKO mice under Western diet.
Table 2. Minimum, maximum and mean cap thickness in control Atg7f/f:apoeKO mice and Atg7cKO:apoeKO mice after 14-weeks of Western diet.
Figure 6. Composition of atherosclerotic lesions of Atg7cKO:apoeKO mice fed a Western diet. (A) Representative histological images of abdominal aortic plaques of Atg7f/f: apoeKO mice (Control) and Atg7cKO:apoeKO mice (cKO:KO) fed a Western diet for 14 weeks, stained with an ACTA2 antibody. The area between the arrowheads indicates a fibrous cap. Arrows indicate the thin fibrous cap. Scale bars: 50 μm. (B) Areas of ACTA2-positive regions in the abdominal aortic plaques. Data are shown as the mean ± SEM of 11 Control and 21 cKO:KO. *P < 0.05 vs Control. (C) Representative histological images of abdominal aortic plaques from Control and cKO:KO stained with LGALS3 antibody from Control and cKO:KO. Scale bars: 50 μm. (D) The area of LGALS3-positive regions in the abdominal aortic plaque was evaluated. Data are mean ± SEM of 11 Control and 21 cKO:KO each. *P < 0.05 vs Control. (E) Representative histological images of abdominal aortas from Control and cKO:KO stained with Picrosirius red. Scale bars: 50 μm. (F) Collagen contents area was evaluated. Data are mean ± SEM of 11 Control and 21 cKO:KO each. *P < 0.05 vs Control. (G) Representative histological images of abdominal aorta stained with Elastica van Gieson staining from Control and cKO:KO. Scale bars: 50 μm. (H) Necrotic core area was evaluated. Data are mean ± SEM of 11 Control and 21 cKO:KO each. *P < 0.05 vs Control.
Atg7cKO:apoeKO mice fed a Western diet showed increased apoptotic cell death in their plaques and media
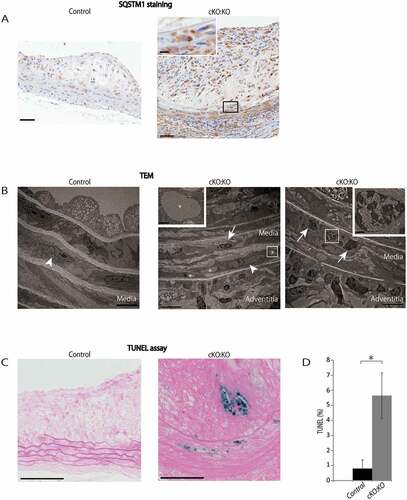
Consistent with a previous study [Citation28], SQSTM1-positive cells were hardly observed in control Atg7f/f:apoeKO mice at the age of 10 weeks ()); however, they were frequently observed not only in the plaques but also in the media, subendothelial space, and fibrous caps of control Atg7f/f:apoeKO mice fed a Western diet for 14 weeks (Figure 7(A)). Furthermore, SQSTM1-positive cells were more frequently located in those places of Atg7cKO:apoeKO mice after 14 weeks on a Western diet ()). In addition, close observation demonstrated that strong SQSTM1-positive inclusions existed within SMCs of Atg7cKO:apoeKO mice fed a Western diet ()). Whereas cytosolic inclusions were rarely found by TEM in SMCs of control Atg7f/f:apoeKO mice fed a Western diet, they were frequently observed in Atg7cKO:apoeKO mice fed a Western diet, particularly in the cytosol of their SMCs of the medial layer, under the plaque lesions ()). TEM demonstrated that these inclusions were composed of fibrillar structures and were similar to those described previously [Citation2,Citation5]. Intriguingly, TEM and the TUNEL assay showed that dying SMCs were not observed in control Atg7f/f:apoeKO mice fed a Western diet, but they were occasionally found in the media, on the plaque lesions of Atg7cKO:apoeKO mice fed a Western diet (,)). These observations were confirmed by quantitative analyses of TUNEL-positive areas of the media and plaques of these mice (,)). TEM demonstrated the presence of dying SMCs with pyknotic nuclei and the infiltration of inflammatory cells in the media of Atg7cKO:apoeKO mice, which were not observed in control Atg7f/f:apoeKO mice ()).
Figure 7. Atg7cKO:apoeKO mice under Western diet shows increased apoptotic cell death in plaque and media. (A) Representative histological images of abdominal aorta stained with SQSTM1 antibody from control Atg7f/f:apoeKO mice (Control) and Atg7cKO:apoeKO mice (cKO:KO) fed a Western diet. Scale bars: 50 μm. (B) Transmission electron microscopy (TEM) images of abdominal aorta from Control and cKO:KO under Western diet. The asterisks indicate cytosolic inclusions. The white arrowheads indicate SMC nuclei with normal morphology. The boxed areas indicate dying SMCs of cKO:KO with pyknotic nuclei, and their enlarged images are shown in the insets. The white arrow indicates inflammatory cell infiltration into the media. Scale bars: 1 μm in the upper panel, and 50 μm in the lower panel. (C) Representative images of the TUNEL assay and Red Counterstain C staining of the abdominal aorta of Control and cKO:KO fed a Western diet. Scale bars: 50 μm. (D) The area of TUNEL-positive lesions in the media and plaques of the abdominal aorta was evaluated. Data are mean ± SEM of 11 Control and 21 cKO:KO each. *P < 0.05 vs Control.
Atg7cKO:apoeKO mice fed a Western diet showed increased medial disruption
Atherosclerosis plaque growth is usually accompanied by compensatory outward arterial remodeling in response to shear stress alterations, in an attempt to normalize lumen diameter [Citation29]. Autopsy of Atg7cKO:apoeKO mice fed a Western diet suggest that some of these mice died of aortic aneurysm rupture ()). In addition, Atg7cKO:apoeKO mice fed a Western diet showed larger maximal external diameters of the suprarenal aorta than control Atg7f/f:apoeKO mice ()), suggesting that compensatory outward remodeling occurred. Thus, we evaluated the morphological changes associated with aneurysm formation and rupture.
Whereas the loss of medial SMCs leads to arterial remodeling [Citation29], we found that ACTA2-positive area was reduced not only in individual plaques but also in the media of Atg7cKO:apoeKO mice ()). In addition, although the number of LGALS3-positive cells was smaller in atherosclerotic plaques, accumulation of monocytes and macrophages were found in the media and adventitia of Atg7cKO:apoeKO mice fed a Western diet ()). A previous study demonstrated that the apoptosis of SMCs attracted inflammatory cells, including monocytes, macrophages, and leukocytes, in part through the production of CCL2 (chemokine [C-C motif] ligand 2), leading to aneurysm formation [Citation30]. Thus, we next analyzed the expression of CCL2. CCL2-positive area in Atg7cKO:apoeKO mice were larger than that in control Atg7f/f:apoeKO mice in the media (Figure 8(A,B)), and adventitia and perivascular tissue (,)). In particular, not only CCL2-positive macrophages but also CCL2-positive SMCs were found in the media and the adventitia. Thus, an increased local expression of CCL2 may be associated with the recruitment of monocytes and macrophages in the media, adventitia, and perivascular tissue in Atg7cKO:apoeKO mice fed a Western diet.
Figure 8. Atg7cKO:apoeKO mice under Western diet showed increased number of lamina breaks. (A) Representative histological sections of abdominal aorta stained with CCL2 from control Atg7f/f:apoeKO mice (Control) and Atg7cKO:apoeKO mice (cKO:KO) fed a Western diet. Scale bars: 50 μm. An enlarged view of the boxed area is shown on the right. arrowheads indicate CCL2-positive cells. Scale bars: 10 μm. (B) The percentage of CCL2-positive cells in the media were evaluated. Data are mean ± SEM of 4 Control and 7 cKO:KO each. *P < 0.001 vs Control. (C) The percentage of CCL2-positive cells in the adventitia and perivascular tissue were evaluated. Data are mean ± SEM of 4 Control and 7 cKO:KO each. *P < 0.001 vs Control. (D) Representative histological sections of abdominal aorta from Control and cKO:KO stained with Elastica van Gieson. Scale bars: 100 μm. Enlarged view of the boxed area is shown on the right. Arrows indicate the area of lamina breaks. Scale bars: 50 μm. (E) The number of lamina breaks was evaluated. Data are mean ± SEM of 11 Control and 21 cKO:KO each. *P < 0.05 vs Control. (F) Representative of abdominal aorta stained with Elastica van Gieson staining from Control and cKO:KO. Scale bars: 50 μm.(G)Representative histological sections of abdominal aorta stained with MMP9 from Control and cKO:KO fed a Western diet. Scale bars: 50 μm. An enlarged view of the boxed area is shown on the right. arrowheads indicate MMP9-positive cells. Scale bars: 10 μm. (H) The percentage of MMP9-positive cells in the media were evaluated. Data are mean ± SEM of 4 Control and 5 cKO:KO each. *P < 0.01 vs Control. (I) The percentages of MMP9-positive cells in the adventitia and perivascular tissue were evaluated. Data are mean ± SEM of 4 Control and 5 cKO:KO each. *P < 0.05 vs Control.
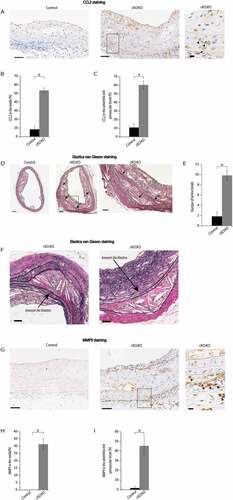
Elastin, which is one of the main components of the media in the aortic wall, maintains the tensile strength and structural integrity of the vascular wall. The fragmentation of elastic fibers is one of the most notable features of aneurysm formation [Citation31]. Thus, we assessed breaks in the lamina of Atg7cKO:apoeKO mice fed a Western diet. As shown in ,), the number of lamina breaks were significantly increased in Atg7cKO:apoeKO mice fed a Western diet compared with control Atg7f/f:apoeKO mice. In particular, these lesions were found almost exclusively at the proximal portion of atherosclerotic plaques. Importantly, local saccular aneurysm-like dilatations were seen in several regions, only in Atg7cKO:apoeKO mice fed a Western diet, where medial disruption was observed ()).
Accumulating lines of evidence suggest that matrix metalloproteinase-9 (MMP9), which is a member of the matrix metalloproteinases, is associated with abdominal aortic aneurysms through cleaving ELN (elastin) and degrading collagen fragments [Citation32,Citation33]. MMP9-positive areas in Atg7cKO:apoeKO mice were larger than those in control Atg7f/f:apoeKO mice in the media (,H)), and adventitia and perivascular tissue (,). However, very few MMP9-positive SMCs were observed in the media and adventitia of Atg7cKO:apoeKO mice. However, infiltrated monocytes, macrophages, neutrophils, plasma cells, and fibroblasts were accumulated in those areas ()), suggesting that these cells may be the main source of MMP9 production.
Autophagy-deficient SMCs are susceptible to 7-ketocholesterol (7-KC)-induced apoptotic cell death and CCL2 expression
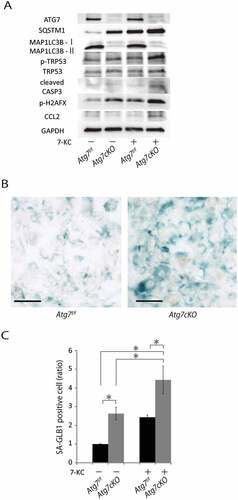
Atg7cKO:apoeKO mice showed a progression of atherosclerosis with outward arterial remodeling only when fed a Western diet. Our data suggest that enhanced apoptotic cell death and CCL2 expression in SMCs may play a key role in this phenotype. Thus, we investigated the effect of the atherogenic cholesterol 7-KC, which is a component of oxidized low-density lipoprotein-cholesterol, on the SMCs isolated from Atg7cKO mice. Although there were no differences in cleaved CASP3 (caspase 3) levels between SMCs from control Atg7f/f mice and SMCs from Atg7cKO mice, 7-KC increased cleaved CASP3 levels in both types of SMCs. The effect of 7-KC on cleaved CASP3 in SMCs of Atg7cKO mice is higher than in SMCs of control Atg7f/f mice (). In addition, 7-KC induced higher expression levels of H2AFX and higher phosphorylation levels of TRP53 in SMCs from Atg7cKO mice than SMCs from control Atg7f/f mice. In addition, Atg7cKO mice demonstrated stronger senescence-associated GLB1 staining than that of control Atg7f/f mice (,)). Along with increased susceptibility to apoptosis and senescence caused by 7-KC exposure, the expression levels of CCL2 in SMCs from Atg7cKO mice were significantly higher than those in SMCs from control Atg7f/f mice ()). These data showed that in SMCs from Atg7cKO mice, apoptotic cell death, cellular senescence, and CCL2 expression were cell-autonomously enhanced by 7-KC exposure.
Figure 9. Autophagy-deficient SMCs are susceptible to 7-KC-induced apoptotic cell death and CCL2 expression. SMCs from control Atg7f/f and Atg7cKO mice at 10 weeks of age were isolated and exposed to 7-KC 20μM for 16 h. (A) Western blot analysis of primary isolated SMCs for ATG7, SQSTM1, MAP1LC3B-I, MAP1LC3B-II, TRP53, cleaved CASP3, phospho-H2AFX and CCL2. Representative results from 3 independent experiments are shown. (B) Senescence-associated GLB1 staining of SMCs. Scale bars: 300 μm. (C) Relative number of SMCs stained with senescence-associated GLB1. Data are shown as the mean ± SEM of 4 independent experiments. *P < 0.05 vs control Atg7f/f mice. Data from control SMCs that were not exposed to 7-KC was set to 1.0.
Discussion
This study supports the importance of autophagy in SMCs for protection against the progression of atherosclerosis, adding further evidence to recent studies [Citation17,Citation18]. We found that not only the progression of atherosclerosis with enhanced SMC death, but also arterial outward remodeling with increased lamina breaks appeared to be associated with the increased frequency of aortic aneurysm rupture in Atg7cKO:apoeKO mice fed a Western diet. We demonstrated the important role of SMC autophagy in preventing aortic aneurysm rupture. In addition, we showed that Atg7cKO:apoeKO mice fed a Western diet is a mouse model that develops aortic aneurysm ruptures without using any special agents.
Grootaert et al. demonstrate that SMC-specific Atg7 deficiency promotes diet-induced atherogenesis [Citation18]. In that study, SMC-specific Atg7-deficient mice are more resistant to oxidative stress-induced cell death, and result in increased cell size, total collagen amount, migration capacity, and senescence, and a decrease in proliferation capacity in vitro. Consistent with these findings, we also found that SMCs isolated from Atg7cKO mice demonstrated no significant increase in cell death after 24 h of culture, and demonstrated resistance to exogenous high oxidative stress-induced cell death, increased senescence, and decreased proliferation capacity in vitro. In addition, we provided novel findings regarding the effect of 7-KC. Although Atg7 deficiency in SMCs showed resistance to oxidative stress-induced cell death, these cells were more susceptible to 7-KC-induced cell death accompanied by activation of the TRP53 pathway ()). Thus, the role of autophagy in the apoptosis of SMCs may vary depending on the stimuli. Given that enhanced apoptosis was observed in Atg7cKO:apoeKO mice fed a Western diet (), the phenomenon observed in in vitro cultures of SMCs with 7-KC may reflect the in vivo findings.
Regarding in vivo studies, Grootaert et al. find that SMC-specific Atg7 deficiency in apoeKO mice accelerates atherosclerotic plaque formation with increased cell death, necrotic lesion size, plaque macrophages, fibrous cap thickness, collagen content, and SMC senescence after being fed a Western diet for 10 weeks. However, plaque size, necrotic lesion size, and apoptotic cell number are no longer increased after 14 weeks on a Western diet, although fibrous cap thickness and collagen content are still increased in apoeKO mice deficient in Atg7 specifically in SMCs [Citation18]. In contrast, we found that plaque sizes in the abdominal aortic area of Atg7cKO:apoeKO mice fed a Western diet were increased, together with an increase in the necrotic cores, number of apoptotic cells, fibrous cap thickness (although thinner fibrous caps were observed in some advanced lesions), and reduction of the ACTA2-positive area and plaque macrophages. In addition, we demonstrated novel findings that Atg7cKO:apoeKO mice had an increased number of lamina breaks and morphological changes associated with aneurysm formation and rupturing, leading to reduced survival. Although the reason for these discrepancies is not clear, it may be owing to differences in the diet used for the experiments (1.25% cholesterol plus 0.5% sodium cholate in this study vs. 0.2% cholesterol in the previous study), arteries used for evaluation (thoracic and abdominal arteries in this study vs. brachiocephalic artery and aortic root in the previous study) and control mice (Atg7f/f vs. Atg7f/f Cre+). In addition, differences of intestinal bacterial flora in the mice of the 2 studies must be taken into consideration.
A previous study demonstrates that in advanced atherosclerotic plaques of humans, TUNEL-positive SMCs, macrophages, and endothelial cells are occasionally observed [Citation8]. On the one hand, similar to previous reports in mice [Citation8,Citation10], control apoeKO mice demonstrated a very low number of TUNEL-positive cells in atherosclerotic plaques. These observations suggest different pathological changes in atherosclerotic lesions between mice and humans. On the other hand, in Atg7cKO:apoeKO mice, TUNEL-positive areas were widely observed not only within atherosclerotic plaques but also in the media with a significant reduction in ACTA2-positive areas. Notably, TUNEL-positive areas were found even in Atg7cKO:apoeKO mice at 10 weeks of age. Thus, autophagy deficiency in SMCs may result in increased cell death, probably predominantly in SMCs, and this cell death may be involved in the progression of atherosclerosis, which may share some features with human atherosclerotic lesions. Given that autophagy deficiency results in the increased apoptosis of invariant natural killer cells [Citation34], autophagy deficiency may result in a cell-type specific enhancement of apoptosis.
In this study, SMC death by autophagy deficiency was associated with plaque growth. Regarding the causal association, a previous study demonstrates that chronic apoptosis in SMCs is sufficient to promote atherosclerosis with marked fibrous cap thinning, expansion of the necrotic core, increased calcification, and increased medial degeneration [Citation10]. These features appear to be similar to the atherosclerotic lesions observed in Atg7cKO:apoeKO mice fed a Western diet. In addition, SMC apoptosis was shown to cause an increased release of inflammatory cytokines, leading to the expansion of atherosclerotic plaques through recruiting monocytes and macrophages into atherosclerotic lesions, particularly at the initial stages of atherosclerosis [Citation9,Citation10,Citation35]. In contrast, the accumulation of macrophages at advanced stages of atherosclerosis in Atg7cKO:apoeKO mice was less than that of control Atg7f/f:apoeKO mice, consistent with a previous report on enhanced atherosclerosis caused by chronic apoptosis in SMCs [Citation10]. A decreased accumulation of macrophages may reflect an increase in macrophage cell death, resulting in an increase in the necrotic core. Whereas autophagy deficiency in SMCs demonstrated some features of plaque vulnerability, such as an enlarged necrotic core and a reduced fibrous cap in some places, increased SMC death may also contribute to a reduced ability to synthesize extracellular matrix proteins, leading to increased plaque vulnerability. Thus, SMC death caused by autophagy deficiency in SMCs may possibly promote the progression of atherosclerosis.
We found that the reduction in the density of SMCs by a deficiency of SMC autophagy may be associated with increased monocyte and macrophage accumulation in the media and adventitia, number of lamina breaks, and compensatory outward remodeling. The loss of medial SMCs may reduce the ability of the media to synthesize matrix proteins, leading to medial vulnerability. In addition, we found that SMCs from Atg7cKO mice are susceptible to enhanced CCL2 expression with enhanced phosphorylation of TRP53 by 7-KC, whereas CCL2 expression [Citation27]. Indeed, CCL2-positive SMCs were increased in the media of Atg7cKO:apoeKO mice fed a Western diet. Taken together, CCL2 expression via enhanced cellular senescence induced by autophagic failure and the exposure of atherogenic lipids appeared to trigger the accumulation of monocytes and macrophages in the vascular wall () and )). Furthermore, given that elastic fibers are degraded by proteolytic enzymes, including MMP9, that were produced from the infiltrated macrophages, we observed an increased number of MMP9-positive macrophages in the media, adventitia, and perivascular tissue of Atg7cKO:apoeKO mice fed a Western diet (). Accordingly, these molecules appear to be involved in the susceptibility of the formation and rupture of aneurysms in Atg7cKO:apoeKO mice fed a Western diet.
Although the medial vulnerability and the fragmentation of elastic fibers are considered as the most important features of the wall in the process of aneurysm formation [Citation31], we found only a few lesions of local saccular aneurysm-like dilatations. This result suggests that alterations in hemodynamic features, such as increased blood pressure, may be required to promote the formation of advanced aneurysms as well as their rupture. In this regard, autophagy deficiency in SMCs did not contribute to the increase in blood pressure, consistent with a recent report [Citation17]. Notwithstanding, it should be noted that lesions of local saccular aneurysm-like dilatations were rarely found in control Atg7f/f:apoeKO mice that did not receive any stimuli, suggesting that SMC autophagy plays a crucial role in maintaining medial strength. Conversely, although Atg7cKO:apoeKO mice fed a Western diet may be used as a model of aortic aneurysm without requiring any special agents, regarding their phenotypic predictability, the widely used AGT II/angiotensin II fusion model maybe a more reliable model [Citation36].
In conclusion, we demonstrated that autophagy deficiency in SMCs promotes atherosclerosis at least in part through SMC death. Based on the possible implication of SMC autophagy, the induction of autophagy may be a potential novel therapeutic strategy against the progression of atherosclerosis.
Materials and methods
Animals
The study protocol was reviewed and approved by the Animal Care and Use Committee of Juntendo University. apoe-null mice and TaglnCre+/0 mice purchased from the Jackson Laboratory were housed in specific pathogen-free barrier facilities. Atg7f/f mice [Citation37] were bred with TaglnCre+/0 mice to generate mice homologous for the floxed allele and hemizygious for the Cre transgene (Atg7cKO), as smooth muscle-specific Atg7-deficient mice (backcrossed at least 10 times on a C57BL/6 background). Littermate controls were homozygous for the floxed allele Atg7 gene, but did not carry the Cre transgene (Atg7f/f) [Citation38]. Then, Atg7cKO and apoeKO mice (C57BL/6 background) were bred to generate Atg7cKO:apoeKO mice and control Atg7f/f:apoeKO mice used for this study (Charles River, Ishioka, Ibaraki, Japan). Mice were maintained under a 12-h light/dark cycle, and fed a standard rodent diet (22.6% protein, 53.8% carbohydrate, 5.6% fat, 6.6% mineral and vitamin mixture, and 3.3% fiber; total: 356 kcal/100 g, CRF-1, Charles River Japan) with water ad libitum. At the age of 10 weeks, mice were continued to be fed a normal chow diet or were fed a Western diet (1.25% cholesterol, 15% fat, and 0.5% sodium cholate) (EPS EKISHIN Co., D12108C) which promotes atherosclerosis in mice.
Laboratory data
Blood samples were collected when the mice were sacrificed. The concentrations of cholesterol, triglyceride, chylomicron, very-low-density lipoprotein, low-density-lipoprotein cholesterol, and high-density-lipoprotein cholesterol were measured by Skylight Biotech, Inc. (Tokyo, Japan).
Blood pressure measurements
Blood pressure (BP) was measured by a non-invasive tail-cuff method using a Model UR-5000 system (Ueda Co., Tokyo, Japan). For BP measurements, mice were placed in a warm mouse restraining apparatus. A cuff was placed around the tail and inflated until blood flow was occluded, and then released. The first pulses of arterial flow that were detected were recorded as systolic and diastolic BP. Three BP measurements were performed at the end of the study and BP was determined for each animal by averaging the obtained values. The mean systolic and diastolic BP was used for representing the BP as mean systemic arterial pressure.
Cell culture
Murine aortic SMCs were isolated and cultured as previously described [Citation39]. Mouse aortic SMCs were maintained in Dulbecco Modified Eagle Medium containing 20% fetal bovine serum (FBS), 100 units/mL penicillin, 100 μg/mL streptomycin, 2.5 μg/mL amphotericin B, and 400 μg/mL L-glutamine. Cells were used between passages 3 and 7 for the experiments and individual experiments were repeated at least 3 times with different preparations of cells. The medium was changed every 48 h. For the experiments, SMCs were plated on 6-well plates at 10 × 104 cells per well. Cell number counts were performed using a hemocytometer on days 2, 4, 6, and 8.
Quantification of atherosclerotic lesions
The aorta was flushed with normal saline followed by 10% buffered formalin, as described previously [Citation40–Citation42]. The aorta was excised from the root to the common iliac artery. Then, the connective and adipose tissues were removed from the aorta and the entire aorta was stained with oil red O (MUTO PURE CHEMICALS CO.,LTD, Tokyo, Japan, 40,491). Images were captured with a digital single-lens reflex camera and maximal diameters of the suprarenal abdominal aorta were measured with ImagePro Plus software. The percentage of oil red O-positive area was calculated by dividing oil red O-positive areas by the area of the entire aorta (from the ascending aorta to the right suprarenal artery). For quantitative analysis of atherosclerotic lesions, the aneurysm and atherosclerosis-prone suprarenal portion of the abdominal aorta was embedded in optimal cutting temperature compound, then 4-μm thick cross-sections at 50-μm intervals were prepared with a cryostat. Twelve consecutive sections were taken sequentially, allowed to dry at room temperature for 30 min, and stained with hematoxylin & eosin (MUTO PURE CHEMICALS CO.,LTD, 32042, 30022), Elastica van Gieson (MUTO PURE CHEMICALS CO.,LTD, 40322,40341,40351,40362,40372), or Picrosirius red stain (Polysciences, Inc., 24901–250) to evaluate atherosclerotic area. Then, immunohistochemistry was performed using a rat anti-mouse or human LGALS3/MAC-2 monoclonal antibody (Cedarlane Laboratories Ltd., CL8942AP), mouse anti-human ACTA2/α-SMA antibody (Dako, M0851), guinea pig anti-human SQSTM1/p62 polyclonal antibody (Progen Biotechnik GmbH, GP62-C), rabbit anti-PCNA antibody (Santa Cruz Biotechnology, sc-7907), rabbit anti-CCL2/MCP-1 (Abcam, ab7202), or rabbit anti-MMP9 (Abcam, ab38898). The TUNEL assay was performed using VasoTACS™ in situ Apoptosis detection kit (TREVIGEN Inc., 4826–30-K) including Red Counterstain C, an acidophilic cytoplasmic countrstain (TREVIGEN Inc., 4800–30-19),according to the manufacturer’s instructions. The percentage of ACTA2-positive area, LGALS3-positive area, necrotic core defined as the area including cholesterol crystals and surrounding necrotic products analyzed by staining with hematoxylin and eosin, collagen-positive area analyzed by staining with the Picrosirius red stain and TUNEL-positive area were calculated by each area divided by the atherosclerotic area. The percentage of CCL2- or MMP9-positive cells were calculated by dividing CCL2- or MMP9-positive cells by the total number of cells in the field of lesion examined. The percentage of cross-sectional stenosis area was calculated by dividing the area of the non-occluded region of the lumen by the area of the region inside the outer layer of the tunica media. The medial lamina breaks were defined as apparent gaps in the continuity of elastic lamina upon Elastica van Gieson staining. Images were captured with ImagePro Plus software. The number of immunopositive cells were counted using 3 images per animal.
Electron microscopy
TEM analyses were performed as previously described [Citation5]. Briefly, primary SMCs and mice were fixed by immersion and cardiac perfusion, respectively, with 2% glutaraldehyde in 0.1 mol/L PB (pH 7.4) (LSI Medience Corporation, RM102-5L). Samples were embedded in epoxy resin. Semi-thin sections were cut and stained with toluidine blue. Ultrathin sections (80 nm thick) were cut and observed with a Hitachi HT7700 electron microscope (Hitachi, Tokyo, Japan).
Preparation of cells and Western blot analysis
To assess the effect of oxidative stress, SMCs were pretreated with or without the antioxidant N–acetylcysteine (NAC; Sigma-Aldrich, A9165) at 10 mM for 10 min, and then were cultured for up to 48 h. With respect to assessing the effect of atherogenic cholesterol, SMCs were exposed to 7-ketocholesterol (7-KC; Sigma-Aldrich, C2394) for up to 16 h. All samples were sonicated on ice and centrifuged at 15,000 × g at 4°C for 15 min. The supernatants were subjected to Western blot analysis using primary antibodies, as follows: guinea pig anti-human SQSTM1/p62 antibody (Progen Biotechnik GmbH, GP62-C), rabbit anti-MAP1LC3B/LC3 antibody (Sigma-Aldrich, L7543), mouse anti-TRP53 (1C12) antibody (Cell Signaling Technology, 2524), rabbit anti-phospho-TRP53 (Ser15) antibody (Cell Signaling Technology, 9284), rabbit anti-BBC3/PUMA antibody (Cell Signaling Technology, 7467), rabbit anti-phospho-H2AFX antibody (ser1339) (Cell Signaling Technology, 9718), rabbit anti-ATG7 antibody [Citation43], rabbit anti-GAPDH (glyceraldehyde-3-phosphate dehydrogenase) antibody (Cell Signaling Technology, 2118), rabbit anti-cleaved CASP3 (Cell Signaling Technology, 9661), and rabbit anti-CCL2/MCP-1 (Cell Signaling Technology, 2029) as described previously [Citation40,Citation42].
Cell death detection by enzyme-linked immunosorbent assay (ELISA)
Cells were incubated for 48 h in 96-well plates with medium containing 20% FBS with or without 10 mM NAC, centrifuged at 200x g for 10 min, and the supernatants were separated. The cell pellets were treated with lysis buffer for 30 min and centrifuged again. The cell lysates and supernatants were used for the cell death assay using a Cell Death Detection Kit (Roche Diagnostics, 11774425001) to detect histone-associated DNA fragments (mononucleosomes and oligonucleosomes) in the cytoplasm and released from the cell, by a photometric enzyme immunoassay according to the manufacturer’s protocol.
Analysis of cell senescence
SMCs were plated at a density of 10 × 104 cells/well in 6-well culture plates with complete media and cultured for 48 h in medium containing 20% FBS or were exposed to 7-KC 20 μM for 16 h. SMCs were stained with a senescence-associated GLB1 Staining Kit (Cell Biolabs Inc., CBA-230) according to the manufaturer’s instructions. The blue stained senescent cells were counted using a light microscope.
Cell proliferation assay
To evaluate the growth response of cultured SMCs to 20% FBS, the BrdU incorporation assay was performed using a cell proliferation kit (Roche Diagnostics, 11647229001) according to the manufacturer’s instructions. Briefly, SMCs were plated at a density of 3,000 cells/well in 96-well culture plates with complete medium. At 60% to 70% confluence, the SMCs were stimulated with 20% FBS for 24 h. Then, BrdU solution (10 μM) was added to the cells and the cells were cultured for a further 4 h. Next, the cells were dried and fixed, and the cellular DNA was denatured with FixDenat solution (Roche Diagnostics, 11647229001) for 30 min at room temperature. A rat anti-BrdU monoclonal antibody conjugated with peroxidase (Roche Diagnostics, 11647229001) was added to the culture plates and incubated again at room temperature for 90 min. Finally, tetramethylbenzidine was added before incubation for 15 min at room temperature. Absorbance at 370 nm was measured using a microplate reader.
Statistical analysis
Differences between 2 groups were examined for statistical significance using the Mann-Whitney t test. Comparisons of more than 3 groups were conducted by one-way analysis of variance followed by the Scheffé method as the post-hoc test. The cumulative event-free rates were estimated from Kaplan Meier survival curves and differences were tested by the log-rank test. P values less than 0.05 were considered to indicate a statistically significant difference between 2 groups. Results are expressed as the mean ± SEM. Data were analyzed using the Statistical Package for Social Science computer software program, version 18 (SPSS Inc., Chicago, IL, USA).
Abbreviations
| ACTA2 | = | actin, alpha 2, smooth muscle, aorta |
| APOE | = | apolipoprotein E |
| BBC3 | = | BCL2 binding component 3 |
| BP | = | blood pressure |
| BrdU | = | bromodeoxyuridine |
| CASP3 | = | caspase 3 |
| CCL2 | = | chemokine (C-C motif) ligand 2 |
| ELISA | = | enzyme-linked immunosorbent assay |
| FBS | = | fetal bovine serum |
| GLB1 | = | galactosidase, beta 1 |
| H2AFX | = | H2A histone family, member X |
| 7-KC | = | 7-ketocholesterol |
| LGALS3 | = | lectin, galactose binding, soluble 3 |
| MAP1LC3B | = | microtubule-associated protein 1 light chain 3 beta |
| MMP9 | = | matrix metallopeptidase 9 |
| NAC | = | N-acetylcysteine |
| PCNA | = | proliferating cell nuclear antigen |
| SMCs | = | smooth muscle cells |
| SQSTM1 | = | sequestosome 1 |
| TEM | = | transmission electron microscopy |
| TAGLN | = | transgelin |
| TRP53/TP53 | = | transformation related protein 53 |
Supplemental Material
Download Zip (6.2 MB)Acknowledgments
We thank Dr. Masaaki Komatsu (Niigata University Graduate School of Medical and Dental Sciences) for providing Atg7f/f mice, and Ms. N. Daimaru, Ms. E. Magoshi, Ms. H. Hibino, and Ms. S. Ishikawa for their excellent technical assistance.
Disclosure statement
No potential conflict of interest was reported by the authors.
Supplementary material
Supplementary data for this article can be accessed here.
Additional information
Funding
Related Research Data
References
- Klionsky DJ. Autophagy: from phenomenology to molecular understanding in less than a decade. Nat Rev Mol Cell Biol. 2007 Nov;8(11):931–937. PubMed PMID: 17712358.
- Komatsu M, Waguri S, Chiba T, et al. Loss of autophagy in the central nervous system causes neurodegeneration in mice. Nature. 2006 Jun 15;441(7095):880–884. PubMed PMID: 16625205.
- Lin L, Baehrecke EH. Autophagy, cell death, and cancer. Mol Cell Oncol. 2015 Jul-Sep;2(3):e985913. PubMed PMID: 27308466; PubMed Central PMCID: PMC4905302.
- Nakai A, Yamaguchi O, Takeda T, et al. The role of autophagy in cardiomyocytes in the basal state and in response to hemodynamic stress. Nat Med. 2007 May;13(5):619–624. PubMed PMID: 17450150.
- Ebato C, Uchida T, Arakawa M, et al. Autophagy is important in islet homeostasis and compensatory increase of beta cell mass in response to high-fat diet. Cell Metab. 2008 Oct;8(4):325–332. PubMed PMID: 18840363.
- Jones SA, Mills KH, Harris J. Autophagy and inflammatory diseases. Immunol Cell Biol. 2013 Mar;91(3):250–258. PubMed PMID: 23318657.
- Ross R. Atherosclerosis–an inflammatory disease. N Engl J Med. 1999 Jan 14;340(2):115–126. PubMed PMID: 9887164.
- Lutgens E, de Muinck ED, Kitslaar PJ, et al. Biphasic pattern of cell turnover characterizes the progression from fatty streaks to ruptured human atherosclerotic plaques. Cardiovasc Res. 1999 Feb;41(2):473–479. PubMed PMID: 10341847.
- Clarke MC, Figg N, Maguire JJ, et al. Apoptosis of vascular smooth muscle cells induces features of plaque vulnerability in atherosclerosis. Nat Med. 2006 Sep;12(9):1075–1080. PubMed PMID: 16892061.
- Clarke MC, Littlewood TD, Figg N, et al. Chronic apoptosis of vascular smooth muscle cells accelerates atherosclerosis and promotes calcification and medial degeneration. Circ Res. 2008 Jun 20;102(12):1529–1538. PubMed PMID: 18497329.
- Henderson EL, Geng YJ, Sukhova GK, et al. Death of smooth muscle cells and expression of mediators of apoptosis by T lymphocytes in human abdominal aortic aneurysms. Circulation. 1999 Jan 5- 12;99(1):96–104. PubMed PMID: 9884385.
- Salabei JK, Hill BG. Implications of autophagy for vascular smooth muscle cell function and plasticity. Free Radic Biol Med. 2013 Dec;65:693–703. PubMed PMID: 23938401; PubMed Central PMCID: PMC3859773.
- Martinet W, De Meyer GR. Autophagy in atherosclerosis: a cell survival and death phenomenon with therapeutic potential. Circ Res. 2009 Feb 13;104(3):304–317. PubMed PMID: 19213965.
- Hill BG, Haberzettl P, Ahmed Y, et al. Unsaturated lipid peroxidation-derived aldehydes activate autophagy in vascular smooth-muscle cells. Biochem J. 2008 Mar 15;410(3):525–534. PubMed PMID: 18052926.
- Chen YC, Bui AV, Diesch J, et al. A novel mouse model of atherosclerotic plaque instability for drug testing and mechanistic/therapeutic discoveries using gene and microRNA expression profiling. Circ Res. 2013 Jul 19;113(3):252–265. PubMed PMID: 23748430.
- Xu K, Yang Y, Yan M, et al. Autophagy plays a protective role in free cholesterol overload-induced death of smooth muscle cells. J Lipid Res. 2010 Sep;51(9):2581–2590. PubMed PMID: 20484746; PubMed Central PMCID: PMC2918441.
- Michiels CF, Fransen P, De Munck DG, et al. Defective autophagy in vascular smooth muscle cells alters contractility and Ca2+ homeostasis in mice. Am J Physiol Heart Circ Physiol. 2015 Mar 15;308(6):H557–67. PubMed PMID: 25576626.
- Grootaert MO, da Costa Martins PA, Bitsch N, et al. Defective autophagy in vascular smooth muscle cells accelerates senescence and promotes neointima formation and atherogenesis. Autophagy. 2015 Nov 02;11(11):2014–2032. PubMed PMID: 26391655; PubMed Central PMCID: PMC4824610.
- Holtwick R, Gotthardt M, Skryabin B, et al. Smooth muscle-selective deletion of guanylyl cyclase-A prevents the acute but not chronic effects of ANP on blood pressure. Proc Natl Acad Sci USA. 2002 May 14;99(10):7142–7147. PubMed PMID: 11997476; PubMed Central PMCID: PMC124542.
- Mizushima N, Yoshimori T, Levine B. Methods in mammalian autophagy research. Cell. 2010 Feb 5;140(3):313–326. PubMed PMID: 20144757; PubMed Central PMCID: PMC2852113.
- Madamanchi NR, Vendrov A, Runge MS. Oxidative stress and vascular disease. Arterioscler Thromb Vasc Biol. 2005 Jan;25(1):29–38. PubMed PMID: 15539615.
- Kuivaniemi H, Ryer EJ, Elmore JR, et al. Update on abdominal aortic aneurysm research: from clinical to genetic studies. Scientifica. 2014;2014:564734. PubMed PMID: 24834361; PubMed Central PMCID: PMC4009235.
- Sandberg EM, Sayeski PP. Jak2 tyrosine kinase mediates oxidative stress-induced apoptosis in vascular smooth muscle cells. J Biol Chem. 2004 Aug 13;279(33):34547–34552. PubMed PMID: 15159394.
- Clowes AW, Clowes MM, Reidy MA. Kinetics of cellular proliferation after arterial injury. III. Endothelial and smooth muscle growth in chronically denuded vessels. Lab Invest. 1986 Mar;54(3):295–303. PubMed PMID: 3512908.
- Saraff K, Babamusta F, Cassis LA, et al. Aortic dissection precedes formation of aneurysms and atherosclerosis in angiotensin II-infused, apolipoprotein E-deficient mice. Arterioscler Thromb Vasc Biol. 2003 Sep 1;23(9):1621–1626. PubMed PMID: 12855482.
- Finn AV, Nakano M, Narula J, et al. Concept of vulnerable/unstable plaque. Arterioscler Thromb Vasc Biol. 2010 Jul;30(7):1282–1292. PubMed PMID: 20554950.
- Bennett MR, Sinha S, Owens GK. Vascular Smooth Muscle Cells in Atherosclerosis. Circ Res. 2016 Feb 19;118(4):692–702. PubMed PMID: 26892967; PubMed Central PMCID: PMC4762053.
- Razani B, Feng C, Coleman T, et al. Autophagy links inflammasomes to atherosclerotic progression. Cell Metab. 2012 Apr 04;15(4):534–544. PubMed PMID: 22440612; PubMed Central PMCID: PMC3322320.
- Ward MR, Pasterkamp G, Yeung AC, et al. Arterial remodeling - Mechanisms and clinical implications. Circulation. 2000 Sep 5;102(10):1186–1191. PubMed PMID: WOS:000089157400020; English.
- Yamanouchi D, Morgan S, Kato K, et al. Effects of caspase inhibitor on angiotensin II-induced abdominal aortic aneurysm in apolipoprotein E-deficient mice. Arterioscler Thromb Vasc Biol. 2010 Apr;30(4):702–707. PubMed PMID: 20075419.
- Sakalihasan N, Limet R, Defawe OD. Abdominal aortic aneurysm. Lancet. 2005 Apr 30;365(9470):1577–1589. PubMed PMID: WOS:000228754800030; English.
- Lu H, Aikawa M. Many faces of matrix metalloproteinases in aortic aneurysms. Arterioscler Thromb Vasc Biol. 2015 Apr;35(4):752–754. PubMed PMID: 25810296.
- Howatt DA, Dajee M, Xie X, et al. Relaxin and matrix metalloproteinase-9 in Angiotensin II-Induced abdominal aortic aneurysms. Circ J. 2017 May 25;81(6):888–890. PubMed PMID: 28420827.
- Salio M, Puleston DJ, Mathan TS, et al. Essential role for autophagy during invariant NKT cell development. Proc Natl Acad Sci USA. 2014 Dec 30;111(52):E5678–87. PubMed PMID: 25512546; PubMed Central PMCID: PMC4284579.
- Schaub FJ, Han DK, Liles WC, et al. Fas/FADD-mediated activation of a specific program of inflammatory gene expression in vascular smooth muscle cells. Nat Med. 2000 Jul;6(7):790–796. PubMed PMID: 10888928.
- Lu H, Howatt DA, Balakrishnan A, et al. Subcutaneous angiotensin II Infusion using osmotic pumps induces aortic aneurysms in mice. JoVE. 2015 Sep;28(103). PubMed PMID: 26436287; PubMed Central PMCID: PMC4692630. DOI:10.3791/53191
- Komatsu M, Waguri S, Ueno T, et al. Impairment of starvation-induced and constitutive autophagy in Atg7-deficient mice. J Cell Biol. 2005 May 9;169(3):425–434. PubMed PMID: 15866887; PubMed Central PMCID: PMC2171928.
- Subramanian V, Golledge J, Ijaz T, et al. Pioglitazone-induced reductions in atherosclerosis occur via smooth muscle cell-specific interaction with PPAR{gamma}. Circ Res. 2010 Oct 15;107(8):953–958. PubMed PMID: 20798360; PubMed Central PMCID: PMC2963621.
- Nomiyama T, Nakamachi T, Gizard F, et al. The NR4A orphan nuclear receptor NOR1 is induced by platelet-derived growth factor and mediates vascular smooth muscle cell proliferation. J Biol Chem. 2006 Nov 3;281(44):33467–33476. PubMed PMID: 16945922.
- Arakawa M, Mita T, Azuma K, et al. Inhibition of monocyte adhesion to endothelial cells and attenuation of atherosclerotic lesion by a glucagon-like peptide-1 receptor agonist, exendin-4. Diabetes. 2010 Apr;59(4):1030–1037. JST.JSTAGE/endocrj/52.683 [pii]. PubMed PMID: 16410659; eng.
- Mita T, Otsuka A, Azuma K, et al. Swings in blood glucose levels accelerate atherogenesis in apolipoprotein E-deficient mice. Biochem Biophys Res Commun. 2007 Jul 6;358(3):679–685. PubMed PMID: 17506980.
- Mita T, Goto H, Azuma K, et al. Impact of insulin resistance on enhanced monocyte adhesion to endothelial cells and atherosclerogenesis independent of LDL cholesterol level. Biochem Biophys Res Commun. 2010 May 14;395(4):477–483. S0006-291X(07)00820-0[pii]10.1016/j.bbrc.2007.04.118. PubMed PMID: 17506980; eng.
- Tanida I, Mizushima N, Kiyooka M, et al. Apg7p/Cvt2p: A novel protein-activating enzyme essential for autophagy. Mol Biol Cell. 1999 May;10(5):1367–1379. PubMed PMID: 10233150; PubMed Central PMCID: PMC25280.