
ABSTRACT
Flavokawain B (FKB), a natural kava chalcone, displays potent antitumor activity in various types of cancer. The mechanism of action, however, remains unclear. Here, we evaluated the efficacy of FKB in the treatment of human glioblastoma multiforme (GBM) as well as the molecular basis for its inhibitory effects in cancer. Approximately 60% of GBM cells became senescent after treatment with FKB as assessed in the senescence-associated (SA)-GLB1/SA-β-galactosidase assay. The cellular process of autophagy potentially contributed to the establishment of senescence. Transmission electron microscopy revealed the formation of autophagic vesicles under FKB treatment, and MAP1LC3B (microtubule associated protein 1 light chain 3 beta)-II was increased. Transfection of ATG5 or ATG7 small interfering RNAs (siRNAs) inhibited FKB-induced autophagy in U251 cells. Western blot revealed that molecular components of the endoplasmic reticulum stress pathway were activated, including ATF4 (activating transcription factor 4) and DDIT3 (DNA damage inducible transcript 3), while levels of TRIB3 (tribbles pseudokinase 3) increased. In addition, based on the phosphorylation status, the AKT-MTOR-RPS6KB1 pathway was inhibited, which induced autophagy in GBM cells. Inhibition of autophagy by autophagy inhibitors 3-methyladenine and chloroquine or knockdown of ATG5 or ATG7 caused FKB-treated U251 cells to switch from senescence to apoptosis. Finally, knockdown of ATG5 or treatment with chloroquine in combination with FKB, significantly inhibited tumor growth in vivo. Our results demonstrated that FKB induced protective autophagy through the ATF4-DDIT3-TRIB3-AKT-MTOR-RPS6KB1 signaling pathway in GBM cells, indicating that the combination treatment of FKB with autophagy inhibitors may potentially be an effective therapeutic strategy for GBM.
Abbreviations: 3-MA: 3-methyladenine; 4-PBA: 4-phenylbutyrate; AKT: AKT serine/threonine kinase; ATF4: activating transcription factor 4; ATG: autophagy related; CASP3: caspase 3; CCK-8: cell counting kit-8; CDKN1A: cyclin-dependent kinase inhibitor 1A; CQ: chloroquine; DDIT3: DNA damage inducible transcript 3; DMEM: Dulbecco’s modified Eagle’s medium; EIF2A: eukaryotic translation initiation factor 2A; EIF2AK3: eukaryotic translation initiation factor 2 alpha kinase 3; ER: endoplasmic reticulum; FKB: flavokawain B; GAPDH: glyceraldehyde-3-phosphate dehydrogenase; GBM: glioblastoma multiforme; GFP: green fluorescent protein; HSPA5: heat shock protein family A (Hsp70) member 5; MAP1LC3B: microtubule associated protein 1 light chain 3 beta; MTOR: mechanistic target of rapamycin kinase; PARP1: poly(ADP-ribose) polymerase; 1RPS6KB1: ribosomal protein S6 kinase B1; SA-GLB1: senescence-associated galactosidase beta 1; siRNA: short interfering RNA; SQSTM1: sequestosome 1; TEM: transmission electron microscopy; TRIB3: tribbles pseudokinase 3; TUNEL: deoxynucleotidyl transferase-mediated dUTP nick-end labeling
Introduction
Glioblastoma multiforme (GBM) is a highly aggressive malignant primary human brain tumor. Tumors are characterized by a high proliferation rate and chemoresistance [Citation1]. Despite advances in combination treatments consisting of radiation and chemotherapy following surgical resection, the 5-year survival rate of WHO grade IV glioblastoma remains at less than 5% [Citation1,Citation2]. Although significant advances have been made in our understanding of the molecular status of this tumor type, novel efficacious therapeutic avenues are critically needed.
Although cancers, such as GBM, may be intrinsically resistant to therapy, the ability to engage survival mechanisms in response to treatment potentially further reduces efficacy of any promising agent [Citation3–Citation5] Autophagy is one such conserved cellular pathway. The process removes dysfunctional or damaged organelles through lysosomal degradation and recycles the products for cellular metabolic needs [Citation6]. Autophagy is thus essential for maintaining homeostasis and mediates resistance to anticancer therapies such as radiation, chemotherapy and some targeted therapies [Citation7]. Increasing evidence supports that treatment with autophagy inhibitors such as bafilomycin A1 and chloroquine (CQ) potentiates the effects of different cancer treatments [Citation8,Citation9]. These studies have led to the initiation of multiple clinical trials combining chemotherapeutic agents and autophagy inhibitors for various cancer types [Citation10]. However, the role of autophagy in cancer is still controversial as it may suppress tumors during cancer development but promote cell survival during cancer progression [Citation11]. Thus, the specific role of autophagy seems to be highly cell type and context dependent.
Natural products have received recent interest in the discovery of novel anticancer therapeutic agents as they have long been used as alternative remedies for a variety of diseases, including cancer, with relatively few side effects [Citation12,Citation13]. Flavokawain B (FKB), a natural kava chalcone, has displayed anticancer activity in various types of cancer, such as osteosarcoma, lung cancer, leiomyosarcoma, and prostate cancer [Citation14–Citation17]. The cancer specific cytotoxic activity of FKB has been mainly attributed to induction of cell cycle arrest and apoptosis characterized by the generation of intracellular reactive oxygen species and the upregulation of BCL2L11, a proapoptotic molecule [Citation18,Citation19].
The role that FKB plays in cell death in GBM cells and whether it induces autophagy remain largely unclear. Here, we investigated the chemotherapeutic potential of FKB in human GBM cell populations in vitro and in vivo. While we report that that FKB does inhibit GBM cell growth largely through the processes of senescence and autophagy, we were able to promote apoptosis by combining treatment with autophagy inhibitors. These results support the strategy of combination therapy of FKB and autophagy inhibitors in the treatment of human GBM.
Results
FKB inhibits proliferation of GBM cells in vitro
To begin to determine whether FKB might be effective against GBM, FKB treatment was first evaluated in U251, U87, T98, and P3 cells in vitro, using the cell viability assay CCK-8 (). Cells were treated with differing concentrations of FKB in vitro, and viability was assessed at 12, 24, and 48 h. Decreases in cell viability (~ 50%) relative to untreated cells were statistically significant at 48 h in 3 μg/mL FKB for all cell lines.
Figure 1. FKB inhibits proliferation of GBM cells. (A) Graphic representation of results from CCK-8 assays to determine cell viability of U251, U87, T98, and P3 cells treated with different concentrations of FKB for 24, 48 and 72 h. Data points are the percentage (%; OD450 treated/OD450 untreated) relative to untreated cells at that time point. (B) Fluorescence images of EdU incorporation in U251, U87, and T98 cells treated with FKB or DMSO for 48 h. Cells were stained with Apollo 567 (red) to detect EdU and DAPI (blue) to highlight nuclei, and images were superimposed (scale bars: 50 μm). (C) Graphic representation of cell number and EdU content of U251, U87, and T98 cells treated with different concentrations of FKB for 48 h. The percentage of EdU+ cells (EdU+/DAPI+ × 100%) was determined in 4 random fields per sample. All data are expressed as the mean ± SD of values from experiments performed in triplicate. *P < 0.05 and ** P < 0.01 compared to controls.
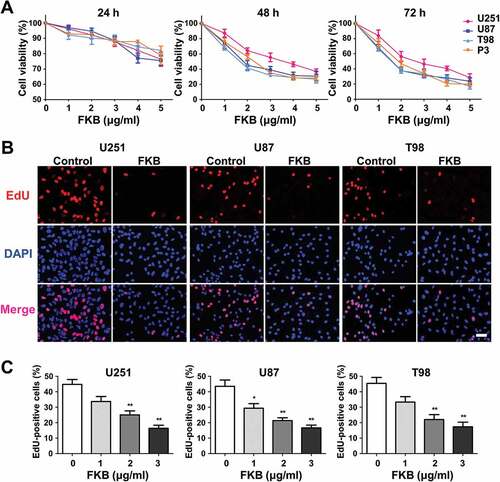
Quantification of EdU incorporation also revealed a statistically significant decrease in proliferation for U251, U87, and T98 cells lines after exposure to FKB at 3 μg/mL for 48 h (~ 45% vs ~ 15%, untreated vs treated cells). These results indicated that FKB potently arrested proliferation in GBM cells and in a dose-dependent manner ( and ).
FKB induces cellular senescence in GBM cells in vitro
Chemotherapeutic agents lead to decreases in cancer cell proliferation through a variety of biological processes, including apoptosis and cellular senescence. GBM cells have been shown to undergo apoptosis or cellular senescence in response to ionizing radiation, for example, which is mediated by the PTEN tumor suppressor protein [Citation20]. In the case of FKB, studies have shown that the molecule induces apoptosis in a variety of cancer cell types [Citation15,Citation16,Citation21]. We therefore investigated first whether FKB induced apoptosis in GBM cells. Increases in the percentage of apoptotic cells after FKB treatment were not statistically significant in PTEN-mutated cell lines, U251, U87, T98, and P3, or the PTEN wild-type cell lines, LN18 and LN229 (Figure S1). These results indicated that the inhibitory effect of FKB observed in these cell lines was not through induction of apoptosis.
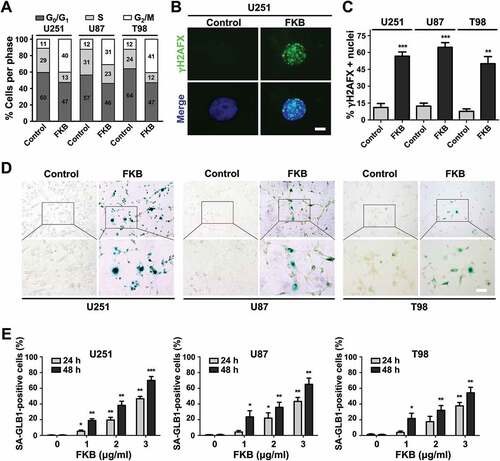
Alternatively, we examined whether FKB triggered senescence in GBM cells. Three different assays were used. First, distribution of the cell cycle as determined by flow cytometry revealed that GBM cells were primarily arrested at the G2/M phase after FKB treatment in all 3 cell lines (~ 12% vs ~ 35%, untreated vs treated cells; ). Second, FKB treatment led to an increase in nuclei positive for phosphorylated (Ser139) H2AFX (commonly termed γH2AFX) which detects a cause of senescence, DNA double-strand breaks ( and and Figure S2). Finally, accumulation of senescent SA-GLB1 positive cells in response to FKB was statistically significant in all cell lines (increases of ~ 10% to 20% relative to untreated cells; , and S3). These results indicated that FKB induced cellular senescence in GBM cell lines in vitro.
Figure 2. FKB induces cellular senescence in GBM cells. (A) Graphic representation of cell cycle distribution analyzed by flow cytometry in U251, U87, and T98 cells treated with FKB (3 μg/mL) or DMSO (vehicle control) for 48 h. (B) Immunofluorescence staining for γH2AFX (green) used to detect DNA damage in U251 cells treated with FKB (3 μg/mL) or DMSO for 48 h. Cell nuclei were counterstained with DAPI (blue) (scale bars: 10 μm). (C) Statistical results of the percentage of γH2AFX-positive cells determined in 4 random fields per sample. (D) SA-GLB1 staining to detect cellular senescence U251, U87, and T98 cells treated with FKB (3 μg/mL) or DMSO for 48 h. Images were taken under bright-field microscopy (scale bars: 50 μm). (E) Statistic results of the percentage of SA-GLB1-positive cells determined in 4 random fields per sample. All data are expressed as the mean ± SD of values from experiments performed in triplicate. * P < 0.05, ** P < 0.01 and *** P < 0.001 compared to controls.
FKB induces autophagy in GBM cells in vitro
Autophagy has been reported to facilitate cellular senescence [Citation22,Citation23]. To determine whether FKB induced autophagy in GBM cells, transmission electron microscopy (TEM) was performed to detect autophagic vesicles. TEM analysis demonstrated an increased production of autophagosomes in U251, U87, and T98 cells under treatment with FKB (3 μg/mL for 48 h; and Figure S4A). Western blot analysis of lysates prepared from treated cells also indicated that FKB induced the formation of autophagosomes. MAP1LC3B-II, a marker for autophagy, increased in a dose-dependent and time-dependent manner in GBM cells (). Finally, an increase in vesicle formation in real time was observed under fluorescence microscopy when cells were transduced with a construct expressing GFP tagged MAP1LC3B. In transduced GBM cells, the percentage of GFP-MAP1LC3B-positive cells increased in a dose-dependent and time-dependent manner under FKB treatment ( and Figures S4B and S4C).
Figure 3. FKB induces autophagy in GBM cells. (A) TEM images of U251, U87, and T98 cells treated with FKB (3 μg/mL) or DMSO for 48 h. Arrows highlight autophagosomes (arrows). The scale bar in the original image represents 0.8 μm and the scale bar in the enlarged image represents 0.3 μm. (B) Western blot analysis to detect protein levels of MAP1LC3B, SQSTM1, and GAPDH (control for loading) in U251, U87, and T98 cells treated with FKB (3 μg/mL) for the indicated times or the indicated concentration of FKB for 48 h. Data are representative of 3 independent experiments. The numbers below the blots correspond to relative quantification by densitometry compared with the reference point set to 1. (C) Fluorescence images of GFP-MAP1LC3B puncta in U251 cells treated with FKB (3 μg/mL) for the indicated times or the indicated concentration of FKB for 48 h. GFP-MAP1LC3B puncta were quantified (scale bars: 50 μm) .
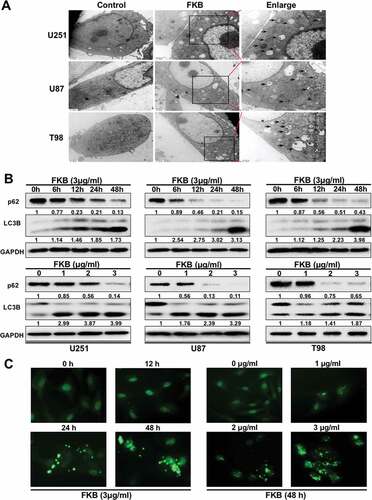
Levels of SQSTM1, a protein that is degraded through autophagy, decreased over time and with increasing concentrations of FKB (). These results further supported the idea that autophagy was enhanced in FKB-treated cells.
Autophagic flux was used to further evaluate FKB induced autophagy. We cotreated U251 cells with FKB (3 μg/mL) and autophagy inhibitors, 3-MA or chloroquine (CQ), which block upstream and downstream steps of the process, respectively. Western blot analysis demonstrated that coincubation of cells with FKB and 3-MA (10 mM) for 48 h led to decreased FKB-induced MAP1LC3B-II formation (). FKB-induced MAP1LC3B puncta were also reduced ( and ). In contrast, co-incubation of cells with FKB and CQ (3 μM) still led to increased conversion of MAP1LC3B-II () and accumulation of MAP1LC3B puncta ( and ).
Figure 4. FKB induces autophagy flux in GBM cells. Western blot analysis performed on lysates (20 µg) to detect levels of MAP1LC3B and GAPDH in U251 cells pretreated with (A) 3-MA (10 mM) or (B) CQ (3 μM) for 1 h, followed by exposure to FKB (3 μg/mL) or DMSO for another 48 h. Western blot analysis performed to detect levels of ATG5 or ATG7 and MAP1LC3B in U251 cells transfected with siRNAs. Numbers below the dots correspond to relative quantification by densitometry compared with the reference point set to 1. (C) ATG5 (#1 and #2) or (D) ATG7 (#1 and #2). After 48 h, cells were treated with FKB (3 μg/mL) or DMSO and then harvested after another 48 h. Data are representative of 3 independent experiments. (E) Fluorescence images of GFP-MAP1LC3B puncta in U251 cells pretreated with autophagy inhibitors (3-MA or CQ) or transfected with ATG5 or ATG7 siRNAs followed by exposure to FKB (3 μg/mL) or DMSO for another 48 h (scale bars: 50 μm). (F) Graphical representation of the quantification of GFP-MAP1LC3B puncta. All data are expressed as the mean ± SD of values from experiments performed in triplicate. * P < 0.05, ** P < 0.01 and *** P < 0.001 compared to controls.
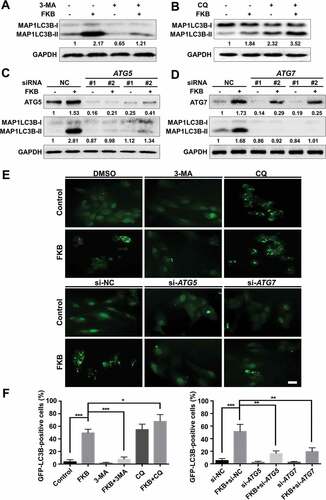
Finally, we transfected U251 cells with ATG5 or ATG7 siRNAs to inhibit protein expression of ATG5 or ATG7 in the presence of FKB. Western blot analysis and fluorescence microscopy demonstrated that knockdown of ATG5 or ATG7 led to decreased MAP1LC3B-II formation ( and ) and number of MAP1LC3B puncta, respectively ( and ). Taken together, these data indicated that FKB induced autophagy in U251, U87, and T98 cell lines in vitro.
FKB induces autophagy through ER stress-dependent upregulation of ATF4 and DDIT3 in GBM cells
Growing evidence indicates that endoplasmic reticulum (ER) stress signaling is closely linked to autophagy [Citation24,Citation25]. We therefore investigated whether FKB induced ER stress in U251 GBM cells by examining protein levels of classic ER signaling protein markers, including HSPA5, p-EIF2AK3, p-EIF2A, ATF4 and DDIT3, by western blot. U251 cells were treated with FKB as indicated (). Increased dose and treatment time with FKB induced HSPA5, p-EIF2AK3, p-EIF2A, ATF4 and DDIT3 in U251 cells (). These results indicated that FKB activated ER stress in GBM cells.
Figure 5. FKB induces autophagy through ER stress-dependent upregulation of ATF4 and DDIT3 in GBM cells. Western blot analysis performed on lysates (20 µg) for (A) HSPA5, p-EIF2AK3, p-EIF2A, ATF4, DDIT3, and GAPDH in U251 cells treated with indicated concentration of FKB for 48 h or FKB (3 μg/mL) for the indicated times; (B) ATF4, DDIT3, MAP1LC3B, and GAPDH in U251 cells transfected with control or ATF4 siRNAs for 48 h followed by exposure to FKB (3 μg/mL) or DMSO for another 48 h; (C) DDIT3, MAP1LC3B, and GAPDH in U251 cells transfected with control or DDIT3 siRNAs for 48 h followed by exposure to FKB (3 μg/mL) or DMSO for another 48 h; and (D) ATF4, DDIT3, MAP1LC3B, and GAPDH in U251 cells pretreated with 4-PBA (1 mM) for 30 min followed by exposure to FKB (3 μg/mL) or DMSO for another 48 h. Numbers below the blots correspond to relative quantification by densitometry compared with the reference point set to 1. Data are representative of 3 independent experiments.
To determine whether FKB induces autophagy through the ER stress-mediated ATF4-DDIT3 pathway, ATF4 siRNAs were transfected into U251 cells and the protein levels of DDIT3 and MAP1LC3B-II were measured by western blot. Levels of DDIT3 and MAP1LC3B-II did not increase in ATF4-knockdown U251 cells, despite treatment with FKB, to the levels in control-knockdown cells (). U251 cells transfected with DDIT3 siRNA also exhibited weak increases in MAP1LC3B-II protein levels after FKB treatment relative to control-knockdown cells (). Activation of the ER stress signaling was, however, partially restored in knockdown cells when treated simultaneously with an ER stress antagonist, 4-phenylbutyrate (4-PBA, 1 mM; ). These results demonstrated that FKB induced autophagy through activation of the ATF-DDIT3 ER stress signaling pathway in GBM cells.
FKB induces autophagy through the ATF4-DDIT3-TRIB3-AKT-MTOR-RPS6KB1 signaling pathway in GBM cells
One of the key molecules negatively regulating autophagy is MTOR (mechanistic target of rapamycin kinase); autophagy activity is inhibited through phosphorylation catalyzed by the protein kinase AKT, an upstream regulator of MTOR complex 1 [Citation26,Citation27]. We therefore investigated the phosphorylation status of MTOR in cells under FKB treatment. Western blot analysis revealed that p-MTOR was decreased in FKB-treated U251, U87, and T98 cells. FKB treatment also led to decreased phosphorylation of AKT and RPS6KB1, an MTOR substrate (). These results indicated that FKB induced autophagy through inhibition of AKT-MTOR-RPS6KB1 signaling in U251, U87, and T98 cell lines.
Figure 6. FKB induces autophagy through the ATF4-DDIT3-TRIB3-AKT-MTOR-RPS6KB1 signaling pathway in GBM cells. Western blot analysis performed on lysates (20 µg) to detect levels of (A) p-AKT, AKT, p-MTOR, MTOR, p-RPS6KB1, RPS6KB1, and GAPDH in U251, U87, and T98 cells treated with the concentration of FKB indicated for 48 h; (B) TRIB3 and GAPDH in U251, U87, and T98 incubated in the indicated concentration of FKB for 48 h; (C) ATF4, DDIT3, TRIB3, MAP1LC3B, and GAPDH in U251 cells transfected with control or ATF4 siRNAs for 48 h followed by exposure to DMSO or FKB (3 μg/mL) for another 48 h; and (D) TRIB3, p-AKT, AKT, p-MTOR, MTOR, p-RPS6KB1, RPS6KB1, MAP1LC3B, and GAPDH in U251 cells transfected with control or TRIB3 siRNAs for 48 h followed by exposure to DMSO or FKB (3 μg/mL) for another 48 h. Numbers below the blots correspond to relative quantification by densitometry compared with the reference point set to 1. Data are representative of 3 independent experiments.
Recent studies have demonstrated that DDIT3 may inhibit AKT activation through upregulation of TRIB3 expression [Citation28,Citation29]. We, therefore, examined levels of TRIB3 protein in treated cells. Upregulation of TRIB3 occurred in a dose-dependent manner in U251, U87, and T98 cell lines (). To investigate whether the upregulation of TRIB3 was induced through the ATF4-DDIT3 pathway, U251 cells were transfected with ATF4 siRNA. Autophagy flux and protein levels of ATF4, DDIT3, and TRIB3 were examined in cells after treatment by western blot. TRIB3 levels and MAP1LC3B-II did not increase in response to FKB in ATF4-knockdown cells as in control-knockdown cells. These results indicated that ATF4 is required for upregulation of TRIB3 in response to FKB ( and Figure S5). We next investigated whether FKB mediated inhibition of AKT-MTOR-RPS6KB1 occurred through increased TRIB3. U251 cells were transfected with TRIB3 siRNA, and levels of TRIB3, p-AKT, p-MTOR, p-RPS6KB1 and MAP1LC3B-II were assessed after FKB treatment (3 μg/mL for 48). In TRIB3-knockdown cells, the expression of p-AKT, p-MTOR, and p-RPS6KB1 recovered after FKB treatment ( and Figure S5), indicating the ATF4-DDIT3-TRIB3-AKT-MTOR-RPS6KB1 signaling pathway played a critical role in FKB-induced autophagy in GBM cells.
Autophagy plays a protective role in fkb-treated GBM cells
To determine whether FKB-induced autophagy protects tumor cells, cell viability was assessed in the presence of inhibitors of autophagy, 3-MA or CQ. Cell viability was first assessed using the CCK-8 assay. We found that autophagy inhibitors or knockdown of ATG5 or ATG7 led to further decreases in cell viability of U251 cells after exposure to FKB ( and Figure S6). EdU assays also revealed that inhibition of autophagy led to further increases in the inhibition of proliferation in FKB treated U251 cells (~ 18% vs ~ 7%, autophagy-uninhibited vs autophagy-inhibited cells with FKB treatment; and ).
Figure 7. Inhibition of autophagy enhances FKB-induced inhibition of proliferation in GBM cells. (A) CCK-8 assay to assess cell viability of U251 cells pretreated with autophagy inhibitors (3-MA or CQ) or transfected with ATG5 or ATG7 siRNAs, followed by exposure to FKB (3 μg/mL) or DMSO for another 48 h. (B and C) EdU assays. U251 cells pretreated with autophagy inhibitors (3-MA or CQ) or transfected with ATG5 or ATG7 siRNAs, followed by exposure to FKB (3 μg/mL) or DMSO for another 48 h. Cells were stained with Apollo 567 (red) to detect EdU and DAPI (blue) to highlight nuclei, and images were superimposed (scale bars: 50 μm). (B). Representative images of EdU+ cells stained with DAPI taken under fluorescence microscopy. (C). Graphic representation of percentage of EdU+ cells ([EdU+/DAPI+] × 100%) as determined in 4 random fields per sample from treated cells as indicated. All data are expressed as the mean ± SD of values from experiments performed in triplicate. *P < 0.05, ** P < 0.01, and *** P < 0.001 compared to controls. #P < 0.05, and ### P < 0.001 compared between the 2 treatments indicated.
![Figure 7. Inhibition of autophagy enhances FKB-induced inhibition of proliferation in GBM cells. (A) CCK-8 assay to assess cell viability of U251 cells pretreated with autophagy inhibitors (3-MA or CQ) or transfected with ATG5 or ATG7 siRNAs, followed by exposure to FKB (3 μg/mL) or DMSO for another 48 h. (B and C) EdU assays. U251 cells pretreated with autophagy inhibitors (3-MA or CQ) or transfected with ATG5 or ATG7 siRNAs, followed by exposure to FKB (3 μg/mL) or DMSO for another 48 h. Cells were stained with Apollo 567 (red) to detect EdU and DAPI (blue) to highlight nuclei, and images were superimposed (scale bars: 50 μm). (B). Representative images of EdU+ cells stained with DAPI taken under fluorescence microscopy. (C). Graphic representation of percentage of EdU+ cells ([EdU+/DAPI+] × 100%) as determined in 4 random fields per sample from treated cells as indicated. All data are expressed as the mean ± SD of values from experiments performed in triplicate. *P < 0.05, ** P < 0.01, and *** P < 0.001 compared to controls. #P < 0.05, and ### P < 0.001 compared between the 2 treatments indicated.](/cms/asset/64eca8b3-ae9d-4ad0-a073-59c90dc36e39/kaup_a_1501133_f0007_oc.jpg)
Inhibition of autophagy switches fkb-induced senescence to apoptosis in GBM cells
Based on the fact that FKB induced senescence and protective autophagy, we hypothesized that more cells would undergo senescence under the combination treatment of FKB with inhibition of autophagy. GLB1 staining, however, demonstrated that FKB-induced senescence was blocked by either 3-MA or CQ, or knockdown of ATG5 or ATG7 ( and ). Inhibition of autophagy by either 3-MA or CQ, or knockdown of ATG5 or ATG7 also attenuated accumulation of FKB-treated GBM cells in the G2/M phase (Figure S7). These results indicated that activation of autophagy promoted FKB-induced senescence in U251 cells.
Figure 8. Inhibition of autophagy switches FKB-induced senescence to apoptosis in GBM cells. (A and B) SA-GLB1 staining (blue) to detect cellular senescence in U251 cells pretreated with autophagy inhibitors (3-MA or CQ) or transfected with ATG5 or ATG7 siRNAs followed by treatment with FKB (3 μg/mL) or DMSO (control) for another 48 h. Images were acquired under bright-field microscopy. Statistic results of SA-GLB1-positive cells and total cell number (%) were determined in 4 random fields per sample (scale bars: 50 μm). (C) Flow cytometric analysis of ANXA5 and PI staining for the determination of apoptosis in U251 cells pretreated with autophagy inhibitors (3-MA or CQ) or transfected with ATG5 or ATG7 siRNAs with subsequent exposure to FKB (3 μg/mL) or DMSO for 48 h. (D) Western blot analysis of lysates (20 µg) prepared from U251 cells pretreated with autophagy inhibitors (3-MA or CQ) or transfected with ATG5 or ATG7 siRNAs and subsequently treated with FKB (3 μg/mL) or DMSO for 48 h. Membranes were incubated with antibodies against PARP1, cleaved PARP1, CASP3, cleaved CASP3, and GAPDH (protein loading control). All data are expressed as the mean ± SD of values from experiments performed in triplicate. * P < 0.05 and ** P < 0.01 compared to controls.
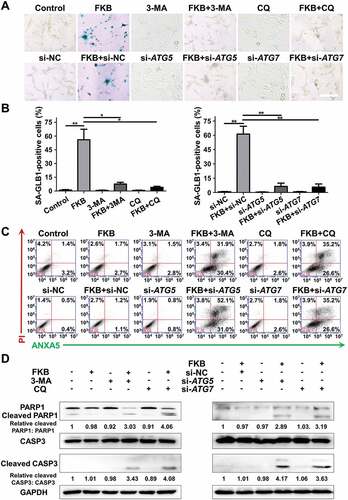
We next investigated whether inhibition of autophagy induced apoptosis in FKB-treated GBM cells. Increases in apoptosis were indeed observed in FKB-treated U251 cells in early (ANXA5+ PI−) and late (ANXA5+ PI+) stages in the presence of 3-MA or CQ, or with knockdown of ATG5 or ATG7 (). Cleavage of PARP1 and CASP3, protein markers for apoptosis, were significantly increased in FKB treated U251 cells under pharmacological or genetic inhibition of autophagy, as assessed by western blot (). Taken together, our results demonstrated that FKB in combination with inhibition of autophagy led to an increase in cells undergoing apoptosis rather than senescence in vitro.
FKB inhibits growth of GBM cells in vivo
To determine the potential therapeutic efficacy of FKB, tumor growth in response to treatment was investigated in an intracranial tumor model. Athymic nude mice (n = 20) were implanted with luciferase-stable U251 cells and assigned to the following treatment groups: Control (n = 5); FKB (n = 5); CQ (n = 5); FKB + CQ (n = 5). Phosphate-buffered saline (PBS) alone (control), FKB (50 mg/kg/day), CQ (25 mg/kg/day) or FKB (50 mg/kg/day) plus CQ (25 mg/kg/day) was intraperitoneally injected every other day starting on day 3 following implantation. Tumor growth was monitored over time using bioluminescence values. Our results demonstrated that FKB monotherapy significantly reduced tumor growth (~ 35 × 108 vs ~ 20 × 108 photons/s, control vs FKB-treated; and ). Although no statistically significant differences were found between the CQ and control arms, FKB combined with CQ treatment was more effective compared to FKB alone (~ 20 × 108 vs ~ 15 × 108 photons/s, FKB-treated vs FKB + CQ-treated; and ). Intriguingly, in contrast to the profound effects of combination treatment in vitro ( and ), the growth inhibition induced with FKB + CQ on GBM in vivo was not significant compared to FKB treatment alone (). This phenomenon may be due to the bystander effects of CQ [Citation30]. In addition, the optimal dose and schedule of this multi-active drug with respect to chemotherapy need to be experimentally determined [Citation31]. Kaplan-Meier analysis of the survival data demonstrated a statistically significant difference between control and FKB-treated (P = 0.03) or FKB + CQ-treated (P = 0.005) mice (~ 28 days vs > 30 days, control vs FKB-treated and FKB + CQ-treated; ).
Figure 9. FKB inhibits tumor growth in an orthotopic model for GBM in mice. (A) U251 cells expressing luciferase were orthotopically implanted into athymic nude mice, and tumor growth was monitored using the IVIS-200 imaging system for detection of bioluminescence. Bioluminescent signals were measured at days 7, 14, 21, and 28 after implantation. (B) Bioluminescence values plotted as a function of time in days to assess tumor growth (days 7, 14, 21 and 28). (C) Overall survival was determined by Kaplan-Meier survival curves, and a log-rank test was used to assess the statistical significance of the differences. (D) Images of immunohistochemical staining for MAP1LC3B and (E) MKI67 in tumors from each group as indicated (scale bars: 50 μm). (F) Images of TUNEL assays (under fluorescence microscopy) performed on sections from tumors in each group as indicated (scale bars: 50 μm). All data are expressed as the mean ± SD of values from experiments performed in triplicate. *P < 0.05, ** P < 0.01 and *** P < 0.001 compared between the 2 treatments.
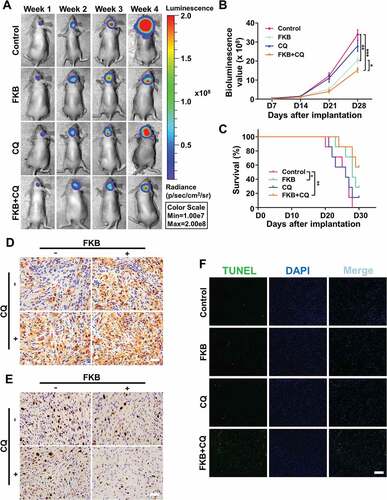
Immunohistochemistry was performed on tissue sections from FKB + CQ-treated animals to examine autophagy and proliferation. The marker for autophagy, MAP1LC3B, was increased in tumor cells ( and S8A), while MKI67/Ki67, a marker for proliferation was decreased ( and S8B). Furthermore, senescence (SA-GLB1 and CDKN1A/p21 [cyclin dependent kinase inhibitor 1A]) was decreased (Figure S9), while apoptosis (TUNEL) was significantly increased in xenografts from animals treated with FKB + CQ ( and S8C).
Luciferase-stable U251 cells were then infected with a lentivirus expressing sh-ATG5. The efficiency of shRNA-mediated knockdown of ATG5 was confirmed by western blot (Figure S10A). Consistent with results for CQ-treated GBM cells, infection with sh-ATG5 markedly enhanced FKB inhibition of tumor growth (~ 15 × 108 vs ~ 5 × 10⁸ photons/s, FKB + sh-NC vs FKB + sh-ATG5; and ). Survival time under treatment with FKB was also prolonged in mice with sh-ATG5 expressing xenografts (Kaplan-Meier analysis, P = 0.04; median survival, 27 vs > 30 days; ).
Figure 10. Knockdown of ATG5 enhances FKB inhibition of tumor growth in an orthotopic model for GBM in mice. (A) Luciferase-stable U251 cells infected with lentiviruses expressing sh-NC or sh-ATG5 were orthotopically implanted into athymic nude mice, and tumor growth was monitored using the IVIS-200 imaging system for detection of bioluminescence. Bioluminescent signals were measured at days 7, 14, 21, and 28 after implantation. (B) Bioluminescence values plotted as a function of time in days to assess tumor growth (days 7, 14, 21 and 28). (C) Overall survival was determined by Kaplan-Meier survival curves, and a log-rank test was used to assess the statistical significance of the differences. (D) Images of immunohistochemical staining for MAP1LC3B and (E) MKI67 in tumors from each group as indicated (scale bars: 50 μm). (F) Images of TUNEL assays (under fluorescence microscopy) performed on sections from tumors in each group as indicated (scale bars: 50 μm). All data are expressed as the mean ± SD of values from experiments performed in triplicate. *P < 0.05, ** P < 0.01 and *** P < 0.001 compared between the 2 treatments.
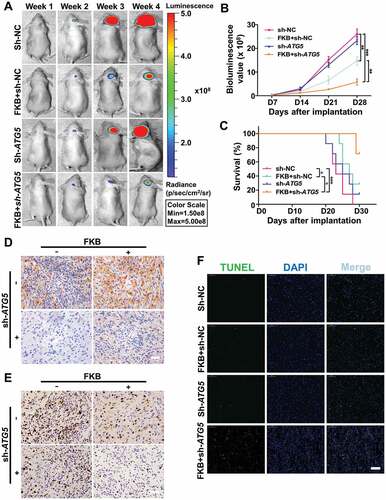
Immunohistochemistry performed on tissue sections from xenografts demonstrated that sh-ATG5 attenuated accumulation of MAP1LC3B protein in mice under FKB treatment ( and S10B), whereas MKI67 was markedly decreased (20% vs 10%, FKB + sh-NC vs FKB + sh-ATG5; and Figure S10C). Finally, senescence (SA-GLB1 and CDKN1A) was decreased (Figure S11), while apoptosis (TUNEL) was significantly increased in sh-ATG5-expressing xenografts from FKB treated animals (~ 5% vs 20%, control vs FKB + sh-ATG5; and Figure S10C). These data demonstrated that FKB targeted GBM cells both in vitro and in vivo, and that combined treatment with an inhibitor of autophagy enhanced FKB-induced tumor growth inhibition.
Discussion
Multiple studies have provided compelling evidence that concurrent inhibition of autophagy may improve the outcomes of cancer therapy [Citation8,Citation32]. CQ, for example, is an autophagy inhibitor that is currently in phase I and phase II clinical trials, and has been used in combination with several chemo- and radiotherapies [Citation33]. Here, we have demonstrated that FKB, a natural kava chalcone, induced autophagy in human glioma cell lines in vitro. This induction of autophagy furthermore contributed to the establishment of FKB-induced senescence in GBM cells. Inhibition of autophagy blocked FKB-induced senescence and resulted in the cells undergoing apoptosis. Finally, combination therapy in an in vivo brain tumor model in mice led to improved survival. Our results therefore provide a basis for the development of alternative strategies, such as combination therapy with autophagy inhibitors, to improve the efficacy of FKB in GBM patients.
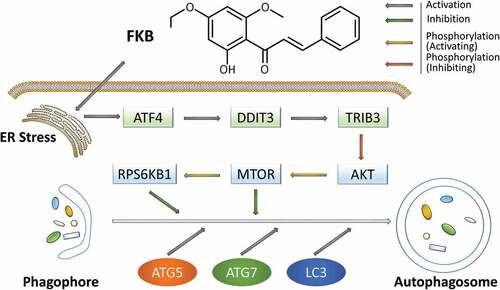
Autophagy is yet another of the myriad and unexpected mechanisms cancer usurps to survive the dynamic change occurring in the tumor microenvironment, including exposure to chemo- or radiotherapies [Citation34]. We were able to take a closer look at this phenomenon when we discovered that FKB induced autophagy in human glioma cell lines. FKB-induced autophagy displayed classic molecular features of the process. MAP1LC3B positive autophagosomes accumulated in human glioma cell lines followed by reduced SQSTM1 protein levels. To further understand the signaling pathways mediating the response, we also investigated a possible association with ER stress signaling which has been previously linked to the induction of autophagy [Citation25]. We demonstrated that FKB upregulated ER stress-related proteins and ATF4-DDIT3 signaling. These results highlighted this pathway as a crucial mediator of FKB-induced autophagy in GBM cells. We were able to identify additional molecular regulators by examining the phosphorylation status of MTOR, as well as critical upstream and downstream components, AKT and the substrate RPS6KB1. TRIB3, which is activated by DDIT3, was also induced after FKB treatment and led to reduced activation of AKT. We now have a working molecular model to further investigate the efficacy of FKB in the treatment of GBM (). FKB induces ER stress which upregulates ATF4-DDIT3-TRIB3. Increased activity in these proteins inhibits AKT-MTOR-RPS6KB1 signaling which leads to increased autophagy flux.
Figure 11. A hypothetical model for the signaling pathway and the role of FKB-induced autophagy in GBM cells. FKB induces autophagy through the ER stress-dependent ATF4-DDIT3-TRIB3-AKT-MTOR-RPS6KB1 signaling pathway in GBM cells. Briefly, FKB upregulates ER stress-related proteins and ATF4-DDIT3-TRIB3 signaling. Increased activity in these proteins inactivates the phosphorylation status of AKT and its critical downstream components, MTOR and RPS6KB1, thus leading to increased autophagy flux.
While crosstalk between apoptosis and autophagy is well-established [Citation35], the relationship between autophagy, apoptosis, and senescence remains poorly defined [Citation36]. Autophagy does appear to play a key role in the establishment of cellular senescence in response to cancer therapy. Acute treatment with temozolomide for example has been shown to induce DNA damage in GBM cells and to produce a transient induction of autophagy followed by senescence [Citation37]. Inhibition of autophagy, however, only delays, but does not fully abrogate senescence [Citation38]. In this study, we found that FKB induced senescence in GBM cells, indicating that while FKB inhibits proliferation of GBM cells, it does not necessarily lead to effective elimination of them. Here, we demonstrated that introducing inhibition of autophagy to FKB-treated GBM cells induced apoptosis rather than senescence. Thus, the combination treatment is possibly more effective in actually killing GBM cells. Taken together, FKB-induced protective autophagy may assist GBM cells in evading apoptosis and remaining in a senescent state, which effectively promotes cell survival. Therefore, we speculate that the status of autophagy determines a cell’s fate to undergo senescence or apoptosis.
In summary, our data indicates that FKB inhibits malignant behavior of GBM cells and induces cytoprotective autophagy through the ATF4-DDIT3-TRIB3-AKT-MTOR-RPS6KB1 signaling pathway. FKB thus warrants further investigation as a natural bioactive molecule with cancer killing potential. We predict that combination treatment with FKB and pharmacological autophagy inhibitors will be an effective therapeutic strategy in the treatment of GBM.
Materials and methods
Ethics statement
All animal procedures were approved by the Institutional Animal Care and Use Committee (IACUC) of Shandong University (Jinan, China).
Cell lines and cultures
Human glioma cell lines U251 and U87 were purchased from the Chinese Academy of Sciences Cell Bank (Shanghai, China; TCHu58, TCHu138). Human fibroblast glioblastoma cell line T98, primary human GBM biopsy xenograft propagated tumor cells, P3, and luciferase-stable U251 glioma cells were kindly provided by Prof. Rolf Bjerkvig (University of Bergen). Cells were cultured in Dulbecco modified Eagle medium (DMEM; Thermo Fisher Scientific, SH30022.01B) supplemented with 10% fetal bovine serum (GE Healthcare Life Sciences, 10,082,147) in 5% CO2 in a humidified incubator at 37°C.
Sirna transfections
Gene-specific siRNAs and negative control siRNA were synthesized by GenePharma (Shanghai, China) and were transfected into U251 cells for 48 h using Lipofectamine 2000 (Thermo Fisher Scientific, 11,668–027) according to the manufacturer’s protocol. The following siRNA sequences were used to target the RNAs indicated: ATG5#1 and ATG5#2, 5ʹ-CCT TTG GCC TAA GAA GAA A-3ʹ and 5ʹ-CAT CTG AGC TAC CCG GAT A-3ʹ; ATG7 #1 and ATG7 #2, 5ʹ-GGA GTC ACA GCT CTT CCT T-3ʹ and 5ʹ-CAG CTA TTG GAA CAC TGT A-3ʹ; ATF4, 5ʹ-TCC CTC AGT GCA TAA AGG A-3ʹ; DDIT3, 5ʹ-GCC TGG TAT GAG GAC CTG C-3ʹ; TRIB3, 5ʹ-CGA GCU CGA AGU GGG CCC C-3ʹ; non-targeting control siRNA, 5ʹ- UUC UCC GAA CGU GUC ACG A-3ʹ.
Shrna transfections
Short hairpin (sh)-ATG5 (5ʹ-CCA GAT ATT CTG GAA TGG AAA-3ʹ) were ligated in the lentiviral vector of pLenti-shRNA-ZsGreen1 with a puromycin resistant region (GeneBio, GY-sh001; Shanghai, China). Luciferase-stable U251 glioma cells were plated and infected with lentiviruses expressing sh-ATG5 for 24 h, according to the manufacturer’s protocol. Western blotting was performed to validate knockdown efficiency, and cells were split for different assays.
Cell viability and proliferation assays
Cell viability was assessed with the cell counting kit-8 (CCK-8; Dojindo, CK04-500). Cells (1.0 × 10⁴ cells/well) were seeded into 96-well plates and incubated at 37°C overnight. FKB (Abcam, ab141933), 3-MA (Sigma-Aldrich, M9281), or CQ (Sigma-Aldrich, C6628) were dissolved in DMSO (Sigma-Aldrich, D2650) and diluted to working concentrations in culture medium. After the desired treatment, cells were incubated for an additional 4 h at 37°C with 10 μL of CCK-8 in 100 μL of serum-free DMEM. The absorbance at 450 nm was measured using a microplate reader (Bio-Rad, model 680; Hercules, CA, USA). Proliferation was assessed using the EdU incorporation assay according to the manufacturer’s protocol (Ribobio, C103103). Briefly, EdU was incorporated into proliferating cells and detected through a catalyzed reaction with a fluorescently labeled azide. Labeled cells were examined under fluorescence microscopy and quantified.
Cell cycle and senescence associated-glb1/β-galactosidase (SA-GLB1) assays
Cells were harvested, incubated with propidium iodide (BD Biosciences, 550,825), and subjected to flow cytometry (BD Biosciences, AccuriTM C6; San Jose, CA, USA) for cell cycle analysis. Cellular senescence was evaluated using an SA-GLB1 assay. Briefly, cells were fixed with glutaraldehyde and incubated with X-gal staining solution (Cell Signaling Technology, 9860) overnight at 37°C. SA-GLB1-positive cells were examined under bright-field microscopy and quantified. For in vivo, frozen sections were immersed overnight in X-gal staining solution and counterstained with nuclear fast red. Nuclei of glioma cells were then counted by nuclear fast red staining. The percentage of SA-GLB1-positive cells (ratio: [SA-GLB1+ cells/all nuclei] × 100%) was determined using images taken for 3 random fields per sample (n = 3 samples) under bright-field microscopy.
Immunofluorescence staining
Cells were fixed with 4% paraformaldehyde in PBS (Beyotime Biotechnology, ST476), permeabilized with 0.5% Triton X-100 (Beyotime Biotechnology, ST795) in PBS, and incubated with rabbit anti-phospho-histone H2AFX (Ser139)/γH2AFX antibody (1:200; Cell Signaling Technology, 9718S) in 5% bovine serum albumin (BOSTER, AR0004) in PBS overnight. Primary antibody was detected with FITC-conjugated anti-rabbit IgG (Abcam, 150,077). Cells were incubated in the dark with DAPI to stain nuclei. Slides were examined under fluorescence microscopy, and images were acquired using a CCD (charge-coupled device) digital camera (Olympus, DP71; Waltham, MA, USA).
Transmission electron microscopy (TEM)
Cells were fixed with 4% glutaraldehyde and postfixed with 1% OsO4 in 0.1 M cacodylate buffer for 2 h. The samples were then stained with 1% Millipore-filtered uranyl acetate, dehydrated in increasing concentrations of ethanol, and infiltrated and embedded in epoxy resin (ZXBR, Spon 812). Electron photomicrographs were taken of ultrastructures of GBM cells with a transmission electron microscope (JEM-1200EX II, JEOL; Tokyo, Japan).
Western blot analysis
Cell lysates (20 µg protein) were subjected to western blot analysis, according to previously described protocols [Citation39]. Membranes were incubated with the following antibodies from Cell Signaling Technology: SQSTM1 (5114), MAP1LC3B (2775), ATG5 (2630), ATG7 (2631), HSPA5 (3177), EIF2A (5324), p-EIF2A (3398), p-EIF2AK3 (3179), AKT (9272), p-AKT (4060), MTOR (2972), p-MTOR (2974), RPS6KB1 (9202), p-RPS6KB1 (9204), CASP3 (9662), PARP1 (9542), GAPDH (5174). Additional antibodies were ATF4 (Santa Cruz Biotechnology, sc-200), TRIB3 (Abcam, ab73547) and DDIT3 (Abcam, ab11419). Band density was measured (ImageJ software) and normalized to GAPDH.
Cell transfection and GFP-LC3 dot assay
GFP-LC3B (pBABEpuro, 22,405)-expressing vectors were obtained from Addgene and deposited by EndoFree Plasmid Maxi Kit (QIAGEN, 12,362). Lentiviral supernatants were prepared according to the manufacturer’s instructions and provided by GenePharma. Lentiviral infections were carried out accordingly. Cells displaying ≥ 3 GFP-LC3B dots after FKB treatment were considered to be autophagic and were counted. Images were acquired with a CCD digital camera (Olympus, DP71; Waltham, MA, USA).
Apoptosis assay
Cells were harvested, resuspended in binding buffer, and incubated with ANXA5-FITC antibody (BD Biosciences, 556,547) according to the manufacturer’s instructions. Apoptotic cells were detected by flow cytometry (BD Biosciences, AccuriTM C6; San Jose, CA, USA), and the results were analyzed using the software Flowjo (Tree Star; Ashland, OR, USA).
Intracranial xenograft model and drug therapy
Athymic mice (male; 4 weeks old; 20 to 30 g) were provided by Shanghai SLAC Laboratory Animal Co., Ltd (Shanghai, China). The mice were anesthetized with chloral hydrate and secured on a stereotactic frame. A longitudinal incision was made in the scalp and a 1 mm-diameter hole was drilled 2.5 mm lateral to the bregma. Luciferase-stable U251 glioma cells (2 × 10⁵) in 20 μL of serum-free DMEM were implanted 2.5 mm into the right striatum using a Hamilton syringe. Mice were monitored by bioluminescence imaging every week. Briefly, mice were injected with 100 mg luciferin (Caliper, 122,796), simultaneously anesthetized with isoflurane, and subsequently imaged with a cooled charge-coupled device camera (IVIS-200, Xenogen; Alameda, CA, USA). Bioluminescence values of tumors were quantitated using the Living Image 2.5 software package (Xenogen). Mice were euthanized after 30 days and perfused with 4% paraformaldehyde in PBS. Brains were coronally sectioned for immunohistochemistry and TUNEL assays.
Immunohistochemistry
Paraffin-embedded samples were sectioned (4 µm) and mounted on microscopic slides. Heat-induced epitope retrieval was performed in 10 mmol/L citric acid buffer at pH 7.2 in a microwave. Sections were incubated with the primary antibody at 4°C overnight (MAP1LC3B, 1:200, Cell Signaling Technology, 2775; MKI67/Ki67, 1:200, Cell Signaling Technology, 9027; CDKN1A/p21, 1:50, Cell Signaling Technology, 2947), rinsed with PBS, and incubated with horseradish peroxidase-linked goat anti-rabbit secondary antibody (ZSGB-BIO, PV-9000). Visualization was achieved using diaminobenzidine (ZSGB-BIO, ZLI-9033) as the substrate, and slides were counterstained with Mayer hematoxylin (Beyotime Biotechnology, C0107).
TUNEL assay
TUNEL assays were performed using the In Situ Cell Death Detection Kit following the manufacturer’s protocol (Roche, 11,684,795,910). After labeling, images were acquired under fluorescence microscopy with a DP71 CCD digital camera.
Statistical analysis
Three independent experiments were performed, and results were expressed as the mean ± the standard deviation (SD). Data were compared using paired Student t tests in GraphPad Prism 5 software (San Diego, CA, USA). P-values determined from different comparisons < 0.05 were considered statistically significant and are indicated as follows: *P < 0.05; ** P < 0.01; *** P < 0.001.
Supplemental Material
Download Zip (19.1 MB)Acknowledgments
The authors thank Dr. Janice Nigro for critical comments on the manuscript.
Disclosure statement
No potential conflict of interest was reported by the authors.
Supplementary material:
Supplemental data for this article can be accessed here
Additional information
Funding
Related Research Data
References
- Kalpathy-Cramer J, Gerstner ER, Emblem KE, et al. Advanced magnetic resonance imaging of the physical processes in human glioblastoma [Research Support, N.I.H., Extramural Research Support, Non-U.S. Gov’t Review]. Cancer Res. 2014 Sep 1;74(17):4622–4637. CAN-14-0383.
- van den Bent M, Chinot OL, Cairncross JG. Recent developments in the molecular characterization and treatment of oligodendroglial tumors [Review]. Neuro Oncol. 2003 Apr;5(2):128–138.
- Garrido W, Rocha JD, Jaramillo C, et al. Chemoresistance in high-grade gliomas: relevance of adenosine signalling in stem-like cells of glioblastoma multiforme [Research Support, Non-U.S Gov’t Review]. Curr Drug Targets. 2014;15(10):931–942.
- Lee CY. Strategies of temozolomide in future glioblastoma treatment [Review]. Onco Targets Ther. 2017 Jan 9;10:265–270.
- Uribe D, Torres A, Rocha JD, et al. Multidrug resistance in glioblastoma stem-like cells: role of the hypoxic microenvironment and adenosine signaling [Review]. Mol Aspects Med. 2017;20:009.
- Klionsky DJ, Abdelmohsen K, Abe A, et al. Guidelines for the use and interpretation of assays for monitoring autophagy (3rd edition) [Guideline Research Support, N.I.H., Extramural]. Autophagy. 2016;12(1):1–222.
- Galluzzi L, Pietrocola F, Bravo-San Pedro JM, et al. Autophagy in malignant transformation and cancer progression [Research Support, Non-U.S. Gov’t Review]. EMBO J. 2015 Apr 1;34(7):856–880. Epub 2015 Feb 23.
- Degenhardt K, Mathew R, Beaudoin B, et al. Autophagy promotes tumor cell survival and restricts necrosis, inflammation, and tumorigenesis [Research Support, N.I.H., Extramural Research Support, Non-U.S. Gov’t]. Cancer Cell. 2006 Jul;10(1):51–64.
- Livesey KM, Tang D, Zeh HJ, et al. Autophagy inhibition in combination cancer treatment [Research Support, N.I.H., Extramural Review]. Curr Opin Investig Drugs. 2009 Dec;10(12):1269–1279.
- Chen N, Karantza V. Autophagy as a therapeutic target in cancer [Review]. Cancer Biol Ther. 2011 Jan 15;11(2):157–168. Epub 2011 Jan 15.
- Choi KS. Autophagy and cancer [Research Support, Non-U.S. Gov’t Review]. Exp Mol Med. 2012 Feb 29;44(2):109–120.
- Gordaliza M. Natural products as leads to anticancer drugs [Research Support, Non-U.S. Gov’t Review]. Clin Transl Oncol. 2007 Dec;9(12):767–776.
- Newman DJ, Cragg GM, Snader KM. The influence of natural products upon drug discovery [Review]. Nat Prod Rep. 2000 Jun;17(3):215–234.
- An J, Gao Y, Wang J, et al. Flavokawain B induces apoptosis of non-small cell lung cancer H460 cells via Bax-initiated mitochondrial and JNK pathway [Research Support, Non-U.S. Gov’t]. Biotechnol Lett. 2012 Oct;34(10):1781–1788. Epub 2012 Jun 23.
- Eskander RN, Randall LM, Sakai T, et al. Flavokawain B, a novel, naturally occurring chalcone, exhibits robust apoptotic effects and induces G2/M arrest of a uterine leiomyosarcoma cell line [Research Support, N.I.H., Extramural]. J Obstet Gynaecol Res. 2012 Aug;38(8):1086–1094. Epub 2012 Apr 30.
- Ji T, Lin C, Krill LS, et al. Flavokawain B, a kava chalcone, inhibits growth of human osteosarcoma cells through G2/M cell cycle arrest and apoptosis. Mol Cancer. 2013 Jun 10;(12):55. DOI:10.1186/1476-4598-12-55.
- Li X, Liu Z, Xu X, et al. Kava components down-regulate expression of AR and AR splice variants and reduce growth in patient-derived prostate cancer xenografts in mice [Research Support, N.I.H., Extramural]. PLoS One. 2012;7(2):e31213. Epub 2012 Feb 9.
- Hseu YC, Lee MS, Wu CR, et al. The chalcone flavokawain B induces G2/M cell-cycle arrest and apoptosis in human oral carcinoma HSC-3 cells through the intracellular ROS generation and downregulation of the Akt/p38 MAPK signaling pathway [Research Support, Non-U.S. Gov’t]. J Agric Food Chem. 2012 Mar 7;60(9):2385–2397. Epub 2012 Feb 27.
- Zhao X, Chao YL, Wan QB, et al. Flavokawain B induces apoptosis of human oral adenoid cystic cancer ACC-2 cells via up-regulation of Bim and down-regulation of Bcl-2 expression [Research Support, Non-U.S. Gov’t]. Can J Physiol Pharmacol. 2011 Dec;89(12):875–883. Epub 2011 Nov 24.
- Lee JJ, Kim BC, Park MJ, et al. PTEN status switches cell fate between premature senescence and apoptosis in glioma exposed to ionizing radiation [Research Support, Non-U.S. Gov’t]. Cell Death Differ. 2011 Apr;18(4):666–677. Epub 2010 Nov 12.
- Tang YL, Huang LB, Tian Y, et al. Flavokawain B inhibits the growth of acute lymphoblastic leukemia cells via p53 and caspase-dependent mechanisms [Research Support, Non-U.S. Gov’t]. Leuk Lymphoma. 2015;56(8):2398–2407. Epub 2015 Feb 23.
- Narita M, Young AR, Narita M. Autophagy facilitates oncogene-induced senescence. Autophagy. 2009 Oct;5(7):1046–1047. Epub 2009 Oct 7.
- Sasaki M, Miyakoshi M, Sato Y, et al. Autophagy mediates the process of cellular senescence characterizing bile duct damages in primary biliary cirrhosis [Research Support, Non-U.S. Gov’t]. Lab Invest. 2010 Jun;90(6):835–843. Epub 2010 Mar 8.
- Yla-Anttila P, Vihinen H, Jokitalo E, et al. 3D tomography reveals connections between the phagophore and endoplasmic reticulum [Research Support, Non-U.S. Gov’t]. Autophagy. 2009 Nov;5(8):1180–1185. Epub 2009 Nov 8.
- Yorimitsu T, Klionsky DJ. Endoplasmic reticulum stress: a new pathway to induce autophagy. Autophagy. 2007 Mar-Apr;3(2):160–162. Epub 2007 Mar 4.
- Mehrpour M, Esclatine A, Beau I, et al. Overview of macroautophagy regulation in mammalian cells [Research Support, Non-U.S. Gov’t Review]. Cell Res. 2010 Jul;20(7):748–762. Epub 2010 Jun 15.
- Yang Z, Klionsky DJ. An overview of the molecular mechanism of autophagy [Research Support, N.I.H., Extramural Review]. Curr Top Microbiol Immunol. 2009;335:1–32.
- Du K, Herzig S, Kulkarni RN, et al. TRB3: a tribbles homolog that inhibits Akt/PKB activation by insulin in liver [Research Support, Non-U.S. Gov’t Research Support, U.S. Gov’t, P.H.S.]. Science. 2003 Jun 6;300(5625):1574–1577.
- Matsushima R, Harada N, Webster NJ, et al. Effect of TRB3 on insulin and nutrient-stimulated hepatic p70 S6 kinase activity. J Biol Chem. 2006 Oct 6;281(40):29719–29729. Epub 2006 Aug 3.
- Zhang Y, Liao Z, Zhang LJ, et al. The utility of chloroquine in cancer therapy [Research Support, Non-U.S. Gov’t Review]. Curr Med Res Opin. 2015 May;31(5):1009–1013. Epub 2015 Mar 17.
- Pascolo S. Time to use a dose of Chloroquine as an adjuvant to anti-cancer chemotherapies [Research Support, Non-U.S. Gov’t Review]. Eur J Pharmacol. 2016 Jan 15;771:139–144.
- Rubinsztein DC, Gestwicki JE, Murphy LO, et al. Potential therapeutic applications of autophagy [Research Support, N.I.H., Extramural Research Support, Non-U.S. Gov’t Review]. Nat Rev Drug Discov. 2007 Apr;6(4):304–312.
- Amaravadi RK, Lippincott-Schwartz J, Yin XM, et al. Principles and current strategies for targeting autophagy for cancer treatment [Research Support, N.I.H., Extramural Research Support, Non-U.S. Gov’t Review]. Clin Cancer Res. 2011 Feb 15;17(4):654–666.
- Palumbo S, Comincini S. Autophagy and ionizing radiation in tumors: the “survive or not survive” dilemma [Review]. J Cell Physiol. 2013 Jan;228(1):1–8.
- Giansanti V, Torriglia A, Scovassi AI. Conversation between apoptosis and autophagy: “Is it your turn or mine?” [Research Support, Non-U.S. Gov’t Review]. Apoptosis. 2011 Apr;16(4):321–333.
- Gewirtz DA. Autophagy and senescence: a partnership in search of definition. Autophagy. 2013 May;9(5):808–812. Epub 2013 Feb 19.
- Filippi-Chiela EC, Mm BES, Thome MP, et al. Single-cell analysis challenges the connection between autophagy and senescence induced by DNA damage [Research Support, Non-U.S. Gov’t]. Autophagy. 2015;11(7):1099–1113.
- Goehe RW, Di X, Sharma K, et al. The autophagy-senescence connection in chemotherapy: must tumor cells (self) eat before they sleep? [Research Support, N.I.H., Extramural]. J Pharmacol Exp Ther. 2012 Dec;343(3):763–778. Epub 2012 Aug 27.
- Wang J, Qi Q, Feng Z, et al. Berberine induces autophagy in glioblastoma by targeting the AMPK/mTOR/ULK1-pathway [Journal article]. Oncotarget. 2016;19:11396.