
ABSTRACT
Currently, particular focus is placed on the implication of autophagy in a variety of human diseases, including cancer. Discovery of small-molecule modulators of autophagy as well as their potential use as anti-cancer therapeutic agents would be of great significance. To this end, a series of curcumin analogs previously synthesized in our laboratory were screened. Among these compounds, (3E,5E)-3-(3,4-dimethoxybenzylidene)-5-[(1H-indol-3-yl)methylene]-1-methylpiperidin-4-one (CA-5f) was identified as a potent late-stage macroautophagy/autophagy inhibitor via inhibiting autophagosome-lysosome fusion. We found that CA-5f neither impaired the hydrolytic function nor the quantity of lysosomes. Use of an isobaric tag for relative and absolute quantitation (iTRAQ)-based proteomic screen in combination with bioinformatics analysis suggested that treatment of human umbilical vein endothelial cells (HUVECs) with CA-5f for 1 h suppressed the levels of cytoskeletal proteins and membrane traffic proteins. Subsequent studies showed that CA-5f exhibited strong cytotoxicity against A549 non-small cell lung cancer (NSCLC) cells, but low cytotoxicity to normal human umbilical vein endothelial cells (HUVECs), by increasing mitochondrial-derived reactive oxygen species (ROS) production. Moreover, CA-5f effectively suppressed the growth of A549 lung cancer xenograft as a single agent with an excellent tolerance in vivo. Results from western blot, immunofluorescence, and TdT-mediated dUTP nick end labeling (TUNEL) assays showed that CA-5f inhibited autophagic flux, induced apoptosis, and did not affect the level of CTSB (cathepsin B) and CTSD (cathepsin D) in vivo, which were consistent with the in vitro data. Collectively, these results demonstrated that CA-5f is a novel late-stage autophagy inhibitor with potential clinical application for NSCLC therapy.
Abbreviations: 3-MA, 3-methyladenine; ANXA5, annexin A5; ATG, autophagy related; CA-5f, (3E,5E)-3-(3,4-dimethoxybenzylidene)-5-[(1H-indol-3-yl)methylene]-1-methylpiperidin-4-one; CQ, chloroquine; CTSB, cathepsin B; CTSD, cathepsin D; DMSO, dimethyl sulfoxide; DNM2, dynamin 2; EBSS, Earle’s balanced salt solution; GFP, green fluorescent protein; HCQ, hydroxyl CQ; HEK293, human embryonic kidney 293; HUVEC, human umbilical vein endothelial cells; LAMP1, lysosomal associated membrane protein 1; LC-MS/MS, liquid chromatography coupled to tandem mass spectrometry; LDH, lactic acid dehydrogenase; LMO7, LIM domain 7; MAP1LC3B/LC3B, microtubule associated protein 1 light chain 3 beta; NAC, N-acetyl cysteine; MYO1E, myosin IE; NSCLC, non-small cell lung cancer; PARP1, poly(ADP-ribose) polymerase 1; PI, propidium iodide; RFP, red fluorescent protein; ROS, reactive oxygen species; SQSTM1, sequestosome 1; TUNEL, terminal deoxynucleotidyl transferase-mediated dUTP nick-end labeling.
Introduction
Macroautophagy/autophagy is a conserved eukaryotic cellular degradative process in which organelles and cellular proteins are sequestered in autophagosomes that subsequently fuse with lysosomes for further degradation and recycling [Citation1]. Autophagy plays essential roles in various normal cellular processes, including cell growth, proliferation, differentiation, development, ageing, and inflammation, to maintain cellular homeostasis. It can also be triggered in response to a variety of stress conditions such as starvation, oxidative stress, irradiation, and microbial invasion [Citation2]. Autophagy dysfunction has been implicated in the pathophysiology of multiple diseases, including cancer, cardiovascular diseases, neurodegeneration, and various metabolic disorders [Citation3]. Although the role of autophagy in cancer is controversial, this process has been found to be over-activated in many kinds of cancers, which ensures cancer cells survive under stress and increases resistance to radiation and chemotherapy [Citation4]. These observations have led to increasing concerns about using autophagy inhibitors as potential anti-tumor agents.
Generally, autophagy inhibitors can be mainly divided into two categories based on the stage at which autophagy is inhibited. One category targets the early stage of autophagy to suppress autophagy induction, such as the frequently-used 3-methyladenine (3-MA), wortmannin, LY294002 [Citation5,Citation6], and the newly discovered spautin-1 [Citation7], SBI-0206965 [Citation8], SAR405 [Citation9], NSC185058 [Citation10], etc. The other works on the later stage of autophagy via blocking autophagosome-lysosome fusion and/or inhibiting autolysosome degradation, including the commonly-used chloroquine (CQ), hydroxyl CQ (HCQ), and bafilomycin A1 [Citation5,Citation6], as well as the newly discovered lucanthone [Citation11], Lys05 [Citation12], oblongifolin C [Citation13], liensinine [Citation14], ARN5187 [Citation15], elaiophylin [Citation16], KB-R7943 [Citation17], etc. Unfortunately, the high toxicity of most autophagy inhibitors limits their clinical use. Even HCQ, the only clinically available autophagy inhibitor, appears to have retinal toxicity and many other reported problems as well as bottlenecks on the application in a clinical setting [Citation18]. Thus, development of more potent autophagy inhibitors has important clinical significance.
Natural compounds and their structures have a long tradition as valuable source for medicinal chemistry and drug discovery. More than half of anti-tumor agents are derived from natural scaffolds [Citation19]. Most of the newly discovered autophagy inhibitors with anti-tumor activities are natural products, such as oblongifolin C, liensinine and elaiophylin [Citation13,Citation14,Citation16]. Curcumin is a natural polyphenol derived from the herb Curcuma longa that suppresses the growth of various types of cancer cells by regulating autophagy [Citation20–Citation23]. Although poor bioavailability in vivo limits its clinical applications, curcumin remains a good lead compound for further structure modification, as an increasing number of curcumin analogs or derivatives have been reported to induce autophagy and kill cancer cells [Citation24–Citation26]. Several studies have demonstrated that curcumin is capable of inducing autophagy in different lines of human tumor and normal cells [Citation22,Citation23,Citation27-Citation29]. However, recent studies have revealed that curcumin impairs autophagic flux both in vitro and in vivo [Citation30,Citation31]. The roles of curcumin and its analogs on autophagy regulation remain controversial because in most studies, especially in the earlier studies, the autophagic flux was not carefully examined.
In the present study, we screened a series of curcumin analogs previously synthesized in our laboratory to find new autophagy regulators. Among the analogs examined, (3E,5E)-3-(3,4-dimethoxybenzylidene)-5-[(1H-indol-3-yl)methylene]-1-methylpiperidin-4-one (CA-5f) is identified as a novel potent late-stage autophagy inhibitor by blocking the fusion of autophagosomes with lysosomes. The inhibitory effect of CA-5f on autophagy might be due to downregulation of cytoskeletal proteins as well as suppression of membrane vesicle trafficking rather than changing the lysosomal pH or lysosomal hydrolytic function. CA-5f induces mitochondrial reactive oxygen species (ROS) generation and cell death, however, it appears more cytotoxic against A549 non-small cell lung cancer (NSCLC) cells compared with normal human umbilical vein endothelial cells (HUVECs). More excitingly, CA-5f efficiently inhibits autophagic flux and represses A549 lung cancer xenograft with an excellent tolerance in vivo, suggesting that CA-5f can be used as a tool to study the molecular mechanisms of autophagy and has the potential to developed into a new drug for the treatment of NSCLC.
Results
Discovery of CA-5f as a novel autophagy modulator
To discover novel autophagy modulator, we screened a series of curcumin analogs which were previously synthesized in our laboratory [Citation32]. Among the analogs tested, CA-5f ()) induced cytoplasmic vacuolization both in A549 cells and HUVECs as the concentration increased and time elongated ()), suggesting that this compound might regulate autophagy. MAP1LC3/LC3 (microtubule associated protein 1 light chain 3) usually exhibits a molecular form conversion from cytoplasmic LC3-I into its lipidated counterpart LC3-II, which is recruited to phagophores and stays on the inner membrane of the autophagosome until it is degraded in the autolysosome. Therefore, the level of LC3-II has been widely used as a marker to monitor autophagy [Citation33]. Data from western blot analysis showed that CA-5f elevated the level of LC3B-II in concentration- and time-dependent manners both in A549 cells and HUVECs ()). SQSTM1 (sequestosome 1) is recruited to phagophores and constitutively degraded during autophagy. Thus, increased levels of SQSTM1 commonly reflect a blockade of autophagic flux. We found that SQSTM1 protein level, but not mRNA level, was elevated by CA-5f both in A549 cells and HUVECs (), suggesting that CA-5f might inhibit autophagic flux instead of enhancing autophagy activity. Similar effects of CA-5f on LC3B conversion and SQSTM1 accumulation were detected in 2 other NSCLC cell lines, H1299 and H157, the human hepatocellular liver carcinoma cell line HepG2, the human cervical cancer cell line HeLa, and human embryonic kidney 293 (HEK293) cells (Fig. S1).
Figure 1. CA-5f regulates autophagy both in A549 cells and HUVECs. (a) The chemical structure of CA-5f with a molecular weight of 388.46 g/mol. (b) Microscopy photographs of A549 cells and HUVECs treated with the indicated concentrations (0–40 μM) of CA-5f for 3–24 h. Scale bar: 20 μm. (c) Western blot analysis of LC3B-II and SQSTM1 levels in A549 cells and HUVECs treated with the indicated concentrations (0–40 μM) of CA-5f for 6 h, or in the cells treated with CA-5f (20 μM) at the times indicated. GAPDH was used as a loading control. (d) qRT-PCR analysis of SQSTM1 mRNA level in A549 cells and HUVECs treated with the indicated concentrations (0–40 μM) of CA-5f for 6 h, or in the cells treated with CA-5f (20 μM) at the times indicated. (n = 3; *, p < 0.05 vs. control) (e) Fluorescence photographs of GFP-LC3B puncta in A549 cells and HUVECs treated with DMSO or CA-5f (20 μM) for 6 h. Scale bar: 10 μm. Nuclei were stained with Hoechst 33,258. Histogram shows quantification of the percentage of cells with GFP-LC3B puncta. (n = 3; *, p < 0.05; **, p < 0.01 vs. control) (f) Transmission electron micrographs of A549 cells and HUVECs treated with DMSO or CA-5f (20 μM) for 6 h. The lower pictures are the enlarged representations of the boxed regions of the upper pictures. Scale bar: 500 nm.
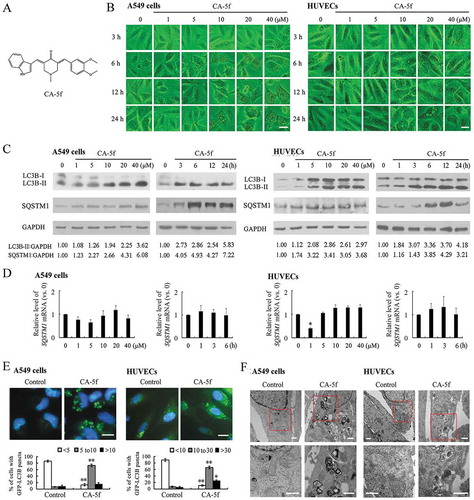
We next transfected A549 cells or HUVECs with GFP (green fluorescent protein)-LC3B plasmid, which is a widely accepted method to visualize autophagosomes. CA-5f significantly increased the number of GFP-LC3B puncta in A549 cells and HUVECs ()), supporting the concept that CA-5f is an autophagy modulator. For further evidence of CA-5f-regulated autophagy, we performed an ultrastructural investigation of CA-5f-treated cells. As compared with the control cells, the number of vesicular structures was obviously increased in CA-5f-treated cells. Double-membrane autophagosomes in CA-5f-treated cells could be observed ()). Based on these results, we chose CA-5f as a hit compound for further study to uncover its mechanism in regulating autophagy.
Identification of CA-5f as a late-stage autophagy inhibitor
The increased level of LC3B-II and number of GFP-LC3B puncta can be related to either increased formation of autophagosomes or impaired degradation of autophagosomes. To discriminate between these two possibilities, we further evaluated the autophagic flux. We analyzed the level of LC3B-II in the presence of 3-methyladenine (3-MA) or wortmannin, which inhibit early-stage autophagy by suppressing autophagosome formation, or chloroquine (CQ) or bafilomycin A1, which inhibit late-stage autophagy by blocking the fusion of autophagosomes with lysosomes. Our results showed that the effect of CA-5f on LC3B-II accumulation could not be eliminated when 3-MA or wortmannin suppressed the upstream steps of autophagy ()). Co-incubation of cells with CA-5f and CQ or bafilomycin A1 did not induce an increase in LC3B-II levels compared with CA-5f treatment alone ()), confirming that CA-5f inhibits the degradation of autophagosomes. Additionally, CA-5f evoked a more significant accumulation of LC3B-II in the nutrient-free condition compared with Earle’s balanced salt solution (EBSS) incubation alone or CA-5f treatment under the normal growth conditions ()).
Figure 2. CA-5f inhibits autophagic flux both in A549 cells and HUVECs. (a) Western blot analysis of LC3B-II levels in A549 cells and HUVECs treated with DMSO or CA-5f (20 μM) in the absence or presence of 3-MA (10 mM) or wortmannin (2 μM) for 6 h. (b) Western blot analysis of LC3B-II levels in A549 cells and HUVECs treated with DMSO or CA-5f (20 μM) in the absence or presence of bafilomycin A1 (100 nM) or CQ (30 μM) for 6 h. (c) Western blot analysis of LC3B-II levels in A549 cells and HUVECs cultured in complete medium or EBSS in the absence or presence of CA-5f (20 μM) for 6 h. (d) Fluorescence photographs of A549 cells and HUVECs transfected with mRFP-GFP-LC3B reporter. Cells were treated with DMSO or CA-5f (20 μM) in complete medium or EBSS for 6 h. CQ (30 μM)-treated cells were used as positive controls. Nuclei were stained with Hoechst 33,258. Scale bar: 10 μm. (e) Average number of autophagosomes (yellow) and autolysosomes (red) per cell was figured up and grouped as described in (d). (n = 3; *, p < 0.05; **, p < 0.01 vs. control; ##, p < 0.01 vs. EBSS).
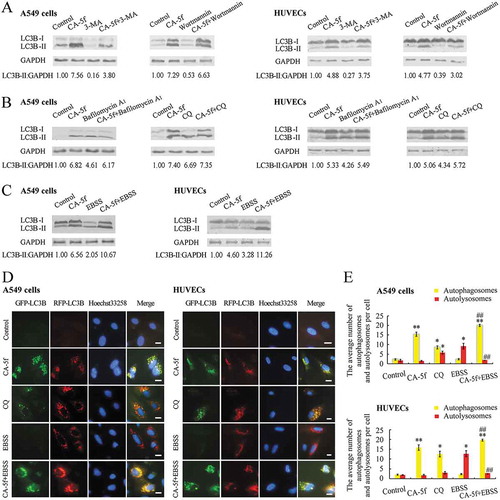
To corroborate the effect of CA-5f on autophagic flux, we performed fluorescence microscopy using a tandem mRFP-GFP-LC3B reporter. GFP (green fluorescent protein), but not RFP (red fluorescent protein), loses its fluorescence in the acidic and proteolytic environment of the lysosomes. Thus, both GFP and RFP signals as yellow puncta correspond to immature autophagosomes, whereas autolysosomes will only fluoresce red [Citation22]. As expected, CA-5f markedly increased the number of yellow puncta both in A549 cells and HUVECs, which was similar to, but more potent than, the effects of CQ (). In contrast, many red puncta with few green puncta were observed in EBSS-incubated cells ()). Co-incubation of cells with EBSS and CA-5f led to further increase of the number of yellow puncta compared with EBSS incubation alone or CA-5f treatment alone under the normal conditions (). Additionally, we obtained the live imaging of A549 cells and HUVECs expressing GFP-RFP-LC3B using time-lapse confocal microscopy. After EBSS treatment, most of the green fluorescence disappeared gradually, indicating an efficient autophagy response, while CA-5f-treated cells showed both red and green fluorescence (yellow puncta), indicating an impaired autophagic flux (Video S1-S4). These data collectively confirmed that CA-5f is a late-stage autophagy inhibitor.
We also detected whether CA-5f influences the levels of key regulators of autophagy induction, such as PIK3C3 (phosphatidylinositol 3-kinase catalytic subunit type 3), ATG5, and phospho-mTOR (phosphorylated mechanistic target of rapamycin kinase). Western blot analysis showed no significant difference between the control and CA-5f-treated cells in these proteins levels (Fig. S2).
CA-5f inhibits autophagic flux by blocking autophagosome-lysosome fusion instead of affecting the pH and hydrolytic function of lysosomes
It is essential to determine whether the inhibitory effect of CA-5f on autophagy is due to the blockade of autophagosome-lysosome fusion, or impairment of autolysosome degradation. To address whether CA-5f affects the fusion of autophagosomes with lysosomes, we assessed the colocalization of GFP-LC3B and LysoTracker Red (a fluorescent dye for labeling and tracking acidic organelles in live cells, such as autolysosomes). We found that most GFP-LC3B puncta were not colocalized with LysoTracker Red in CA-5f-treated cells both in normal and nutrient-free conditions ()), suggesting that CA-5f suppressed the fusion of autophagosomes with lysosomes. Because the fluorescence intensity of LysoTracker Red is sensitive to pH alteration, we did not use CQ-treated cells as control in this experiment.
Figure 3. CA-5f suppresses autophagosome-lysosome fusion. (a) Fluorescence photographs of the colocalization of GFP-LC3B and LysoTracker Red in A549 cells and HUVECs cultured in full medium or EBSS in the absence or presence of CA-5f (20 μM) for 6 h. Nuclei were stained with Hoechst 33,258. Scale bar: 10 μm. (b) Immunofluorescence photographs of the colocalization of LC3B (green) and LAMP1 (red) in A549 cells and HUVECs treated with DMSO or CA-5f (20 μM) for 6 h. CQ (30 μM)-treated cells were used as positive controls. Nuclei were stained with DAPI. Scale bar: 10 μm.
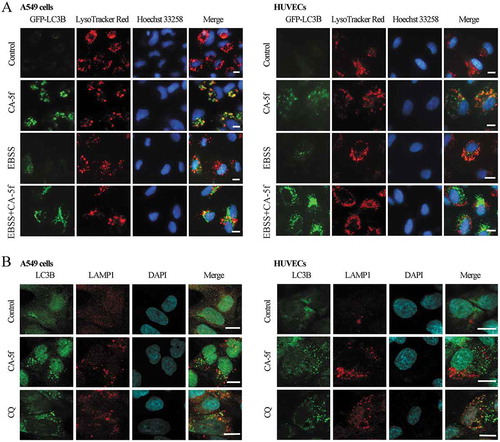
We further detected the colocalization of endogenous LC3B with LAMP1 (lysosomal associated membrane protein 1), a marker for lysosomal and endosomal membranes, using immunofluorescence. CA-5f treatment produced a marked separation of LC3B puncta and LAMP1, similar to that observed in CQ-treated cells ()). These findings confirmed that CA-5f suppresses the fusion of autophagosomes with lysosomes.
Next, we examined whether CA-5f disrupts lysosomal degradation. Because a low pH is required for lysosomal enzyme activity, we first evaluated whether CA-5f affects the lysosomal pH. Acridine orange (AO) emits red fluorescence in the acidic compartment and green fluorescence in the cytosolic and nuclear compartments when excited by blue light [Citation34]. It is well recognized that bafilomycin A1 disrupts autophagic flux by inhibiting lysosomal acidification, thus we used it as a positive control. Unlike the bafilomycin A1-treated group, cells exposed to CA-5f exhibited bright red fluorescence in the cytoplasm, which represents an accumulation of acidic compartments ()), suggesting that CA-5f did not affect the lysosomal pH. These results were confirmed by LysoTracker Red staining ()).
Figure 4. CA-5f does not affect the pH and hydrolytic function of lysosomes. (a) Fluorescence photographs of acridine orange (AO) staining and LysoTracker Red staining of A549 cells and HUVECs treated with DMSO, CA-5f (20 μM), or bafilomycin A1 (100 nM) for 6 h. Scale bar: 10 μm. (b) Relative enzymatic activity of ACP (acid phosphatase) in A549 cells and HUVECs treated with CA-5f (20 μM) at the times indicated. (c) Relative enzymatic activity of CTSB and CTSD in A549 cells and HUVECs treated with CA-5f (20 μM) at the times indicated.
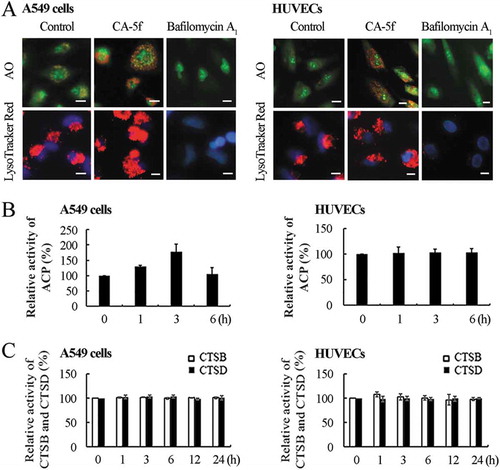
To further investigate whether CA-5f affects the hydrolytic function of lysosomes, we detected the activity of ACP (acid phosphatase), a lysosomal marker enzyme. The results showed that CA-5f did not change the activity of ACP both in A549 cells and HUVECs ()). As the major lysosomal proteases, the enzymatic activities of CTSB (cathepsin B) and CTSD (cathepsin D) were also measured. Both CTSB and CTSD activities were not changed in CA-5f-treated cells ()). Furthermore, we found that CA-5f did not decrease the level of LAMP1 both in A549 cells and HUVECs (Fig. S3). These results suggested that CA-5f neither impair the hydrolytic function nor the quantity of lysosomes.
CA-5f suppressed the expression of cytoskeletal and membrane vesicle trafficking proteins
Although CA-5f was identified as a late-stage autophagy inhibitor, the mechanism of its action is clearly different from CQ, bafilomycin A1, or the other lysosomal protease inhibitors. Thus, we attempted to explore the potential proteins underlying the mechanisms using an isobaric tag for relative and absolute quantitation (iTRAQ)-based proteomic screen and liquid chromatography coupled to tandem mass spectrometry (LC-MS/MS) analysis. A total of 3,074 non-redundant proteins were identified in HUVECs (Table S1). The differentially expressed proteins were identified as the up- and down-regulated proteins whose fold change (115:114 ratio) were >1.5 and <0.78, respectively, with p < 0.05. Accordingly, only 144 proteins were selected for further analysis (Table S2).
To uncover clues related to the mechanism(s) underlying the inhibitory effect of CA-5f on autophagy, the differentially expressed proteins were classified according to the protein functional clustering and pathway enrichment analysis. show the histograms of the top 10 cellular functions and biological pathways associated with these proteins, respectively. Data from bioinformatic analysis suggested that CA-5f mainly affected the proteins associated with the cytoskeleton, membrane trafficking, vesicle-mediated transport, gene expression, and cellular redox state. Mounting evidence demonstrated that the cytoskeleton plays crucial roles in the fusion of autophagosomes to lysosomes, which is a membrane vesicle traffic process [Citation35]. Proteomic analysis showed that CA-5f suppressed the levels of cytoskeletal proteins and membrane traffic proteins ()), which may be the reason for the inhibitory effect of CA-5f on autophagosome-lysosome fusion.
Figure 5. CA-5f decreases the levels of cytoskeletal proteins and membrane traffic proteins. (a) Bar graph showed the top 10 cellular functions of the differentially expressed proteins in CA-5f-treated HUVECs. (b) Bar graph showed the top 10 biological pathways associated with the differentially-expressed proteins in CA-5f-treated HUVECs. The x axis displays -log (p-value). The y axis displays a decreased order of significance. The vertical line denotes the cutoff threshold for significance (p < 0.05). (c) Table showed the cytoskeletal proteins and membrane traffic proteins as classified in (a). * indicates the proteins exist in both categories. (d) Western blot analysis of 7 cytoskeletal proteins and membrane traffic proteins selected from (c) in HUVECs and A549 cells treated with DMSO or CA-5f (20 μM) for 1 h.
To validate the accuracy of iTRAQ coupled with LC-MS/MS data, 7 cytoskeletal proteins and membrane traffic proteins, including LMO7 (LIM domain 7), ACTB (actin beta), DNM2 (dynamin 2), SEPT8 (septin 8), SNX18 (sorting nexin 18), SNX5 (sorting nexin 5), and SYN1 (synapsin I), were analyzed by western blot. The trend of changes of these proteins were in accordance with the proteomic results both in HUVECs and A549 cells ()). Depletion of LMO7, DNM2, or MYO1E (myosin IE) resulted in an accumulation of LC3B-II and SQSTM1. These phenotypes were weaker than, but similar to, those resulting from CA-5f treatment (Fig. S4).
There are multiple connections established between the cellular redox state and autophagy [Citation36]. A recent study has reported that increased ROS generation induced autophagic flux inhibition in HeLa cells under stress conditions [Citation37]. CA-5f remarkably elevated ROS levels in A549 cells and HUVECs, which was reversed by the antioxidant N-acetyl cysteine (NAC), but not by diphenyleneiodonium (DPI), a specific inhibitor of NADH/NADPH oxidase (Fig. S5A). Then we found that CA-5f significantly increased the level of mitochondrial ROS and decreased the mitochondrial membrane potential (MMP) (Fig. S5B and S6), indicating that CA-5f induced increases in mitochondrial-derived ROS. To further determine whether ROS generation is required for CA-5f-induced autophagy, we examined the changes of LC3B-II levels in the presence of NAC. Data from western blot analysis showed that removal of ROS by NAC significantly blocked the high level of LC3B-II induced by CA-5f both in A549 cells and HUVECs (Fig. S7A). However, NAC also suppressed the mRNA level of LC3B (Fig. S7B). To distinguish whether the decrease of LC3B-II protein level is due to the antagonistic effect of removing ROS on CA-5f or due to the inhibitory effects of NAC on LC3B expression, cells were transfected with an exogenous mRFP-GFP-LC3B reporter. We found that NAC failed to suppress CA-5f-induced accumulation of yellow puncta both in A549 cells and HUVECs (Fig. S7C and D), indicating that ROS generation is not the reason for the inhibitory effect of CA-5f on autophagic flux.
CA-5f exhibits more cytotoxicity against A549 cells compared with normal HUVECS
Next, we examined the cytotoxicity of CA-5f using real-time cell analysis (RTCA). 20 μM of CA-5f resulted in a growth arrest of A549 cells as well as HUVECs within 12 h. However, the number of HUVECs in CA-5f-treated group displayed a quick increase afterward, which was equal to that of control group at 48 h ()). After that, the media was changed and the phenotypes replicated those seen before 48 h, indicating that normal VECs are much more resistant to CA-5f than A549 cells. Similar effects of CA-5f on cell viability were detected in 3 other NSCLC cell lines including H157, H358, and H1650 cells, and 2 other epithelial cells including human bronchial epithelial BEAS-2B cells and renal tubular epithelial HK-2 cells (Fig. S8). As another way to measure toxicity, colony-formation assays were performed and the results showed that CA-5f treatment completely inhibited colony formation of A549 cells (Fig. S9). Next, we performed an ANXA5 (annexin A5)-propidium iodide (PI) double-staining assay using flow cytometric analysis. Compared with the control cells, CA-5f treatment for 24 h increased the proportion of ANXA5-positive cells from 0.63% ± 0.41% to 72.16% ± 6.29% for A549 cells and from 0.75% ± 0.54% to 9.28% ± 1.35% for HUVECs ()), confirming that CA-5f is more cytotoxic to A549 cells compared with normal HUVECs.
Figure 6. The cytotoxicity of CA-5f on A549 cells and HUVECs. (a) Cell viability was monitored over 96 h in real time using an xCELLigence RTCA S16 System. Cell-sensor impedance is displayed as the cell index. The vertical dotted line indicates DMSO or CA-5f (20 μM) addition time points. (b) Flow cytometric analysis of ANXA5-FITC/PI staining in A549 cells and HUVECs treated with DMSO or CA-5f (20 μM) for 24 h. Apoptosis inducers were used as a positive control. (c) Transmission electron micrographs of A549 cells and HUVECs treated with DMSO or CA-5f (20 μM) for 24 h. Scale bar: 2 μm. (d) Western blot analysis of cleaved PARP1 in A549 cells and HUVECs treated with DMSO or the indicated concentrations (0–40 μM) of CA-5f for 24 h. GAPDH was used as a loading control. (e) Bar graph showing the relative lactate dehydrogenase (LDH) activity in A549 cells and HUVECs treated with the indicated concentrations (0–40 μM) of CA-5f for 24 h. (n = 3; *, p < 0.05; **, p < 0.01 vs. 0) (F) Western blot analysis of cleaved PARP1 in A549 cells and HUVECs treated with DMSO or CA-5f (20 μM) in the absence or presence of NAC (10 mM) for 24 h. (G) Bar graph showing the relative LDH activity in A549 cells treated with DMSO or CA-5f (20 μM) in the absence or presence of NAC (10 mM) for 24 h. (n = 3; *, p < 0.05 vs. control; #, p < 0.05 vs. CA-5f) (h) Cell viability determined by MTT assay. A549 cells and HUVECs treated with DMSO or CA-5f (20 μM) in the absence or presence of NAC (10 mM) for 24 h. (n = 3; **, p < 0.01 vs. control; #, p < 0.05 vs. CA-5f).
Ultrastructural studies revealed the morphological features of apoptosis in CA-5f-treated A549 cells, including nuclear membrane disintegration and nuclear pyknosis, condensation, and fragmentation ()). Nuclear pyknosis was also observed in CA-5f-treated HUVECs ()), indicating that CA-5f induced apoptosis. These results were further supported by DAPI staining (Fig. S10) and increased PARP1 (poly[ADP-ribose] polymerase 1) cleavage in CA-5f-treated cells ()). Additionally, CA-5f-treated A549 cells exhibited elevated activity of LDH (lactic acid dehydrogenase) in a dose-dependent manner, whereas elevated LDH activity was not detected in HUVECs ()), suggesting that CA-5f induced both apoptosis and necrosis in A549 cells.
In addition, we investigated whether ROS generation is involved in the cytotoxicity of CA-5f. Scavenging ROS with NAC significantly blocked the PARP1 cleavage in CA-5f-treated A549 cells and HUVECs ()). The elevated activity of LDH in CA-5f-treated A549 cells was also suppressed by NAC ()). NAC reversed CA-5f-induced reduction in cell viability both in A549 cells and HUVECs ()). These data suggested that ROS generation is required for CA-5f-induced apoptosis and necrosis.
CA-5f represses A549 lung cancer xenograft growth and inhibits autophagic flux in vivo
The above observations showed that CA-5f was highly toxic to A549 cells in vitro. To evaluate whether CA-5f exhibited the same effects in vivo, nude mice bearing established A549 tumors were injected with CA-5f (40 mg/kg) via caudal vein every 2 days for up to 30 days. CA-5f injection at this dosage was very well tolerated by nude mice with no obvious toxicity throughout the course of experiment. There was no significant difference in the mean body weight between control and CA-5f-treated groups ()). As shown in , tumor volume and weight increased dramatically in the control mice and were significantly suppressed in CA-5f-treated mice. The appearance of tumors was consistent with the data of tumor volume and weight ()), indicating that CA-5f has the potential for development as a new anti-tumor agent.
Figure 7. CA-5f inhibits A549 lung cancer xenograft growth and autophagic flux in vivo. 10 nude mice with palpable tumors were randomly assigned to 2 groups: control group and CA-5f group. DMSO or CA-5f (40 mg/kg) was injected via caudal vein every 2 days for up to 30 days. (a) Mouse body weight and (b) tumor volume were recorded every 2 days for up to 30 days. (c) Tumor weight was measured at the day of sacrifice (day 30). (d) Images showed that tumors of all the 10 cases both in control and CA-5f injected-mice. (e) Western blot analysis of LC3B-II and SQSTM1 in tumor tissues. 1–5 represents tumor tissues in control mice. 6–10 represents tumor tissues in CA-5f injected-mice. Scattergram showed the densitometric analysis of LC3B-II and SQSTM1 in tumor tissues. GAPDH was used as a loading control. (f) Representative images showed the immunofluorescence staining of LC3B, SQSTM1, CSTB, CSTD, and TUNEL staining (green) in tumor sections. Panels marked with enlarged are cropped sections from the overview panels. Nuclei were stained with DAPI (red). Scale bar: 10 μm.
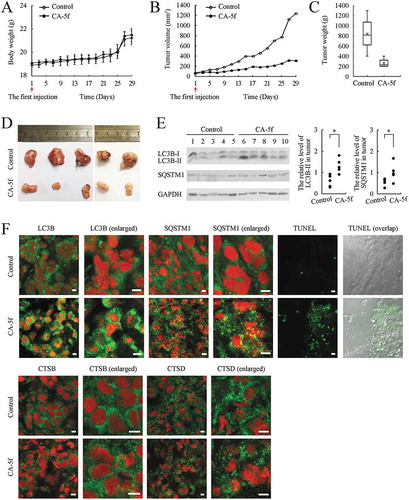
Western blot analysis showed that CA-5f treatment increased the accumulation of LC3B-II and SQSTM1 in the tumor tissues compared with the control group ()). Staining of tumor tissues for LC3B and SQSTM1 showed a diffuse pattern in the control group, whereas a great deal of LC3B and SQSTM1 puncta were observed in CA-5f-treated group ()). Moreover, no obvious changes of CTSB and CTSD were observed in the tumor tissues between CA-5f-treated group and the control group ()). The number of apoptotic cells indicated by TUNEL-positive cells in A549 xenografts was increased in CA-5f-treated group compared with the control group ()). These data suggested that CA-5f inhibits autophagic flux and induced apoptosis in vivo.
Discussion
Most of eukaryotes use autophagy as a metabolic pathway to maintain cellular homeostasis under starvation or stress conditions by degrading and recycling the redundant proteins and damaged organelles [Citation1]. Autophagy facilitates cellular survival by enabling cancer cells to grow under the adverse environment [Citation38]. An increasing number of preclinical studies have demonstrated that targeting autophagy is a promising new strategy for many cancer therapies [Citation12–Citation17]. HCQ is the only clinically-approved autophagy inhibitor, however its effects explored in the current clinical trials for a variety of cancers are still not satisfactory [Citation18]. Therefore, it is necessary to discover more autophagy regulators with the potential to be novel anti-tumor drugs.
To this end, a series of curcumin analogs synthesized in our laboratory were screened for activity as autophagy modulators. Combining several different approaches, CA-5f was identified as a late-stage autophagy inhibitor that impairs the fusion of autophagosomes with lysosomes. Most of the recently-discovered late-stage autophagy inhibitors either affect the pH of lysosome or impair lysosomal hydrolysis [Citation11–Citation16]. To uncover the underlying mechanism of CA-5f on autophagy inhibition, we first evaluated whether CA-5f affects lysosomal pH or lysosomal proteolytic activity. Data from acidophilic dyes staining suggested that CA-5f did not affect lysosomal pH both in A549 cells and HUVECs. The activity of ACP (acid phosphatase), representing lysosome activity, was not changed in CA-5f treated-cells. CTSB and CTSD are the most abundant lysosomal cysteine and aspartyl proteases that contribute to the degradation of autolysosomes [Citation39]. The enzymatic activities of CTSB and CTSD were also not altered after CA-5f treatment. In addition, the level of LAMP1 was not decreased. In the present study, for the first time, we identified CA-5f as a novel late-stage autophagy inhibitor which works independently of impairment of lysosomal functions. Intriguingly, our findings seem inconsistent with a previous report in which curcumin induces lysosomal damage and cytosolic relocation of CTSB and CTSD in A549 cells [Citation40]. The discrepancy most likely arises due to structural differences among curcumin and its analogs. Song et al. reported that curcumin analog C1 triggers lysosome biogenesis in the brain [Citation41]. Zhang et al. reported that curcumin activates lysosomal function via different molecular mechanism from its analog C1 [Citation27]. Such observations support this possibility.
Subsequently, iTRAQ coupled with LC-MS/MS was performed to investigate the protein profiles of CA-5f-treated cells to uncover the major factors contributing to the inhibitory effect of CA-5f on autophagy. Bioinformatics analysis of these differentially expressed proteins in HUVECs based on proteomics results revealed that CA-5f-associated gene signatures were involved in the cytoskeleton, membrane trafficking, vesicle-mediated transport, gene expression, and cellular redox state. Autophagy is a highly dynamic intracellular trafficking process that requires vesicular membrane trafficking events at all stages of this process [Citation42]. Autophagosome movement and fusion with the lysosome employs cytoskeleton-dependent machinery which is similar to other intracellular trafficking processes [Citation36,Citation43]. The inhibitory effect of CA-5f on autophagosome-lysosome fusion might be due to its suppression of cytoskeletal and membrane vesicle trafficking protein expression. In support of this idea, we found that depletion of LMO7, DNM2, or MYO1E, 3 cytoskeletal proteins down-regulated by CA-5f, resulted in an accumulation of LC3B-II and SQSTM1. Consistently, DNM2 depletion has been shown to impair autophagic flux in human breast ductal carcinoma MCF-7 cells [Citation44]. The detailed mechanism by which CA-5f suppresses these cytoskeletal proteins and membrane vesicle trafficking events warrants further investigation. In addition, a noteworthy phenomenon observed in CA-5f-treated cells is that most endogenous LC3B puncta or exogenous GFP-LC3B puncta were dispersed throughout the cytoplasm instead of clustering near the nucleus. It has been recognized that autophagosome delivery to the perinuclear region is required for their maturation [Citation45]. A number of studies established RAB7A (RAB7A, member RAS oncogene family) as an essential small G protein that is required for autophagosome transport to the perinuclear region for fusion with lysosomes [Citation46]. Our recent molecular docking experiments predicted that CA-5f could bind to the GTP-binding region of the RAB7A protein, suggesting that CA-5f might affect RAB7A activation (Fig. S11). Whether and how RAB7A is involved in CA-5f-induced inhibition of autophagosome-lysosome fusion will be investigated in our future studies.
Given that CA-5f increased the level of mitochondrial-derived ROS, it would be interesting to explore whether ROS are involved in CA-5f-induced autophagy inhibition. We found that the increased protein level of LC3B-II in CA-5f-treated cells was completely suppressed after removing ROS. Based on the fact that removal of ROS also decreased the mRNA level of LC3B, it is conceivable that ROS clearance may merely influence LC3B expression rather than to reverse the inhibitory effect of CA-5f on autophagy. Supporting this notion, we found that removal of ROS failed to block CA-5f-induced accumulation of exogenous LC3B puncta both in A549 cells and HUVECs.
Excitingly, CA-5f showed more selective cytotoxic activity against NSCLC cells than normal epithelial cells. Scavenging ROS significantly reversed CA-5f-induced cell apoptosis and necrosis. One possible explanation is that cancer cells generally exhibit elevated basal ROS levels [Citation47]. A small induction of intracellular ROS may push ROS levels over the threshold that these cells can bear. In contrast, normal cells have lower basal levels of ROS and stronger antioxidant capacity, thus they can better tolerate oxidative insults [Citation48]. However, whether the cytotoxic activity of CA-5f against NSCLC cells is related to autophagy inhibition remains a major concern. Our data have provided some insight into this important concern. The cytotoxicity of CA-5f was found to be weaker in A549 cells transfected with ATG5 or PIK3C3 siRNA compared with control cells (Fig. S12), indicating constitutive autophagy contributes to CA-5f-induced cell death. Given that late-stage autophagy inhibition leads to excessive accumulation of deleterious undegraded material and has the potential to turn autophagy into a destructive process [Citation49], it is conceivable that reduced autophagosome formation could weaken the cytotoxicity of CA-5f. In accordance with this notion, recent studies demonstrated that blockade of autophagosome formation protects cancer cells from cytotoxicity induced by late-stage autophagy inhibitors [Citation16,Citation50].
CA-5f exhibits the same effects in vivo. Injection of CA-5f (40 mg/kg) into nude mice every 2 days for up to 30 days exerted potent anti-tumor activity against A549 lung cancer xenografts with an excellent tolerance throughout the whole treatment process. The changes in levels and subcellular localization of LC3B and SQSTM1 in CA-5f-treated tumor tissues suggested that CA-5f effectively inhibited autophagy in vivo. Consistent with the in vitro data, there was no obvious difference of CTSB and CTSD between CA-5f-treated and control mice. Injection of CA-5f strongly increased the number of TUNEL-positive cells covering the tumor sections, indicating that CA-5f caused cell death in vivo. NSCLC constitutes 85% of all lung cancer cases and is associated with poor prognosis and median survival [Citation51]. A majority of patients are no longer eligible for surgical resection at the time of diagnosis, and chemo- and radiation therapies remain the most common therapies for NSCLC treatment, even though they have a range of toxic side-effects [Citation48]. Recent studies revealed that the high resistance of NSCLC to chemo- and radiation therapies may be the result of increased autophagic activity [Citation52]. For example, the small molecule bortezomib, which functions as a therapeutic agent for various cancers, has shown no significant therapeutic outcomes in patients with advanced NSCLC [Citation53]. The main reason for the lack of effectiveness of this compound may be due to the upregulation of autophagy [Citation52]. Therefore, suppressing autophagy, especially late-stage autophagy, is an attractive approach and is being investigated as a new strategy for NSCLC treatment. These observations reflect the potential clinical importance of CA-5f on NSCLC therapy.
In summary, we identified CA-5f as a novel late-stage autophagy inhibitor both in vitro and in vivo. Mechanistically, CA-5f-mediated blockage of autophagosome-lysosome fusion might be associated with its suppression of cytoskeletal and membrane vesicle trafficking protein expression instead of influencing lysosomal pH or lysosomal proteolytic activity. CA-5f exhibits cytotoxic effects by increasing the level of mitochondrial-derived ROS. This compound is more cytotoxic against NSCLC cells compared with normal epithelial cells. In addition, CA-5f effectively inhibits the growth of A549 lung cancer xenografts as a single agent with an excellent tolerance in vivo. Our study provides a useful late-stage autophagy inhibitor, which would not only find application in basic research to explore the mechanism of autophagosome-lysosome fusion, but would also see potential therapeutic use for treatment of NSCLC. Further studies are necessary to investigate the detailed mechanism of CA-5f acting on membrane vesicle trafficking and the cytoskeleton. Moreover, further examination of the anti-tumor efficacy of CA-5f in combination with certain chemotherapeutic agents that induce autophagy would be of significance.
Materials and methods
Materials and antibodies
The compound CA-5f was previously synthesized in our laboratory (purity was established as at least 99% by high performance liquid chromatography analysis) and dissolved in dimethyl sulfoxide (DMSO) to make a stock solution at 0.1 M, which was stored at −20°C and diluted with proper medium to various concentrations before use. Fetal bovine serum (FBS; SH30084.03) for HUVEC culture was obtained from HyClone. MCDB131 medium (10,372,019), RPMI 1640 medium (11,875,101), Dulbecco’s modified Eagle medium (DMEM; 11,995,065), and minimum essential medium (MEM; 11,095,080) were purchased from Gibco. FBS for other cells culture (E600001), trypsin (A003702), bis-acrylamide (A600025-0250), sodium dodecyl sulfate (SDS; A100227), tris (A600194-0500), ammonium persulfate (A600072-0100) and DMSO (A100231-0500) were obtained from Shanghai Sangon Biotech. Earle’s balanced salt solution (EBSS; E2888), protease inhibitor cocktail (P8340), 3-methyladenine (3-MA; M9281), chloroquine (CQ; C6628), diphenyleneiodonium chloride (DPI; D2926), thiazolyl blue tetrazolium bromide (MTT; M2128), acridine orange (AO; 235,474), Hoechst 33,258 (B2883), and 4,6-diamidino-2-phenylindole dihydrochloride (DAPI, D8417) were purchased from Sigma-Aldrich. Premo™ autophagy sensor LC3B-GFP (BacMam 2.0; P36235), Premo™ autophagy tandem sensor RFP-GFP-LC3B kit (P36239), MitoSOX™ red mitochondrial superoxide indicator (M36008), specific siRNAs against DNM2 (HSS102856, HSS102857, HSS102858), specific siRNAs against PIK3C3 (HSS108001, HSS108002, HSS108003), and LipofectamineTM RNAiMAX transfection reagent (13,778,500) were purchased from Invitrogen. Bafilomycin A1 (19–148) was obtained from Merck/EMD Millipore/Sigma. FITC ANXA5 (annexin A5) apoptosis detection kit I (556,547) was purchased from BD Biosciences. N-acetyl cysteine (NAC; S0077), Lyso-Tracker Red (C1046), Reactive Oxygen Species Assay Kit (S0033), mitochondrial membrane potential assay kit with JC-1 (C2006), acid phosphatase assay kit (P0326), and apoptosis inducers kit (C0005) were purchased from Beyotime Biotechnology. Wortmannin (W8030), bovine serum albumin (BSA, A8020) and GoldView I nucleic acid dye (G8140) were purchased from Solarbio. Cathepsin B and D activity fluorometric assay kits (K140 and K143, respectively) were obtained from BioVision. Lactate dehydrogenase assay kit (A020-1) was purchased from NanJing JianCheng. RaPure total RNA kit (R4011-02) was obtained from Magen. 2 × Taq Master Mix (Dye Plus; P112), HiScript®II Q RT SuperMix for qPCR (R223-01) and AceQ® qPCR SYBR® Green Master Mix (Q111) were obtained from Vazyme Biotechnology. The primary antibodies against LC3B (L7543), SQSTM1 (P0067), GAPDH (G9545), MTOR (T2949), phospho-MTOR (SAB4504476), PIK3C3 (V9764), LMO7 (HPA020923), SEPT8 (SAB2702108), SYN1 (S193), and ACTB (A5441) were purchased from Sigma-Aldrich. The primary antibodies against ATG5 (12,994) and LAMP1 (15,665) were purchased from Cell Signaling Technology. The primary antibodies against SNX5 (A4646), SNX18 (A10337), DNM2 (A0523) and MYO1E (A13032) were purchased from ABclonal Technology. The primary antibody against PARP1 (AP102) was purchased from Beyotime Biotechnology. The secondary antibodies IRDye® 680RD goat anti-rabbit (926–68,071), IRDye® 680RD goat anti-mouse (926–68,070), IRDye® 800CW goat anti-rabbit (925–32,211), and IRDye® 800CW goat anti-mouse (925–32,210) were purchased from Li-Cor Biosciences. The secondary antibodies horseradish peroxidase (HRP)-conjugated goat anti-rabbit (ZF-2301), HRP-conjugated goat anti-mouse (ZF-5305), HRP-conjugated goat anti-rat (ZB-2307), Alexa Flour® 488 goat anti-mouse IgG (ZF-0512), Alexa Flour® 488 goat anti-rabbit IgG (ZF-0511), TRITC-conjugated goat anti-rat IgG (ZF-0318), FITC-conjugated goat anti-rabbit IgG (ZF-0311), and TRITC-conjugated goat anti-rabbit IgG (ZF-0316) were purchased from Beijing ZSGB-BIO (http://www.zsbio.com/). The secondary antibody Alexa Flour® 647 goat anti-rabbit IgG (150,079) was purchased from Abcam. Scrambled siRNA and specific siRNAs against LMO7 or MYO1E were synthesized by Shanghai GenePharma. specific siRNAs against ATG5 (sc-41,445) were purchased from Santa Cruz Biotechnology.
Cell culture
HUVECs were isolated from the vein of the umbilical cords of 7 healthy donors according to Jaffe et al [Citation54]. The cells were cultured and identified as previously described [Citation55]. HUVECs used in the present study were at or before passage 8. A549 (SCSP-503), H1299 (SCSP-589), H358 (SCSP-583) and H1650 (SCSP-592) were purchased from the Cell Bank of Chinese Academy of Sciences (http://www.cellbank.org.cn). H157 (CRL-5802TM), HepG2 (HB-8065™), HeLa (CCL-2TM) and HEK-293 (CRL-1573TM) were purchased from the American Type Culture Collection. HK-2 (GDC152) and BEAS-2B (GDC139) were purchased from the China Center for Type Culture Collecton (http://www.cctcc.org). A549, H1299, H157, H358 and H1650 cells were maintained in RPMI 1640 medium. HepG2, HeLa and HEK-293 cells were cultured in DMEM medium. HK-2 cells were maintained in MEM medium. BEAS-2B cells were cultured in the base medium provided by China Center for Type Culture Collecton. All cell lines were cultured in medium containing 10% FBS and supplemented with 100 U/mL penicillin, 100 mg/mL streptomycin (Solarbio, P1400) in a humidified incubator at 37°C with 5% CO2.
Western blot analysis
After treatment, the cells or tumor tissues were harvested and lysed in lysis buffer containing 25 mM Tris–HCl (pH 6.8), 2% SDS, 6% glycerol, 2 mM PMSF (Sigma-Aldrich, P7626), 1% 2-mercaptoethanol (Sigma-Aldrich, 07604), 0.02% bromophenol blue and a protease inhibitor cocktail. Equal amounts of total proteins were separated by 12% or 15% SDS-polyacrylamide gel electrophoresis, and transferred to nitrocellulose membranes (BIO-RAD, 1,620,112, 1,620,115) or polyvinylidene difluoride (PVDF) membranes (Millipore, ISEQ00010, IPVH00010). Then the membranes were blocked with 5% (w:v) BSA and 0.05% Tween-20 (Shanghai Sangon Biotech, A600560-0500) in phosphate buffer saline (PBS-T), followed by incubation with different primary antibodies at 4°C overnight. The nitrocellulose membranes were blotted with IRDye 680 or 800 labeled secondary antibodies and the protein bands were scanned using a Li-Cor Odyssey system (Li-Cor Biosciences). The images were analyzed using the Odyssey Application Software to obtain the integrated fluorescence intensities. The PVDF membranes were incubated with HRP-conjugated secondary antibodies and the immunoreactive bands were developed with the Pierce ECL western blotting substrate (Thermo Fisher Scientific, 32,106). The photodensitometric data from protein bands were quantified using Quantity One software (Bio-Rad).
Plasmid transfection
A549 cells or HUVECs were plated on 48-well culture dishes. When cells reached 50%-60% confluency, they were transfected with Premo™ Autophagy Sensor LC3B-GFP or RFP-GFP-LC3B in the dark for 16 h according to the manufacturer’s protocol.
Transmission electron microscopy
A549 cells or HUVECs were seeded into 100-mm culture dishes. When cells reached 80% confluency, they were exposed to DMSO or CA-5f for 6 h or 24 h. Then the cells were fixed, dehydrated, embedded, sectioned, and stained as previously described [Citation56]. Finally, the ultrathin sections of these samples were observed under a JEM-1230 transmission electron microscopy (JEOL Co., Ltd., Japan).
Quantitative real-time PCR (qRT-PCR)
qRT-PCR was performed as previously reported [Citation55]. The specific primers were listed as below: GAPDH-F: 5ʹ-AATGACCCCTTCATTGAC, GAPDH-R: 5ʹ-TCCACGACGTACTCAGCGC, LC3B-F: 5ʹ-AAACGCATTTGCCATCACAGT, LC3B-R: 5ʹ-GTGAGGACTTTGGGTGTGGTTC, SQSTM1-F: 5ʹ-TACGACTTGTGTAGCGTCTGC, SQSTM1-R: 5ʹ-GTGTCCGTGTTTCACCTTCC.
Cell viability assay
Cell viability was determined in real-time using the xCELLigence RTCA S16 System (ACEA Biosciences). A549 cells or HUVECs were seeded into E-Plate 16-well plates overnight and then treated with DMSO or CA-5f and continuously monitored for 96 h. The changes of cell index can be used to monitor cell viability. Data were acquired and analyzed using RTCA S16 Software (version 1.0) supplied with the instrument. In addition, cell viability was measured using MTT assay according to our previous study [Citation57].
ANXA5-PI double-staining assay
A549 cells or HUVECs were seeded into 100-mm culture dishes. When cells reached 80% confluency, they were exposed to DMSO or CA-5f for 24 h. Then the cells were stained using the FITC Annexin V apoptosis detection kit I according to the manufacturer’s protocol (556,547, BD Biosciences). Positive controls were performed using commercial apoptosis inducers kit. Data acquisition and data analysis were carried out using flow cytometry (BD FACSCalibur) and the Cell Quest software.
Lactate dehydrogenase assay
A549 cells or HUVECs were plated on 24-well culture dishes. When cells reached 80% confluency, they were treated with DMSO or various concentrations of CA-5f for 24 h. The cell culture medium was collected and centrifugated at 400 g for 10 min. Then the suspension was transferred into a new 96-well plate for LDH assay according to the manufacturer’s protocol. Absorbance of the reaction mixture was measured at 340 nm using an EpochTM spectrophotometer.
Double immunofluorescence
A549 cells or HUVECs were plated on 48-well culture dishes. When cells reached 80% confluency, they were treated with DMSO, CA-5f, or CQ for 6 h. After treatment, cells were fixed in 4% paraformaldehyde (Shanghai Sangon Biotech, E672002-0500) for 15 min at 4°C and blocked in 5% BSA for 30 min. Subsequently, cells were incubated with anti-LC3B (1:500) and anti-LAMP1 (1:300) antibodies overnight at 4°C and then incubated with the appropriate secondary antibodies. Nuclei were stained with Hoechst 33,258 for 15 min. Fluorescence photos were taken using a confocal laser-scanning microscope (Olympus FLUOVIEW FV3000). Different fields of view (>5 regions) were analyzed on the confocal laser-scanning microscope for each labeling condition, and representative results were shown.
Analysis of the activities of ACP, CTSB, and CTSD
ACP, CTSB, and CTSD activities were measured using the commercial assay kits according to the manufacturer’s protocols, respectively. For ACP, the absorbance of samples was measured at 405 nm using an EpochTM spectrophotometer (BioTek Instruments). The samples were read in a microplate reader (PerkinElmer EnSpire) with 400 nm excitation and 505 nm emission for CTSB and 328 nm excitation and 460 nm emission for CTSD.
iTRAQ proteomic screen coupled with LC-MS/MS analysis
HUVECs were seeded into 100-mm culture dishes. When cells reached 80% confluency, they were treated with DMSO or CA-5f for 1 h. After collection, HUVECs were transferred to the Beijing Proteome Research Center (http://www.bprc.ac.cn/) for further treatment and analysis, including protein preparation, iTRAQ labeling, 2D LC-MS/MS, data processing, and database searching, which were performed as previously reported [Citation58]. The false discovery rate (FDR) was set to 0.01 for both of peptide and protein identifications. Fold change (FC) was calculated as the average ratio of 115:114 for differentially expressed proteins, and samples with an FC > 1.5 or <0.78 and p ≤ 0.05 were considered to be significantly differentially expressed proteins in control and CA-5f-treated HUVECs.
Bioinformatics analysis
The differentially expressed proteins were classified using GO annotation and pathway enrichment according to KOBAS 3.0 database (http://kobas.cbi.pku.edu.cn/anno_iden.php). P-value ≤0.05 was set as the cutoff criterion for GO annotation and pathway enrichment analysis. Additionally, protein functional clustering analysis was performed using the PANTHER database (http://www.pantherdb.org/).
Animal treatment
Four-week-old BALB/c nude mice were purchased from Beijing Vital River Laboratory Animal Technology Co., Lt and kept in specific pathogen-free conditions at the Experimental Animal Center in the Institute of Medicine in Zhengzhou University (Henan Province, China). Nude mice underwent subcutaneous injection of A549 cells (1 × 10⁶) at the right scapula. 8 days after A549 cell implantation, mice exhibited palpable tumors, then they were randomly divided into 2 groups (each group n = 5). CA-5f was injected via caudal vein every 2 days for up to 30 days. DMSO was used as a control. From the initial injection, the tumor size was measured every 2 days. Tumor volumes were calculated as tumor length × (square of width)/2. At the end of the experiment, all mice were sacrificed and the tumors were resected immediately and photographed. The weight of each tumor was measured. All procedures were in accordance with the Guide for the Care and Use of Laboratory Animals published by the US National Institutes of Health (NIH Publication No. 85–23, revised 1996) and was approved by the Animal Care Committee of Henan University of Technology.
Immunofluorescence and TUNEL analysis
Tumor tissues were snap-frozen in optimal cutting temperature (OCT) embedding medium (Tissue-Tek) and sectioned. Cryosections of tumors (7 μm) were fixed in cold acetone and incubated with the primary antibodies: LC3B, SQSTM1, CTSB, and CTSD overnight at 4°C and then incubated with the appropriate secondary antibodies for 30 min at 37°C. Nuclei were stained with DAPI for 15 min. Cell apoptosis in tumors was detected by TUNEL analysis using the FragEL DNA Fragmentation Kit (Beyotime, C1086) according to the manufacturer’s protocol. Slides were observed under a confocal laser-scanning microscope (Olympus FLUOVIEW FV3000) and representative results are shown.
Statistical analysis
All experiments were performed in duplicate and repeated at least 3 times. Results were expressed as means ± standard error of the mean (SEM). The differences between groups were analyzed by one-way variance (ANOVA), and the means of 2 groups were compared using Student’s t-test with SPSS (version.17.0). Differences at p < 0.05 were considered statistically significant.
Supplemental Material
Download Zip (26.5 MB)Disclosure statement
No potential conflict of interest was reported by the authors.
Supplemental Materials
Supplemental data for this article can be accessed here.
Additional information
Funding
Related Research Data
References
- Klionsky DJ, Emr SD. Autophagy as a regulated pathway of cellular degradation. Science. 2000;290(5497):1717–1721.
- Galluzzi L, Pietrocola F, Levine B, et al. Metabolic control of autophagy. Cell. 2014;159(6):1263–1276.
- Schneider JL, Cuervo AM. Autophagy and human disease: emerging themes. Curr Opin Genet Dev. 2014;26(26):16–23.
- Kimmelman AC, White E. Autophagy and tumor metabolism. Cell Metab. 2017;25(5):1037.
- Wang C, Hu Q, Shen HM. Pharmacological inhibitors of autophagy as novel cancer therapeutic agents. Pharmacol Res. 2016;105:164–175.
- Chude CI, Amaravadi RK. Targeting autophagy in cancer: update on clinical trials and novel inhibitors. Int J Mol Sci. 2017;18(6):1279.
- Liu J, Xia H, Kim M, et al. Beclin1 controls the levels of p53 by regulating the deubiquitination activity of USP10 and USP13. Cell. 2011;147(1):223–234.
- Ronan B, Flamand O, Vescovi L, et al. A highly potent and selective Vps34 inhibitor alters vesicle trafficking and autophagy. Nat Chem Biol. 2014;10(12):1013–1019.
- Akin D, Wang SK, Habibzadegahtari P, et al. A novel ATG4B antagonist inhibits autophagy and has a negative impact on osteosarcoma tumors. Autophagy. 2014;10(11):2021–2035.
- Egan DF, Chun MG, Vamos M, et al. Small molecule inhibition of the autophagy kinase ULK1 and identification of ULK1 substrates. Mol Cell. 2015;59(2):285–297.
- Carew JS, Espitia CM, Esquivel JA 2nd, et al. Lucanthone is a novel inhibitor of autophagy that induces cathepsin D mediated apoptosis. J Biol Chem. 2011;286(8):6602–6613.
- Mcafee Q, Zhang Z, Samanta A, et al. Autophagy inhibitor Lys05 has single-agent antitumor activity and reproduces the phenotype of a genetic autophagy deficiency. Proc Natl Acad Sci U S A. 2012;109(21):8253–8258.
- Lao Y, Wan G, Liu Z, et al. The natural compound oblongifolin C inhibits autophagic flux and enhances antitumor efficacy of nutrient deprivation. Autophagy. 2014;10(5):736–749.
- Zhou J, Li G, Zheng Y, et al. A novel autophagy/mitophagy inhibitor liensinine sensitizes breast cancer cells to chemotherapy through DNM1L-mediated mitochondrial fission. Autophagy. 2015;11(8):1259–1279.
- De Mei C, Ercolani L, Parodi C, et al. Dual inhibition of REV-ERBβ and autophagy as a novel pharmacological approach to induce cytotoxicity in cancer cells. Oncogene. 2015;34(20):2597–2608.
- Zhao X, Fang Y, Yang Y, et al. Elaiophylin, a novel autophagy inhibitor, exerts antitumor activity as a single agent in ovarian cancer cells. Autophagy. 2015;11(10):1849–1863.
- Long Z, Chen B, Liu Q, et al. The reverse-mode NCX1 activity inhibitor KB-R7943 promotes prostate cancer cell death by activating the JNK pathway and blocking autophagic flux. Oncotarget. 2016;7(27):42059–42070.
- Shi TT, Yu XX, Yan LJ, et al. Research progress of hydroxychloroquine and autophagy inhibitors on cancer. Cancer Chemother Pharmacol. 2017;79(2):287–294.
- Lin SR, Fu YS, Tsai MJ, et al. Natural compounds from herbs that can potentially execute as autophagy inducers for cancer therapy. Int J Mol Sci. 2017;18(7):1412.
- Aoki H, Takada Y, Kondo S, et al. Evidence that curcumin suppresses the growth of malignant gliomas in vitro and in vivo through induction of autophagy: role of Akt and extracellular signal-regulated kinase signaling pathway. Mol Pharmacol. 2007;72(1):29–39.
- Xiao K, Jiang J, Guan C, et al. Curcumin induces autophagy via activating the AMPK signaling pathway in lung adenocarcinoma cells. J Pharmacol Sci. 2013;123(2):102–109.
- Yosifov DY, Kaloyanov KA, Guenova ML, et al. Alkylphosphocholines and curcumin induce programmed cell death in cutaneous T-cell lymphoma cell lines. Leukemia Research. 2014;38(1):49–56.
- Guan F, Ding Y, Zhang Y, et al. Curcumin suppresses proliferation and migration of MDA-MB-231 breast cancer cells through autophagy-dependent Akt degradation. Plos One. 2016;1(1):e0146553.
- Qu W, Xiao J, Zhang H, et al. B19, a novel monocarbonyl analog of curcumin, induces human ovarian cancer cell apoptosis via activation of endoplasmic reticulum stress and the autophagy signaling pathway. Int J Biol Sci. 2013;9(8):766–777.
- Vallianou NG, Evangelopoulos A, Schizas N, et al. Potential anticancer properties and mechanisms of action of curcumin. Anticancer Res. 2015;35(2):645–651.
- Gyuris M, Hackler L Jr, Nagy LI, et al. Mannich curcuminoids as potent anticancer agents. Archiv Der Pharmazie. 2017;350:7.
- Zhang J, Wang J, Xu J, et al. Curcumin targets the TFEB-lysosome pathway for induction of autophagy. Oncotarget. 2016;7(46):75659–75671.
- Han J, Pan XY, Xu Y, et al. Curcumin induces autophagy to protect vascular endothelial cell survival from oxidative stress damage. Autophagy. 2012;8(5):812–825.
- Yang K, Xu C, Li X, et al. Combination of D942 with curcumin protects cardiomyocytes from ischemic damage through promoting autophagy. J Cardiovasc Pharmacol Ther. 2013;18(6):570–581.
- Masuelli L, Benvenuto M, Di Stefano E, et al. Curcumin blocks autophagy and activates apoptosis of malignant mesothelioma cell lines and increases the survival of mice intraperitoneally transplanted with a malignant mesothelioma cell line. Oncotarget. 2017;8(21):34405–34422.
- Zhang P, Lai ZL, Chen HF, et al. Curcumin synergizes with 5-fluorouracil by impairing AMPK/ULK1-dependent autophagy, AKT activity and enhancing apoptosis in colon cancer cells with tumor growth inhibition in xenograft mice. J Exp Clin Cancer Res. 2017;36(1):190.
- Wang J, Sun GC, Li ZC, et al. ChemInform abstract: synthesis and biological evaluation of curcumin analogs having a piperidone core as potential antioxidant agents. Cheminform. 2012;43(30):63–65.
- Klionsky DJ, Abdelmohsen K, Abe A, et al. Guidelines for the use and interpretation of assays for monitoring autophagy. Autophagy. 2016;12(1):1–222. (3rd edition).
- Mains RE, May V. The role of a low pH intracellular compartment in the processing, storage, and secretion of ACTH and endorphin. J Biol Chem. 1988;263(16):7887–7894.
- Kast DJ, Dominguez R. The Cytoskeleton-Autophagy Connection. Current Biology Cb. 2017;27(8):R318–R326.
- Yan Y, Finkel T. Autophagy as a regulator of cardiovascular redox homeostasis. Free Radic Biol Med. 2017;109:108–113.
- Xiang XY, Yang XC, Su J, et al. Inhibition of autophagic flux by ROS promotes apoptosis during DTT-induced ER/oxidative stress in HeLa cells. Oncol Rep. 2016;35(6):3471–3479.
- Xu Y, Xia X, Pan H. Active autophagy in the tumor microenvironment: A novel mechanism for cancer metastasis. Oncol Lett. 2013;5(2):411–416.
- Tatti M, Motta M, Di Bartolomeo S, et al. Cathepsin-mediated regulation of autophagy in saposin C deficiency. Autophagy. 2013;9(2):241–243.
- Chen QY, Shi JG, Yao QH, et al. Lysosomal membrane permeabilization is involved in curcumin-induced apoptosis of A549 lung carcinoma cells. Mol Cell Biochem. 2012;359(1–2):389–398.
- Song JX, Sun YR, Peluso I, et al. A novel curcumin analog binds to and activates TFEB in vitro and in vivo independent of MTOR inhibition. Autophagy. 2016;12(8):1372–1389.
- Mijaljica D, Prescott M, Devenish RJ. The intriguing life of autophagosomes. International Int J Mol Sci. 2012;13(3):3618–3635.
- Monastyrska I, Rieter E, Klionsky DJ, et al. Multiple roles of the cytoskeleton in autophagy. Biol Rev Camb Philos Soc. 2009;84(3):431–448.
- Totta P, Busonero C, Leone S, et al. Dynamin II is required for 17β-estradiol signaling and autophagy-based ERα degradation. Sci Rep. 2016;6:23727.
- Korolchuk VI, Saiki S, Lichtenberg M, et al. Lysosomal positioning coordinates cellular nutrient responses. Nat Cell Biol. 2011;13(4):453–460.
- Guerra F, Bucci C. Multiple roles of the Small GTPase Rab7. Cells. 2016;5:3.
- Trachootham D, Alexandre J, Huang P. Targeting cancer cells by ROS-mediated mechanisms: a radical therapeutic approach? Nat Rev Drug Discov. 2009;8(7):579–591.
- Wang J, Yi J. Cancer cell killing via ROS: to increase or decrease, that is the question. Cancer Biol Ther. 2008;7(12):1875–1884.
- Button RW, Roberts SL, Willis TL, et al. Accumulation of autophagosomes confers cytotoxicity. J Biol Chem. 2017;292(33):13599–13614.
- Morgan MJ, Gamez G, Menke C, et al. Regulation of autophagy and chloroquine sensitivity by oncogenic RAS in vitro is context-dependent. Autophagy. 2014;10(10):1814–1826.
- Wang J, Chen J, Guo Y, et al. Strategies targeting angiogenesis in advanced non-small cell lung cancer. Oncotarget. 2017;8(32):53854–53872.
- van der Wekken AJ, Saber A, Hiltermann TJ, et al. Resistance mechanisms after tyrosine kinase inhibitors afatinib and crizotinib in non-small cell lung cancer, a review of the literature. Crit Rev Oncol Hematol. 2016;100:107–116.
- Hoang T, Campbell TC, Zhang C, et al. Vorinostat and bortezomib as third-line therapy in patients with advanced non-small cell lung cancer: a Wisconsin oncology network phase II study. Invest New Drugs. 2014;32(1):195–199.
- Jaffe EA, Nachman RL, Becker CG, et al. Culture of human endothelial cells derived from umbilical veins. Identification by morphologicand immunologic criteria. J Clin Invest. 1973;52(11):2745–2756.
- Zhang L, Dai F, Cui L, et al. Novel role for TRPC4 in regulation of macroautophagy by a small molecule in vascular endothelial cells. Biochim Biophys Acta. 2015;1853(2):377–387.
- Zhang L, Wang X, Miao Y, et al. Magnetic ferroferric oxide nanoparticles induce vascular endothelial cell dysfunction and inflammation by disturbing autophagy. J Hazard Mater. 2016;304:186–195.
- Chen Z, Zhang L, Yu J, et al. Identification of resveratrol derivative 3,3′,4,4′,5,5′-hexamethoxy- trans-stilbene as a novel pro-angiogenic small-molecule compound. Eur J Pharmacol. 2016;791:185–194.
- Qi Y, Xu F, Chen L, et al. Quantitative proteomics reveals FLNC as a potential progression marker for the development of hepatocellular carcinoma. Oncotarget. 2016;7(42):68242–68252.