
ABSTRACT
Mounting attention has been focused on defects in macroautophagy/autophagy and the autophagy-lysosomal pathway (ALP) in cerebral ischemia. TFEB (transcription factor EB)-mediated induction of ALP has been recently considered as the common mechanism in ameliorating the pathological lesion of myocardial ischemia and neurodegenerative diseases. Here we explored the vital role of TFEB in permanent middle cerebral artery occlusion (pMCAO)-mediated dysfunction of ALP and ischemic insult in rats. The results showed that ALP function was first enhanced in the early stage of the ischemic process, especially in neurons of the cortex, and this was accompanied by increased TFEB expression and translocation to the nucleus, which was mediated at least in part through activation by PPP3/calcineurin. At the later stages of ischemia, a gradual decrease in the level of nuclear TFEB was coupled with a progressive decline in lysosomal activity, accumulation of autophagosomes and autophagy substrates, and exacerbation of the ischemic injury. Notably, neuron-specific overexpression of TFEB significantly enhanced ALP function and rescued the ischemic damage, starting as early as 6 h and even lasting to 48 h after ischemia. Furthermore, neuron-specific knockdown of TFEB markedly reversed the activation of ALP and further aggravated the neurological deficits and ischemic outcome at the early stage of pMCAO. These results highlight neuronal-targeted TFEB as one of the key players in the pMCAO-mediated dysfunction of ALP and ischemic injury, and identify TFEB as a promising target for therapies aimed at neuroprotection in cerebral ischemia.
Abbreviations: AAV, adeno-associated virus; AIF1/IBA1, allograft inflammatory factor 1; ALP, autophagy-lysosomal pathway; CQ, chloroquine; CTSB, cathepsin B; CTSD, cathepsin D; CsA, cyclosporin A; GFAP, glial fibrillary acidic protein; LAMP, lysosomal-associated membrane protein; LC3, microtubule-associated protein 1 light chain 3; MAP2, microtubule-associated protein 2; mNSS, modified Neurological Severity Score; MTOR, mechanistic target of rapamycin kinase; OGD, oxygen and glucose deprivation; pMCAO, permanent middle cerebral artery occlusion; RBFOX3/NeuN, RNA binding fox-1 homolog 3; SQSTM1, sequestosome1; TFEB, transcription factor EB; TTC, 2,3,5-triphenyltetrazolium chloride.
Introduction
Autophagy is an evolutionarily conserved process in which intracellular proteins and organelles are degraded in lysosomes. It has only recently been identified as a key regulator of ischemic stroke [1–4], but the role of dynamic changes in the autophagy-lysosomal pathway (ALP) in cerebral ischemia is controversial [Citation5]. Mounting evidence strongly indicates that ALP is induced in multiple ischemic stroke models as reflected by the accumulation of autophagosomes and activation of lysosomal function [Citation1,Citation2,Citation6,Citation7]. However, it is noteworthy that ischemic injury can trigger a defect in ALP by causing lysosomal dysfunction, thus resulting in the abnormal accumulation of autophagosomes and substrates [Citation8–Citation12]. In a 2-vessel occlusion (2-VO) ischemic stroke model, treatment with chloroquine (CQ) does not further change the LC3-II levels, suggesting that ALP is impaired [Citation8]. In our latest study, impaired ALP function is also observed at 24 h in a model of permanent cerebral ischemia [Citation9]. Additionally, lysosomal dysfunction, as reflected by cytosolic acidification and rupture/permeabilization, is detected after ischemic insult [Citation10–Citation12]. These inconsistent data suggest that the alteration of ALP may be a dynamic process as is the development of ischemic injury. Further, the role of autophagy in regulating neuronal death/survival is still not clear [Citation7,Citation13–Citation15]. Thus, it is also essential to clarify the involvement of autophagy in the ischemia process and its contribution to the final fate of neurons.
TFEB (transcription factor EB) was recently discovered as a master regulator of ALP due to its ability to coordinate expression of autophagy and lysosomal target genes and enhance lysosomal biogenesis [Citation16]. As a potent activator of ALP, TFEB has been identified as a potential therapeutic target to ameliorate various diseases including myocardial ischemia [Citation17–Citation19] and neurodegenerative diseases [Citation20–Citation23]. In a myocardial infarction model, TFEB knockdown attenuates the pro-autophagic and pro-survival effects exerted by trehalose, suggesting that targeting of TFEB has therapeutic potential to rescue ischemic injury [Citation19]. Moreover, forced expression of TFEB in cells expressing BNIP3 (BCL2 interacting protein 3) increase lysosome numbers, prevent the accumulation of autophagosomes and substrates, and attenuate BNIP3-induced cardiomyocyte death [Citation18]. Furthermore, transcriptional priming of the autophagy-lysosome machinery by TFEB mediates the beneficial effects of fasting-induced autophagy in myocardial ischemia-reperfusion injury [Citation17]. Additionally, enhancement of TFEB function stimulates ALP function and promotes clearance of proteins such as SNCA/α-synuclein [Citation22], MAPT/Tau [21], Aβ [Citation20] and HTT [Citation23] in models of Parkinson, Alzheimer and Huntington diseases, thus providing a neuroprotective effect to attenuate the pathological lesions. These observations indicate that TFEB-mediated induction of ALP is a common cellular mechanism for ameliorating the pathological lesions of myocardial ischemia and neurodegenerative diseases. However, the role of TFEB in regulating ALP function and cerebral ischemic insult is so far unknown.
We therefore evaluated changes in the pattern of ALP in the setting of permanent middle cerebral artery occlusion (pMCAO), especially whether TFEB was able to regulate ALP function and consequently protect neurons against ischemic injury. The results provide the first evidence that permanent cerebral ischemia results in dynamic changes of ALP. Especially at the early stage of the ischemia process, the enhancement of ALP is accompanied by increased TFEB expression and translocation of TFEB into the nucleus, which is mediated at least in part through activation by PPP3/calcineurin. In particular, neuron-specific overexpression of TFEB rescues ALP dysfunction and alleviates the ischemic injury following pMCAO. Our study identifies TFEB as a potential target for therapies aimed at enhancing neuroprotection to ameliorate the ischemic insult.
Results
Permanent cerebral ischemia results in a dynamic change of ALP
Rats with pMCAO were used as an in vivo model of cerebral ischemia. The infarct volume, brain water content and neurological scores from 3 h to 48 h gradually increased after ischemic stroke, indicating the successful establishment of pMCAO (Figure S1(a–d)). Meanwhile, degenerative changes in neurons, as indicated by decreased expression of the neuron marker MAP2 (microtubule-associated protein 2), lower numbers of RBFOX3/NeuN (RNA binding fox-1 homolog 3)-positive cells, and reduced cell viability (Figure S1(e–h)), were observed both in rats subjected to pMCAO and primary cultured cortical neurons treated with oxygen-glucose deprivation (OGD). To what extent these changes reflect alterations in ALP processing, however, is still controversial and requires further study. Thus, we monitored changes in ALP function using markers of autophagic and lysosomal activity.
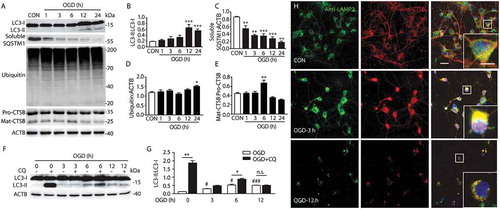
First, western blotting was conducted to analyze the expression of autophagy-related proteins in the rat cortex from 3 h to 48 h following pMCAO. The results showed that there was a significant increase in the expression of the autophagic marker MAP1LC3-II/LC3-II [Citation24] starting at 12 h, and reaching a maximum at 48 h following pMCAO (). SQSTM1 levels in both Triton X-100-soluble and -insoluble fractions were detected. The results showed that the soluble SQSTM1 expression was gradually decreased and reached the minimum at 48 h after ischemic damage (), while the expression of insoluble SQSTM1 and another substrate of autophagy, ubiquitinated proteins [Citation25], significantly increased (). Meanwhile, punctate LC3 fluorescence signals were observed in neurons in the ischemic cortex area at 24 h after pMCAO as compared with neurons in the sham-operated cortex wherein the LC3 signal was low and diffuse in the cytoplasm (Figure S2(a–c)). This result is consistent with the previous studies [Citation7,Citation26]. Similarly, in cultured primary neurons, the expression of LC3 and ubiquitinated proteins was increased from 1 h to 24 h after OGD, and peaked at 12 h (, while the soluble SQSTM1 expression was decreased (). These results are in accordance with the in vivo data. The above observations indicated that there was an abnormal accumulation of autophagosomes and substrates after pMCAO.
Figure 1. Permanent cerebral ischemia results in the dynamic change of ALP function. (a) The time-dependent changes of autophagy-lysosomal-related protein expression from 3 h to 48 h after pMCAO in ischemic cortex protein extracts. ACTB is used as a loading control. (b–h) Quantitative analysis of the immunoblotted proteins was performed with ImageJ. Statistical comparisons were carried out with ANOVA followed by Tukey’s test. Data are presented as mean ± SEM from 4 rats in each group. ***p < 0.001, **p < 0.01, *p < 0.05 vs. sham group. (i) Histograms showing the alterations of CTSB activity in the cortex of sham-operated rats and pMCAO-treated rats. CTSB activity was measured using a fluorimetric assay. Statistical comparisons were carried out with ANOVA followed by Tukey’s test. Data are presented as mean ± SEM from 4 rats in each group. **p < 0.01 vs. sham group. (j) The time-dependent changes of colocalization of LAMP2 with the lysosomal enzyme CTSB from 3 h to 48 h after pMCAO in ischemic cortex. Immunofluorescence images showing the colocalization of LAMP2-positive lysosomes (green) with the lysosomal enzyme CTSB (red) in the cortex of sham-operated rats and of pMCAO rats. Nuclei are stained with DAPI (blue). Scale bar: 20 μm. High-magnification images of the boxed areas are shown in the inserts. (k) Expression of LC3 in the sham-operated rats and pMCAO-treated rats with or without CQ. (l) Quantitative analysis of the LC3 protein, performed with ImageJ. Statistical comparisons were carried out with ANOVA followed by Tukey’s test. Data are presented as mean ± SEM from 4 rats in each group. **p < 0.01, *p < 0.05 vs. the same time point group without CQ. ###p < 0.001 vs. sham group. Pro, precursor form; Mat, mature form.
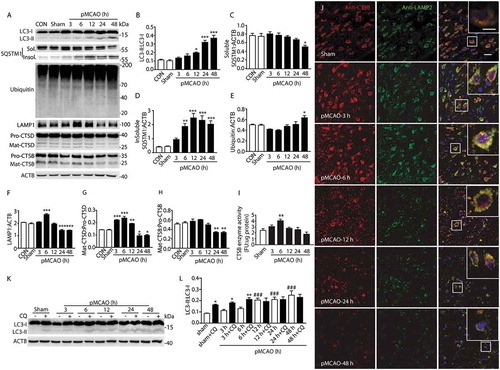
Figure 2. OGD treatment results in a dynamic change of ALP function. (a) The time-dependent changes in the expression of proteins related to ALP in primary cultured cortical neuron protein extracts from 1 h to 24 h after OGD. (b–e) Quantitative analysis of the immunoblotted proteins was performed with ImageJ. Statistical comparisons were carried out with ANOVA followed by Tukey’s test. Data are presented as mean ± SEM from 4 independent experiments. ***p < 0.001, **p < 0.01, *p < 0.05 vs. CON group. (f) Expression of LC3 in OGD groups with or without CQ. (g) Quantitative analysis of the immunoblotted proteins was performed with ImageJ. Statistical comparisons were carried out with ANOVA followed by Tukey’s test. Data are presented as mean ± SEM from 4 independent experiments. **p < 0.01, *p < 0.05 vs. CON group; #p < 0.05 vs. OGD group. (h) Colocalization of LAMP2 with the lysosomal enzyme CTSB at 3 and 12 h after OGD in primary neurons. Immunofluorescence images showing the colocalization of LAMP2-positive lysosomes (green) with the lysosomal enzyme CTSB (red) in the CON group and OGD groups. Nuclei are stained with DAPI (blue). Scale bar: 20 μm. High-magnification images of the boxed areas are shown in the inserts. Scale bar: 10 μm.
To identify the cell types in which LC3 is expressed, co-staining of LC3 and RBFOX3 (neuronal-specific marker), GFAP (astrocyte-specific marker) and AIF1/IBA1 (microglial-specific marker) was measured by immunofluorescence (Figure S2(a–c)). The results revealed that within the infarct regions of the cortex, punctate LC3 structures were abundant in neurons (RBFOX3-positive), but not in astrocytes (GFAP-positive) or microglia (AIF1-positive). Additionally, the numbers of RBFOX3-positive neurons were significantly reduced after pMCAO (Figure S1g), and the reactive astrocytes and microglia exhibited various stages of fragmentation (Figure S2(b,c)). The results indicated that most of the neurons, astrocytes and microglia were injured and even died at 24 h after pMCAO, which is consistent with the previous reports [Citation2]. These data suggested that autophagy mainly occurred in neurons in the pMCAO model.
The lysosome is an essential organelle for executing autophagic activity as its enzymes are required to degrade the contents of autophagosomes [Citation27,Citation28]. Hence, to evaluate lysosomal function in the ischemic cortex, we examined changes in the expression and/or activity of LAMP1 (lysosomal-associated membrane protein 1) and the lysosomal proteases CTSD (cathepsin D) and CTSB (cathepsin B) from 3 h to 48 h after pMCAO. The results showed that the expression of lysosomal markers (LAMP1 and CTSD) and the activity of CTSB enzyme were significantly increased at 6 h after pMCAO and then gradually decreased (). These data suggested a dynamic change of lysosomal function. The expression of both CTSB and CTSD started to sharply decrease from 24 h (,h)), indicating that lysosomes were ruptured at the late stage of pMCAO. The state of the lysosomes after pMCAO was also further examined by observing the colocalization of LAMP2 and CTSB via immunofluorescence. In the cortex of sham-operated rats, LAMP2 and CTSB both had a fine, granular, perinuclear distribution, and they colocalized upon merging to yield a yellow signal, which indicated intact lysosomes. In the ischemic cortex, the punctate fluorescence pattern of LAMP2 and CTSB, and their colocalization in the merged image, was enhanced at 3 h to 6 h, then subsequently decreased from 12 h after pMCAO ()). Furthermore, in cultured neurons after OGD, the expression of CTSB also appeared to increase at 6 h and then decreased after 6 h (). The colocalization of LAMP2 and CTSB in OGD-treated neurons showed a varying pattern in which the fluorescence signal was enhanced and then declined ()). Taken together, these findings revealed that lysosomal function was first induced at the early phase of permanent ischemic stroke, and then became impaired as the ischemic injury developed.
To further clarify the change of autophagic flux, the levels of LC3 were assayed at different time points in pMCAO-treated rat cortex and OGD-treated neurons in the presence or absence of CQ, which inhibits lysosomal proteases or blocks downstream autophagosome-lysosome fusion [Citation29]. Immunoblots showed that an intraperitoneal injection of CQ (60 mg/kg) in pMCAO rats led to significant upregulation of LC3-II as compared with the sham group, suggesting an intact autophagic flux. CQ caused a significant increase in the LC3-II level from 3 h to 6 h after ischemia, while from 12 h, the expression of LC3-II was not further elevated after CQ treatment (,l)). Similarly, the in vitro results indicated that when the neurons were given CQ, the LC3-II levels were increased from 3 h to 6 h but not further increased at 12 h (). These data confirmed that ALP function was induced and then diminished.
Permanent cerebral ischemia induces the activation of TFEB
To determine whether the dynamic changes of ALP were associated with nuclear translocation of TFEB, we examined the relative abundance of endogenous TFEB in total, nuclear and cytoplasmic fractions of cortex in rats and primary neurons. The data showed that in total extracts of pMCAO-treated rat cortex and OGD-treated neurons, the mRNA and protein level of TFEB were significantly upregulated at 6 h (Figures S2(h,I) and 3(b,c,g,h)), suggesting that TFEB expression was increased. Importantly, 6 h of ischemia resulted in marked accumulation of TFEB protein in the nuclear subfraction, with a corresponding decline in the cytoplasmic subfraction both in vivo and in vitro. Additionally, pMCAO treatment also changed the electrophoretic mobility of TFEB, which appeared as a fast-migrating form. The cytoplasmic TFEB had a slightly higher molecular weight than the nuclear TFEB, consistent with phosphorylated TFEB in the cytoplasm and non-phosphorylated TFEB in the nucleus (). These observations suggested that short-term ischemia caused TFEB to translocate to the nucleus.
Figure 3. Permanent cerebral ischemia induces the activation of TFEB. (a) Immunofluorescence images showing the distribution of TFEB in neurons in the ipsilateral cortex in sham-operated rats and pMCAO-treated rats, as detected by laser confocal microscopy using antibodies against TFEB (red) and RBFOX3 (green). Nuclei are labeled with DAPI (blue). Scale bar: 20 μm. High-magnification images of the boxed areas are shown in the inserts. Scale bar: 10 μm. (b) The time-dependent changes of TFEB expression from 3 h to 48 h after pMCAO in total cortex protein extracts. (d) Nuclear and cytoplasmic subfractions of cortex cells from pMCAO-treated rats were examined in the same gel to test the migrating bands and the shift in size of TFEB. (c, e and f) Quantitative analysis of the immunoblotted proteins was performed with ImageJ. Statistical comparisons were carried out with ANOVA followed by Tukey’s test. Data are presented as mean± SEM from 4 rats in each group. **p < 0.001, *p < 0.05 vs. sham group. (g) The time-dependent changes of TFEB expression from 1 h to 24 h after OGD in total protein extracts. (i) Nuclear and cytoplasmic subfractions of OGD-treated primary neurons were examined in the same gel to test the migrating bands and the shift in size of TFEB. (h, j and k) Quantitative analysis of the immunoblotted proteins was performed with ImageJ. Statistical comparisons were carried out with ANOVA followed by Tukey’s test. Data are presented as mean ± SEM from 4 independent experiments. ***p < 0.001, **p < 0.001, *p < 0.05 vs. CON group. (l) The time-dependent changes of TFEB expression in nuclei of OGD-treated primary neurons from 1 h to 12 h after the onset of treatment. Representative images show the colocalization of TFEB (red) and DAPI (blue) in OGD-treated neurons. Scale bar: 20 μm. High-magnification images of the boxed areas are shown in the inserts. Scale bar: 10 μm. (m and n) Columns represent Mander’s overlap coefficient. At least 3 independent experiments for each group were included. Data are expressed as mean ± SEM. ***p < 0.001, **p < 0.01, *p < 0.05 vs. sham or CON group. (o and p) Columns represent the nuclear: cytoplasmic ratio of TFEB. Data are expressed as mean± SEM. ***p < 0.001 vs. sham or CON group.
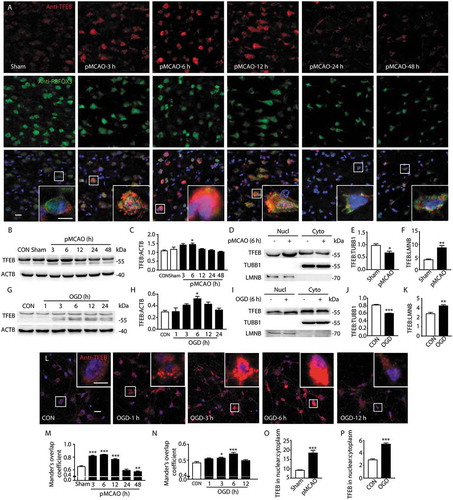
Furthermore, the expression of TFEB was also examined through immunofluorescence studies by observing the distribution of TFEB with RBFOX3, GFAP and AIF1. In sham-operated rats or control cultured neurons, weak, diffuse and perinuclear TFEB staining was observed, which did not clearly colocalize with nuclei in the merged image ()). In contrast, 6 h after pMCAO or OGD, there was a pronounced expression of TFEB and colocalization of TFEB with RBFOX3 in the merged image, evidenced by increased average optical density, and a significant increase of Mander’s overlap coefficient (,l–n) and S2(f,g)). Additionally, it was found that the abundance of total TFEB, especially in the nucleus, decreased after 6 h, which was in line with a subsequent decrease in the fluorescence intensity and average optical density of TFEB (,l) and S2(F,G)), as well as a decrease of nuclear TFEB at 48 h (Figure s4(e,f)). Again, TFEB did not show marked overlap with GFAP and AIF1 in the merged images in either the sham- or pMCAO-operated rats, suggesting that the activated TFEB was mainly expressed in neurons, but not in microglia or astrocytes (Figure S2(d,e)). These data indicated that short-term ischemic insult caused the activation of TFEB, especially in neurons, as indicated by the enhanced expression and translocation to nuclei, and this was followed by a decrease in nuclear TFEB at the late stage of ischemia.
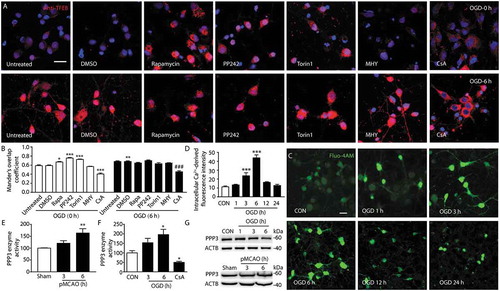
It is well known that TFEB activity is regulated, at least in part, by PPP3/calcineurin [Citation30] and MTORC1 [Citation31,Citation32]. Therefore, we used a PPP3/calcineurin inhibitor (cyclosporin A [CsA]), MTORC1 inhibitors (rapamycin, PP242, Torin1) or an MTORC1 agonist (MHY) to determine whether TFEB nuclear translocation is dependent on PPP3/calcineurin phosphatase or MTORC1 kinase activity in the OGD-treated primary cultured neuron model. Immunofluorescence images showed that CsA significantly reversed the OGD-mediated TFEB nuclear translocation, whereas rapamycin, PP242, Torin1 or MHY failed (. These results indicate a key role of PPP3/calcineurin during this process. Furthermore, it was found that the activity of PPP3/calcineurin was markedly upregulated at 6 h in pMCAO-treated rat cortex or from 3 h to 6 h in OGD-treated neurons () with no change of its abundance ()). These data suggested that PPP3/calcineurin has an important role in the induction of TFEB translocation at the early stage of ischemia.
Figure 4. Activation of PPP3/calcineurin mediates the translocation of TFEB in to the nucleus. (a) Primary neurons were incubated with the PPP3/calcineurin inhibitor CsA and the indicated inhibitors or agonist of MTOR at 0 and 6 h of OGD treatment. The nuclear translocation of TFEB was monitored by immunofluorescence using a TFEB antibody. Scale bar: 20 μm. (b) Columns represent Mander’s overlap coefficient. At least 3 independent experiments for each group were included. Data are expressed as mean ± SEM. ***p < 0.001, **p < 0.01, *p < 0.05 vs. OGD (0 h)+ DMSO group; ###p < 0.001 vs. OGD (6 h)+ DMSO group. (c) The fluorescence intensity of neurons incubated with Fluo 4-AM was captured from 1 h to 24 h after OGD to monitor the dynamic change of Ca2+ concentration. Scale bar: 20 μm. (d) Quantification of the dynamic change of Ca2+ concentration. Statistical comparisons were carried out with ANOVA followed by Tukey’s test. Data are presented as mean ± SEM from 4 independent experiments. ***p < 0.001 vs. CON group. (e and f) Histograms showing the alterations of PPP3/calcineurin activity in the cortex of sham-operated rats or pMCAO-treated rats and OGD-treated primary neurons. The PPP3/calcineurin activity was measured by using 32P-labeled RII peptide as the substrate. Each sample was analyzed in triplicate. Data are expressed as mean ± SEM. Statistical comparisons were carried out with ANOVA followed by Tukey’s test. **p < 0.01 vs. sham group; *p < 0.05 vs. CON group. (G) Immunoblotting analysis of the dynamic change of PPP3/calcineurin expression at the indicated time points following OGD and pMCAO.
In addition to TFEB, we examined the expression of 3 other proteins of the MiT/TFE3 family (MITF, TFEC and TFE3) in the rat cortex from 3 h to 48 h following pMCAO. As shown in Figure S3, the levels of nuclear MITF and TFEC showed a statistically nonsignificant increase at 6 h after pMCAO, which was followed by a decrease. The expression of nuclear TFE3 was significantly increased at 6 h after pMCAO. These data suggested that in addition to TFEB, pMCAO also induced changes in the translocation and expression of MITF, TFEC and TFE3, which in turn indicates that other members of the MiT/TFE3 family may have possible roles in the regulation of ALP functions after ischemic stroke.
Neuronal-targeted TFEB overexpression enhanced ALP function and attenuated the ischemic insult in pmcao-treated rats
The above observations led us to postulate that neuronal-targeted TFEB may regulate ALP function and contribute to the fate of neurons and the outcome of ischemic insult. To investigate the central role of TFEB in neuronal damage and ALP change induced by permanent cerebral ischemia, we used AAV particles encoding a Syn1 promoter-driven construct to transduce TFEB into the cortex of ischemic stroke rats (Figure S4(a)). Confocal images showed that exogenous TFEB localized to the neuronal nuclei in the sham- or pMCAO-operated cortex compartment, as detected by the colocalization of anti-Flag and anti-TFEB immunoreactivity (Figure S4(c)). In addition, western blot and RT-qPCR analysis confirmed that cortex extracts from TFEB-transduced rats showed a robust overexpression of Flag-TFEB compared to those transduced with GFP vector (Figures S4(e,F) and 5(o)).
Overexpression of TFEB significantly reversed the increases in the accumulation of LC3 and ubiquitinated proteins at 48 h after pMCAO (), indicating the accelerated degradation of autophagosomes and substrates. However, the Lc3 mRNA levels were contrary to its protein level ()). Furthermore, increased expression of the lysosomal markers LAMP1, CTSD and CTSB was detected at the transcriptional and protein level in the pMCAO-treated rats transduced with AAV encoding Flag-TFEB (,e–g,o)). In line with the western blot analysis, confocal images in pMCAO-treated rats overexpressing TFEB also demonstrated a qualitative upregulation of lysosome abundance with an increase in LAMP1-positive (blue) and CTSD-positive (red) lysosomes, resulting in enhanced localization in the merged image ()). These data indicated that overexpression of TFEB significantly reversed the ALP dysfunction at 48 h after pMCAO.
Figure 5. Neuronal-targeted TFEB overexpression enhances ALP function. (a) Immunoblots showing the expression of proteins related to ALP in the cortex of sham-operated or pMCAO-treated rats injected with GFP or TFEB vectors at 48 h after pMCAO. (b–g) Quantification of the immunoblotted proteins in the cortex extracts. Statistical comparisons were carried out with ANOVA followed by Tukey’s test. Data are presented as mean ± SEM from 4 rats in each group. ***p < 0.001, **p < 0.01, *p < 0.05, vs. sham+ GFP group; ###p < 0.001, #p < 0.05 vs. pMCAO (48 h)+ GFP group. (h) Representative images showing the colocalization of LAMP1 (blue) and CTSD (red) in Flag-positive neurons (green) in the cortex of sham-operated or pMCAO-treated rats; scale bar: 20 μm. High-magnification images of the boxed areas are shown in the inserts; scale bar: 10 μm. (i) Immunoblots showing the expression of ALP-related proteins in the cortex of sham-operated or pMCAO-treated rats injected with GFP or TFEB vectors at 6 h after pMCAO. (j–n) Quantification of the immunoblotted proteins in the cortex extracts. Statistical comparisons were carried out with ANOVA followed by Tukey’s test. Data are presented as mean ± SEM from 4 rats in each group. ***p < 0.001, *p < 0.05 vs. sham+ GFP group; ##p < 0.01, #p < 0.05 vs. pMCAO (6h)+ GFP group. (o) RT-qPCR analysis showing mRNA expression of ALP genes including Tfeb, Lamp1, Ctsb, Ctsd, Map1lc3b and Sqstm1 at 48 h in the cortex of sham- or pMCAO-operated rats injected with GFP or TFEB vectors. ***p < 0.001, **p < 0.01,*p < 0.05 vs. sham+ GFP group; ###p < 0.001, ##p < 0.01, #p < 0.05 vs. pMCAO (48 h)+ GFP group (n = 6–8/group).
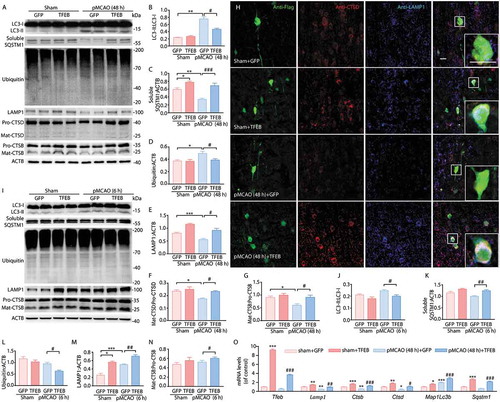
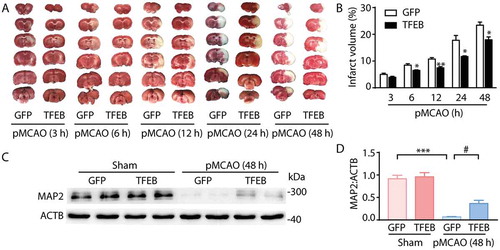
To provide evidence that TFEB-medicated ALP changes are involved in ischemic insult, we further examined the alteration in neuron loss and ischemic outcome at 48 h after pMCAO. Cortex stereotactic injection of Flag-TFEB vector markedly inhibited the increases in the MAP2 level () and the infarct volume compared to injection with GFP vector (). Furthermore, it is noteworthy that overexpression of TFEB significantly decreased the infarct volume as early as 6 h after pMCAO (). This change at 6 h was accompanied by decreased expression of LC3 and ubiquitinated proteins (,j,l)), as well as by increased levels of LAMP1 and CTSB (,m,n)).
Figure 6. Neuronal-targeted TFEB overexpression attenuates the ischemic insult. (a) Representative images of brain infarct volume in rats injected with GFP or TFEB vectors from 3 h to 48 h after pMCAO. (b) Quantification of infarct volume in rats injected with GFP or TFEB vectors from 3 h to 48 h after pMCAO. **p < 0.01, *p < 0.05 vs. pMCAO+ GFP group. (c) Immunoblots of MAP2 expression in the cortex of sham-operated or pMCAO-treated rats injected with GFP or TFEB vectors. (d) Quantification of the immunoblotted proteins in the cortex extracts. Statistical comparisons were carried out with ANOVA followed by Tukey’s test. Data are presented as mean ± SEM from 4 rats in each group. ***p < 0.001 vs. sham + GFP group; #p < 0.05 vs. pMCAO (48 h)+ GFP group.
These observations suggested that neuron-specific transduction with TFEB enhanced the ALP function and alleviated the ischemic insults, starting as early as 6 h and even lasting up to 48 h after ischemia.
Neuronal-targeted TFEB knockdown inhibited ALP function and aggravated the ischemic insult in pmcao-treated rats
Next, gene interference, based on the stereotactic AAV delivery of a Camk2a promoter-driven shRNA construct, was used to downregulate TFEB in order to confirm the pivotal role of TFEB on ischemia from another direction. Stereotactic AAV injections consistently resulted in widespread transduction in the cortex (Fig. S4B). Immunofluorescence, immunoblot and RT-qPCR analysis confirmed the specific downregulation of endogenous TFEB expression in the cortex of rats compared to those injected with the GFP-tagged scramble vector, especially in the pMCAO-treated group (Figures S4(d,g,h) and 7(i)).
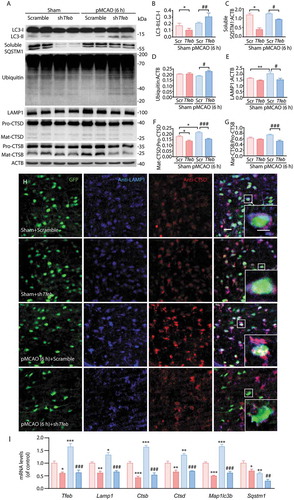
The data showed that downregulation of TFEB in ischemic cortex at 6 h after pMCAO significantly impaired ALP function as evidenced by accumulated autophagosomes and substrates, LC3 and ubiquitinated proteins (), and suppressed lysosomal function as assessed by decreased expression of the lysosomal markers LAMP1, CTSD and CTSB (,e–g)). This was also confirmed by a weaker fluorescence signal from LAMP1 and CTSD and a reduction in their colocalization ()) in the cortex of rats at 6 h following pMCAO. Furthermore, RT-qPCR analysis revealed that knockdown of TFEB significantly decreased the expression of the TFEB-targeted genes Tfeb, Lamp1, Ctsb, Ctsd, Map1lc3b and Sqstm1 not only in the sham group but also in the pMCAO group at 6 h after pMCAO ()).These observations indicated that knockdown of TFEB repressed the activation of ALP function at 6 h after pMCAO.
Figure 7. Neuronal-targeted TFEB knockdown inhibits ALP function. (a) Immunoblots showing the expression of proteins related to ALP in the cortex of sham-operated or pMCAO-treated rats injected with GFP-Scramble or shTfeb vectors at 6 h after pMCAO. (b–g) Quantification of the immunoblotted proteins in the cortex extracts. Statistical comparisons were carried out with ANOVA followed by Tukey’s test. Data are presented as mean ± SEM from 4 rats in each group. ***p < 0.001, **p < 0.01, *p < 0.05 vs. sham+ Scramble group; ###p < 0.001, ##p < 0.01, #p < 0.05 vs. pMCAO (6 h) + Scramble group. (h) Neuronal TFEB knockdown reduced the colocalization of LAMP1 and CTSD. Representative images showing the colocalization of LAMP1 (blue) and CTSD (red) in GFP-positive neurons (green) in the cortex of sham-operated or pMCAO-treated rats; scale bar: 20 μm. High-magnification images of the boxed areas are shown in the inserts; scale bar: 10 μm. (i) RT-qPCR analysis showing mRNA expression of ALP markers including Tfeb, Lamp1, Ctsb, Ctsd, Map1lc3b and Sqstm1 at 6 h in the cortex of sham- or pMCAO-operated rats injected with GFP-Scramble or shTfeb vectors. ***p < 0.001, **p < 0.01, *p < 0.05 vs. sham+ Scramble group; ###p < 0.001, ##p < 0.01 vs. pMCAO (6 h)+ Scramble group.
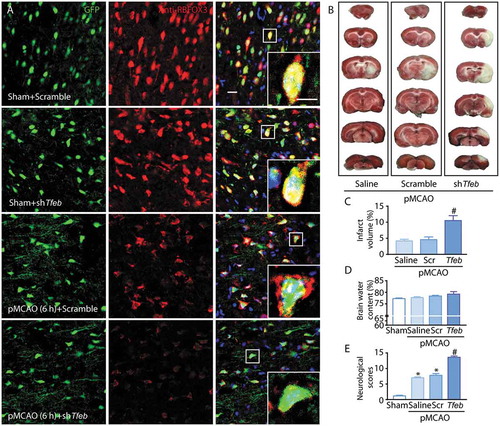
Knockdown of TFEB also markedly aggravated the degeneration of neurons, as indicated by the decreased fluorescence signal of RBFOX3 ()), and exacerbated the ischemic insult, as indicated by marked increases of the infarct volume, brain water content and neurological scores (). Consequently, these observations suggested that neuron-specific knockdown of TFEB further suppressed the activation of ALP and aggravated the ischemic insult at 6 h following pMCAO.
Figure 8. Neuronal-targeted TFEB knockdown aggravates the ischemic injury. (a) Representative images showing the abundance of neurons (red) in the cortex in sham-operated or pMCAO-treated rats injected with GFP-Scramble or shTfeb vectors; scale bar: 20 μm. High-magnification images of the boxed areas are shown in the inserts; scale bar: 10 μm. (b) Representative images of brain infarct volume in rats injected with GFP-Scramble or shTfeb vectors. (C–E) Quantification of infarct volume, brain water content and neurological scores in rats injected with GFP-Scramble or shTfeb vectors at 6 h after pMCAO. *p < 0.05 vs. sham + Scramble group; #p < 0.05 vs. pMCAO (6 h) + Scramble group.
Discussion
The present study demonstrates the vital role of TFEB in pMCAO-mediated ALP dysfunction and ischemic insult. We found that at the early stage of ischemia, TFEB function was activated, as reflected by its translocation to the nucleus, and this was mediated at least in part by PPP3/calcineurin. TFEB activation led to enhancement of ALP functions, especially in cortex neurons. As ischemia progressed, TFEB function gradually decreased, as indicated by the reduced nuclear accumulation of TFEB, and this was coupled with a progressive decline of ALP functions, finally leading to more serious ischemic injuries. Importantly, neuron-targeted overexpression of TFEB significantly rescued the ALP dysfunction and neuronal loss induced by pMCAO in rats, thus alleviating the ischemic damage.
Here, we explored the dynamic change of ALP function induced by ischemic stroke. We found that the autophagic marker LC3 and the substrate insoluble SQSTM1 and ubiquitinated proteins accumulated at the later stages in both pMCAO-treated rats and OGD-treated neurons, suggesting that abnormal accumulation of autophagosomes and substrates accompanies the development of ischemia [Citation8]. However, the soluble SQSTM1 expression gradually decreased with the development of ischemic damage, suggesting it may be related to a blockage of autophagy due to cleavage of the protein, together with other autophagy proteins, by caspases or calpains [Citation33]. Also, SQSTM1 may be transcriptionally upregulated under certain conditions [Citation34,Citation35]. Furthermore, lysosomal function was induced at the early stage of ischemia, as reflected by the higher expression of lysosomal markers (LAMP1 and CTSD), elevated CTSB activity and the increased colocalization of LAMP2 and CTSB. These markers then declined at the later stages of pMCAO or OGD. In addition, in the presence of CQ, the LC3-II level was increased from 3 h to 6 h after the onset of ischemia but was not further upregulated from 12 h to 24 h. All these data suggested that ALP function after ischemic stroke was enhanced and then impaired, thus resulting in the abnormal accumulation of autophagosomes and substrates.
Since TFEB was recently discovered as a major regulator of the ALP [Citation16] as well as being a potential therapeutic target to rescue myocardial ischemic injury [Citation19] and neurodegeneration [Citation22], we are interested in its role in regulating ALP function and cerebral ischemic insult. In the present study, we found that at 6 h after pMCAO both the mRNA and total protein level of TFEB were significantly upregulated. It is noted that the nuclear translocation of TFEB occurs earlier than Tfeb transcriptional activation after pMCAO. To some extent, the increase of the total protein level of TFEB may be due to positive feedback on its own transcription [Citation36]. Additionally, there was marked accumulation of TFEB protein in the nuclear subfraction with a corresponding decline in the cytoplasmic subfraction, suggesting that there was significant translocation of TFEB into the nucleus from 3 h to 6 h after pMCAO or OGD. After that, the abundance of total TFEB was progressively restored, with a subsequent decrease in the level of nuclear fraction. Thus, the data indicate that at the early stage of ischemia, TFEB function was activated, as reflected by its translocation to the nucleus, and this was accompanied by increased total TFEB expression, especially nuclear expression. Furthermore, as ischemia progressed, a gradual decrease of TFEB function occurred, as indicated by the reduced nuclear accumulation of TFEB. Consistent with recent studies demonstrating that the TFEB-mediated activation of ALP mainly occurred in neurons [Citation20–Citation22], we revealed that the functions of ALP and TFEB after pMCAO in rats were both activated mainly in neurons, but not in other brain cells. However, this finding does not rule out the possibility that TFEB and autophagy may occasionally be expressed in other neural cells, such as microglia and astrocytes, but cannot be detected with our limited means.
Because the variation in TFEB translocation was closely associated with the changes in ALP function, it is reasonable to assume that neuron-targeted TFEB may rescue the dysfunction of ALP and alleviate the ischemic insult following pMCAO. To confirm this hypothesis, we conducted AAV-mediated neuronal-specific overexpression of TFEB. As expected, the in vivo data showed that overexpression of TFEB was effective in reversing the ischemic-induced accumulation of autophagosomes and substrates at 48 h after ischemic insult. Furthermore, a sustained increase in markers of lysosomal function was detected. Importantly, aggravation of the neuronal injuries and development of behavioral impairments were markedly prevented. These observations suggested that genetic manipulation to elevate the exogenous TFEB level in neurons was able to protect neurons from ischemic toxicity at the late stage of pMCAO through enhancement of ALP function. Furthermore, we found that overexpression of TFEB started to exert a beneficial effect on ischemic injury as early as 6 h after pMCAO, and this was accompanied by decreased accumulation of autophagosomes and substrates, and enhanced lysosomal functions. These observations indicated that neuron-specific transduction of TFEB enhanced ALP function and alleviated the ischemic injuries, starting as early as 6 h and lasting up to 48 h after ischemia.
In further support of the central role of TFEB in responding to ischemic insult, we used an in vivo neuron-specific AAV approach to downregulate TFEB. TFEB knockdown significantly upregulated LC3 and ubiquitinated proteins at 6 h following pMCAO, which is suggestive of an accumulation of autophagosomes and substrate. Accordingly, knockdown of TFEB caused a significant reduction in the mRNA levels of ALP-related target genes, namely Map1lc3b, Sqstm1, Lamp1, Ctsb and Ctsd, not only in the sham group but also in the pMCAO group. The opposite trend was seen when TFEB was overexpressed. However, it is noteworthy that the change of the Map1lc3b mRNA level was opposite to the change of its protein level under both TFEB overexpression and knockdown conditions. Accompanied by the responsive change of ALP function, this phenomenon may be due to dynamic regulation of ALP by TFEB through coordinating autophagy with lysosomal clearance [21]. Moreover, we found that knockdown of TFEB triggered a further loss of neurons and the development of behavioral impairments, as indicated by increased levels of MAP2, aggravation of infarct volume, brain water content and neurological scores. Notably, a recent study has demonstrated that inhibition of autophagy can stabilize the lysosomal membrane, thus blocking the cathepsin-medicated apoptotic signaling pathway; this suggests a ‘dark side’ of autophagy in ischemic insult [Citation12]. However, other findings indicate that activation of autophagy can protect cells from death after cerebral ischemia [Citation1,Citation14,Citation37,Citation38]. The present study supports the idea that neuronal-targeted TFEB-mediated activation of ALP function may play a pro-survival role at the early stage of pMCAO.
It is well known that TFEB is a member of the MiT/TFE3 protein family, which also contains MITF, TFEC and TFE3 [Citation39]. We showed that, similar to TFEB, the expression of these 3 molecules and their possible translocation to the nucleus were increased in rat cortex following pMCAO. Given the key role of TFEB in the regulation of autophagy and lysosome function [Citation16,Citation40], the present study mainly focused on the role of TFEB on ALP function and ischemic damage following pMCAO. Notably, we found that knockdown of TFEB did not influence the expression of MITF, TFEC and TFE3. This indicates that the key role of TFEB in ALP regulation after ischemic stroke observed in the present study occurs without any interference by other members of the MiT/TFE3 family (Figure S3(h–k)). Of course, future investigations will be necessary to determine whether and how MITF, TFEC and TFE3 affect ALP functions and ischemic injuries.
To clarify the possible signals upstream of TFEB nuclear translocation induced by ischemia at the early stage of ischemia, pharmacological manipulations of PPP3/calcineurin and MTORC1 were used to determine whether TFEB translocation to the nucleus is dependent on the phosphatase activity of PPP3/calcineurin or the kinase activity of MTORC1. We found that CsA, but not rapamycin, PP242, Torin1 or MHY, was able to reverse the OGD-mediated TFEB translocation. This finding suggested that TFEB translocated to the nucleus at the early stage of ischemia through the activation of PPP3/calcineurin. In fact, PPP3/calcineurin activation has been reported to respond to ischemic conditions in OGD-induced neuronal death [Citation41],[] and PPP3/calcineurin-dependent TFEB nuclear translocation [Citation42] is involved in the induction of autophagy [Citation43,Citation44]. The data here confirmed the potential of PPP3/calcineurin to regulate TFEB function after ischemic stroke. However, the present data did not indicate a role of MTORC1 in the regulation of TFEB function as reported previously [Citation26,Citation45]. This issue needs to be further studied. Similarly, a recent study demonstrated that the lysosomal calcium-dependent PPP3/calcineurin signaling pathway regulates autophagy by activating a TFEB-mediated transcriptional program independently from MTOR [Citation30]. It is reasonable to consider that the intracellular Ca2+ level may be a possible regulatory signal upstream of PPP3/calcineurin-TFEB, because ischemia/hypoxia may induce the elevation of cytoplasmic Ca2+ levels [Citation45,Citation46]. As shown in ), in OGD-treated cortical neurons, the intracellular Ca2+ level was significantly increased at the early stage of OGD, and returned to the basal level thereafter, which is consistent with a previous reports [Citation46]. Furthermore, lines of evidence have indicated that intracellular Ca2+ may regulate TFEB phosphorylation at least in part through the PPP3/calcineurin signaling pathways [Citation47,Citation48], especially in autophagy [Citation29]. These data suggest the possibility that the intracellular Ca2+-dependent PPP3/calcineurin pathway may be an upstream regulator of TFEB function at the early stage of ischemia.
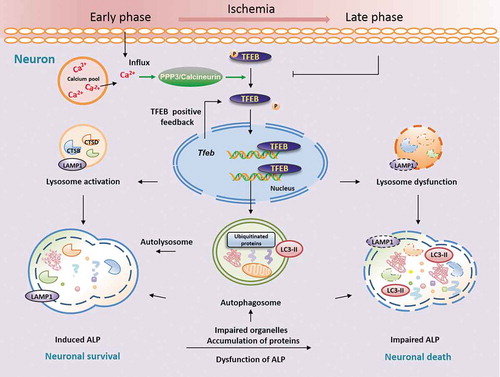
In the model proposed here (), at the early stage of ischemia, intracellular Ca2+ levels increase and PPP3/calcineurin is activated, which results in TFEB dephosphorylation and translocation of TFEB into the nucleus. Nuclear TFEB would then induce the transcription of its target genes, including Tfeb, leading to a significant increase in lysosome functions. This would result in neuronal survival and protection from ischemic damage. As intracellular Ca2+ decreases, PPP3/calcineurin activity and TFEB function may subsequently decrease, coupled with a progressive decline of lysosome functions, and ischemic injuries would finally occur, especially at the late stage of ischemia. These degenerative changes can be significantly rescued by overexpression of TFEB, which results in protective effects against ischemic injuries, starting as early as 6 h and lasting up to 48 h after ischemia.
Figure 9. Neuron-targeted TFEB rescues ALP dysfunction, alleviating ischemic injury in permanent cerebral ischemia. Here, we highlight the central role of neuronal TFEB in regulating ALP function and ischemic injury. In this model, at the early stage of ischemia, intracellular Ca2+ levels increase, leading to activation of PPP3/calcineurin, which results in TFEB dephosphorylation and translocation of TFEB into the nucleus. Nuclear TFEB would then induce the transcription of its target genes, including Tfeb itself, thereby increasing lysosome functions, and leading to improved neuronal survival and protection from ischemic damage. As intracellular Ca2+ decreases, PPP3/calcineurin activity and TFEB function may subsequently decrease, coupled with a progressive decline of lysosome functions and an increase in ischemic injuries, especially at the late stage of ischemia. This model suggests that neuronal targeting of TFEB may rescue the dysfunctional ALP and alleviate the ischemic injury following pMCAO.
In summary, the current study provides the first evidence that ALP function is enhanced at the early stage of the ischemic process, accompanied by increased TFEB expression and nuclear translocation. Activation of TFEB occurs especially in cortex neurons, and appears to be mediated at least in part through the action of PPP3/calcineurin. During the late stage of ischemia, a progressive decline in lysosomal activity occurs, along with accumulation of autophagosomes and substrates as well as more serious ischemic injuries. These changes are coupled with a gradual decrease of nuclear TFEB expression. Importantly, neuronal-targeted TFEB rescues the ALP dysfunction, thus alleviating the ischemic injury after permanent cerebral ischemia. These results highlight TFEB as a key player in the pMCAO-mediated dysfunction of ALP and ischemic insult, and identify TFEB as a promising target for therapies aimed at neuroprotection in cerebral ischemia.
Materials and methods
Animals
Adult male Sprague-Dawley rats, 280–300 g at the time of surgery, supplied by the Experimental Animal Centre of Shenyang Pharmaceutical University, were housed 4 to 5 per cage under standard housing conditions with free access to food and water. All procedures and treatments were conducted in accordance with the ethical regulations set by the Animal Experimentation Committee of Shenyang Pharmaceutical University.
Rat permanent middle cerebral artery occlusion model
Rats were anesthetized with isoflurane. Through a ventral midline incision, the right common carotid artery (CCA), external carotid artery (ECA) and internal carotid artery (ICA) were isolated. The proximal CCA and distal ECA were ligated. A 4–0 nylon suture (Φ0.26 mm), with its tip embedded in paraffin, was inserted from the right CCA to the ICA and then to the circle of Willis to occlude the origin of the right middle cerebral artery [Citation49]. Sham-operated rats received the same surgical procedures without the pMCAO. The animals were sacrificed at the indicated time for relevant detection.
Drug administration
To determine the effects of the autophagy inhibitor chloroquine (Sigma, C6628) on ischemic neuronal injury, rats were treated with intraperitoneal injection of CQ (60 mg/kg) at the onset of pMCAO [Citation50]. For primary neurons, the indicated concentration of CQ (10 μM) was dissolved in normal culture medium and added to the cells at the onset of OGD. Control cells were given equal medium or CQ in glucose-containing DMEM (Gibco, C11995500BT). To determine the effects of the MTOR inhibitors and agonist on ischemic neuronal injury, the inhibitors of MTOR rapamycin (10 µM; Selleck, S1039), PP242 (4 µM; Selleck, S2218), Torin1 (500 nM; Selleck, S2827) and the MTOR agonist MHY1485 (50 µM; Selleck, S7811) were dissolved in DMSO, diluted with normal culture medium and pre-incubated with primary neurons for 12 h. After that, the medium was replaced with glucose-free DMEM containing the above compounds for 6 h-OGD treatment. To determine the role of PPP3/calcineurin in this process, CsA (10 μM; Selleck, S2286) was added at the onset of OGD. Control cells were given normal medium, normal medium with 0.1% DMSO, rapamycin, PP242, Torin1, MHY1485 and CsA in glucose-containing DMEM. The highest concentration of DMSO present in experimental conditions (0.1%) was not toxic to the cells.
Cell culture and OGD procedures
Newborn rats within 24 h were used. Briefly, cerebral cortices were dissected, minced, trypsinized (0.25%) and mechanically dissociated with a Pasteur pipette. Cells were seeded into 96- or 6-well plates (1.0 × 10⁶ cells/ml) pre-coated with 0.01% poly-L-lysine, and cultured in Neurobasal medium (Gibco, 21103049) supplemented with 2% B27 (Gibco, 17504044) and 100 U/ml penicillin, 100 μg/ml streptomycin.
For OGD treatment, cells were rinsed once with warm glucose-free DMEM (Gibco, 11966025), and then refreshed with O2- and glucose-free DMEM (pre-balanced in an O2-free chamber at 37°C). Cells were then immediately placed in a sealed chamber (Billups-Rothenburg, MIC-101) loaded with mixed gas containing 5% CO2 and 95% N2 for 5 min at 20 L/min. Primary neurons were incubated at 37°C for the indicated time.
For MTT assay, cells were seeded in 96-well plates and grown in 200 μl of culture medium. After OGD treatment, MTT (20 μl, 5 mg/ml; Sigma, M5655) was added into each well. The cells were cultured with MTT for 4 h, then the supernatant was discarded and 200 μl DMSO were applied to dissolve the formazan. The absorbance was measured at 560 nm wavelength with a microplate reader, with 630 nm as reference wavelength.
Calcium imaging
After OGD treatment, cells were washed with HBSS (calcium-free; Gibco, 14175095) to thoroughly remove the serum and 5 μM Fluo 4-AM (Dojindo Laboratories, F312) in HBSS (calcium-free) was added for 60 min at 37°C. The cells were then washed 3 times with HBSS and incubated in HBSS (calcium-free) for another 30 min to finish the deesterification. Images were then captured to detect the fluorescence intensity of the cells.
AAV vector packaging and delivery in vivo
For TFEB knockdown, a selected shRNA sequence for rat Tfeb and a scramble control were inserted into the AAV vector. The final recombinant for TFEB knockdown, a selected shRNA sequence for rat Tfeb and a scramble control were inserted into the AAV vector. The final recombinant AAV2/9 expression cassette was ITR- CAMK2A/CaMKIIa-EGFP-Flag-Mir30 shTFEB-WPRE-hGHpolyA-ITR (CAMK2A [calcium/calmodulin-dependent protein kinase II alpha]; EGFP, enhanced green fluorescent protein). The sequence of Tfeb shRNA was selected by co-transfecting the expression vector AAV-Syn1-Flag-TFEB-WPRE-hGHpolyA and the siRNA vector AAV-CAMK2A/CaMKIIa-EGFP-Mir30 shTfeb into primary neurons with Lipofectamine 3000 (Invitrogen, L3000015). The shRNA sequences used in this study were: Tfeb shRNA: 5′-CTGCTACACATCAGCTCCAATC-3′, scramble shRNA: 5′-CGGAAGTVGTGAGAAGTAGAAT-3′. The vectors were confirmed by sequencing.
For TFEB overexpression, the coding regions of TFEB were amplified from rat cDNA by real-time quantitative reverse transcription polymerase chain reaction (RT-qPCR) and were cloned into the AAV plasmids. The final recombinant AAV2/9-TFEB-overexpression expression cassette was ITR-Syn-Flag-TFEB-WPRE-hGHpolyA-ITR (ITR, inverted terminal repeat; Syn1 [synapsin I] promoter; WPRE, cis-acting woodchuck post-transcription regulatory element; hGHpolyA, human growth hormone transcription termination sequence). The vector was confirmed by sequencing.
The resultant AAVs were packaged at Obio Technology Company (Shanghai, China). The packaged AAVs were concentrated in phosphate-buffered saline (PBS; HyClone, sh30256.01) at the following titers: AAV-TFEB-overexpression (5.29 × 10¹²), AAV-Mir30 shTFEB (2.15 × 10¹³) and AAV-Mir30 shScramble (5.13 × 10¹²) genome copies per milliliter.
The stereotactic delivery of AAV vectors into the cortex was performed after the rats at 150–180 g were anesthetized with isoflurane. Briefly, 2 μl of AAV particles were injected into the cortex at 3 sites (AP + 1.2 [site 1], 0.3 [site 2], −0.6 [site 3]; ML + 5.5; DV −3.5 mm from the skull) [Citation51] as reported. The injection was carried out by inserting a 33G Hamilton syringe with an automatic injector at the rate of 0.5 μl/min. To prevent reflux, the needle was left in place for additional 5 min, withdrawn a short distance and then left in the new position for another 2 min before removal. The rats were allowed 4 weeks of recovery before being subjected to the pMCAO surgery [Citation26,Citation52].
Measurement of cerebral infarct volume, brain water content and neurological scores
To investigate the infarct volume, rats were sacrificed by decapitation at the indicated time and their brains were quickly removed, and then sliced into 5 coronal sections at 2-mm intervals. The sections were incubated in a 1% solution of 2,3,5-triphenyltetrazolium chloride (TTC; Sigma, T8877) at 37°C for 20 min and then photographic images were taken. Infarcted areas were measured using Pro Plus 6.0. The percentage of the corrected infarct volume was calculated by dividing the infarct volume by the total contralateral hemispheric volume, and this ratio was then multiplied by 100. The brain water content was determined as an indicator of cerebral edema using a wet/dry method as previously described [Citation53]. The cross-sectional areas, with or without infarction, in each brain slice were measured using ImageJ analysis software (version 1.6, National Institutes of Health, Bethesda, MD, USA). The total mean infarct area of each section was examined by the change in coloration [Citation54]. Neurological function was evaluated with the modified Neurological Severity Score (mNSS) test [Citation55]. Each function is graded on a scale of 0 to 18 (normal score, 0; maximal deficit score, 18). Higher scores indicate more severe behavioral deficits.
Immunoblotting
At different time points after pMCAO, brain tissues from the ischemic striatum and cortex of the right middle cerebral artery territory as well as the corresponding area of sham-operated rats were rigorously homogenized in RIPA buffer (Beyotime Biotechnology, P0013B). For total cytosolic and nuclear proteins extraction, an isolation kit (CW biotech, CW0199) was used according to the manufacturer’s instructions. For solubility fractionation, tissues were lysed in a lysis buffer containing 1% Triton X-100 (Solarbio, T8200). Lysates were centrifuged to separate pellets from supernatants. Pellets were resuspended in a lysis buffer containing 1% SDS and then subjected to centrifugation at 12,000 × g, 15 min. Supernatants (Triton X-100-soluble fraction) or resuspended pellets (Triton X-100-insoluble fraction) were boiled in SDS sample buffer and subjected to SDS-PAGE and immunoblotting. The protein concentration was determined using a BCA kit (Beyotime, P0012). An aliquot of 25–30 μg of total protein from each sample was separated by 10%-12% SDS-polyacrylamide gel electrophoresis using a constant current. Proteins were subsequently transferred to a 0.22-μm nitrocellulose membrane (Pall Life Sciences, 66485) or a 0.45-μm polyvinylidene fluoride membrane (Millipore, IPVH00010), which were subsequently incubated with 5% skimmed milk in Tris-buffered saline (Solarbio, T8060) with 0.1% Tween 20 (Solarbio,T8220) (TBST) at room temperature for 1 h. Afterwards, the membranes were incubated with the corresponding primary antibody against ACTB/β-actin (1:1000; Santa Cruz Biotechnology, sc-47778), LC3 (1:1000; MBL, PM036), SQSTM1 (1:1000; Abcam, ab56416), LAMP1 (1:500; Abcam, ab24170), CTSB/cathepsin B (1:500; Millipore, 06180-1), CTSD/cathepsin D (1:500; Santa Cruz Biotechnology, sc-6487), ubiquitin (1:500; Santa Cruz Biotechnology, sc-8017), TFEB (1:500; Mybiosource, MBS129149), MITF (1:500; Abcam, ab20663), TFEC (1:500; Abcam, ab185226), TEF3 (1:1000; Sigma, HPA023881), LMNB/lamin B (1:500; Proteintech, 12987-1-AP), GFP (1:1000; Abcam, ab13970), Flag (1:1000; Sigma, F1804), TUBB1/β-tubulin (1:1000; Sigma, T4026), MAP2 (1:500; Synaptic Systems, 188 011), or PPP3/calcineurin (1:500; Cell Signaling Technology, 2614S) at 4°C overnight, followed by horseradish peroxidase-conjugated secondary antibody (1:5000; ZSGB-BIO, ZB-2301; ZB-2305) at room temperature for 1 h. Between each procedure, the membranes were washed 5 times in TBST for 6 min each. Immunoreactivity was detected with an enhanced chemiluminescence ECL (Thermo Fisher Scientific, 34580) in accordance with the manufacturer’s instructions. Band patterns were analyzed with ImageJ software and normalized to the loading control.
Immunofluorescence
Animals were transcardially perfused with PBS (pH 7.4) followed by 4% paraformaldehyde (vol:vol). Brains were postfixed in 4% paraformaldehyde, immersed in 20% and 30% sucrose (Solarbio, S8271) until they were observed to sink to the bottom, and sectioned on a freezing microtome. For immunofluorescence, sections (20 μm) were washed 3 times in PBS for 5 min each and in 10 mM trisodium citrate buffer, pH 6.0 in a microwave bath at 85–95°C for 20 min. Afterwards, the sections were blocked in 10% normal goat serum (ZSGB-BIO, ZLI-9056) containing 0.3% Triton X-100 for 1 h at room temperature. Then they were incubated overnight at 4°C with primary antibody against LC3 (1:200; MBL, PM036), RBFOX3/NeuN (1:500; Millipore, MAB377), GFAP (1:500; Sigma, G3893), AIF1/IBA1 (1:500; Millipore, MABN92), LAMP2 (1:200; Sigma, L0668), LAMP1 (1:200; Abcam, 24170), CTSB/cathepsin B (1:50; Santa Cruz Biotechnology, sc-6493), TFEB (1:50; Mybiosource, MBS129149), or Flag (1:500; Sigma, F1804) in PBS. On the next day, the slices were washed 3 times in PBS for 10 min each and then incubated for 1 h at room temperature with fluorochrome-coupled secondary antibody (1:200; Alexa Fluor 488, Alexa Fluor 555; Beyotime Biotechnology, A0428; A0516). The slices were then washed 3 times in PBS for 10 min each and incubated with 4ʹ, 6-diamidino-2-phenylindole (DAPI; Sigma, D8417) for 30 min at room temperature. We detected fluorescence with a fluorescence microscope (Nikon) and images were processed for background subtraction using the Nikon C2 Plus with a 60 × objective. Fluorescence measurement was conducted with Nikon Instruments Software (NIS-Elements Advanced Research). The integrated optical density was analyzed by Image-Pro Plus 6.0 software (Media Cybernetics, Silver Spring, MD).
CTSB activity assay
Rat brain tissue samples (n = 3 each group) were homogenized in a lysis buffer. The homogenates were centrifuged at 12,000 × g for 10 min at 4°C, and the supernatant was collected for the measurement of CTSB activity. The protein concentration of the tissue lysates was determined by a BCA Protein Assay Kit (Beyotime, P0012). CTSB activity was determined using a fluorometric CTSB activity assay kit (Millipore, CBA001) as described by the manufacturer. Briefly, 50 μl of extract was mixed with 25 μl activating buffer in a 96-well plate, and then incubated with 25 μl of the synthetic substrate Z-Arg-Arg AMC in the dark at 37°C for 30 min. Released free AMC was determined fluorometrically with excitation at 328 nm and emission wavelength at 393 nm. The activity of CTSB was expressed as fluorescent units/ug protein.
Ppp3/calcineurin activity assay
Preparation of cell extracts
After OGD treatment, cells were rinsed once with ice-cold TBS. Excess liquid was shaken off and blotted, then the cells were lysed in 2× buffer (50 mM Tris-HCl, pH 7.5, 0.1 mM EGTA, 0.1 mM EDTA, 1 mM DTT, 0.2% NP-40 (Solarbio, N8031), 10 μg/ml leupeptin (Roche, 11017101001), 10 μg/ml aprotinin (Roche, 10981532001), 50 μg/ml soybean trypsin inhibitor (Roche, 10109886001). After sedimentation at 16,000 × g in a centrifuge at 4°C for 10 min, the samples were saved as high-speed supernatants. The protein concentration was determined by the method of Bradford.
Preparation of mouse brain extracts
The sham-operated or pMCAO-treated rats were sacrificed by decapitation at the indicated time. The cortex was immediately removed and homogenized on ice with a syringe at 4°C in 50 mM Tris-HCl, pH 7.5, 0.1 mM EDTA, 0.1 mM EGTA, 1 mM DTT, 0.2% NP-40, 1.0 mM phenylmethyl sulfonyl fluoride (Sigma, P7626), 5 μg/ml leupeptin, 5 μg/ml aprotinin and 2 μg/ml pepstatin (Sigma, 10253286001). The tissue homogenates were centrifuged at 18,000 × g at 4°C for 50 min and the supernatants were used to detect the phosphatase activity. The protein concentration was determined by the method of Bradford.
Protein phosphatase assay
PPP3/calcineurin activity was measured as the dephosphorylation rate of the RII peptide (SciLight Biotechnology, Sequence: DLDVPIPGRFDRRV(pS)VAAE). The amount of PO4 released was calorimetrically determined with the classic malachite green reagent as described previously [Citation56]. The prepared brain extracts were diluted 1:18 (v:v) in assay buffer. Cellular or brain extracts (5 µl) were mixed well with 10 μl RII (0.75 mM), and incubated for 30 min at 37°C. Malachite green reagent (100 μl; ENZO, EML-A111 0250) was added and the color was allowed to develop for 20–30 min, making sure all wells were treated for approximately the same time. The released inorganic 32P was quantified by microplate reader. The activity was calculated as the difference in protein phosphatase activity in 2× assay buffer and 2× EGTA buffer. The phosphatase activities were presented in the form of nanomoles of phosphate released/mg of protein/min at 30°C. Each sample was analyzed in triplicate and the levels of PPP3/calcineurin activity were presented as % of the control [Citation57].
RNA extraction, reverse transcription and rt-qpcr
Total RNA was extracted from ipsilateral cortex tissues in AAV-transduced pMCAO- or sham-operated rats with TRIzol reagent (Invitrogen, 15596026). Reverse transcription was performed using oligo (dT) primers. Messenger RNA (mRNA) was quantified by the SYBR green-based RT-qPCR kit (Takara, RR820A) and specific oligo primers in a CFX Connect Real Time PCR Detection System (Bio-Rad). The primer sequences are shown in . After an initial denaturation step of 95°C for 30 sec, 40 cycles of PCR were performed. Each cycle consisted of a melting step at 95°C for 15 sec and an annealing extension step at 60°C for 45 sec. Data were quantified using the ΔΔCt method and normalized to Actb/β-actin expression.
Table 1. Primer sequences.
Statistical analysis
Statistical analysis was carried out using SPSS 19.0 software for Windows (SPSS Inc, Chicago, IL, USA). Western blot and immunofluorescence results were analyzed with one-way analysis of variance (ANOVA), followed by Tukey’s test. Data are expressed as means ± SEM. Infarct area and brain water content data are expressed as mean ± SEM and were statistically analyzed using one-way ANOVA followed by Bonferroni’s post hoc test. mNSS scores are expressed as the mean ± SEM and were analyzed with Kruskal-Wallis one-way ANOVA on ranks, followed by Dunn’s method. p < 0.05 was considered statistically significant.
Supplemental Material
Download MS Word (4.5 MB)Disclosure statement
No potential conflict of interest was reported by the authors.
Supplementary material
Supplementary data can be accessed here
Additional information
Funding
References
- Carloni S, Buonocore G, Balduini W. Protective role of autophagy in neonatal hypoxia-ischemia induced brain injury. Neurobiol Dis. 2008 Dec;32(3):329–339. PubMed PMID: 18760364.
- Wen YD, Sheng R, Zhang LS, et al. Neuronal injury in rat model of permanent focal cerebral ischemia is associated with activation of autophagic and lysosomal pathways. Autophagy. 2008 Aug;4(6):762–769. PubMed PMID: 18567942.
- Rami A, Langhagen A, Steiger S. Focal cerebral ischemia induces upregulation of Beclin 1 and autophagy-like cell death. Neurobiol Dis. 2008 Jan;29(1):132–141. PubMed PMID: 17936001.
- Zhang X, Yan H, Yuan Y, et al. Cerebral ischemia-reperfusion-induced autophagy protects against neuronal injury by mitochondrial clearance. Autophagy. 2013 Sep;9(9):1321–1333. PubMed PMID: 23800795.
- Adhami F, Schloemer A, Kuan CY. The roles of autophagy in cerebral ischemia. Autophagy. 2007 Jan-Feb;3(1):42–44. PubMed PMID: 17035724.
- Wang JY, Xia Q, Chu KT, et al. Severe global cerebral ischemia-induced programmed necrosis of hippocampal CA1 neurons in rat is prevented by 3-methyladenine: a widely used inhibitor of autophagy. J Neuropathol Exp Neurol. 2011 Apr;70(4):314–322. PubMed PMID: 21412169.
- Viscomi MT, D’Amelio M, Cavallucci V, et al. Stimulation of autophagy by rapamycin protects neurons from remote degeneration after acute focal brain damage. Autophagy. 2012 Feb 1;8(2):222–235. PubMed PMID: 22248716.
- Liu C, Gao Y, Barrett J, et al. Autophagy and protein aggregation after brain ischemia. J Neurochem. 2010 Oct;115(1):68–78. PubMed PMID: 20633207; PubMed Central PMCID: PMC3518272.
- Liu YY, Zhang TY, Xue X, et al. Pseudoginsenoside-F11 attenuates cerebral ischemic injury by alleviating autophagic/lysosomal defects. CNS Neurosci Ther. 2017 Jul;23(7):567–579. PubMed PMID: 28485547.
- Yamashima T. Implication of cysteine proteases calpain, cathepsin and caspase in ischemic neuronal death of primates. Prog Neurobiol. 2000 Oct;62(3):273–295. PubMed PMID: 10840150.
- Yamashima T, Tonchev AB, Tsukada T, et al. Sustained calpain activation associated with lysosomal rupture executes necrosis of the postischemic CA1 neurons in primates. Hippocampus. 2003 May;13(7):791–800. PubMed PMID: 14620874.
- Zhou XY, Luo Y, Zhu YM, et al. Inhibition of autophagy blocks cathepsins-tBid-mitochondrial apoptotic signaling pathway via stabilization of lysosomal membrane in ischemic astrocytes. Cell Death Dis. 2017 Feb 16;8(2):e2618. PubMed PMID: 28206988; PubMed Central PMCID: PMC5386481.
- Buckley KM, Hess DL, Sazonova IY, et al. Rapamycin up-regulation of autophagy reduces infarct size and improves outcomes in both permanent MCAL, and embolic MCAO, murine models of stroke. Exp Transl Stroke Med. 2014 Jun 6;8. PubMed PMID: 24991402; PubMed Central PMCID: PMC4079187.
- Li Q, Zhang T, Wang J, et al. Rapamycin attenuates mitochondrial dysfunction via activation of mitophagy in experimental ischemic stroke. Biochem Biophys Res Commun. 2014 Feb 7;444(2):182–188. PubMed PMID: 24440703.
- Xing S, Zhang Y, Li J, et al. Beclin 1 knockdown inhibits autophagic activation and prevents the secondary neurodegenerative damage in the ipsilateral thalamus following focal cerebral infarction. Autophagy. 2012 Jan;8(1):63–76. PubMed PMID: 22108007.
- Settembre C, Di Malta C, Polito VA, et al. TFEB links autophagy to lysosomal biogenesis. Science. 2011 Jun 17;332(6036):1429–1433. PubMed PMID: 21617040; PubMed Central PMCID: PMC3638014.
- Godar RJ, Ma X, Liu H, et al. Repetitive stimulation of autophagy-lysosome machinery by intermittent fasting preconditions the myocardium to ischemia-reperfusion injury. Autophagy. 2015 Sep;11(9):1537–1560. PubMed PMID: 26103523; PubMed Central PMCID: PMC4590628.
- Ma X, Godar RJ, Liu H, et al. Enhancing lysosome biogenesis attenuates BNIP3-induced cardiomyocyte death. Autophagy. 2012 Mar;8(3):297–309. PubMed PMID: 22302006; PubMed Central PMCID: PMC3337840.
- Sciarretta S, Yee D, Nagarajan N, et al. Trehalose-induced activation of autophagy improves cardiac remodeling after myocardial infarction. J Am Coll Cardiol. 2018 May 8;71(18):1999–2010. PubMed PMID: 29724354.
- Xiao Q, Yan P, Ma X, et al. Neuronal-targeted TFEB accelerates lysosomal degradation of APP, reducing abeta generation and amyloid plaque pathogenesis. J Neurosci. 2015 Sep 2;35(35):12137–12151. PubMed PMID: 26338325; PubMed Central PMCID: PMC4556784.
- Polito VA, Li H, Martini-Stoica H, et al. Selective clearance of aberrant tau proteins and rescue of neurotoxicity by transcription factor EB. EMBO Mol Med. 2014 Sep;6(9):1142–1160. PubMed PMID: 25069841; PubMed Central PMCID: PMC4197862.
- Decressac M, Mattsson B, Weikop P, et al. TFEB-mediated autophagy rescues midbrain dopamine neurons from alpha-synuclein toxicity. Proc Natl Acad Sci U S A. 2013 May 7;110(19):E1817–26. PubMed PMID: 23610405; PubMed Central PMCID: PMC3651458.
- Tsunemi T, Ashe TD, Morrison BE, et al. PGC-1alpha rescues Huntington’s disease proteotoxicity by preventing oxidative stress and promoting TFEB function. Sci Transl Med. 2012 Jul 11;4(142):142ra97. PubMed PMID: 22786682; PubMed Central PMCID: PMC4096245.
- Tanida I, Minematsu-Ikeguchi N, Ueno T, et al. Lysosomal turnover, but not a cellular level, of endogenous LC3 is a marker for autophagy. Autophagy. 2005 Jul;1(2):84–91. PubMed PMID: 16874052.
- Zatloukal K, Stumptner C, Fuchsbichler A, et al. p62 is a common component of cytoplasmic inclusions in protein aggregation diseases. Am J Pathol. 2002 Jan;160(1):255–263. PubMed PMID: 11786419; PubMed Central PMCID: PMC1867135.
- Wang P, Guan YF, Du H, et al. Induction of autophagy contributes to the neuroprotection of nicotinamide phosphoribosyltransferase in cerebral ischemia. Autophagy. 2012 Jan;8(1):77–87. PubMed PMID: 22113203.
- Mizushima N, Komatsu M. Autophagy: renovation of cells and tissues. Cell. 2011 Nov 11;147(4):728–741. PubMed PMID: 22078875.
- Yang Z, Klionsky DJ. Mammalian autophagy: core molecular machinery and signaling regulation. Curr Opin Cell Biol. 2010 Apr;22(2):124–131. PubMed PMID: 20034776; PubMed Central PMCID: PMC2854249.
- Mizushima N, Yoshimori T, Levine B. Methods in mammalian autophagy research. Cell. 2010 Feb 05;140(3):313–326. PubMed PMID: 20144757; PubMed Central PMCID: PMC2852113.
- Medina DL, Di Paola S, Peluso I, et al. Lysosomal calcium signalling regulates autophagy through calcineurin and TFEB. Nat Cell Biol. 2015 Mar;17(3):288–299. PubMed PMID: 25720963; PubMed Central PMCID: PMC4801004.
- Peña-Llopis S, Vega-Rubin-de-Celis S, Schwartz JC, et al. Regulation of TFEB and V-ATPases by mTORC1. Embo J. 2011 Jul 29;30(16):3242–3258. PubMed PMID: 21804531; PubMed Central PMCID: PMC3160667.
- Martina JA, Puertollano R. Rag GTPases mediate amino acid-dependent recruitment of TFEB and MITF to lysosomes. J Cell Biol. 2013 Feb 18;200(4):475–491. PubMed PMID: 23401004; PubMed Central PMCID: PMC3575543.
- El-Khoury V, Pierson S, Szwarcbart E, et al. Disruption of autophagy by the histone deacetylase inhibitor MGCD0103 and its therapeutic implication in B-cell chronic lymphocytic leukemia. Leukemia. 2014 Aug;28(8):1636–1646. PubMed PMID: 24418989; PubMed Central PMCID: PMC4131250.
- Trocoli A, Bensadoun P, Richard E, et al. p62/SQSTM1 upregulation constitutes a survival mechanism that occurs during granulocytic differentiation of acute myeloid leukemia cells. Cell Death Differ. 2014 Dec;21(12):1852–1861. PubMed PMID: 25034783; PubMed Central PMCID: PMC4227143.
- Cnop M, Abdulkarim B, Bottu G, et al. RNA sequencing identifies dysregulation of the human pancreatic islet transcriptome by the saturated fatty acid palmitate. Diabetes. 2014 Jun;63(6):1978–1993. PubMed PMID: 24379348.
- Settembre C, De Cegli R, Mansueto G, et al. TFEB controls cellular lipid metabolism through a starvation-induced autoregulatory loop. Nat Cell Biol. 2013 Jun;15(6):647–658. PubMed PMID: 23604321; PubMed Central PMCID: PMC3699877.
- Chauhan A, Sharma U, Jagannathan NR, et al. Rapamycin protects against middle cerebral artery occlusion induced focal cerebral ischemia in rats. Behav Brain Res. 2011 Dec 01;225(2):603–609. PubMed PMID: 21903138.
- Zhou X, Zhou J, Li X, et al. GSK-3beta inhibitors suppressed neuroinflammation in rat cortex by activating autophagy in ischemic brain injury. Biochem Biophys Res Commun. 2011 Jul 29;411(2):271–275. PubMed PMID: 21723251.
- Hemesath TJ, Steingrimsson E, McGill G, et al. Mcrophthalmia, a critical factor in melanocyte development, defines a discrete transcription factor family. Genes Dev. 1994 Nov 15;8(22):2770–2780. PubMed PMID: 7958932.
- Sardiello M, Palmieri M, Di Ronza A, et al. A gene network regulating lysosomal biogenesis and function. Science. 2009 Jul 24;325(5939):473–477. PubMed PMID: 19556463.
- Chen Y, Holstein DMAime S, et al. Calcineurin beta protects brain after injury by activating the unfolded protein response. Neurobiol Dis. 2016 Oct;94:139-156. PubMed PMID: 27334877; PubMed Central PMCID: PMC4983525.
- Song R, Li J, Zhang J, et al. Peptides derived from transcription factor EB bind to calcineurin at a similar region as the NFAT-type motif. Biochimie. 2017 Nov;142:158–167. PubMed PMID: 28890387; PubMed Central PMCID: PMC5774622.
- Zhang X, Cheng X, Yu L, et al. MCOLN1 is a ROS sensor in lysosomes that regulates autophagy. Nat Commun. 2016 Jun 30;7:12109. PubMed PMID: 27357649; PubMed Central PMCID: PMC4931332.
- Singh N, Kansal P, Ahmad Z, et al. Antimycobacterial effect of IFNG (interferon gamma)-induced autophagy depends on HMOX1 (heme oxygenase 1)-mediated increase in intracellular calcium levels and modulation of PPP3/calcineurin-TFEB (transcription factor EB) axis. Autophagy. 2018 May;10:1–20. PubMed PMID: 29457983.
- Kumar VS, Gopalakrishnan A, Naziroglu M, et al. Calcium ion-the key player in cerebral ischemia. Curr Med Chem. 2014;21(18):2065–2075. PubMed PMID: 24372212.
- Sirabella R, Secondo A, Pannaccione A, et al. Anoxia-induced NF-kappaB-dependent upregulation of NCX1 contributes to Ca2+ refilling into endoplasmic reticulum in cortical neurons. Stroke. 2009 Mar;40(3):922–929. PubMed PMID: 19164785.
- Jin Y, Bai Y, Ni H, et al. Activation of autophagy through calcium-dependent AMPK/mTOR and PKCtheta pathway causes activation of rat hepatic stellate cells under hypoxic stress. FEBS Lett. 2016 Mar;590(5):672–682. PubMed PMID: 26848942.
- Yang J, Yu J, Li D, et al. Store-operated calcium entry-activated autophagy protects EPC proliferation via the CAMKK2-MTOR pathway in ox-LDL exposure. Autophagy. 2017 Jan 2;13(1):82–98. PubMed PMID: 27791458; PubMed Central PMCID: PMC5240837.
- Purdy PD, Devous MD Sr., White CL, et al. Reversible middle cerebral artery embolization in dogs without intracranial surgery. Stroke. 1989 Oct;20(10):1368–1376. PubMed PMID: 2799868.
- Cui G, Ye X, Zuo T, et al. Chloroquine pretreatment inhibits toll-like receptor 3 signaling after stroke. Neurosci Lett. 2013 Aug 26;548:101–104. PubMed PMID: 23558035.
- Airavaara M, Chiocco MJ, Howard DB, et al. Widespread cortical expression of MANF by AAV serotype 7: localization and protection against ischemic brain injury. Exp Neurol. 2010 Sep;225(1):104–113. PubMed PMID: 20685313; PubMed Central PMCID: PMC2925275.
- Wang P, Xu TY, Guan YF, et al. Nicotinamide phosphoribosyltransferase protects against ischemic stroke through SIRT1-dependent adenosine monophosphate-activated kinase pathway. Ann Neurol. 2011 Feb;69(2):360–374. PubMed PMID: 21246601.
- Vink R, Young A, Bennett CJ, et al. Neuropeptide release influences brain edema formation after diffuse traumatic brain injury. Acta Neurochir Suppl. 2003 Feb;86:257–260. PubMed PMID: 14753447.
- Jiang W, Zhang S, Fu F, et al. Inhibition of nuclear factor-kappaB by 6-O-acetyl shanzhiside methyl ester protects brain against injury in a rat model of ischemia and reperfusion. J Neuroinflammation. 2010 Sep;7:55. PubMed PMID: 20836895; PubMed Central PMCID: PMC2946287.
- Chen J, Li Y, Wang L, et al. Therapeutic benefit of intravenous administration of bone marrow stromal cells after cerebral ischemia in rats. Stroke. 2001 Apr;32(4):1005–1011. PubMed PMID: 11283404.
- Fruman DA, Pai SY, Klee CB, et al. Measurement of calcineurin phosphatase activity in cell extracts. Methods. 1996 Apr;9(2):146–154. PubMed PMID: 8812656.
- Luo J, Sun L, Lin X, et al. A calcineurin- and NFAT-dependent pathway is involved in alpha-synuclein-induced degeneration of midbrain dopaminergic neurons. Hum Mol Genet. 2014 Dec 15;23(24):6567–6574. PubMed PMID: 25051958; PubMed Central PMCID: PMC4240205.