
ABSTRACT
ULK1 (unc-51 like autophagy activating kinase 1) is a core component at multiple steps of canonical macroautophagy/autophagy. The activity of ULK1 is tightly regulated by several post-translational modifications, including ubiquitination, yet the deubiquitinase (DUB) responsible for its reversible deubiquitination has not been described. Here, we identified USP1 (ubiquitin specific peptidase 1) as a key player in the modulation of ULK1 K63-linked deubiquitination. Moreover, both USP1 depletion and its chemical inhibition by pimozide are coupled to a reduction of ULK1 in Triton X-100 soluble cellular lysates, and its compartmentalization to a fraction that can be solubilized in 5 M urea. In USP1-depleted cells this fraction is also enriched in SQSTM1 (sequestosome 1), the aggresome marker HDAC6 (histone deacetylase 6), and the prototype of USP1 targets FANCD2 (FA complementation group D2). Consistently, in USP1-depleted and pimozide-treated cells, ULK1 forms protein aggregates enriched in SQSTM1, as detected by both immummunofluorescence and co-immunoprecipitation studies. Notably, depletion of USP1 inhibits canonical autophagic flux and promotes an alternative route leading to lysosomal-mediated degradation of SQSTM1. Our findings reveal a novel function of the USP1-ULK1 axis as a modulator of the switch between canonical and unconventional autophagy. Further, we provide the first evidence supporting the existence of a subset of breast tumors co-expressing ULK1 and MAP1LC3B (microtubule associated protein 1 light chain 3 beta) proteins. Because the USP1 inhibitor pimozide affects breast cancer cell growth, targeting USP1 in those tumors relying on autophagy for growth might prove to be a convenient therapeutic strategy.
Abbreviations: ATG13: autophagy related 13; BECN1: beclin 1; BZ: bortezomib; CAPN1: calpain 1; DUB: deubiquitinase; FANCI: FA complementation group I; FANCD2: FA complementation group D2; FZR1: fizzy and cell division cycle 20 related 1; HDAC6: histone deacetylase 6; MAP1LC3B: microtubule associated protein 1 light chain 3 beta; PMZ: pimozide; SH3GLB1: SH3 domain containing GRB2 like, endophilin B1; SQSTM1: sequestosome 1; TRAF6: TNF receptor associated factor 6; ULK1: unc-51 like autophagy activating kinase 1; USP1: ubiquitin specific peptidase 1; WDR48: WD repeat domain 48
Introduction
USP1 has been proposed as a potential target for non-small cell lung cancer treatment [Citation1] and in differentiation therapy for osteosarcoma [Citation2]. Indeed, besides being an essential player of the Fanconi anemia DNA repair pathway [Citation3] and promoting double-strand break repair through homologous recombination [Citation4], USP1 is also involved in preventing differentiation of osteosarcoma cells through deubiquitination and consequent stabilization of ID2 (inhibitor of DNA binding 2) [Citation2]. Accordingly, we recently demonstrated that the Usp1 mRNA level decreases upon differentiation of mouse embryonic stem cells [Citation5]. In addition, in RAS transformed MCF10AT mammary cells, USP1 protein is sharply more abundant in the CD44+ CD24− cancer stem cell population. Interestingly, only in this specific population, USP1 is not only found in the nucleus, as expected, but also in the cytoplasm [Citation5]. A recent report demonstrated that USP1 dynamically deubiquitinates FANCD2, allowing complex formation only in the presence of its FANCI partner [Citation6]. This finding shed light on the absolute requirement of USP1 for Fanconi anemia complex DNA repair foci formation in response to DNA damage [Citation7], and the consequent severe phenotype of usp1−/- mice.
Several chemical compounds that inhibit USP1 function both in vitro and in vivo have been identified [Citation1,Citation8]. One of these inhibitors, pimozide, is an approved antipsychotic drug, commonly used to treat patients affected by Tourette syndrome. USP1 is targeted for proteasome degradation mediated by FZR and CDH1 [Citation9]; ubiquitous CAPN1 (calpain 1) stabilizes the USP1 deubiquitinating enzyme, in a FZR1-dependent manner, thus enabling DNA repair and re-entry of high fidelity DNA polymerases after DNA lesion bypass [Citation10]. Therefore, CAPN1 inhibition may represent an alternative strategy for USP1 interference in the cellular systems where CAPN1-FZR1-USP1 is active. Another strategy to knock down USP1 activity is to target WDR48/UAF1 (WD repeat domain 48, a cofactor required for USP1 stability and function [Citation11].
Notably, several Fanconi anemia proteins are involved in selective autophagy, including mitochondrial quality control and prevention of inflammasome activation, although the molecular mechanisms remain elusive [Citation12]. ULK1 kinase is a key regulator of autophagy [Citation13,Citation14]. ULK1 phosphorylates BECN1 (beclin 1), thus activating phosphatidylinositol 3-kinase [Citation15] and consequently switching the ubiquitin-like conjugation system on, resulting in canonical autophagy pathway induction [Citation16]. Moreover, post-initiation, ULK1-GABARAP (GABA type A receptor-associated protein) complex allows substrate phosphorylation during the final stages of phagophore formation [Citation17]. Although specific lysine residues of modification have not yet been identified, ULK1 ubiquitination plays a multi-faced role in autophagy modulation. K63-linked ubiquitination of ULK1, by TRAF6 supports subsequent stabilization, self-association and function [Citation18]. Conversely, ULK1 ubiquitination by CUL3 (cullin 3) leads to its proteasome-dependent degradation and autophagy termination [Citation19]. Notably, deubiquitination inhibition by a chemical compound, WP1130, leads to ULK1 aggregation and blockade of autophagy [Citation20].
In light of the published data above described, we investigated whether USP1 might regulate autophagy by means of ULK1 deubiquitination. Our study confirms previous reports on ULK1 ubiquitination, and it unveils unexpected results suggesting that ULK1 modulation by USP1 may trigger the shift between canonical autophagy and alternative MAP1LC3B-dependent pathways [Citation21–Citation23]. Various forms of noncanonical autophagy have been reported and partly characterized in several system over the years [Citation24–Citation26]. We propose that shifting the balance toward unconventional autophagy may be instrumental in killing cancer cells.
Results
USP1 modulates ULK1 compartmentalization in mammalian cells
It has been shown that deubiquitinase inhibition by WP1130 reduce the protein level of ULK1 in the Triton X-100 soluble fraction of mammalian cell extracts [Citation20]. In confirmation of this study, USP1 depletion using siRNA, was coupled to a reduction of total ULK1 and ULK1 p-Ser555 in the soluble fraction of U2OS, HEK293, and MCF10AT cells (). Three alternative USP1 specific siRNAs were used for the first experiments (). Because the outcome on ULK1 was similar, USP1a siRNA was used for the rest of this study. According to the results obtained by depletion studies, ectopic expression of wild type USP1, but not of catalytically inactive USP1, rescues the reduction of ULK1 and ULK1 p-Ser555 in the soluble fraction ( and S1(d)). Phosphorylation of ULK1 at Ser555 by AMPK is critical for its function in autophagy [Citation27].
Figure 1. USP1 modulates ULK1 in mammalian cells. (a) U2OS cells were transfected with scrambled control siRNA or 3 different USP1-specific siRNAs. The relative amounts of each protein were quantified using ImageJ. The ratio of ULK1:ACTA1 and p-ULK1:ACTA1 was calculated and indicated in the graphs (b and c). (d) HEK-293, U2OS and MCF10AT cells were transfected with scrambled control or USP1-specific siRNA. After 72 h, samples were lysed in 1% Triton X-100-containing buffer and the cleared lysates utilized to monitor endogenous ULK1 and ULK1 p-Ser555 protein levels by western blot. The relative amounts of each protein were quantified using ImageJ. The ratio of ULK1:ACTA1 and pULK1:ACTA1 was calculated and indicated in the graphs (e and f). Filled arrow indicates full-length USP1; empty arrow indicates its autocleaved derivative. (g) U2OS cells were transfected with the indicated constructs. After 24 h the samples were lysed in 1% Triton X-100-containing buffer and, the cleared lysates utilized to monitor endogenous ULK1 and ULK1 p-Ser555 protein levels by western blot. The relative amounts of each protein were quantified using ImageJ and the ratio of ULK1:ACTA1 and p-ULK1:ACTA1 was calculated and indicated in the graphs (h and i).
Depletion of USP1 remarkably reduced the total ULK1 protein level in the soluble fraction. This could be due to a reduction in protein stability, as described for ID2, a previously identified USP1-specific target [Citation2]. A time-course experiment with the proteasome inhibitor bortezomib, in USP1-depleted U2OS and MCF10AT cells, demonstrated that this is not the case for ULK1 ().
Figure 2. USP1 modulates ULK1 in mammalian cells. (a) U2OS and (b) MCF10AT cells were transfected with scrambled or USP1-specific siRNA and 72 h later were incubated with 100 nM bortezomib for the indicated time intervals. The cleared lysates were utilized to monitor endogenous ULK1 and ULK1 p-Ser555 by immunoblot. The relative amounts of each protein were quantified using ImageJ. The ratio of ULK1:ACTA1 and p-ULK1:ACTA1 was calculated and indicated in the graphs (c and d) and (e and f).
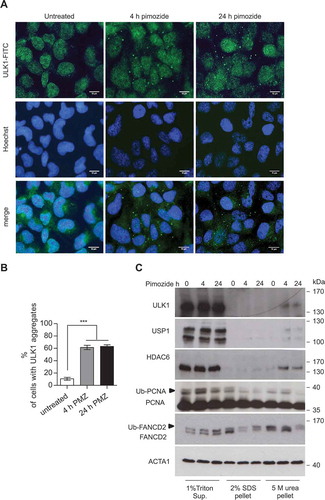
The DUB inhibitor WP1130 induced relocalization of GFP-ULK1 to aggresome-like structures, as detected by fluorescence analysis, and to a Triton X-100-insoluble pellet upon cells lysis [Citation20]. We verified whether USP1 depletion could have the same effect on endogenous ULK1. Interestingly, ULK1 aggregates were evident in USP1-depleted cells ( and S1). In parallel, the cells were lysed in sample buffer and the lysates utilized to check silencing efficiency (). Endogenous ULK1 from USP1-depleted cells was efficiently solubilized in 5 M urea (). Similar results were obtained with ectopic ULK1 (S1A-C). Two aggresome markers: VIM (vimentin) and HDAC6 were more abundant in the pellet fractions, as expected. Notably, while VIM distribution was independent of USP1, HDAC6 relocalization to the insoluble pellet was sharply enhanced in USP1-depleted cells, as was the case for ULK1. Interestingly, a similar distribution was observed for FANCD2, the prototype target of USP1 (). To further assess the involvement of USP1 activity in the modulation of endogenous ULK1 compartmentalization, ULK1 distribution was analyzed by immunofluorescence and biochemical fractionation, upon treatment with the USP1 inhibitor pimozide [Citation1]. Pimozide induced relocalization of endogenous ULK1 to aggregates already after 4 h (). Accordingly, the 5 M urea-soluble pellet became enriched in ULK1 and HDAC6 upon pimozide treatment (). As expected, pimozide treatment was coupled to a transient increase in ubiquitination of the USP1 targets PCNA and FANCD2 ().
Figure 3. USP1 depletion is coupled to a shift in ULK1 compartmentalization/solubility. (a, b and c) U2OS cells were silenced with scrambled or USP1-specific siRNA. After 72 h they were fixed and immunostained with anti-ULK1 antibody and analyzed by confocal laser scanning microscopy. (a) Representative images. Scale bar: 10 μm. (b) Quantification of the percentage of cells containing ULK1 aggregates. Data are means ± SD of 3 independent experiments *** = P < 0.0001; 50 cells per each condition were analyzed. (c) Control blot. (d) U2OS cells were transfected with scrambled or USP1-specific siRNA; 72 h later, 1% Triton X-100-soluble and -insoluble fractions were separated by centrifugation. Pellets were solubilized alternatively in 5 M urea- or in 2% SDS-containing buffers and analyzed by immunoblot with the indicated antibodies.
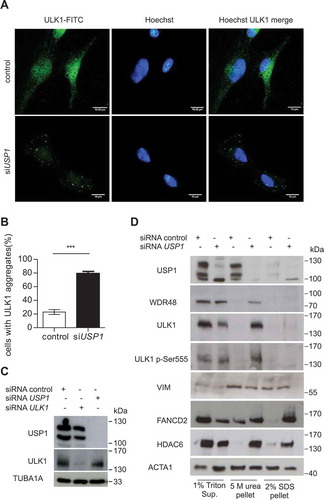
Figure 4. The USP1 inhibitor pimozide affects ULK1 compartmentalization/solubility. (a and b) U2OS cells were left untreated or incubated with 2.5 μM pimozide for the indicated time points, then fixed for immunofluorescence analysis with anti-ULK1 antibody and analyzed by confocal laser scanning microscopy. (a) Representative images, scale bar: 10 μm. (b) Quantification of cells with ULK1 aggregates. The graph reports the means ± SD of 3 independent experiments, at least 50 cells per group per experiment were counted. *** = P < 0.0001. (c) U2OS cells were left untreated or treated with 2.5 μM pimozide for the indicated time intervals. Next, 1% Triton X-100-soluble and -insoluble fractions were separated by centrifugation. Pellets were solubilized either with 5 M urea- or 2% SDS-containing buffers, and analyzed by immunoblot with the indicated antibodies.
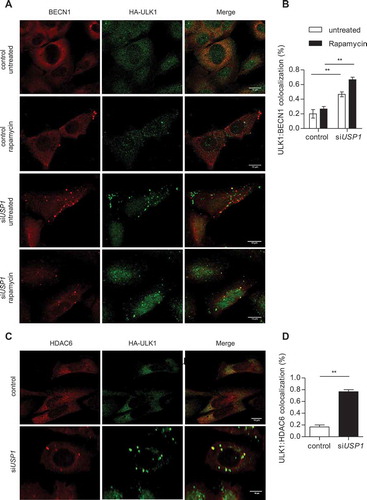
To characterize the ULK1 puncta observed in USP1-depleted cells, we verified their colocalization/interaction with the ubiquitin-binding receptor protein SQSTM1 both by immunofluorescence analysis and immunoprecipitation experiments. As previously shown for WIP1130-dependent GFP-ULK1 aggresomes [Citation20], endogenous ULK1 partly colocalized with SQSTM1 dots (). Notably, SQSTM1 dots were more abundant in USP1-depleted cells (). In accordance with the colocalization data, co-immunorecipitation experiments with anti-ULK1 antibody showed that SQSTM1-ULK1 interaction was stronger in USP1-depleted cells than in control ones (). As expected, and shown in , , and , ULK1 protein level was reduced in the cleared lysates of USP1-depleted cells, as compared to control ones. Because the SQSTM1-ULK1 interaction increased in USP1-depleted cells, we expected to find an enrichment of SQSTM1 in the 5 M urea-solubilized pellets. Indeed, 5 M urea-solubilized pellets, obtained from cellular lysates of USP1-depleted cells, were enriched in SQSTM1 (). This protein fraction was also enriched in other autophagic players: MAP1LC3B, SH3GLB1/Bif1 (SH3 domain containing GRB2 like, endophilin B1), and BECN1 in lysates derived from USP1-depleted cells (). A fraction of ATG13 was also shifted to the 5 M urea pellet in USP1-depleted cells (Figure S2). Notably, ATG13 phosphorylation at serine 318 was not affected by USP1 depletion, indicating that ULK1 kinase activity was conserved (Figure S2(a)). Moreover, the ULK1 pellet fraction was not phosphorylated at Ser757, indicating that it had been part of an autophagic functional complex (Figure S2). In order to characterize ULK1 bodies, which become detectable when USP1 is inactive, we investigated the colocalization of ULK1 with BECN1, HDAC6 and SH3GLB1. As shown in , ULK1 colocalized with BECN1 in USP1-depleted cells, both before and after rapamycin treatment, indicating that also BECN1 was shifted to ULK1 bodies. Notably, USP1 depletion was coupled to a sharp increase in ULK1 colocalization with HDAC6 (). Conversely, SH3GLB1 did not colocalize with ULK1 bodies (data not shown).
Figure 5. USP1 depletion is coupled to an increase in SQSTM1-ULK1 colocalization and enrichment of autophagic proteins in the 5 M urea-solubilized pellet. (a) Representative images of U2OS cells transfected with scrambled or USP1-specific siRNA and then fixed for immunofluorescence analysis with anti-SQSTM1- and -ULK1-specific antibodies. Scale bar: 10 μm. (b) Percentage of cells containing SQSTM1 dots. (c) Quantification of SQSTM1-ULK1 colocalization. Both graphs (b and c) report the mean ± SD of n = 3 independent experiments; at least 50 cells per group per experiment were counted. ** = P < 0.001 and *** = P < 0.0001. (d) Control blot. (e) U2OS cells were transfected with control, ULK1- or USP1-specific siRNA. After 72 h, the cells were left untreated or incubated with 100 nM of bortezomib for 6 h. Cleared lysates were immunoprecipitated with anti-ULK1 antibody and analyzed by immunoblotting with the indicated antibodies. (f) U2OS cells were transfected with scrambled or USP1-specific siRNA and were lysed after 72 h, in 1% Triton X-100-containing buffer. Detergent-soluble and insoluble fractions were separated by centrifugation and the pellets were solubilized either with 5 M urea-, or 2% SDS-based buffers and analyzed by immunoblots with the indicated antibodies.
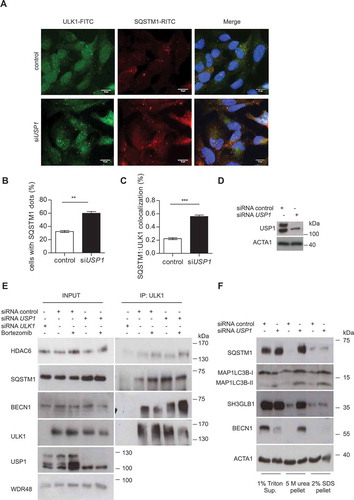
Figure 6. USP1 depletion increases BECN1-ULK1 and HDAC6-ULK1 colocalization. (a and b) U2OS cells were transfected with scrambled or USP1-specific siRNA and after 72 h with a plasmid encoding HA-ULK1. After 24 h, the cells were treated with rapamycin for 3 h and fixed for immunofluorescence analysis with anti-BECN1- and anti-HA-specific antibodies. (a) Representative images. Scale bar: 10 μm. (b) Quantification of BECN1-ULK1 colocalization. The graph reports the mean ± SD of n = 3 independent experiments; at least 50 cells per group per experiment were counted; ** = P < 0.001. (c and d) U2OS cells were transfected with scrambled or USP1-specific siRNA, and 72 h later, with a plasmid encoding HA-ULK1. After an additional 24 h, the cells were fixed for immunofluorescence analysis with anti-HDAC6- and anti-HA-specific antibodies. (c) Representative images. Scale bar: 10 μm. (d) Quantification of HDAC6-ULK1 colocalization. The graph reports the mean ± SD of n = 3 independent experiments; at least 50 cells per group per experiment were counted; ** = P < 0.001.
USP1 interacts with and deubiquitinates ULK1
We have demonstrated that USP1 depletion dramatically affects ULK1 compartmentalization. To investigate whether the effect was direct, we monitored ULK1-USP1 interaction by coimmunoprecipitation analysis. USP1 substrates typically interact with the USP1 cofactor WDR48 [Citation11]. Therefore, an expression vector encoding MYC-WDR48 was transfected intp HEK293 cells, and WDR48 interactors were monitored after immunoprecipitation and immunoblot. Maltose binding protein (MBP) was used as a quantitative reporter of gene expression. As expected, USP1 was efficiently immunoprecipitated together with MYC-WDR48. Notably, ULK1 was also present in the immunoprecipitated fraction (). To further confirm this result, endogenous USP1 was immunoprecipitated with an anti-USP1 antibody from nuclear and cytoplasmic fractions of HEK293 cells (). Notably, the USP1-ULK1 interaction appeared stronger in nuclear extracts. This is not surprising given that endogenous USP1 preferentially localizes in the nucleus (Figure S3).
Figure 7. USP1 interacts with and deubiquitinates ULK1. (a) Control vector or a MYC-WDR48 (USP1 cofactor)-expressing plasmid were transfected into HEK293 cells. MBP was used as a transfection control. Cleared lysates were immunoprecipitated with anti-MYC antibodies and analyzed by immunoblot with the indicated antibodies. (b) Nuclear (N) and cytosolic (C) fractions were prepared from HEK293 cells and were subjected to immunoprecipitation (IP) with anti-IgG or anti-USP1 antibody. (c) U2OS cells transfected with scrambled or USP1-specific siRNA were left untreated or incubated with 0.5 μM rapamycin for 3 h. Cleared lysates were immunoprecipitated with anti-IgG or anti-ULK1 antibody and analyzed by immunoblot with the indicated antibodies. The arrow points towards the monoubiquitinated ULK1.
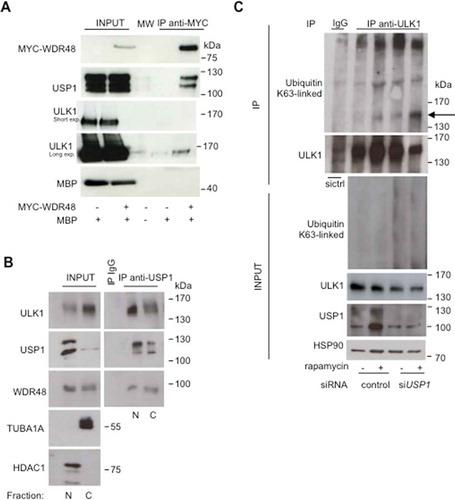
Nazio et al. demonstrated that rapamycin induced a net induction of K63-linked ULK1 ubiquitination, mediated by TRAF6 [Citation18]. To assess whether USP1 may be responsible for K63-linked deubiquitination of ULK1, we analyzed ULK1 ubiquination status in control and USP1-depleted cells before and after treatment with rapamycin. We confirmed published data on the increase of K63 ubiquitination upon rapamycin treatment. Interestingly, USP1 depletion sharply increased the level of ULK1 mono (and poly)-K63-linked ubiquitination (). This result indicates that USP1 is responsible for ULK1 deubiquitination. Similar results were obtained analyzing the fraction of ubiquitinated ULK1 in both control and USP1-depleted cells after immunoprecipitation with anti-ULK1 p-Ser555 antibody (Figure S4).
In USP1 depleted cells canonical autophagy is impaired; whereas non-canonical autophagy is constitutively active
We have shown a shift in ULK1 compartmentalization and an increase in its K63-linked ubiquitination in USP1-depleted cells. What about the effect of USP1 depletion on autophagy? Autophagosome formation was monitored by immunofluorescence analysis of MAP1LC3B following standard procedures, involving fixation in paraformaldehyde and digitonin for permeabilization to preserve autophagosome structure (protocol from Dr. Mizushima laboratory available on-line at: http://proteolysis.jp/autophagy/protocol/protocol%20files/LC3%20immunostaining.pdf).
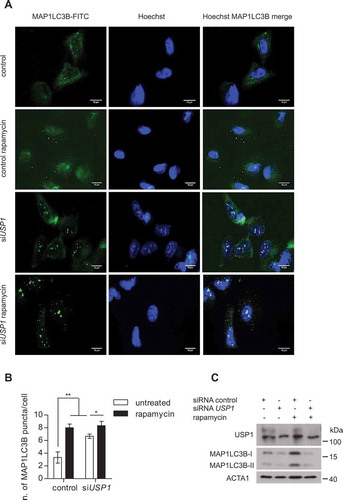
Cells grown on coverslips were analyzed by immunofluorescence (). In parallel, the remaining cells were lysed in sample buffer and the lysates utilized to check silencing efficiency and autophagy induction (). Rapamycin clearly induced autophagosome formation in control cells, but not in USP1-depleted cells (). Next, we followed MAP1LC3B lipidation and SQSTM1 stability in response to rapamycin, in the presence or absence of a cathepsin inhibitor cocktail [Citation28] in both control and USP1-depleted cells. In light of our findings on the relocalization of many autophagic markers in the 5 M urea-soluble pellet, both the Triton X-100-soluble fraction and the 5 M urea-solubilized pellets were analyzed (). In control cells, MAP1LC3B lipidation increased upon treatment with the cathepsin inhibitor cocktail, uncovering basal autophagy flux. It also increased upon rapamycin treatment, and was enhanced by the combined treatments, as expected for active induction of the autophagic flux (). Accordingly, SQSTM1 decreased upon rapamycin treatment, and was rescued upon cathepsin inhibition. A similar enrichment of MAP1LC3B, ULK1, and SQSTM1 occurred in the 5 M urea-solubilized pellet fraction extracted from USP1-depleted cells (). Both ULK1 and SQSTM1 decreased upon rapamycin treatment in a cathepsin-dependent fashion. Conversely, in the same fraction, the level of MAP1LC3B lipidation appeared similar in samples from rapamycin-treated cells and in samples treated with both rapamycin and lysosome inhibitor cocktail, further suggesting that canonical autophagy was impaired. This biochemical analysis confirmed the immunofluorescence data indicating the requirement of USP1 for canonical autophagy, and unveiled, in USP1-depleted cells, a parallel MAP1LC3B-dependent pathway that directs SQSTM1 (and probably its cargos) to lysosomal clearance.
Figure 8. Canonical autophagy is impaired in USP1-depleted cells. (A-C) U2OS cells were transfected with scrambled control or USP1-specific siRNA. After 72 h, the cells were left untreated or treated with 0.5 μM rapamycin. After 3 h, the cells were fixed with paraformaldehyde, permeabilized with digitonin and analyzed by immunofluorescence with anti-MAP1LC3B antibody. (a) Representative images. Scale bar: 10 μm. (b) The graph reports the means ± SD of the number of MAP1LC3B puncta per cell. At least 50 cells for each condition in each experiment were analyzed. N = 3 independent experiments. *** = P < 0.0001, * = P < 0.05. (c) Control blot. (d) U2OS cells were transfected with control or USP1-specific siRNA. After 72 h, the cells were left untreated, or incubated with 0.5 μM rapamycin, or a cathepsin inhibitor cocktail (100 μM pepstatin A [Pep] and 10 μg/ml E64D), or a combination of rapamycin and cathepsin inhibitor cocktail for 3 h. Next, the detergent-soluble or – insoluble fractions were prepared and analyzed by immunoblot analysis with the indicated antibodies. The ratio of MAP1LC3B-II:ACTA1 was quantified using ImageJ and indicated in the graphs (e and f).
![Figure 8. Canonical autophagy is impaired in USP1-depleted cells. (A-C) U2OS cells were transfected with scrambled control or USP1-specific siRNA. After 72 h, the cells were left untreated or treated with 0.5 μM rapamycin. After 3 h, the cells were fixed with paraformaldehyde, permeabilized with digitonin and analyzed by immunofluorescence with anti-MAP1LC3B antibody. (a) Representative images. Scale bar: 10 μm. (b) The graph reports the means ± SD of the number of MAP1LC3B puncta per cell. At least 50 cells for each condition in each experiment were analyzed. N = 3 independent experiments. *** = P < 0.0001, * = P < 0.05. (c) Control blot. (d) U2OS cells were transfected with control or USP1-specific siRNA. After 72 h, the cells were left untreated, or incubated with 0.5 μM rapamycin, or a cathepsin inhibitor cocktail (100 μM pepstatin A [Pep] and 10 μg/ml E64D), or a combination of rapamycin and cathepsin inhibitor cocktail for 3 h. Next, the detergent-soluble or – insoluble fractions were prepared and analyzed by immunoblot analysis with the indicated antibodies. The ratio of MAP1LC3B-II:ACTA1 was quantified using ImageJ and indicated in the graphs (e and f).](/cms/asset/fc8fbff4-4827-4d11-b38c-a17d1f47e49a/kaup_a_1535291_f0008_c.jpg)
To further verify the shift to unconventional autophagy in USP1-depleted cells, the immunofluorescence analysis of endogenous MAP1LC3B bodies was performed following a protocol described to characterize noncanonical autophagy, involving the use of ice-cold methanol to fix/permeabilize the cells [Citation26]. The cells grown on the coverslips were analyzed by immunofluorescence (). In parallel, the remaining cells were lysed in sample buffer and the lysates utilized to check silencing efficiency and autophagy induction (). Notably, in control cells the number of MAP1LC3B bodies increased upon rapamycin treatment (). Strikingly, in USP1-depleted cells, the MAP1LC3B staining pattern was totally different from the one observed with milder fixation/permeabilization reagents, and MAP1LC3B bodies already appeared in untreated cells. Notably, in control cells, MAP1LC3B-SQSTM1 colocalization increased upon rapamycin treatment, as expected (Figure S5(a,b)). Conversely, in USP1-depleted cells MAP1LC3B-SQSTM1 already partially colocalized in basal conditions (Figure S5(a,b)). Figure S6 summarizes the results obtained in presence or absence of USP1 in the context of autophagosome formation.
Figure 9. Noncanonical autophagy is hyperactive in USP1-depleted cells. (a-c) U2OS cells were silenced and treated as in , then fixed and permeabilized in ice-cold methanol for 5 min. Fixed cells were analyzed by immunofluorescence using anti-MAP1LC3B antibodies. (a) Representative images. Scale bar: 10 μm. (b) The graph reports the means ± SD of the number of MAP1LC3B puncta per cell. At least 50 cells per group per experiment were counted, n = 3 independent experiments. (c) Control western blot.
Targeting USP1 to kill autophagy-competent cancer cells
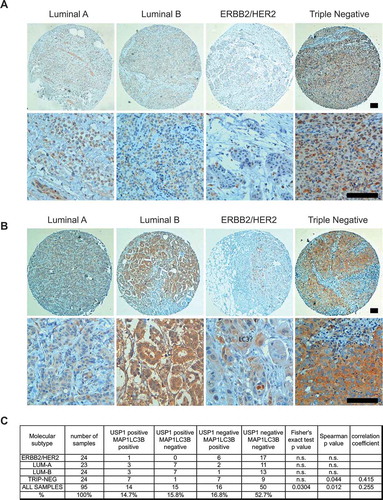
Aberrant overexpression of USP1 mRNA is particularly frequent in cervical and gastric cancer, melanoma and sarcoma [Citation29]. The autophagy protein MAP1LC3B is highly upregulated in triple-negative breast cancers and represents a prognostic marker specifically for tumors of this molecular subtype [Citation30]. Analysis of USP1 protein levels in breast cancer samples have not yet been published. In order to study whether MAP1LC3B may be co-expressed with USP1 in breast cancer, we selected a pilot collection of 95 invasive breast tumor samples of 4 different molecular subtypes [Citation31]: 24 ERBB2/HER2 positive, 23 luminal A, 24 luminal B, and 24 triple-negative samples (Table S1). De novo tumors, non-metastatic and non-pre-treated by neo-adjuvant regimens, have been included.
For each subtype, consecutive cases were selected, i.e. all cases presenting the requested inclusion criteria were selected, until the required sample size was achieved. Patients of the 4 molecular groups present a similar age and did not differ in terms of histotype distribution (e.g., ductal carcinoma, lobular carcinoma), as defined by the WHO classification of the breast tumors [Citation32]. Conversely, with respect to luminal A tumors, the other 3 groups were characterized by an increased grade, according to the Elston-Ellis grading system [Citation33], and stage, as defined by the TNM staging system [Citation34], indicating an increased biological aggressiveness (grade) and clinical dissemination of the tumors (Table S1). Tumor samples were analyzed by immunohistochemistry to evaluate USP1 () and MAP1LC3B proteins (), as described previously [Citation35]. Notably, all but one ERBB2/HER2 breast cancers were USP1 negative, possibly excluding its role in this molecular subtype. Conversely, approximately 40% of luminal A (10 out of 23), luminal B (10 out of 24) and triple negative (10 out of 24) samples expressed this protein, independently of the expression of MAP1LC3B. Considering the co-expression of USP1 and MAP1LC3B, the fraction of USP1-positive tumors that were also MAP1LC3B positive was 30% in luminal A and B samples and 90% in triple-negative tumors. Spearman’s Rho test was applied to the whole population of samples and to each group to measure the association between USP1 and MAP1LC3. Despite the small number of samples, a significant correlation was found for USP1 and MAP1LC3, when considering the entire samples population, or only the group of triple-negative tumor samples (). In parallel, Fisher’s exact test was applied to the data grouped in a 2 by 2 contingency table. In this case a significant correlation was found when considering the entire population. This preliminary immunohistochemestry study demonstrates with 2 alternative statistical tests that USP1 and MAP1LC3B are significantly co-expressed in a collection of 95 breast cancer samples. A larger cohort of samples will be analyzed to address further hypotheses.
Figure 10. USP1 and LC3 proteins are expressed and significantly correlate in a subset of mammary tumors. (a and b) Representative images. Scale bars: 100 μm. (c) The table shows the number and percentage of USP1- and MAP1LC3B-positive samples for each group. Fisher’s exact test and Spearman’s test were performed in order to verify the correlation between USP1 and MAP1LC3B expression. P values and statistics are indicated for each group.
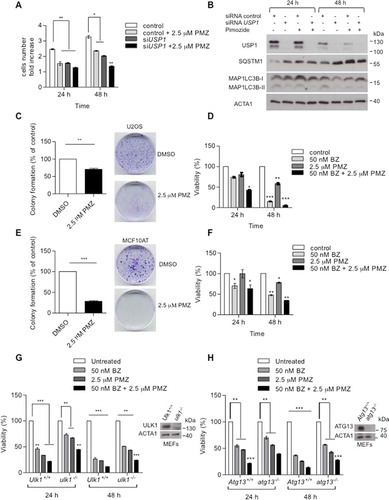
The antipsychotic drug pimozide, which inhibits USP1, was previously shown to reduce cellular proliferation of some breast cancer cell lines [Citation36]. We investigated whether pimozide may slow U2OS cells growth down, and if any observed effect was USP1 dependent. Control and USP1-depleted cells were counted before and after pimozide addition (). After the first 24 h, pimozide induced a USP1-dependent decrease in cellular growth. USP1 depletion itself slowed cell growth down, but pimozide treatment did not further enhance such an effect. At 48 h after pimozide addition, the decrease in cellular growth was no longer dependent on USP1. This was not surprising, because at this time point the USP1 protein level was sharply reduced (). Notably, colony-forming efficiency was significantly reduced by pimozide both in U2OS and in MCF10AT cells (). Moreover, pimozide alone and in combination with bortezomib significantly affected cellular viability (). In order to verify whether pimozide-dependent growth inhibition was at least partly due to a block in autophagy, we compared cellular viability of atg13 and ulk1 knockout MEFs with their respective wild-type controls in response to pimozide (). Inhibition of cell growth by pimozide was significantly reduced in knockout MEFs that were impaired in autophagy. Altogether these data unveiled a novel potential therapeutic strategy for USP1-positive tumors that rely on autophagy for survival.
Figure 11. Pimozide affects cellular growth and colony-forming efficiency. (a and b) U2OS cells were transfected with scrambled or USP1-specific siRNA. After 72 h, the cells were either left untreated or grown in the presence of 2.5 μM pimozide (PMZ). Cells were counted at time 0, 24 and 48 h post drug addiction. (a) The graph indicates the means ± SD of cell number increase after 24 and 48 h with respect to time 0. N = 3 independent experiments. (b) Western blot analysis after 24 and 48 h of treatment for each condition to monitor USP1, MAP1LC3B and SQSTM1 levels. ACTA1 was used as loading control. (c) and (e) Effect of pimozide on colony formation assay in U2OS cells (c) or MCF10AT cells (e). Cells were treated with 2.5 μM pimozide for 2 wks, before processing. The graphs report the average colony-forming efficiency of 3 independent experiments. Colonies were counted using imageJ software; ** = P < 0.001 and *** = P = 0.0001. Representative images are shown at the right side of each graph. (d and f) U2OS (d) and MCF10AT (f) cells were left untreated, or treated with 50 nM bortezomib, 2.5 µM pimozide, or a combination of the 2 drugs. 24 and 48 h later, cell viability was measured by means of a fluorimeter after labeling with a commercial kit. The graph indicates the means ± SD, n = 3 independent experiments. Ulk1+/+ and ulk1−/- MEFs (g) or Atg13+/+ and atg13−/- MEFs (h) were left untreated, or treated with 50 nM bortezomib, 2.5 µM pimozide, or a combination of the 2 drugs. 24 and 48 h later, cell viability was measured by means of a fluorimeter after labeling with a commercial kit. The graphs indicate the means ± SD, n = 3 independent experiments.
Discussion
We confirmed that ULK1 deubiquitnation sharply affects its compartmentalization [Citation20], and showed that USP1 is the responsible DUB. We also demonstrated that USP1 depletion increases the TRAF6-dependent K63-linked ubiquitination of ULK1 triggered by rapamycin addition [Citation18], arguing for a direct involvement of USP1 in the removal of K63-linked ubiquitin from ULK1. We also showed that canonical autophagy is impaired in USP1-depleted cells, despite the requirement of K63 ubiquitination of ULK1 for autophagy [Citation37]. We hypothesize that, although all the molecular players are set for canonical autophagy, dynamic ubiquitination and deubiquitination of ULK1 is required to allow their concerted action in autophagy initiation. A similar scenario was described for FANCD2, the prototype of USP1 substrates. Indeed, both ubiquitination and deubiquitination of FANCD2 are required for its function in Fanconi complex formation and DNA repair [Citation7]. Very recently, the role of USP1 in the formation of FANCD2-FANCI foci formation and repair of DNA interstrand crosslinks has been biochemically dissected. In this system USP1 is essential to deubiquitinate FANCD2 when FANCI has not been ubiquitinated, and allows complex formation only when both proteins are ubiquitinated. Moreover, USP1 removes ubiquitin from both proteins once DNA repair has occurred [Citation6]. By analogy, we speculate that USP1 removes K63-linked ubiquitin from ULK1 when BECN1 is not ubiquitinated, allowing active complex formation and autophagy only when both proteins are ubiquitinated. Alternatively (or in addition), ULK1 deubiquitination by USP1 could allow ULK1 function in post-initiation events [Citation6], working as an amplifier. In USP1-depleted cells, ULK1 is frozen in a ubiquitinated form that, although required for full autophagic activity [Citation18], must be cyclically deubiquitinated by USP1 to ensure the dynamic role of ULK1 in the initiation and post-initiation steps of canonical autophagy.
On the basis of published data and of this study we hypothesize that (at least) 2 MAP1LC3B-dependent pathways are always present in mammalian cells to direct and clear various cargos into the lysosome. We proposed that in the absence of canonical autophagy, the cells use part of the machinery for clearance [Citation22,Citation23]. A number of studies have demonstrated that various forms of noncanonical autophagy may be activated in specific systems, such as MAP1LC3B-dependent phagocytosis [Citation24,Citation25], macropinocytosis and entosis [Citation38]. A recent report demonstrated that a number of drugs, such as chloroquine and ammonium chloride, previously described as autophagy inhibitors [Citation39], also activate a parallel MAP1LC3B-dependent clearance route [Citation26].
Our study also unveils that MAP1LC3B detection may be drastically affected by alternative fixation/permeabilization and solubilization reagents used for immunofluorescence or western blotting analysis. This technical point should be taken into account both for the interpretation of molecular and cellular biology studies and for screening purposes.
Autophagy is required for the tumorigenicity of breast cancer stem cells [Citation40] and for aggressive growth of triple-negative breast cancers [Citation30]. Several ongoing clinical trials are now testing autophagy inhibitors in combination with conventional chemotherapeutic drugs [Citation41,Citation42]. Here we demonstrated in a pilot study a significant correlation between MAP1LC3B and USP1 proteins in breast cancer. In addition, others and we showed that the USP1 inhibitor pimozide might alter breast cancer growth [Citation36]. Studies are ongoing to further evaluate this working hypothesis.
We also propose that USP1 modulates the shift between noncanonical and canonical autophagy allowing robust and sustained autophagy to help survival and proliferation of cancer cells. A concerted inhibition of the proteasome and USP1 may represent an efficient strategy against cancer cells that require autophagy for survival. This novel strategy could be beneficial, not only against breast cancer resistant to conventional therapy, but also for osteosarcoma and other cancers that use the USP1-autophagy axis for survival. Notably, in patients with breast cancer the skeleton is the most frequent site for metastasis.
Materials and methods
Chemicals and reagents
Bortezomib (2204) was purchased from Cell Signaling Technology, rapamycin (R0395), pepstatin A (77170), E64D (E 3132) and pimozide (P1793) were bought from Sigma-Aldrich. Lipofectamine RNAiMAX (13778150) was bought from Invitrogen and Mirus TransIT- LT1 was purchased from MirusBio (MIR2304). USP1-specific small interfering RNA (siRNA) were purchased from Eurofins MWG Operon with the follow sequences: USP1 siRNA a:5ʹAACCCUAUGUAUGAAGGAUAU3ʹ, USP1 siRNA b: 5ʹATGTGGCAGAATTACCTACTA3ʹ,USP1 siRNAc: 5ʹCTGGGACCCATGAATCTGATA3ʹ. ULK1-specific small interfering RNA (siRNA) with the sequence 5ʹ-CGCAUGGACUUCGAUGAGUUU-3ʹ was purchased from Eurofins MWG Operon. Antibodies were obtained from the following sources: mouse anti-SH3GLB1 (NBP2-24733; clone 30A882.1.1) from Novus Biologicals; mouse anti-Flag (F3165; clone M2), rabbit anti-ACTA1/actin (A2066), and rabbit anti-WDR48 (HPA038421) from Sigma-Aldrich; mouse anti-VIM (550513; clone RV202) and mouse anti-SQSTM1 (610832; clone 3) from BD Transduction Laboratories; rabbit anti-phospho-ULK1 (Ser555) (5869; clone D1H4), mouse anti-ubiquitin (3936; clone P4D1) and mouse anti-MYC-Tag (2276; clone 9B11) from Cell Signaling Technology; rabbit anti-USP1 (A301-699A) from Bethyl Laboratories; rabbit anti-ULK1 (sc-33182; clone H-240), rabbit anti-HDAC6 (sc-11420; clone H-300), rabbit anti-BECN1 (sc-11427; clone H-300), mouse anti-HSP90AA/Hsp90α-HSP90AB1/Hsp90β (sc-13119; clone F-8), mouse anti-FANCD2 (sc-20022; clone FI17) and mouse anti-HA-Tag (sc-805; clone Y-11) from Santa Cruz Biotechnology; mouse anti-TUBA1A/α-tubulin (05829; clone DM1A), rabbit anti-ubiquitin K63 specific (05–1308; clone Apu3) from Merck Millipore; MAP1LC3B antibody was purified from rabbit serum after immunization with GST-MAP1LC3B according to standard procedures. Peroxidase-conjugated goat anti-rabbit IgG and peroxidase-conjugated goat anti-mouse IgG, were bought from Sigma-Aldrich (A5154 and A4416).
Plasmids and constructs
USP1 and WDR48 constructs were previously described [Citation10]. A plasmid coding for wild-type ULK1-HA was generously provided by S. A. Tooze (Crick Institute, London).
Cell culture and tranfections
U2OS cells were obtained from ATCC and recently authenticated (HTB-96). They were grown in DMEM low glucose (1.0 g/L D-glucose, L-glutamine [LONZA, BE12-708F]), supplemented with 10% FCS (GibcoTM, 10270098), 1% penicillin-streptomycin (LONZA, 17-603E). Ulk1+/+ and ulk1−/- mouse embryonic fibroblasts were a kind gift of S. A. Tooze (Crick Institute, London). Atg13+/+ and atg13−/- mouse embryonic fibroblasts were generously provided by N.T. Ktistakis (Babraham Institute, Cambridge) and originated in the laboratory of N. Mizushima (University of Tokyo).
HEK293 cells were cultured in DMEM high glucose (4.5 g/L D-glucose, L-glutamine [LONZA, BE12-604F]), supplemented with 10% FCS, 1% penicillin-streptomycin. MCF10AT cells were cultured in DMEM (high glucose):Ham’s F12 medium (1:1) (LONZA, BE12-615F), supplemented with 10 mg/ml INS/insulin (Sigma-Aldrich, 91077C), 20 ng/ml EGF (PEPROTECH, 100–47), 500 ng/ml hydrocortisone (Sigma-Aldrich, H4001), 5% horse serum (GibcoTM, 16050130), 1% penicillin-streptomycin and 1% HEPES (Gibco, Life Technologies, 11560496). All cells were grown in 5% CO2 at 37°C in a humidified incubator.
For transient transfection and silencing, TransIT-LT1 transfection reagent (MirusBio, MIR2304) and Lipofectamine RNAiMAX (Invitrogen, Life Technologies, 13778100) were used respectively, according to the manufacturer’s instructions.
Western blot analysis and immunoprecipitation
Western blotting was performed on cells protein lysates (50 mM Tris-HCl, pH 7.5, 150 mM NaCl, 5 mM EDTA, 1% Triton X-100 (Sigma-Aldrich, T8787), 0.5 mM NaF, 1 mM sodium orthovanadate (Sigma-Aldrich, S6508), complete Protease Inhibitor Cocktail [Sigma-Aldrich, P2714]). Lysates were clarified by centrifugation for 15 min at 4°C and protein concentrations were assessed using the Bradford protein assay (Bio-Rad Laboratories, 5000001). Samples containing equal amounts of protein were boiled in SDS sample buffer, resolved using SDS-PAGE (25 μg protein per lane) and transferred to nitrocellulose membranes. The membranes were blocked with 5% non-fat dry milk at room temperature for 1 h on a rotary shaker, followed by overnight incubation at 4°C with appropriate antibodies, incubated with horseradish peroxidase-conjugated secondary antibodies, and analyzed by enhanced chemiluminescence. For immunoprecipitation, whole-cell extracts were prepared after transfection or treatment with appropriate drugs, followed by incubation overnight with the appropriate antibodies. Subsequently, protein G/A (GE Healthcare Life Sciences, 17061801) was added for 2 h at 4°C. Beads were then washed 3 times with lysis buffer, and immunoprecipitates were eluted with 2× SDS loading buffer (62.5 mM Tris-HCl, pH 6.8, 2% SDS, 10% glycerol, 5% β-mercaptoethanol, 0.05% bromophenol blue) and resolved by SDS-PAGE.
Triton-X100- soluble and -insoluble fractionation
U20S cells were lysed on ice in the above-mentioned lysis buffer. After centrifugation at 15,000 g for 15 min at 4°C, the supernatant was collected and it was considered the Triton X-100-soluble fraction. After the first extraction, the pellets were solubilized in the same volume of 2× SDS loading buffer and heated to 95°C for 5 min, or in the above-mentioned lysis buffer supplemented with 5 M urea (Sigma-Aldrich, U1250). Equal amounts of protein from soluble fractions, and the corresponding volume of insoluble fractions, were blotted as described above.
Confocal microscopy analysis
U2OS cells were plated on sterile coverslips, cultured under the conditions indicated and fixed with 3% paraformaldehyde in phosphate-buffered saline (PBS; Gibco, Life Technologies, 14190–094) buffer, for 20 min. For immunofluorescent staining of endogenous ULK1, SQSTM1 and MAP1LC3B, after fixation, the cells were permeabilized with digitonin (50 µg/µl; Sigma-Aldrich, 11024-24-1) in PBS for 10 min and blocked by incubation with 5% bovine serum albumin (Sigma-Aldrich, 9048-46-8) in PBS for 1 h at room temperature, followed by incubation with the primary antibodies for 2 h at 37°C. Cells were then incubated with the secondary antibody, for 1 h at room temperature. After washing 3 times with PBS, coverslips were embedded in Mowiol 4–88 (Carl Roth GmbH + Co. KG, 0713.1) containing 1 mg/ml Hoechst (Life Technologies, H1399). For immunofluorescent staining of endogenous MAP1LC3B, cells were fixed and permeabilized in ice-cold methanol for 5 min at −20°C. After rehydration in PBS, a standard protocol for immunofluorescence was followed [Citation26]. Images were acquired with Zeiss LSM510 confocal microscope (Oberkochen, Germany), and processed using ImageJ software, freely available on the internet.
Immunohistochemistry
Eight-tissue microarrays (TMA) have been constructed by incorporating 95 formalin-fixed paraffin embedded (FFPE) breast cancer tumors (24 luminal A, 24 luminal B, 23 ERBB2/HER2 and 24 triple negative) that were retrieved from the archives of the Department of Pathology of the University Hospital of Udine. The novo diagnosed, non-metastatic and not previously chemo-treated tumors were included in the TMA after revision, by two expert pathologists (CDL and FLM) of: tumor histotype [Citation32], Elston-Ellis grading [Citation33], tumor size (pT) [Citation34], lymph node involvement (pN) [Citation34], and molecular subtype [Citation31]. In this regard, on the basis of both the expression of ESR (estrogen receptors) (Thermofisher Scientific, RM-9101-R7), PGR (progesterone receptor) (Dako, M3569) and MKI67/ki67 (Dako, M7240), as assessed by immunohistochemistry, and of ERBB2/HER2 amplification, as evaluated by immunohistochemistry (HercepTest; Dako, K5207) and fluorescence in situ hybridization (PathVysion HER-2 DNA Probe Kit; Abbott Molecular, 02J01), breast cancers were classified as: luminal A (ESR+ and/or PGR+, ERBB2/HER2−, MKI67 < 15%), luminal B (ESR+ and/or PGR+, ERBB2/HER2−, MKI67 ≥ 15%), ERBB2/HER2 (ESR−, PGR−, ERBB2/HER2+) and triple negative (ESR−, PGR−, ERBB2/HER2−) [Citation31]. TMA were constructed by GALILEO CK4500 instrument (Integrated Systems Engineering srl, Milano, Italy. Specifically, 3 cores of 1 mm representative of the lesion were collected from each block. FFPE sections (4-μm thick) were stained by immunohistochemistry for USP1 (Bethyl Laboratories.Inc, A301-698A; 1:200) and home-made MAP1LC3B (rabbit polyclonal, 1:300), after heat induced epitope retrieval using EnVision™ FLEX Target Retrieval Solution, either low pH (Dako Omnis, GV805) for MAP1LC3B or high pH (Dako Omnis, GV804) for USP1, in PT Link (Dako, Glostrup, Denmark). Dako EnVision+ Dual Link System-HRP (DAB+) (Dako, K4065) detected primary antibodies and nuclei were counterstained with Gill Hematoxylin (Sigma Aldrich, GHS132).
For each tumor, USP1 and MAP1LC3B expression was quantified by 2 expert pathologists (CDL and FLM) adopting a semiquantitative approach (Histoscore method) [Citation43]. Specifically, for each core a score was defined, ranging from 0 to 300, obtained by multiplying the percentage of labelled cells by the staining intensity (1 = weak, 2 = moderate, or 3 = strong). For each tumor, the average value of the 3 respective cores was calculated.
Colony formation assay
U2OS cells (1x10³) and MCF10AT cells (5x10²) were seeded in 35-mm2 dishes and incubated at 37°C in a humidified, 5% CO2 atmosphere. Drug or control solvent were added 24 h after seeding and after 10 d in selective medium the plates were fixed with 4% paraformaldehyde in PBS for 20 min at room temperature and stained with 0.5% crystal violet (Sigma-Aldrich, C6158). Excess stain was removed by washing repeatedly with PBS and colonies were counted. For quantification, the colonies were analyzed using ImageJ software. Three replicate Petri dishes were used for each condition.
Cell viability assays
U2OS, MCF10A and MCF10AT cells were grown on a 96-well plate overnight and then exposed to appropriate treatments of bortezomib (50 nM) or pimozide (2.5 μM) for 24 and 48 h. After the time indicated cell viability was measured using the CellTiter-Glo reagent (Promega, G7570) according to the manufacturer’s protocol. The data from these assays show representative experiments from 3 independent replicates.
WST-1 cell proliferation assay
Ulk1+/+, ulk1−/-, Atg13+/+, and atg13−/- MEFs were grown on 96-well plates overnight and then exposed to bortezomib (50 nM) or pimozide (2.5 μM) for 24 and 48 h. Medium alone was used as a background control. After the indicated time periods, cell proliferation was measured using the colorimetric cell proliferation WST-1 reagent (Sigma-Aldrich, 11644807001). Cells were incubated with the WST-1 reagent for 4 h. Afterwards, formazan was measured with a scanning multi-well spectrophotometer ELISA reader. The measured absorbance directly correlates with the number of viable cells. Data are representative of 3 independent experiments from 3 independent replicates.
Statistical analysis
Quantification of immunofluorescence, cellular growth, viability and colony formation experiments are expressed as means ± standard deviations of at least 3 independent experiments. Indicated p values were calculated using two-tailed Student’s t test or two-way ANOVA using Graphpad Prism software. For analysis of immunohistochemistry data, Fisher’s exact test and Spearman’s Rho were applied using Graphpad Prism software.
Supplemental Material
Download Zip (1.4 MB)Acknowledgments
We thank Dr. Tooze (Crick Institute, London) for kindly providing ulk1 ko MEFs and respective controls, Dr. Ktistakis (Babraham Institute, Cambridge) and Dr. Mizushima (University of Tokyo) for kindly providing atg13 ko MEFs and respective controls. We are grateful to Veronica Candotti and Marisa Sorrentino for optimization of staining protocols, TMA construction and staining. Essential commercial reagents were kindly donated by Dr. Brancolini (University of Udine), Dr. Cecconi (Tor Vergata University, Rome), Dr. Meroni (University of Trieste). A special thank to Dr. Thomas and Dr. Massimi (I.C.G.E.B., Trieste) for access to confocal microscope.
Disclosure statement
No potential conflict of interest was reported by the authors.
Supplementary material
Supplemental data for this article can be accessed here.
Additional information
Funding
Related Research Data
References
- Chen J, Dexheimer TS, Ai Y, et al. Selective and cell-active inhibitors of the USP1/UAF1 deubiquitinase complex reverse cisplatin resistance in non-small cell lung cancer cells. Chem Biol. 2011;18(11):1390–1400.
- Williams SA, Maecker HL, French DM, et al. USP1 deubiquitinates ID proteins to preserve a mesenchymal stem cell program in osteosarcoma. Cell. 2011;146(6):918–930.
- Nijman SM, Huang TT, Dirac AM, et al. The deubiquitinating enzyme USP1 regulates the Fanconi anemia pathway. Mol Cell. 2005;17(3):331–339.
- Murai J, Yang K, Dejsuphong D, et al. The USP1/UAF1 complex promotes double strand break repair through homologous recombination. Mol Cell Biol. 2011;31(12):2462–2469.
- Raimondi M, Marcassa E, Cataldo F, et al. Calpain restrains the stem cells compartment in breast cancer. Cell Cycle. 2016;15(1):106–116.
- van Twest S, Murphy VJ, Hodson C, et al. Mechanism of ubiquitination and deubiquitination in the fanconi anemia pathway. Mol Cell. 2017;65(2):247–259.
- Kim JM, Parmar K, Huang M, et al. Inactivation of murine Usp1 results in genomic instability and a Fanconi anemia phenotype. Dev Cell. 2009;16(2):314–320.
- Liang Q, Dexheimer TS, Zhang P, et al. A selective USP1-UAF1 inhibitor links deubiquitination to DNA damage responses. Nat Chem Biol. 2014;10(4):298–304.
- Cotto-Rios XM, Jones MJ, Huang TT. Insights into phosphorylation-dependent mechanisms regulating USP1 protein stability during the cell cycle. Cell Cycle. 2011;10(23):4009–4016.
- Cataldo F, Peche LY, Klaric E, et al. CAPNS1 regulates USP1 stability and maintenance of genome integrity. Mol Cell Biol. 2013;33(12):2485–2496.
- Cohn MA, Kee Y, Haas W, et al. UAF1 is a subunit of multiple deubiquitinating enzyme complexes. J Biol Chem. 2009;284(8):5343–5351.
- Sumpter R Jr, Sirasanagandla S, Fernandez AF, et al. Fanconi anemia proteins function in mitophagy and immunity. Cell. 2016;165(4):867–881.
- Chan EY, Kir S, Tooze SA. siRNA screening of the kinome identifies ULK1 as a multidomain modulator of autophagy. J Biol Chem. 2007;282(35):25464–25474.
- Wirth M, Joachim J, Tooze SA. Autophagosome formation–the role of ULK1 and Beclin1-PI3KC3 complexes in setting the stage. Semin Cancer Biol. 2013;23(5):301–309.
- Russell RC, Tian Y, Yuan H, et al. ULK1 induces autophagy by phosphorylating Beclin-1 and activating VPS34 lipid kinase. Nat Cell Biol. 2013;15(7):741–750.
- Ohsumi Y. Historical landmarks of autophagy research. Cell Res. 2014;24(1):9–23.
- Joachim J, Jefferies HB, Razi M, et al. Activation of ULK kinase and autophagy by GABARAP trafficking from the centrosome is regulated by WAC and GM130. Mol Cell. 2015;60(6):899–913.
- Nazio F, Strappazzon F, Antonioli M, et al. mTOR inhibits autophagy by controlling ULK1 ubiquitylation, self-association and function through AMBRA1 and TRAF6. Nat Cell Biol. 2013;15(4):406–416.
- Liu CC, Lin YC, Chen YH, et al. Cul3-KLHL20 ubiquitin ligase governs the turnover of ULK1 and VPS34 complexes to control autophagy termination. Mol Cell. 2016;61(1):84–97.
- Driessen S, Berleth N, Friesen O, et al. Deubiquitinase inhibition by WP1130 leads to ULK1 aggregation and blockade of autophagy. Autophagy. 2015;11(9):1458–1470.
- Demarchi F, Bertoli C, Copetti T, et al. Calpain is required for macroautophagy in mammalian cells. J Cell Biol. 2006;175(4):595–605.
- Demarchi F, Bertoli C, Copetti T, et al. Calpain as a novel regulator of autophagosome formation. Autophagy. 2007;3(3):235–237.
- Marcassa E, Raimondi M, Anwar T, et al. Calpain mobilizes Atg9/Bif-1 vesicles from Golgi stacks upon autophagy induction by thapsigargin. Biol Open. 2017;6(5):551–562.
- Sanjuan MA, Dillon CP, Tait SW, et al. Toll-like receptor signalling in macrophages links the autophagy pathway to phagocytosis. Nature. 2007;450(7173):1253–1257.
- Martinez J, Malireddi RK, Lu Q, et al. Molecular characterization of LC3-associated phagocytosis reveals distinct roles for Rubicon, NOX2 and autophagy proteins. Nat Cell Biol. 2015;17(7):893–906.
- Jacquin E, Leclerc-Mercier S, Judon C, et al. Pharmacological modulators of autophagy activate a parallel noncanonical pathway driving unconventional LC3 lipidation. Autophagy. 2017;13(5):854–867.
- Egan DF, Shackelford DB, Mihaylova MM, et al. Phosphorylation of ULK1 (hATG1) by AMP-activated protein kinase connects energy sensing to mitophagy. Science. 2011;331(6016):456–461.
- Tanida I, Sou YS, Ezaki J, et al. HsAtg4B/HsApg4B/autophagin-1 cleaves the carboxyl termini of three human Atg8 homologues and delipidates microtubule-associated protein light chain 3- and GABAA receptor-associated protein-phospholipid conjugates. J Biol Chem. 2004;279(35):36268–36276.
- Garcia-Santisteban I, Peters GJ, Giovannetti E, et al. USP1 deubiquitinase: cellular functions, regulatory mechanisms and emerging potential as target in cancer therapy. Mol Cancer. 2013;12(1):91–97.
- Lefort S, Joffre C, Kieffer Y, et al. Inhibition of autophagy as a new means of improving chemotherapy efficiency in high-LC3B triple-negative breast cancers. Autophagy. 2014;10(12):2122–2142.
- Schnitt SJ. Classification and prognosis of invasive breast cancer: from morphology to molecular taxonomy. Mod Pathol. 2010;23(Suppl 2):S60–4.
- Lakhani, SR, Ellis IO, Schnitt, SJ, et al. WHO classification of tumours of the breast. International Agency for Research on Cancer; 2012.
- Elston CW, Ellis IO. Pathological prognostic factors in breast cancer. The value of histological grade in breast cancer: experience from a large study with long-term follow-up. Histopathology. 2002;41(3A):154–161.
- Edge S, Byrd DR, Compton CC, et al. AJCC cancer staging handbook: from the AJCC cancer staging manual. New York (NY): Springer; 2010.
- Ladoire S, Penault-Llorca F, Senovilla L, et al. Combined evaluation of LC3B puncta and HMGB1 expression predicts residual risk of relapse after adjuvant chemotherapy in breast cancer. Autophagy. 2015;11(10):1878–1890.
- Strobl JS, Kirkwood KL, Lantz TK, et al. Inhibition of human breast cancer cell proliferation in tissue culture by the neuroleptic agents pimozide and thioridazine. Cancer Res. 1990;50(17):5399–5405.
- Nazio F, Cecconi F. mTOR, AMBRA1, and autophagy: an intricate relationship. Cell Cycle. 2013;12(16):2524–2525.
- Florey O, Overholtzer M. Autophagy proteins in macroendocytic engulfment. Trends Cell Biol. 2012;22(7):374–380.
- Klionsky DJ, Abdelmohsen K, Abe A, et al. Guidelines for the use and interpretation of assays for monitoring autophagy (3rd edition). Autophagy. 2016;12(1):1–222.
- Gong C, Bauvy C, Tonelli G, et al. Beclin 1 and autophagy are required for the tumorigenicity of breast cancer stem-like/progenitor cells. Oncogene. 2013;32(18):2261–2272.
- Jiang P, Mizushima N. Autophagy and human diseases. Cell Res. 2014;24(1):69–79.
- Levy JMM, Towers CG, Thorburn A. Targeting autophagy in cancer. Nat Rev Cancer. 2017;17(9):528–542.
- Tovey S, Dunne B, Witton CJ, et al. Can molecular markers predict when to implement treatment with aromatase inhibitors in invasive breast cancer? Clin Cancer Res. 2005;11(13):4835–4842.