
ABSTRACT
EBV has been reported to impair monocyte in vitro differentiation into dendritic cells (DCs) and reduce cell survival. In this study, we added another layer of knowledge to this topic and showed that these effects correlated with macroautophagy/autophagy, ROS and mitochondrial biogenesis reduction. Of note, autophagy and ROS, although strongly interconnected, have been separately reported to be induced by CSF2/GM-CSF (colony stimulating factor 2) and required for CSF2-IL4-driven monocyte in vitro differentiation into DCs. We show that EBV infects monocytes and initiates a feedback loop in which, by inhibiting autophagy, reduces ROS and through ROS reduction negatively influences autophagy. Mechanistically, autophagy reduction correlated with the downregulation of RAB7 and ATG5 expression and STAT3 activation, leading to the accumulation of SQSTM1/p62. The latter activated the SQSTM1-KEAP1- NFE2L2 axis and upregulated the anti-oxidant response, reducing ROS and further inhibiting autophagy. ROS decrease correlated also with the reduction of mitochondria, the main source of intracellular ROS, achieved by the downregulation of NRF1 and TFAM, mitochondrial biogenesis transcription factors. Interestingly, mitochondria supply membranes and ATP required for autophagy execution, thus their reduction may further reduce autophagy in EBV-infected monocytes. In conclusion, this study shows for the first time that the interconnected reduction of autophagy, intracellular ROS and mitochondria mediated by EBV switches monocyte differentiation into apoptosis, giving new insights into the mechanisms through which this virus reduces immune surveillance.
Abbreviations: ACTB: actin beta; ATG5: autophagy related 5; BAF: bafilomycin A1; BECN1: beclin 1; CAT: catalase; CSF2: colony stimulating factor 2; CT: control; CYCS (cytochrome C: somatic); DCs: dendritic cells; EBV: Epstein-Barr virus; GSR: glutathione-disulfide reductase; KEAP1: kelch like ECH associated protein 1; IL4: interleukin 4; MAP1LC3/LC3: microtubule associated protein 1 light chain 3; MET: metformin; NAC: N-acetylcysteine; NFE2L2/NRF2 nuclear factor: erythroid 2 like 2; NRF1 (nuclear respiratory factor 1); clPARP1: cleaved poly(ADP-ribose) polymerase; Rapa: Rapamycin; ROS: reactive oxygen species; SQSTM1/p62: sequestosome 1; TFAM: (transcription factor A: mitochondrial); TUBA1A: tubulin alpha 1a.
Introduction
Epstein Barr virus (EBV), the first discovered human oncovirus, is strongly associated to endemic form of Burkitt lymphoma (BL) and to several other human cancers such as nasopharyngeal carcinoma (NPC) and Hodgkin lymphoma [Citation1–Citation3]. It belongs to gammaherpesvirus family, together with Kaposi sarcoma-associated herpesvirus (KSHV), that is also linked to the pathogenesis of several human malignancies [Citation3,Citation4]. Besides having protumorigenic effects, both viruses interfere with the immune system cell function [Citation5,Citation6] and in particular of dendritic cells (DCs) [Citation7–Citation12].
DCs are the most powerful antigen presenting cells, whose function is essential to initiate and regulate immune response. Given their importance, it is not surprising that viruses, especially those that persist in the infected host, have adopted a variety of strategies to dysregulate their differentiation and function [Citation9,Citation10,Citation13,Citation14].
It has been reported that autophagy, induced by CSF2/GM-CSF (colony stimulating factor 2), is essential for proper monocyte in vitro differentiation into DCs [Citation15]. Consistent with these results, we have recently shown that KSHV, as well as other completely unrelated oncoviruses such as hepatitis C virus (HCV), reduced autophagy to impair DC formation [Citation12,Citation16,Citation17], although through different strategies.
Autophagy and proteasomal degradation are the main cellular catabolic routes, both essential for the maintenance of tissue homeostasis. Autophagy is articulated in several steps that go from autophagosome formation and elongation to their degradation into the lysosomes. It is involved in a variety of cellular functions including cell death, survival and differentiation, depending on the cell types and on the extent to which the process is activated [Citation18–Citation20]. Autophagy upregulation may help cells to cope with increased demands induced by stressful conditions by degrading and eventually recycling misfolded and long-lived proteins and damaged organelles [Citation21].
The autophagic process is regulated by several cellular pathways, such as STAT3 (signal transducer and activator of transcription 3) and MTOR (mechanistic target of rapamycin kinase), which control also several other fundamental cellular functions [Citation22]. Interestingly, STAT3 pathway has been reported to be activated by EBV [Citation23] and its activation may induce DC immune dysfunction [Citation24].
Autophagy contributes to immune system cell function, particularly of antigen presenting cells because, besides being involved in monocyte differentiation, it plays an important role in the direct elimination of pathogens (xenophagy) and in antigen presentation [Citation16,Citation25]. One of the stimuli that upregulates autophagy is the increase of intracellular reactive oxygen species (ROS) [Citation26,Citation27]. Conversely, the inhibition of autophagy, leading to the accumulation of SQSTM1, may activate the SQSTM1- KEAP1 (kelch like ECH associated protein 1)-NFE2L2/NRF2 (nuclear factor, erythroid 2 like 2) axis, upregulating the anti-oxidant response that decreases ROS [Citation28,Citation29]. As reported for autophagy, ROS production is induced by CSF2 and is required for proper monocyte in vitro differentiation into DCs [Citation30]. ROS are mainly produced by mitochondria [Citation31], and mitochondria reduction may lead to ROS and ATP decrease, further impairing autophagy that requires ATP for its execution [Citation32] and mitochondrial membranes for autophagosome formation [Citation33]. Interestingly, concomitantly with autophagy induction, the mitochondrial pool has been reported to expand in monocytes undergoing CSF2 and IL4 (interleukin 4)-driven differentiation, suggesting a role of these organelles in DC formation [Citation34].
EBV impairs monocyte survival and reduces their in vitro differentiation into DCs [Citation7,Citation8], although the underlying mechanisms have not been fully elucidated yet. In this study, we confirmed that infectious as well as UV-inactivated EBV impaired monocyte differentiation into DCs, as previously reported [Citation35] and then showed that the reduction of autophagy, intracellular ROS and mitochondrial biogenesis were involved in this virus-induced immune suppressive effect.
Results
EBV establishes a lytic infection in differentiating monocytes and reduces cell survival
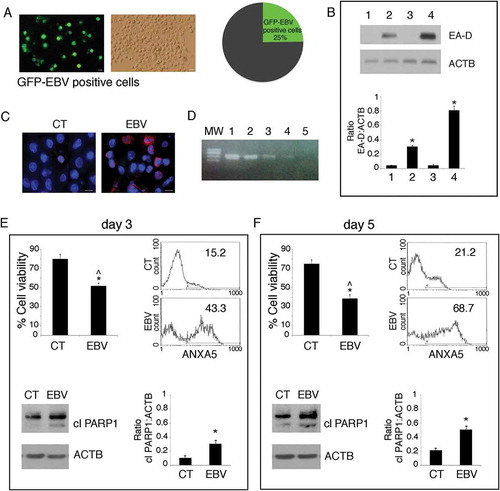
Primary monocytes were infected with recombinant EBV viral particles purified from 293/EBV-WT cells [Citation36] or mock-infected and cultured for 5 days in the differentiation cocktail containing CSF2 and IL4. The percentage of infected cells, assessed by optical microscopy by the appearance of GFP-positive cells, was evaluated to be about 25% ()). Then, to investigate the type of EBV infection, western blot analysis was performed. We found that the EBV-infected monocytes expressed early antigen-diffused (EA-D), an EBV antigen expressed during a lytic infection ()). Then, the finding that about 20% of monocytes expressed the late lytic antigen gp350/220, as assessed by immunofluorescence assay (IFA) ()) suggested that EBV was able to establish a complete replicative cycle in these cells. This evidence was further supported by capacity of the supernatant of EBV-infected monocytes to infect monocytes, as demonstrated by PCR ()). We next evaluated whether the EBV-infection could affect monocyte survival. We found that, the number of EBV-infected monocytes was reduced to about 50% or 30%, respectively after 3 and 5 days in culture in the differentiation cocktail containing CSF2 and IL4, in comparison to the mock-infected cells (). In addition, the results obtained by ANXA5 (annexin A5) staining and western blot analysis showing an increase of PARP 1(poly[ADP-ribose] polymerase) cleavage, indicated that the reduction of monocyte survival correlated with a time-dependent apoptotic cell death induced by EBV ().
Figure 1. EBV infects differentiating monocytes and impairs cell survival. Primary monocytes (CD14+) were infected with recombinant EBV particles purified from 293/EBV-WT cells or mock-infected. After 5 days of EBV infection, (a) cells were analysed by using a fluorescence microscopy showing that about 25% of the cells were infected (GFP-positive), Bars: 10 mm. EBV-infected differentiating monocytes and mock control cells were then analysed for EBV protein expression (b) by western blot for the early lytic EA-D expression, where also B95.8 and BJAB were included as positive and negative controls (lane 1 mock monocytes, lane 2 EBV-infected monocytes, lane 3 BJAB and lane 4 B95.8) and (c) by IFA for EBV gp350/220 late lytic antigen. DAPI staining is shown in blue and gp350/220 late lytic antigen in red, Bars: 10 mm; (d) the supernatant of EBV-infected monocytes was able to infect monocytes, as indicated by DNA-PCR analysis. Lane 1 and 2 B95.8 positive controls, lane 3 and 4 monocytes infected with supernatant at day 5 and 3 respectively, lane 5 negative control. (e and f) After 3 and 5 days of culture, cell survival was evaluated by trypan blue exclusion assay in EBV and mock-infected differentiating monocytes. The histograms represent the mean plus S.D. of more than 3 experiments * P value < 0.05 ^ alpha value < 0.05; ANXA5 staining in the gate of Propidium Iodide (PI)-negative cells and PARP cleavage were also evaluated in these cells. ACTB was used as loading control. One representative experiment out of 3 is shown. The histograms represent the mean plus S.D. of the densitometric analysis of the ratio of EA-D:ACTB and cleaved PARP:ACTB of 3 different experiments. * P value < 0.05.
EBV impairs monocyte differentiation into dcs
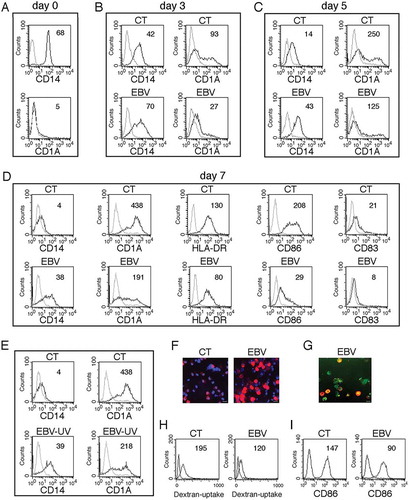
The impact of EBV infection on the differentiation process of monocytes into DCs was then investigated by FACS analysis. We found that CD14, expressed in monocytes at beginning of the differentiation process ()), decreased in mock-infected cells while it was slightly affected by EBV infection after 3 days of in vitro culture ()). Again, after 5 ()) and 7 days ()) of differentiation, CD14 was more expressed in EBV-infected cells in comparison to the mock-infected cells. According to the higher CD14 expression, FACS analysis also indicated that CD1A/CD1a (DC marker), not expressed by monocytes at beginning of culture ()) was progressively acquired during their in vitro differentiation and that such process was counteracted by EBV infection, in a time-dependent fashion ( and ). DC activation markers such as HLA-DR and CD86, as well as the CD83 differentiation marker were also reduced by EBV infection ()). Moreover, IFA experiments confirmed that CD14, lost in the majority of mock-infected cells in the presence of CSF2 and IL4, was retained in monocytes exposed to EBV ()) and that the cells expressing CD14 were also GFP-positive, as they were EBV-infected ()). Interestingly, we found that UV-inactivated virus was also able to reduce monocyte differentiation (), in agreement with previous findings [Citation8]. The impairment of DC formation correlated with a reduction of their phagocytic function, as EBV-infected cells displayed a reduced capacity to capture Dextran-FITC (Dext-FITC) upon incubation at 37°C for 30 min ()). Moreover, they displayed a reduced activation upon LPS-exposure as demonstrated by the lower expression of the activation marker CD86 ()). All together these findings suggest that EBV induced a phenotypic and functional impairment of monocyte differentiation into DCs.
Table 1. Kinetics of EBV-infected and control monocyte differentiation into DCs.
Figure 2. EBV reduces DC formation. (a) FACS profiles of CD14 and CD1A expression in purified monocytes before initiating the differentiating process; (b, c and d) time-dependent FACS analysis of CD14 and CD1A surface expression on differentiating monocytes exposed or unexposed to EBV, after 3, 5 and 7 days of culture in the presence of the differentiation cocktail; in (d) also HLA-DR, CD86 and CD83 expression is indicated; (e) CD14 and CD1A expression in monocytes exposed to UV-inactivated EBV after 7 days of culture. (f) CD14 expression on differentiating monocytes exposed or unexposed to EBV, following 5 days of culture in the presence of CSF2 and IL4, as evaluated by IFA. DAPI staining is shown in blue and CD14 in red; bars: 10 µm; (g) IFA showing CD14 expression in GFP-EBV-positive monocytes. CD14 is red stained. Bars: 10 mm; (h) FACS analysis of FITC-dextran uptake by differentiating monocytes exposed or unexposed to EBV; (i) FACS analysis of CD86 surface expression on differentiating monocytes exposed or unexposed to EBV, stimulated with LPS for 24 h. The mean of fluorescence intensity is reported. Solid grey peaks represent the isotype controls. One representative experiment out of 3 is shown.
EBV reduces autophagy in differentiating monocytes
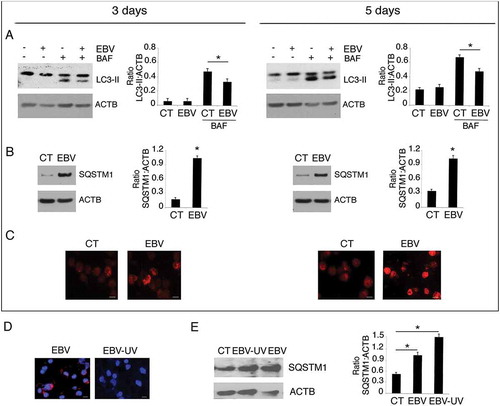
Autophagy, induced by CSF2 has been reported to be essential for monocyte differentiation into DCs [Citation15]. Since EBV interferes with the autophagic process in other cell types [Citation37] and autophagy inhibition by other oncoviruses results in an impairment of the differentiation process in infected monocytes [Citation12,Citation17], we investigated whether the reduction of DC formation mediated by EBV could correlate with autophagy inhibition. As shown in ), the expression level of the autophagic marker MAP1LC3-II/LC3-II (microtubule associated protein 1 light chain 3)-II was reduced in the presence of bafilomycin A1 (BAF) [Citation38] in a time-dependent fashion in EBV-infected monocytes compared to the mock control cells, indicating that the autophagic flux was reduced by EBV-infection. This result was confirmed by the finding that SQSTM1, molecule mainly degraded through autophagy, accumulated in a time-dependent fashion in EBV-infected monocytes, as indicated by western blot analysis ()) and confirmed by IFA ()). In agreement with the impairment of DC differentiation, UV-inactivated virus ()) also reduced autophagy in differentiating monocytes ()).
Figure 3. Autophagy reduction by EBV interferes with monocyte differentiation. Monocytes infected with EBV were cultured for 3 and 5 days with CSF2 and IL4 and analysed by western blot (a) for LC3-II expression in the presence or absence of bafylomicin A1 (BAF) (added for the last 2 h at 20 nM) and (b) for SQSTM1 expression by western blot and (c) by IFA in EBV- and mock-infected control cells. SQSTM1 staining is shown in red; bars: 10 µm; ACTB was used as loading control. One representative experiment out of 3 is shown. The histograms represent the mean plus S.D. of the densitometric analysis of the ratio of LC3-II:ACTB, SQSTM1:ACTB, of 3 different experiments. * P value < 0.05. (d) IFA for EBV gp350/220 late lytic antigen in EBV and EBV-UV-infected cells. DAPI staining is shown in blue and gp350/220 late lytic antigen in red, Bars: 10 mm; and (e) SQSTM1 expression by western blot in EBV- and EBV-UV-infected cells. ACTB was used as loading control. The histograms represent the mean plus S.D. of the densitometric analysis of the ratio of SQSTM1:ACTB, of 3 different experiments. * P value < 0.05.
RAB7 and ATG5 downregulation and STAT3 activation correlate with EBV-mediated autophagy reduction in differentiating monocytes
Searching for the underlying mechanisms leading to autophagy reduction by EBV, we found that RAB7 (RAB7, member RAS oncogene family), a molecule essential for autophagosome-lysosome fusion, occurring in the last phases of autophagy [Citation21], was reduced by EBV infection ()). We have previously shown that, during gamma-herpesvirus replication, RAB7 is downregulated and results in an autophagic block in virus producing cells [Citation37,Citation39]. Interestingly, as above shown in , a lytic infection was established by EBV in differentiating monocytes. We then investigated the expression of ATG5 and BECN1, 2 proteins essential for the autophagic process. We found that, as in the case of Kaposi sarcoma associated herpesvirus (KSHV)-infection of monocytes [Citation12], ATG5 was downregulated by EBV, while BECN1 expression was slightly affected ()). Several cellular pathways, dysregulated by oncogenic viruses, can affect autophagy [Citation40]. Among those, STAT3 has been reported to be activated by EBV infection, to induce immune suppression [Citation41,Citation42] and to negatively regulate autophagy [Citation11,Citation43]. Therefore, we investigated whether STAT3 could be activated in EBV-infected monocytes and found that it was hyperphosphorylated on Tyr 705 and Ser 727 residues in comparison to the mock-infected cells ()). Besides EBV infection, this pathway is activated by cytokines such as IL6, whose release can be increased by EBV infection. Therefore, we evaluated IL6 release and, as shown in ), we found that EBV-infected monocytes produced a higher amount of IL6 in comparison to the mock infected cells. Interestingly IL6, by acting in paracrine fashion, could induce STAT3 activation and reduce autophagy also in bystander uninfected monocytes. Finally, we investigated the role of STAT3 activation in the inhibition of DC formation by silencing this molecule with a specific siRNA. We found that STAT3-silencing rescued autophagy, as it reduced SQSTM1 expression ()) and partially prevented the EBV-mediated inhibitory effect on monocyte differentiation ()). These results highlight the importance of STAT3 activation in the inhibition of autophagy and monocyte differentiation in EBV-infected cells.
Figure 4. The decrease of RAB7 and ATG5 and the activation of STAT3 correlate with EBV-mediated autophagy inhibition in differentiating monocytes. Differentiating monocytes exposed or unexposed to EBV were cultured for 5 days with CSF2 and IL4 and analyzed by western blot for (a) RAB7 and (b) ATG5 and BECN1 expression and (c) pSTAT3 (Tyr705), pSTAT3 (Ser727) and total STAT3 expression. ACTB was used as loading control. One representative experiment out of 3 is shown. The histograms represent the mean plus S.D. of the densitometric analysis of the ratio of RAB7:ACTB, ATG5:ACTB, BECN1:ACTB, p-STAT3 (Tyr705): STAT3, p-STAT3 (Ser727):STAT3 and total STAT3:ACTB of 3 different experiments. * P value < 0.05. (d) IL6 release, by EBV- and mock-infected monocytes as measured by ELISA. The histograms represent the mean plus S.D. of more than 3 experiments * P value < 0.05 ^ alpha value < 0.05.
Figure 5. STAT3 silencing partially prevents EBV-mediated inhibition of DC formation. Monocytes silenced for STAT3 with specific siRNA or scrambled siRNA-treated (SCR) were exposed to EBV and cultured in the presence of the differentiation cocktail for 3 days. (a) Western blot analysis of STAT3 and SQSTM1 expression and (b) FACS profiles of CD14 and CD1A expression in EBV-infected, scrambled siRNA-treated or STAT3-silenced cells. The mean of fluorescence intensity is indicated. Solid grey peaks represent the isotype controls. One representative experiment out of 3 is shown. For western blots ACTB was used as loading control. One representative experiment out of 3 is shown. The histograms represent the mean plus S.D. of the densitometric analysis of the ratio of STAT3:ACTB and of SQSTM1:ACTB of 3 different experiments. * P value < 0.05.
Reduction of intracellular ROS contributes to the inhibition of autophagy and to the impairment of monocyte differentiation mediated by EBV
Intracellular ROS production is induced by CSF2 and, as reported for autophagy, ROS are required for proper in vitro differentiation of monocytes into DCs [Citation30]. ROS and autophagy are strictly inter-connected [Citation44,Citation45], thus we next investigated whether EBV could also affect ROS production to further reduce autophagy and impair DC differentiation. As shown in ), intracellular ROS were reduced in EBV-infected monocytes, as evaluated after 3 and 5 days of in vitro culture in the presence of the CSF2 and IL4 differentiation cocktail. The finding that the ROS scavenger N-acetylcysteine (NAC) reduced monocyte differentiation ()), concomitantly with ROS reduction ()), confirmed the importance of ROS in DC formation. Next, to explore whether NAC could also inhibit autophagy in differentiating monocytes, we evaluated the autophagic flux induced by CSF2 and IL4 in the presence or in the absence of this ROS scavenger. As shown in ), SQSTM1 expression increased in the presence of NAC, suggesting that it reduced autophagy. Differently from SQSTM1, BECN1 expression was slightly affected by NAC. Interestingly, it increased pSTAT3 phosphorylation ()), suggesting that it could reduce autophagy through this effect. Finally, to reduce ROS ()), we used metformin (MET), a mitochondrial complex I inhibitor [Citation46] and found that it, similar to NAC, impaired monocyte differentiation ()). Conversely, the addition of H2O2 to EBV-infected monocytes partially rescued DC differentiation ()), further highlighting the importance of ROS in promoting this process.
Figure 6. EBV infection reduces the production intracellular of ROS that promotes monocyte differentiation and autophagy. (a) FACS analysis of ROS production by differentiating monocytes exposed or unexposed to EBV and cultured with CSF2 and IL4 for 3 and 5 days, measured by DCFDA staining. The mean of fluorescence intensity is indicated. Solid grey peaks represent the isotype controls. One representative experiment out of 3 is shown; (b) FACS analysis for CD14 and CD1A expression of differentiating monocytes cultured for 5 days with CSF2 and IL4 in the presence or absence of the ROS scavenger NAC. The mean of fluorescence intensity is indicated. Solid grey peaks represent the isotype controls. One representative experiment out of 3 is shown; (c) FACS analysis of ROS production by differentiating monocytes in the presence or absence of NAC, measured by DCFDA staining. The mean of fluorescence intensity is indicated. Solid grey peaks represent the isotype controls. One representative experiment out of 3 is shown; (d) western blot analysis of SQSTM1, BECN1, pSTAT3 (Tyr705) and total STAT3 expression of differentiating monocytes cultured with CSF2 and IL4 in the presence or absence of NAC. TUBA1A was used as loading control. One representative experiment out of 3 is shown. The histograms represent the mean plus S.D. of the densitometric analysis of the ratio of SQSTM1:TUBA1A, BECN1:TUBA1A, p-STAT3 (Tyr705):STAT3 and STAT3: TUBA1A of 3 different experiments. * P value < 0.05.
Figure 7. ROS reduction by metformin prevents monocyte differentiation, while H2O2 rescues it in EBV-infected cells. (a) FACS analysis of ROS production by differentiating monocytes exposed or unexposed to metformin (MET) and cultured with CSF2 and IL4 for 5 days, as measured by DCFDA staining. (b) FACS analysis for CD14 and CD1A expression of differentiating monocytes cultured for 5 days with CSF2 and IL4 in the presence or absence of metformin (MET) (10 mM). (c) FACS analysis for CD14 and CD1A expression of EBV-infected monocytes cultured for 5 days with CSF2 and IL4 in the presence or absence of H2O2 (200 mM). Solid grey peaks represent the isotype controls. The mean of fluorescence intensity is indicated and one representative experiment out of 3 is shown.
Autophagy inhibition activates the SQSTM1-KEAP1-NFE2L2 axis to reduce ROS in EBV-infected monocytes
Autophagy inhibition leads to the accumulation of SQSTM1 that may activate the SQSTM1-KEAP1-NFE2L2 axis upregulating the transcription of antioxidant enzymes [Citation47,Citation48]. Therefore, we asked whether autophagy reduction and SQSTM1 accumulation induced by EBV, could activate this axis to reduce ROS in differentiating monocytes. As shown in ), the expression level of KEAP1, a negative regulator of NFE2L2, was reduced, likely due to its destabilization induced by SQSTM1 accumulation [Citation49,Citation50]. Conversely, NFE2L2 expression increased in EBV-infected monocytes in comparison with the mock-infected control cells and more importantly, it resulted activated in virus-infected cells, displaying a nuclear localization ()). NFE2L2 activation was accompanied by an increased expression of antioxidant enzymes such as CAT and GSR ()) that could lead to the ROS reduction observed in EBV-infected monocytes ()). SQSTM1 siRNA partially reversed NFE2L2 nuclear localization ()) as well as CAT and GSR upregulation mediated by EBV ()), highlighting the role of SQSTM1 in activating the antioxidant response in virus-infected monocytes. All together, these results indicate that autophagy inhibition was involved in ROS reduction through the accumulation of SQSTM1 and the activation of the SQSTM1-KEAP1-NFE2L2 axis that upregulated the anti-oxidant response.
Figure 8. SQSTM1 accumulation activates the SQSTM1-KEAP1-NFE2L2 axis that reduces ROS production in EBV-infected monocytes. Differentiating monocytes exposed or unexposed to EBV and cultured for 5 days with CSF2 and IL4 were analyzed for (a) KEAP1 and NFE2L2 expression by western blot, (b) NFE2L2 localization by IFA and (c) CAT and GSR expression by western blot. ACTB was used as loading control. One representative experiment out of 3 is shown. The histograms represent the mean plus S.D. of the densitometric analysis of the ratio of KEAP1:ACTB, NFE2L2:ACTB, CAT:ACTB, GSR:ACTB of 3 different experiments. SQSTM1 staining is shown in red; bars: 10 mm. Differentiating monocytes exposed to EBV were silenced for siSQSTM1 with specific siRNA or scrambled siRNA and cultured for 5 days with CSF2 and IL4 before analysing (d) NFE2L2 localization by IFA and (e) SQSTM1, CAT and GSR expression by western blot. NFE2L2 staining is shown in red; bars: 10 mm. ACTB was used as loading control. One representative experiment out of 3 is shown. The histograms represent the mean plus S.D. of the densitometric analysis of the ratio of SQSTM1:ACTB, CAT:ACTB, GSR:ACTB of 3 different experiments. * P value < 0.05.
Autophagy inhibition reduces monocyte differentiation while autophagy induction promotes the differentiation process
To demonstrate that autophagy reduction could be responsible for the impairment of monocyte differentiation in this setting, we performed silencing with ATG5 siRNA before culturing monocytes in the presence of CSF2 and IL4. We found that ATG5 silencing led to SQSTM1 accumulation ()), to the increase of GSR expression ()) and ROS decrease ()) in comparison with the scrambled RNA-treated control cells. Moreover, ATG5 silencing resulted in increased STAT3 phosphorylation ()), suggesting a correlation between these effects, both induced by EBV. Accordingly, the percentage of CD1A-positive cells decreased and CD14 increased in ATG5-silenced cells ()), confirming the important role of autophagy in CSF2- and IL4-driven differentiation of monocytes, as previously reported. We then knocked-down ATG5 in EBV-infected monocytes and found that it synergized with the virus, in reducing DC formation ()) and inducing SQSTM1 accumulation ()). To confirm the role of autophagy inhibition in the EBV-mediated impairment of DC differentiation, we used rapamycin to rescue autophagy. As shown in ), rapamycin reduced SQSTM1 expression and counteracted the EBV-mediated inhibitory effect on the differentiating process ()).
Figure 9. Autophagy manipulation affects DC differentiation. Differentiating monocytes were silenced for ATG5 with specific siRNA or scrambled siRNA-treated, cultured for 5 days with CSF2 and IL4 and analyzed by western blot analysis for (a) ATG5, SQSTM1, GSR, pSTAT3 (Tyr705) and total STAT3 expression (b) by FACS analysis for ROS production by DCFDA staining and (c) CD14 and CD1A expression. The mean of fluorescence intensity is indicated. Solid grey peaks represent the isotype controls. One representative experiment out of 3 is shown; TUBA1A was used as loading control. One representative experiment out of 3 is shown. The histograms represent the mean plus S.D. of the densitometric analysis of the ratio of ATG5:TUBA1A, SQSTM1:TUBA1A, p-STAT3 (Tyr705):STAT3, STAT3:TUBA1A, GSR:TUBA1A of 3 different experiments.* P value < 0.05; (d) EBV-infected differentiating monocytes silenced for ATG5 or scrambled siRNA-treated and cultured for 5 days with CSF2 and IL4 were analyzed CD14 and CD1A expression by FACS analysis and (e) for ATG5 and SQSTM1 expression by western blot; EBV-infected monocytes were differentiated for 5 days in the presence or in the absence of Rapamycin (Rapa) (50 nM) and analysed (f) for SQSTM1 expression by western blot and (g) for CD14 and CD1A expression by FACS analysis. The mean of fluorescence intensity is indicated. Solid grey peaks represent the isotype controls. ACTB was used as loading control. One representative experiment out of 3 is shown. The histograms represent the mean plus S.D. of the densitometric analysis of the ratio of ATG5:ACTB and SQSTM1:ACTB, of 3 different experiments. * P value < 0.05.
EBV reduces mitochondrial biogenesis in monocytes, contributing to the reduction of autophagy and DC differentiation
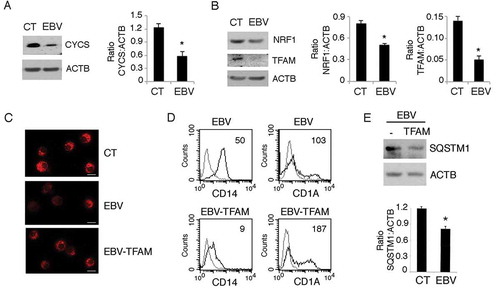
Most of intracellular ROS are produced by mitochondria mainly through the mitochondrial complex I and III [Citation51]. It has also been reported that active mitochondrial biogenesis occurs during monocyte in vitro differentiation into DCs [Citation34] and that EBV lytic infection may reduce mitochondrial DNA [Citation52]. Interestingly, mitochondria supply energy [Citation53] and membranes essential for the autophagic process [Citation33], thus we hypothesize that the ROS and autophagy reduction mediated by EBV could correlate with a reduction of mitochondrial pool in differentiating monocytes. By western blot analysis, we found a strong reduction of the mitochondrial protein CYCS (cytochrome C, somatic) expression in EBV-infected cells () that correlated with the downregulation of NRF1 (nuclear respiratory factor 1) and TFAM (transcription factor A, mitochondrial) (). These are transcription factors that play a pivotal role in mitochondrial biogenesis during monocyte differentiation [Citation34]. Then by using the specific mitochondrial dye MitoTracker Red, we found that mitochondria were reduced in EBV-infected monocytes in comparison to the mock-infected control cells ()) and that this effect could be partially reverted by overexpressing TFAM in these cells ()). According to the mitochondria increase, TFAM overexpression partially rescued monocyte differentiation ()) and autophagy ()) impaired by EBV. All together, these results suggest that the EBV may reduce the mitochondrial pool by counteracting the active mitochondrial biogenesis that promotes autophagy and monocytes differentiation.
Figure 10. EBV reduces mitochondrial biogenesis in differentiating monocytes. Differentiating monocytes exposed or unexposed to EBV and cultured for 5 days with CSF2 and IL4 were analyzed for (a) CYCS and (b) for NRF1 and TFAM expression by western blot. ACTB was used as a loading control. One representative experiment out of 3 is shown. The histograms represent the mean plus S.D. of the densitometric analysis of the ratio of CYCS:ACTB, NRF1:ACTB and TFAM:ACTB of 3 different experiments. * P value < 0.05. (c) The mitochondrial pool was evaluated by using MitoTracker Red dye in control and EBV-infected monocytes with or without TFAM overexpression; bars: 10 mm; (d) CD14 and CD1A expression was evaluated by FACS analysis and (e) SQSTM1 expression in EBV-infected monocytes with or without TFAM overexpression, was analysed by western blot. The mean of fluorescence intensity is indicated. Solid grey peaks represent the isotype controls. The histograms represent the mean plus S.D. of the densitometric analysis of the ratio of SQSTM1:ACTB of 3 different experiments. * P value < 0.05.
Discussion
In previous and separate studies, it has been reported that monocyte in vitro differentiation into DCs requires intracellular ROS production [Citation30] and autophagy [Citation15], both induced by CSF2 in combination with IL4. Although ROS production and autophagy are strictly interconnected [Citation47,Citation54], the interplay between them during monocyte differentiation has not been previously explored. This study shows that the inhibition of autophagy, i.e. by ATG5 siRNA, decreased ROS, that the decrease in ROS reduced autophagy, and that both ROS and autophagy were required for DC formation. We found, for the first time, that EBV was able to concomitantly reduce autophagy and ROS and that these effects sustained each other leading to the inhibition of monocyte differentiation into DCs.
The reduction of ATG5 as a mechanism to reduce autophagy in monocytes seems to be a common mechanism among gammaherpesviruses, as we have previously shown that also KSHV exploits this strategy in these cells [Citation12]. As a consequence of autophagy reduction, SQSTM1 accumulated and the SQSTM1-KEAP1-NFE2L2 axis, was activated, leading to the upregulation of the antioxidant response that decreased ROS and further inhibited autophagy. NFE2L2 has been reported to be dysregulated by KSHV in de novo infected human dermal microvascular endothelial cells (HMVEC-d) [Citation55], in endothelial cells [Citation50] or in naturally infected lymphoma cells [Citation56] In all these cases, NFE2L2 activation promoted viral infection and cell survival. In this study we found that NFE2L2 activation by EBV, as a consequence of autophagy reduction, contributed to the impairment of monocyte differentiation by reducing ROS. Thus, targeting NFE2L2 could represent a promising strategy to both reduce gammaherpesvirus-harboring cancer cell survival and counteract virus-mediated inhibition of DC formation.
NFE2L2 activation may represent an additional consequence of autophagy inhibition that also leads to the reduction of the viral clearance and viral antigen presentation, for which autophagy is required [Citation16]. Therefore, by interfering with the autophagic process, viruses may inhibit multiple aspects of the anti-viral immune response. As another important finding, this study indicates that EBV reduced mitochondria in differentiating monocytes. Besides being involved in the direct intracellular microbial killing [Citation57], mitochondria represent the main source of intracellular ROS and play an important role in autophagy execution by supplying ATP and membranes required for autophagosome formation [Citation32,Citation33]. Mitochondria reduction mediated by EBV was due to the downregulation of NRF1 and TFAM, transcription factors that promote mitochondrial biogenesis and are upregulated during DC in vitro formation [Citation34,Citation58]. NRF1 reduction occurred in contrast to NFE2L2 increase and, interestingly, a balance between NRF1 and NFE2L2 seems to regulate the oxidative stress [Citation59]. A previous report has shown that EBV lytic infection interferes with mitochondrial DNA replication [Citation52] and, interestingly this study indicated that EBV can establish a lytic infection in primary monocytes. Viral lytic infection correlates also with RAB7 downregulation [Citation37,Citation39], that we also observed in EBV-infected monocytes. To further inhibit autophagy, EBV activates STAT3, a pathway involved in immune dysfunction [Citation9,Citation60,Citation61] that negatively regulates autophagy by upregulating BCL2-family proteins that inhibit BECN1, as previously shown in KSHV-infected DCs [Citation16]. STAT3 could be activated by the expression of EBV-encoded proteins [Citation62] or be mediated by cytokines such as IL6 [Citation63], whose release is increased by EBV-infection [Citation63,Citation64].
Of note, IL6 could act in a paracrine fashion, mediating the activation of STAT3 in bystander cells, extending autophagy inhibition to these cells, as in the case of KSHV and HIV infection [Citation11,Citation65]. We found that EBV phosphorylated STAT3 at both Tyr 705 and Ser 727 residues. The latter can be directly activated by EBV LMP1 (latent membrane protein 1) [Citation62] and, besides leading to a complete STAT3 activation [Citation66], it seems to be essential for its localization to mitochondria [Citation67] where opposite to TFAM, negatively regulates the expression of mitochondrial encoded genes [Citation68]. However, the role of mitochondrial localization of Ser727 of STAT3 is still under investigation, as it seems to be different depending on the cell types [Citation69]. Indeed, in Ras-transformed cells, it has been reported that sustains mitochondrial function and promotes cell survival [Citation70]. The opposite role of STAT3 Ser727 phosphorylation reported in cancer cells versus immune cells could correlate with the activating or inhibiting effect that STAT3 plays in these cell types [Citation71]. Interestingly, as Ser727 phosphorylation of STAT3 has been also observed in the EBV-associated cancer cells [Citation62], it would be interesting to evaluate whether it could localize to mitochondria and promote mitochondrial function or biogenesis in these cells, differently from what we observed in EBV-infected monocytes.
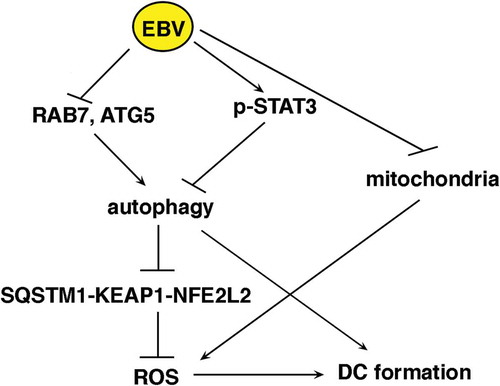
In conclusion, this study shows that EBV adopts several interconnected strategies to hamper the formation of DCs, playing a pivotal role in the immune response. Among these strategies, EBV reduces autophagy, decreases intracellular ROS and counteracts mitochondrial biogenesis in differentiating monocytes (). In agreement with these in vitro results, it has been reported that EBV reduces the number of DCs in the course of acute infection [Citation72]. Unveiling the mechanisms through which the virus reduces the immune surveillance may help to counteract such effect and prevent or better cure the EBV-associated malignancies.
Figure 11. Schematic model depicting the molecules involved in the EBV-mediated impairment of monocyte differentiation into DCs.
Materials and methods
Immature DC generation
Human peripheral blood mononuclear cells (PBMCs) from buffy coats of healthy donors were isolated by Lympholyte cell separation medium (Cedarlane, CL5020). Briefly, 30 ml of diluted buffy coat was layered over 15 ml of Lympholyte cell separation medium and gradients were centrifuged at 800 × g for 30 min at room temperature in a swinging-bucket rotor without the brake applied. The PBMC interface was carefully removed by pipetting and washed 3 times with phosphate-buffered saline (PBS; Corning 21–031-CVR)-EDTA 1X by centrifugation at 600 × g for 10 min.
Monocytes were isolated from PBMCs by immunomagnetic cell separation using anti-CD14-conjugated microbeads according to the manufacturer’s instructions (Miltenyi Biotec, 1300–50-201). Purity of population was checked by FACS analysis (fluorescence-activated cell sorting). To induce the differentiation of immature DCs (iDCs), purified monocytes (approximately 95% CD14+) were cultured at a density of 2 × 10⁶ cells/ml in 12-well plates for 3, 5 and 7 days in RPMI 1640 (Euroclone, ECB9006L) containing 10% FCS, 2 mM L-glutamine, 100 U/ml penicillin and 100 mg/ml streptomycin (complete medium) with the addition of recombinant human CSF2 (colony stimulating factor 2) (50 ng/mL; Miltenyi Biotec, 130–093-865) and IL4 (interleukin 4) (20 ng/mL; Miltenyi Biotec, 130–095-373) every 2 days.
EBV production and monocyte infection
5 x 10⁵ 293/EBV-WT cells, carrying recombinant B95-8 genome containing the gene encoding for the green fluorescent protein (GFP), were plated into 6-wells and cultured in RPMI supplemented with 10% FBS and 2 mM L-glutamine for 24 h. Then, cells were transiently transfected with p509-BZLF1 (constitutively expressing the BZLF1/ZEBRA protein) (0.5 μg/well) and pRA-BALF4 (0.5 μg/well) (constitutively expressing the gp110 protein) plasmids (kindly provided by Prof. H.J. Delecluse and Prof. R. Feederle, (German Cancer Research Centre (DKFZ), Unit F100, 69,120 Heidelberg, Germany, Inserm unit U1074, DKFZ, 69,120 Heidelberg, Germany) and with lipid micelles (3 μl:1 μg plasmid DNA) (Metafectene, Biotex; T020). Three days later, supernatant-containing virus was filtered at 0.45 μm and viral titer was determined by Raji infection. Briefly, 104 Raji cells (Burkitt lymphoma cells) were infected with serial dilutions of virus stock in 96-well plates and analyzed for GFP expression after 3 days by UV microscopy. The number of green Raji units/ml was calculated as a measurement of the concentration of infectious particles in virus stocks [Citation36].
1 × 10⁷ monocytes were infected with EBV-WT at a multiplicity of infection (MOI) of 10 or 20 genome equivalents/cells for 1 h at 37°C. Infected monocytes were then cultured with the above-mentioned supplements to induce differentiation into iDCs. EBV-UV inactivation was carried out at 1500 mJ in a cross-linker for 10 min (Spectrolinker XL-1500 UV crosslinker). In some experiments, 50 nM Rapamycin (Sigma Aldrich) or 200 μM H2O2 (Sigma Aldrich) was added after EBV infection.
Cell lines
The B95.8 Marmoset EBV-transformed B lymphoblastoid cell line was used as positive control for the presence of EBV genome or for EBV lytic antigen expression. The BJAB EBV-negative B cell line was used as negative control.
DNA-polymerase chain reaction (PCR) and monocyte reinfection with EBV released by infected monocytes
Monocytes (1 × 10⁷) were infected with EBV contained in the supernatant of 5-day-infected monocytes. After 3 and 5 days, genomic DNA was extracted and EBV DNA amplified by PCR using specific primers for the BFRF1 gene (FW 5ʹ-TATAGAATTCATGGCGAGCCCGGAAGAGA-3ʹ and Rev. 5ʹTAGCAAGCTTGTCAGGTCCACCTCAGAAACATCA-3ʹ). The amplified PCR product was generated after 30 cycles: 95°C for 45 s, 55°C for 45 s, and 72°C for 1 min in a Mastercycler pro (6,324,000,010, Eppendorf Italia) and run in a 2% agarose gel.
Indirect immunofluorescence assay (IFA)
After 5 days of culture with CSF2 and IL4, uninfected or EBV-infected cells were washed with phosphate-buffered saline (PBS; Corning 21–031-CVR), applied onto multispot microscope slides (Thermo Scientific, 2320) and air-dried. Cells were then fixed with 2% paraformaldehyde (Electron Microscopy Science, 157–8) for 20 min, washed 3 times in PBS, permeabilized with 0.2% Triton X-100 (SIGMA, T-8787)-PBS for 5 min at room temperature (RT) and incubated with 3% bovine serum albumin (BSA)-1% glycine-PBS for 30 min at RT. Then, cells were incubated with a primary monoclonal antibody against either SQSTM1 (1:100; BD Biosciences; 610,832) or NFE2L2/NRF2 (1:50; Santa Cruz Biotechnology, sc-365,949) for 1 h at RT. Slides were then washed 3 times with PBS and cells were further incubated with a CyTM3-conjugated sheep-anti-mouse secondary antibody (1:1000; Jackson Imm. Res.; 515–165-062) for 30 min at RT. After a further 3 washes in PBS, cells were stained with DAPI (4ʹ,6ʹ-diamidino-2-phenylindole) (1 μg/ml; SIGMA; D9542) for 1 min at RT. Finally, slides were washed in PBS, mounted with glycerol:PBS (1:1) and observed by fluorescence microscopy using Apotome Axio Observer Z1 inverted microscope (Zeiss, Oberkochen, Germany), equipped with an AxioCam MRM Rev.3 at 40 x magnification.
To visualize CD14, CD1A and EBV gp350/220 membrane proteins, approximately 106 cells were washed with ice-cold PBS, pelleted and resuspended in appropriately diluted monoclonal antibodies: anti-CD14 (1:100; Miltenyi Biotec, 130–080-701), anti-CD1A (1:100; BD Pharmingen, 555,807) and anti-gp350/220 (72A1, 1:500;Millipore, MAB10219). Then cells were incubated for 30 min on ice. After being washed 3 times with ice-cold PBS, cells were incubated with a CyTM3-conjugated sheep-anti-mouse secondary antibody for 30 min on ice. Finally, cells were washed 3 times with ice-cold PBS, resuspended in glycerol:PBS (1:1), spotted onto a microscope slide and observed by fluorescence microscopy using Apotome Axio Observer Z1 inverted microscope (Zeiss, Oberkochen, Germany), equipped with an AxioCam MRM Rev.3 at 40 x magnification.
Antibodies for western blotting
The following primary antibodies were used in western blotting analysis: mouse monoclonal anti-EA-D (1:1000; Millipore, MAB8186), rabbit polyclonal anti-PARP1 (1:500; Cell Signaling Technology, 9542), rabbit polyclonal anti-LC3B (1:1000; Novus Biologicals, NB100-2220SS), mouse monoclonal anti-SQSTM1 (1:500; BD Transduction Laboratories, 610,883), rabbit polyclonal anti-ATG5 (1:500; Cell Signaling Technology, 2630), rabbit polyclonal anti-RAB7 (1:100; Santa Cruz Biotechnology, sc-10,767; no longer available), rabbit polyclonal anti-BECN1 (1:500; Cell Signaling Technology, 3738), mouse monoclonal anti-STAT3 (1:1000; BD Transduction Laboratories, 610,189), mouse monoclonal anti-phospho-STAT3 (p-Tyr705, 1:100; Santa Cruz Biotechnology Inc., sc-8059), mouse monoclonal anti-phospho-STAT3 (p-Ser727, 1:50; BD Transduction Laboratories, 612,543), mouse monoclonal anti-KEAP1 (1:100; Santa Cruz Biotechnology, sc-365,626), mouse monoclonal anti-NFE2L2/NRF2 (1:100; Santa Cruz Biotechnology, sc-81,342), mouse monoclonal anti-GSR (glutathione reductase) (1:100; Santa Cruz Biotechnology, sc-133,245), mouse monoclonal anti-CAT (catalase) (1:100; Santa Cruz Biotechnology, sc-271,803), mouse monoclonal anti-NRF1 (1:100; Santa Cruz Biotechnology, sc-28,379), mouse monoclonal anti-TFAM (1:100; Santa Cruz Biotechnology, sc-166,965). Monoclonal mouse anti-TUBA1A (1:1000; Sigma Aldrich, T6199) and anti-ACTB (1:10,000; Sigma Aldrich, A5441) were used as loading controls. Goat polyclonal anti-mouse IgG-HRP (Santa Cruz Biotechnology, sc-2005) and anti-rabbit IgG-HRP (Santa Cruz Biotechnology, sc-2004) were used as secondary antibodies. All the primary and secondary antibodies were diluted in PBS-0.1% Tween 20 (Sigma Aldrich, P1379) solution containing 3% BSA (Serva, 11,943.03).
Western blot analysis
After 5 days of culture with CSF2 and IL4, 1 × 10⁶ uninfected or EBV-infected cells were washed twice with 1X PBS and centrifuged at 550 g for 5 min. The cellular pellet was lysed in a 1X RIPA buffer containing 150 mM NaCl, 1% NP-40 (Sigma Aldrich, NP40S), 50 mM Tris-HCl, pH 8, 0.5% deoxycholic acid (Sigma Aldrich, D6750), 0.1% SDS (Sigma Aldrich, 71,736), protease (Sigma Aldrich, S8830) and phosphatase inhibitors (sodium orthovanadate; Sigma Aldrich, S6508 and sodium fluoride; Sigma Aldrich, S7920). Then, 10 µg of protein lysates were subjected to electrophoresis on 4–12% NuPage Bis-Tris gels (Life Technologies, N00322BOX) according to the manufacturer’s instruction. The gels were transferred to nitrocellulose membranes (Bio-Rad, 162–0115) for 2 h in Tris-glycine buffer. Membranes were blocked in PBS-0.1% Tween 20 solution containing 3% BSA, probed with specific antibodies and developed using ECL Blotting Substrate (Advansta, K-12,045-D20).
Cell viability
After 5 days of culture, a trypan blue (Euroclone, 72,571) exclusion assay was performed to test cell viability. Live cells were counted by light microscopy using a Neubauer hemocytometer. The experiments were performed in triplicate and repeated 3 times.
ANXA5 staning was also performed using the Annexin V-FITC Apoptosis Detection Kit (PharMingen, 556,547). After treatments, cells were washed and incubated with 5 μL of AV-FITC and 5 μL of propidium iodide (PI) for 15 min at room temperature in the dark, followed by addition of 400 μL of 1× binding buffer. Samples were analyzed with a FACSCalibur flow cytometer, using CELLQuest software (BD Biosciences, San Jose, USA).
Immunofluorescence and FACS analysis
For immunofluorescence, uninfected or EBV-infected cells, cultured with CSF2 and IL4 for 5 days, were washed with 0.5 % BSA-PBS and incubated for 30 min at 4°C with appropriate isotype control antibody (Miltenyi Biotec, 130–092-212) or antibodies against CD1A (BD Pharmingen, 555,807) and CD14 (Miltenyi Biotec, 130091242) CD83 (Miltenyi Biotec, 130–094-181) HLA_DR (Santa Cruz Biotechnology, sc-33,718) and CD86 (Miltenyi Biotec, 130–094-877). Cells were analyzed with a FACSCalibur flow cytometer, using CELLQuest software (BD Biosciences, San Jose, USA). DCs were gated according to their FSC and SSC properties. At least 10 × 103 events were acquired for each sample.
Fitc-dextran uptake
After 5 days of culture with CSF2 and IL4, EBV-infected or uninfected cells, were washed and incubated for 60 min with 1 mg/ml FITC-dextran (molecular weight 40,000; Sigma, FD40S). Half of the cells was incubated at 37°C while the other half was incubated at 4°C to assess the background uptake. The cells were then washed and analyzed with a FACScalibur flow cytometer (BD, USA), using CELLQuest software (BD Biosciences, San Jose, USA). DCs were gated according to their FSC and SSC properties. For each analysis 10.000 events were recorded.
Maturation of IDC
To induce cell maturation, uninfected or EBV-infected cells, cultured with CSF2 and IL4 for 5 days, were incubated for 24 hrs with Lipopolysaccharide (LPS, 100 ng/ml; Sigma-Aldrich, L2630).
Knockdown by small interfering RNA (sirna)
ATG5, SQSTM1 and STAT3 knockdown were performed by specific siRNA transfection (Santa Cruz Biotechnology, sc-41,445, sc-29,679, sc-29,423) into purified monocytes using Lipofectamine 2000 (Invitrogen, 11,668,027) according to the manufacturer’s instructions. Briefly, the day of transfection, monocytes were seeded into 6-well plates at a density of a 3 × 10⁶ cells/well in 1.25ml of RPMI medium without antibiotics. Next, 30 pmol of siRNA combined with 10 μl of Lipofectamine 2000 were added to the cells. Transfection reactions were performed in serum-free OptiMEM medium (Life Technologies, 31,985,062). Control siRNA-A (Santa Cruz Biotechnology, sc-37,007) was used as a scrambled control. Sixteen h after transfection, monocytes were infected at an MOI of 10 genome equivalents/cell, seeded into 12-well plates at a density of 5 × 10⁶ cells/well for 1 h at 37°C and then cultured for an additional 72 h, in complete medium supplemented with CSF2 (50 ng/mL; Miltenyi Biotec, 130–093-865) and IL4 (20 ng/mL; Miltenyi Biotec, 130–095-373).
TFAM overexpression
5x10⁶ purified monocytes were plated in 1.25 ml of complete medium without antibiotics in 6-well plates and transfected with 7 mg of a plasmid containing the TFAM encoding gene (OriGene, RC215488) by using 12 µl of Lipofectamine 2000 reagent diluted in serum-free medium, following manufacturer’s instructions. Sixteen h after transfection, monocytes were infected at a multiplicity of infection (MOI) of 10 genome equivalents/cell, seeded into 12-well plates at a density of 5 × 10⁶ cells/well for 1 h at 37°C and then cultured for an additional 72 h, in complete medium supplemented with CSF2 (50 ng/mL; Miltenyi Biotec, 130–093-865) and IL4 (20 ng/mL; Miltenyi Biotec, 130–095-373).
ELISA assay
After 5 days of culture with CSF2 and IL4, supernatants from uninfected or EBV-infected cells were collected and an ELISA assay was performed using commercially available reagents and standards (IL6; RayBiotech, ELH-IL6). The supernatants were added in duplicate to appropriate precoated plates. The optical density was measured at 450 nm with a microplate reader (Multiskan Ex,Thermo Fisher Scientific, USA). The minimum detection treshold concentration is typically less than 1 pg/ml.
Measurement of intracellular reactive oxygen species production
To measure reactive oxygen species (ROS) production, the 2′,7′-dichlorofluorescein diacetate (DCFDA; Sigma D6883) was used. Briefly, 5 × 10⁵ EBV-infected or uninfected CD14+ cells cultured with CSF2 and IL4 for 3 and 5 days, were washed with prewarmed PBS and then incubated at 37°C with 10 µM DCFDA for 15 min in PBS. Then, cells were washed and analyzed with a FACScalibur flow cytometer (BD, USA), using CELLQuest software (BD Biosciences, San Jose, CA, USA) and live cells gated according to their forward scatter (FSC) and side scatter (SSC) properties. For each analysis, 10,000 events were recorded.
Mitotracker red staining
After 5 days of culture with CSF2 and IL4, uninfected or EBV-infected cells transfected or untransfected with TFAM-expressing plasmid were incubated with the cell permeable probe for mitochondrial labelling MitoTracker Red CMXRos dye (200 nM) (Cell Signaling Technology, 9082), on ice for 15 min and washed with cold 1X PBS by centrifugation at 550 g for 10 min. To evaluate mitochondria, cells were analysed by an Apotome Axio Observer Z1 inverted microscope (Zeiss, Oberkochen, Germany), equipped with an AxioCam MRM Rev.3 camera at 40 X magnification.
Densitometric analysis
The quantification of proteins bands was performed by densitometric analysis using the ImageJ software, which was downloaded from the NIH web site (http://imagej.nih.gov).
Statistical analysis
Data are represented by the mean ± standard deviation (SD) of at least 3 independent experiments and a two-tailed Student t test was used to demonstrate statistical significance. Difference was considered statistically significant when the P value was at least < 0.05. In some experiments, data were confirmed to be significant with the Mann-Whitney test, with alpha value 0.05.
Ethics statement
According to Declaration of Helsinki, the experiments were carried out in accordance with the approved guidelines and an informed consent was obtained from all adult human subjects.
Acknowledgments
We thank Prof. H.J. Delecluse and Prof. R. Feederle for providing 293/EBV-WT cell line and p509 and pRA plasmids. We also thank Dr. G. Girelli (Blood bank, Sapienza University of Rome) and Dr G. Mandarello and Dr R. Gasbarri (Immunohematology and Transfusion Service, Belcolle Hospital, Viterbo) for providing buffy coats.
Disclosure statement
No potential conflict of interest was reported by the authors.
Additional information
Funding
Related Research Data
References
- Thompson MP, Kurzrock R. Epstein-Barr virus and cancer. Clin Cancer Res. 2004;10:803–821.
- Young LS, Yap LF, Murray PG. Epstein-Barr virus: more than 50 years old and still providing surprises. Nat Rev Cancer. 2016;16:789–802.
- Thakker S, Verma SC. Co-infections and Pathogenesis of KSHV-Associated Malignancies. Front Microbiol. 2016;7:151. 4753363. 4753363.
- Jha HC, Banerjee S, Robertson ES. The Role of Gammaherpesviruses in Cancer Pathogenesis. Pathogens. 2016;5. 4810139. 4810139. DOI:10.3390/pathogens5010018
- Merlo A, Turrini R, Dolcetti R, et al. The interplay between Epstein-Barr virus and the immune system: a rationale for adoptive cell therapy of EBV-related disorders. Haematologica. 2010;95:1769–1777. 2948104. 2948104.
- Lagos D, Boshoff C. Immunobiology and host response to KSHV infection. In: Arvin A, Campadelli-Fiume G, Mocarski E, et al. editors. Human herpesviruses: biology, therapy, and immunoprophylaxis. Cambridge: Cambridge University Press; 2007; p. 915–928.
- Wang JJ, Li YF, Jin YY, et al. Effects of epstein-barr virus on the development of dendritic cells derived from cord blood monocytes: an essential role for apoptosis. Braz J Infect Dis. 2012;16:19–26.
- Li L, Liu D, Hutt-Fletcher L, et al. Epstein-Barr virus inhibits the development of dendritic cells by promoting apoptosis of their monocyte precursors in the presence of granulocyte macrophage-colony-stimulating factor and interleukin-4. Blood. 2002;99:3725–3734.
- Cirone M, Lucania G, Bergamo P, et al. Human herpesvirus 8 (HHV-8) inhibits monocyte differentiation into dendritic cells and impairs their immunostimulatory activity. Immunol Lett. 2007;113:40–46.
- Cirone M, Conte V, Farina A, et al. HHV-8 reduces dendritic cell migration through down-regulation of cell-surface CCR6 and CCR7 and cytoskeleton reorganization. Virol J. 2012;9:92. 3442995. 3442995.
- Santarelli R, Gonnella R, Di Giovenale G, et al. STAT3 activation by KSHV correlates with IL-10, IL-6 and IL-23 release and an autophagic block in dendritic cells. Sci Rep. 2014;4:4241. 3937791. 3937791.
- Santarelli R, Granato M, Pentassuglia G, et al. KSHV reduces autophagy in THP-1 cells and in differentiating monocytes by decreasing CAST/calpastatin and ATG5 expression. Autophagy. 2016;12:2311–2325. 5173267. 5173267.
- Raftery MJ, Schwab M, Eibert SM, et al. Targeting the function of mature dendritic cells by human cytomegalovirus: a multilayered viral defense strategy. Immunity. 2001;15:997–1009.
- Rinaldo CR Jr., Piazza P. Virus infection of dendritic cells: portal for host invasion and host defense. Trends Microbiol. 2004;12:337–345.
- Zhang Y, Morgan MJ, Chen K, et al. Induction of autophagy is essential for monocyte-macrophage differentiation. Blood. 2012;119:2895–2905. 3327464. 3327464.
- Santarelli R, Granato M, Faggioni A, et al. Interference with the Autophagic Process as a Viral Strategy to Escape from the Immune Control: lesson from Gamma Herpesviruses. J Immunol Res. 2015;2015:546063. 4451563. 4451563.
- Granato M, Lacconi V, Peddis M, et al. Hepatitis C virus present in the sera of infected patients interferes with the autophagic process of monocytes impairing their in-vitro differentiation into dendritic cells. Biochim Biophys Acta. 2014;1843:1348–1355.
- Mizushima N, Levine B. Autophagy in mammalian development and differentiation. Nat Cell Biol. 2010;12:823–830. 3127249. 3127249.
- Lin L, Baehrecke EH. Autophagy, cell death, and cancer. Mol Cell Oncol. 2015;2:e985913. 4905302. 4905302.
- Granato M, Zompetta C, Vescarelli E, et al. HCV derived from sera of HCV-infected patients induces pro-fibrotic effects in human primary fibroblasts by activating GLI2. Sci Rep. 2016;6:30649. 4967919. 4967919.
- Klionsky DJ, Abdelmohsen K, Abe A, et al. Guidelines for the use and interpretation of assays for monitoring autophagy (3rd edition). Autophagy. 2016;12:1–222. 4835977. 4835977.
- Yokoyama T, Kondo Y, Kondo S. Roles of mTOR and STAT3 in autophagy induced by telomere 3ʹ overhang-specific DNA oligonucleotides. Autophagy. 2007;3:496–498.
- Li X, Bhaduri-McIntosh S. A Central Role for STAT3 in Gammaherpesvirus-Life Cycle and -Diseases. Front Microbiol. 2016;7:1052. 4937026. 4937026.
- Melillo JA, Song L, Bhagat G, et al. Dendritic cell (DC)-specific targeting reveals Stat3 as a negative regulator of DC function. J Immunol. 2010;184:2638–2645. 3099405. 3099405.
- Deretic V, Saitoh T, Akira S. Autophagy in infection, inflammation and immunity. Nat Rev Immunol. 2013;13: 722–737. 10.1038/nri3532. 5340150. 5340150.
- Scherz-Shouval R, Shvets E, Fass E, et al. Reactive oxygen species are essential for autophagy and specifically regulate the activity of Atg4. Embo J. 2007;26:1749–1760. 1847657. 1847657.
- Gwinn DM, Shackelford DB, Egan DF, et al. AMPK phosphorylation of raptor mediates a metabolic checkpoint. Mol Cell. 2008;30:214–226. 2674027. 2674027.
- Li N, Alam J, Venkatesan MI, et al. Nrf2 is a key transcription factor that regulates antioxidant defense in macrophages and epithelial cells: protecting against the proinflammatory and oxidizing effects of diesel exhaust chemicals. J Immunol. 2004;173:3467–3481.
- Taguchi K, Yamamoto M. The KEAP1-NRF2 System in Cancer. Front Oncol. 2017;7:85. 5415577. 5415577.
- Del Prete A, Zaccagnino P, Di Paola M, et al. Role of mitochondria and reactive oxygen species in dendritic cell differentiation and functions. Free Radic Biol Med. 2008;44:1443–1451.
- St-Pierre J, Buckingham JA, Roebuck SJ, et al. Topology of superoxide production from different sites in the mitochondrial electron transport chain. J Biol Chem. 2002;277:44784–44790.
- Singh R, Cuervo AM. Autophagy in the cellular energetic balance. Cell Metab. 2011;13:495–504. 3099265. 3099265.
- Hailey DW, Rambold AS, Satpute-Krishnan P, et al. Mitochondria supply membranes for autophagosome biogenesis during starvation. Cell. 2010;141:656–667. 3059894. 3059894.
- Zaccagnino P, Saltarella M, Maiorano S, et al. An active mitochondrial biogenesis occurs during dendritic cell differentiation. Int J Biochem Cell Biol. 2012;44:1962–1969.
- Savard M, Belanger C, Tardif M, et al. Infection of primary human monocytes by Epstein-Barr virus. J Virol. 2000;74(2612–9):111749. 111749.
- Granato M, Feederle R, Farina A, et al. Deletion of Epstein-Barr virus BFLF2 leads to impaired viral DNA packaging and primary egress as well as to the production of defective viral particles. J Virol. 2008;82:4042–4051. 2293001. 2293001.
- Granato M, Santarelli R, Farina A, et al. Epstein-barr virus blocks the autophagic flux and appropriates the autophagic machinery to enhance viral replication. J Virol. 2014;88:12715–12726. 4248894. 4248894.
- Mauvezin C, Neufeld TP. Bafilomycin A1 disrupts autophagic flux by inhibiting both V-ATPase-dependent acidification and Ca-P60A/SERCA-dependent autophagosome-lysosome fusion. Autophagy. 2015;11:1437–1438. 4590655. 4590655.
- Granato M, Santarelli R, Filardi M, et al. The activation of KSHV lytic cycle blocks autophagy in PEL cells. Autophagy. 2015;11:1978–1986. 4824593. 4824593.
- Silva LM, Jung JU. Modulation of the autophagy pathway by human tumor viruses. Semin Cancer Biol. 2013;23:323–328. 3791178. 3791178.
- Torii Y, Kawada JI, Murata T, et al. Epstein-Barr virus infection-induced inflammasome activation in human monocytes. PLoS One. 2017;12:e0175053. 5378412. 5378412.
- Farina A, Peruzzi G, Lacconi V, et al. Epstein-Barr virus lytic infection promotes activation of Toll-like receptor 8 innate immune response in systemic sclerosis monocytes. Arthritis Res Ther. 2017;19:39. 5331713. 5331713.
- Van Grol J, Subauste C, Andrade RM, et al. Subauste CS. HIV-1 inhibits autophagy in bystander macrophage/monocytic cells through Src-Akt and STAT3. PLoS One. 2010;5:e11733. 2908694. 2908694.
- Poillet-Perez L, Despouy G, Delage-Mourroux R, et al. Interplay between ROS and autophagy in cancer cells, from tumor initiation to cancer therapy. Redox Biol. 2015;4:184–192. 4803791. 4803791.
- Azad MB, Chen Y, Gibson SB. Regulation of autophagy by reactive oxygen species (ROS): implications for cancer progression and treatment. Antioxid Redox Signal. 2009;11:777–790.
- Foretz M, Guigas B, Bertrand L, et al. Metformin: from mechanisms of action to therapies. Cell Metab. 2014;20:953–966.
- Jiang T, Harder B, Rojo de la Vega M, et al. p62 links autophagy and Nrf2 signaling. Free Radic Biol Med. 2015;88:199–204. 4628872. 4628872.
- Gorrini C, Harris IS, Mak TW. Modulation of oxidative stress as an anticancer strategy. Nat Rev Drug Discov. 2013;12:931–947.
- Copple IM, Lister A, Obeng AD, et al. Physical and functional interaction of sequestosome 1 with Keap1 regulates the Keap1-Nrf2 cell defense pathway. J Biol Chem. 2010;285:16782–16788. 2878012. 2878012.
- Gjyshi O, Flaherty S, Veettil MV, et al. Kaposi’s sarcoma-associated herpesvirus induces Nrf2 activation in latently infected endothelial cells through SQSTM1 phosphorylation and interaction with polyubiquitinated Keap1. J Virol. 2015;89:2268–2286. 4338888. 4338888.
- Chen Q, Vazquez EJ, Moghaddas S, et al. Production of reactive oxygen species by mitochondria: central role of complex III. J Biol Chem. 2003;278:36027–36031.
- Wiedmer A, Wang P, Zhou J, et al. Epstein-Barr virus immediate-early protein Zta co-opts mitochondrial single-stranded DNA binding protein to promote viral and inhibit mitochondrial DNA replication. J Virol. 2008;82:4647–4655. 2293061. 2293061.
- Gomes LC, Di Benedetto G, Scorrano L. During autophagy mitochondria elongate, are spared from degradation and sustain cell viability. Nat Cell Biol. 2011;13:589–598. 3088644. 3088644.
- Komatsu M, Ichimura Y. Physiological significance of selective degradation of p62 by autophagy. FEBS Lett. 2010;584:1374–1378.
- Gjyshi O, Bottero V, Veettil MV, et al. Kaposi’s sarcoma-associated herpesvirus induces Nrf2 during de novo infection of endothelial cells to create a microenvironment conducive to infection. PLoS Pathog. 2014;10:e1004460. 4207826. 4207826.
- Gjyshi O, Roy A, Dutta S, et al. Activated Nrf2 interacts with kaposi’s sarcoma-associated herpesvirus latency protein LANA-1 and host protein KAP1 to mediate global lytic gene repression. J Virol. 2015;89:7874–7892. 4505678. 4505678.
- Anand SK, Tikoo SK. Viruses as modulators of mitochondrial functions. Adv Virol. 2013;2013:738794. 3821892. 3821892.
- Scarpulla RC. Transcriptional paradigms in mammalian mitochondrial biogenesis and function. Physiol Rev. 2008;88:611–638.
- Schultz MA, Abdel-Mageed AB, Mondal D. The nrf1 and nrf2 balance in oxidative stress regulation and androgen signaling in prostate cancer cells. Cancers (Basel). 2010;2:1354–1378. 3835133. 3835133.
- Nefedova Y, Cheng P, Gilkes D, et al. Activation of dendritic cells via inhibition of Jak2/STAT3 signaling. J Immunol. 2005;175:4338–4346, 1351251. 1351251.
- Garufi A, Pistritto G, Ceci C, et al. Targeting COX-2/PGE(2) pathway in HIPK2 knockdown cancer cells: impact on dendritic cell maturation. PLoS One. 2012;7:e48342. 3492329. 3492329.
- Kung CP, Meckes DG Jr., Raab-Traub N. Epstein-Barr virus LMP1 activates EGFR, STAT3, and ERK through effects on PKCdelta. J Virol. 2011;85:4399–4408. 3126279 3126279.
- Niemand C, Nimmesgern A, Haan S, et al. Activation of STAT3 by IL-6 and IL-10 in primary human macrophages is differentially modulated by suppressor of cytokine signaling 3. J Immunol. 2003;170:3263–3272.
- Gosselin J, Flamand L, D’Addario M, et al. Modulatory effects of Epstein-Barr, herpes simplex, and human herpes-6 viral infections and coinfections on cytokine synthesis. A comparative study. J Immunol. 1992;149:181–187.
- Del Corno M, Donninelli G, Varano B, et al. Gessani S. HIV-1 gp120 activates the STAT3/interleukin-6 axis in primary human monocyte-derived dendritic cells. J Virol. 2014;88: 11045–11055. 10.1128/JVI.00307-14. 4178808. 4178808.
- Wen Z, Zhong Z, Darnell JE Jr. Maximal activation of transcription by Stat1 and Stat3 requires both tyrosine and serine phosphorylation. Cell. 1995;82:241–250.
- Zhang Q, Raje V, Yakovlev VA, et al. Mitochondrial localized Stat3 promotes breast cancer growth via phosphorylation of serine 727. J Biol Chem. 2013;288:31280–31288, 10.1074/jbc.M113.505057. 3829438. 3829438.
- Macias E, Rao D, Carbajal S, et al. DiGiovanni J. Stat3 binds to mtDNA and regulates mitochondrial gene expression in keratinocytes. J Invest Dermatol. 2014;134: 1971–1980. 10.1038/jid.2014.68. 4057971. 4057971.
- Yang R, Rincon M. Mitochondrial Stat3, the need for design thinking. Int J Biol Sci. 2016;12:532–544. 4807418. 4807418.
- Gough DJ, Corlett A, Schlessinger K, et al. Mitochondrial STAT3 supports Ras-dependent oncogenic transformation. Science. 2009;324:1713–1716. 2840701. 2840701.
- Yu H, Kortylewski M, Pardoll D. Crosstalk between cancer and immune cells: role of STAT3 in the tumour microenvironment. Nat Rev Immunol. 2007;7:41–51.
- Panikkar A, Smith C, Hislop A, et al. Cytokine-mediated loss of blood dendritic cells during epstein-barr virus-associated acute infectious mononucleosis: implication for immune dysregulation. J Infect Dis. 2015;212:1957–1961.