
ABSTRACT
Cancer stem-like cells (CSCs), a small population of pluripotent cells residing within heterogeneous tumor mass, remain highly resistant to various chemotherapies as compared to the differentiated cancer cells. It is being postulated that CSCs possess unique molecular mechanisms, such as autophagic homeostasis, that allow CSCs to withstand the therapeutic assaults. Here we demonstrate that HDAC6 inhibition differentially modulates macroautophagy/autophagy in CSCs as compared to that of differentiated cancer cells. Using human and murine CSC models and differentiated cells, we show that the inhibition or knockdown (KD) of HDAC6 decreases CSC pluripotency by downregulating major pluripotency factors POU5F1, NANOG and SOX2. This decreased HDAC6 expression increases ACTB, TUBB3 and CSN2 expression and promotes differentiation in CSCs in an apoptosis-independent manner. Mechanistically, HDAC6 KD in CSCs decreases pluripotency by promoting autophagy, whereas the inhibition of pluripotency via retinoic acid treatment, POU5F1 or autophagy-related gene (ATG7 and ATG12) KD in CSCs decreases HDAC6 expression and promotes differentiation. Interestingly, HDAC6 KD-mediated CSC growth inhibition is further enhanced in the presence of autophagy inducers Tat-Beclin 1 peptide and rapamycin. In contrast to the results observed in CSCs, HDAC6 KD in differentiated breast cancer cells downregulates autophagy and increases apoptosis. Furthermore, the autophagy regulator p-MTOR, upstream negative regulators of p-MTOR (TSC1 and TSC2) and downstream effectors of p-MTOR (p-RPS6KB and p-EIF4EBP1) are differentially regulated in CSCs versus differentiated cancer cells following HDAC6 KD. Overall these data identify the differential regulation of autophagy as a molecular link behind the differing chemo-susceptibility of CSCs and differentiated cancer cells.
Introduction
Cancer stem-like cells (CSCs) represent a small population of undifferentiated cells within heterogeneous tumor masses that are distinctly different from differentiated cancer cells [Citation1]. These CSCs play a central role in tumor initiation, progression and resistance to chemotherapy [Citation2,Citation3], and similar to normal stem cells, have the capability of self-renewal, pluripotency and multi-lineage differentiation [Citation1,Citation2]. These hallmark characteristics of CSCs endow them with a capacity to withstand therapeutic assaults that otherwise can destroy differentiated cancer cells, and, consequently, make them resistant to traditional chemotherapies [Citation2,Citation3]. As such, these differentially chemo-resistant CSCs are thought to be the main culprits behind the clinically unsuccessful chemotherapies and/or subsequent cancer relapse. It is now clear that a detailed understanding and therapeutic targeting of the molecular mechanisms that govern differential survival of CSCs as compared to differentiated cancer cells is of the utmost importance to ensure tumor eradication and prevent cancer relapse.
Autophagy is an evolutionarily conserved degradation mechanism responsible for maintaining cellular bioenergetics, and the clearance of aggregated proteins and damaged organelles. As such, dysfunctions within the autophagy processes are implicated in numerous pathologies such as obesity, neurodegeneration, and cancer [Citation4]. However, the role of autophagy in cancer is controversial. On the one hand, it has been argued that increased autophagy promotes carcinogenesis by degrading and recycling cellular components to use for energy and proliferation, and that it can act as an adaptive mechanism to confer resistance to various chemotherapeutic drugs [Citation4–Citation6]. On the other hand, increased autophagy has also been shown to promote autophagic cell death and suppress the growth of cancer cells, and it has been demonstrated that mice harboring deficiencies in autophagy-related genes are more prone to tumor development [Citation7]. Consequently, multiple autophagy inhibitors and promoters are currently being tested in clinical trials for cancer treatment [Citation8,Citation9]. In particular, the autophagy-inhibiting drugs chloroquine (CQ) and hydroxychloroquine (HCQ) are commonly used in combination therapies to achieve optimal anti-cancer therapeutic effects [Citation10]. Of note, we recently reported that CSCs require a basal level of autophagy, and that upregulation or downregulation of autophagy inhibits CSC growth and pluripotency [Citation11]. Thus, identification and subsequent targeting of molecular mechanisms that govern autophagic homeostasis in CSCs represents a rational strategy to target cancers in clinical settings.
HDAC6 (histone deacetylase 6; HDAC6 member of the class IIb HDAC family), which deacetylates various substrates including TUBA/α-tubulin and many other proteins, has been extensively studied in the context of neurodegeneration and cancer [Citation12–Citation19]. Similar to autophagy, HDAC6 has been reported to bear context-dependent biological functions in cancers. While HDAC6 was linked with cancer cell survival and growth due to its role in oncogenic transformation and epithelial mesenchymal transition [Citation14,Citation16], it can also serve as a tumor suppressor during hepatocarcinogenesis [Citation20]. Moreover, HDAC6 positively regulates autophagy in differentiated cancer cells [Citation12,Citation20–Citation22]. However, the involvement of HDAC6 in the regulation of autophagy in CSCs remains unexplored. Given the important link between autophagy and CSCs as evidenced from our previous investigation [Citation11], it is necessary to understand the role of HDAC6 in the regulation of autophagy and pluripotency in CSCs.
Many HDAC inhibitors, including specific inhibitors of HDAC6, have been developed for anti-cancer therapy and are currently undergoing clinical trials or have been approved for cancer treatment [Citation23–Citation25]. However, the efficacy and toxicity of these inhibitors in clinics is not as promising as anticipated based on results from in vitro and in vivo studies [Citation26]. Therefore, more studies are focusing on the use of HDAC inhibitors in combination therapies as opposed to monotherapies. In particular, the specific HDAC6 inhibitor rocilinostat is currently undergoing phase II clinical trials in combination with the proteasome inhibitor bortezomib [Citation25–Citation27]. Given that CSC populations have unique properties that make them more resistant to some chemotherapies than differentiated cancer cells, it is possible that HDAC inhibitors are not as effective at inhibiting CSC populations in patients, and this could offer an explanation as to the differential responses observed when HDAC inhibitors are used in in vitro and in vivo studies versus clinical trials. Hence, it is imperative to study the role of HDAC6 in the context of CSC biology in order to achieve better therapeutic potential.
In this study, we report that HDAC6 acts as a pluripotency factor for CSCs, and that the pharmacological inhibition or knockdown (KD) of HDAC6 in both human and murine CSCs resulted in decreased expression of the main pluripotency transcription factors POU5F1/Oct4, NANOG and SOX2 [Citation28]. Using well characterized human (NT2/D1) and murine (P19) tumorigenic embryonic carcinoma CSC models [Citation29–Citation33] as well as an epithelial-to-mesenchymal transition (EMT)-induced breast CSC (BCSC) model [Citation34,Citation35] and differentiated breast cancer cells, we demonstrate that HDAC6 KD leads opposing autophagy outcomes in CSC versus differentiated cancer cells, which mechanistically, arises through differential regulation of p-MTOR activation due to similarly contrasting expression of the tuberous sclerosis complex proteins, TSC1 and TSC2. Given the nature of HDAC6 as a positive modulator of autophagy in differentiated cancer cells, the reported findings herein demonstrate a novel role for HDAC6 in negatively regulating autophagy in CSCs. Altogether, these findings highlight the growing appreciation for clinically relevant differences between stem-like and differentiated cancer cells, and caution against the ‘one-size-fits-all’ therapeutic approaches while targeting heterogeneous cancer masses.
Results
HDAC6 is an important regulator of pluripotency factors (POU5F1, NANOG and SOX2) in human and murine CSCs
Despite the known role of HDAC6 in tumorigenesis of various cancers, including breast, colon and ovarian cancers [Citation17,Citation18], its precise involvement in the regulation of bona-fide pluripotency markers POU5F1, NANOG and SOX2 has never been studied. Because these master pluripotency regulators are responsible for uncontrolled growth of CSCs, we aimed to study the potential interplay between HDAC6 and these pluripotency factors. To probe this, we used a selective HDAC6 inhibitor (tubastatin A) and shRNA-mediated knockdown (KD) of HDAC6 and measured their effect on the growth and viability of NT2/D1 and P19 CSCs. NT2/D1 or P19 cells were treated with 5 µM of tubastatin A or HDAC6 shRNA, and monitored for viability using trypan blue exclusion as well as an MTS viability assay. As shown in –h), tubastatin A-treated or HDAC6 KD human and murine CSCs grew significantly slower and demonstrated significantly reduced viability compared to the respective nontreated or scrambled control cells (Figure S1(a–d)). In these experiments, to confirm the efficiency of HDAC6 inhibition, we probed for acetylated TUBA (tubulin alpha, all isoforms) in tubastatin A-treated and HDAC6 KD CSCs. TUBA is a well-known substrate of HDAC6-mediated deacetylation. As shown in –l), either tubastatin A treatment or HDAC6 KD drastically increased the levels of acetylated TUBA, confirming the efficient inhibition of HDAC6 deacetylase activity in both human and murine CSCs.
Figure 1. HDAC6 inhibition or KD inhibits the proliferation of cancer stem cells. (a and b) NT2/D1 and P19 tubastatin A-treated cells were stained with trypan blue and counted to determine the number of viable cells after 48, 72 and 96 h treatment. (c and d) NT2/D1 and P19 HDAC6 KD cells were stained with trypan blue and counted to determine the number of viable cells after 48, 72 and 96 h transfection. (e and f) NT2/D1 and P19 tubastatin A-treated cells were stained with MTS reagent and the percentage of proliferation was determined after 24 h. (g and h) NT2/D1 and P19 HDAC6 KD cells were stained with MTS reagent (24 h) for proliferation evaluation. (i and m) NT2/D1, tubastatin A-treated cells were subjected to (i) WB and (m) qRT-PCR analysis for pluripotency factors (i.e., POUF51/Oct4, NANOG, SOX2). The numbers below the blots correspond to densitometry quantification of blots normalized to the loading control. (j and n) P19 tubastatin A-treated cells were subjected to (j) WB and (n) qRT-PCR analysis for pluripotency factors (i.e. Pouf51/Oct4, Nanog, Sox2). (k and o) NT2/D1 HDAC6 KD cells were subjected to (k) WB and (o) qRT-PCR analysis for pluripotency factors (POUF51, NANOG, SOX2). (l and p) NT2/D1 HDAC6 KD cells were subjected to (l) WB and (p) qRT-PCR analysis for pluripotency factors (POUF51, NANOG, SOX2). Statistical analysis was performed with two-tailed, Student’s t-test with 95% confidence interval; *P-values = 0.05 obtained by comparing the respective data with the untreated or scrambled control. MFI, mean fluorescence intensity.
Considering the above-mentioned HDAC6 inhibitor or KD-related decrease in CSC growth, we next analyzed the effect of HDAC6-related manipulations on pluripotency factors POU5F1, NANOG and SOX2. We found that HDAC6 inhibition or KD decreased the protein levels of pluripotency factors POU5F1, NANOG and SOX2 in NT2/D1 and P19 CSCs ()). Tubastatin treatment also significantly decreased the expression of POU5F1 and NANOG mRNA in NT2/D1 cells and significantly decreased Pou5f1 mRNA in P19 cells. Similarly, HDAC6 KD significantly decreased the mRNA expression of POU5F1, NANOG and SOX2 in NT2/D1 cells and Pou5f1 in P19 cells (–)). Together, these results demonstrate a novel role for HDAC6 in regulating the pluripotency of CSCs by modulating the protein expression of pluripotency factors POU5F1, NANOG and SOX2. POU5F1/Pou5f1 mRNA was also consistently downregulated by both HDAC6 inhibition and HDAC6 KD both in NT2/D1 and P19 cells, suggesting that HDAC6 regulates POU5F1 expression at both transcriptional and translational levels.
HDAC6 inhibition or KD increases the stabilization of ACTB (actin beta) and promotes the differentiation of CSCs
Pluripotency and differentiation are two conversely regulated cell growth phenomena. Considering the effect of HDAC6 on pluripotency factors, we next evaluated whether HDAC6 affected cellular differentiation. As shown in , based on microscopy, tubastatin A-treated and HDAC6 KD cells were larger and displayed long dendritic outgrowths as compared to nontreated or scrambled control cells (Figure S2(a)). These morphological changes are characteristic of a more differentiated phenotype [Citation36], and were complemented by upregulation of protein () or mRNA (–j)) expression of differentiation markers from several distinct lineages, including neuronal progenitor lineage, TUBB3/Tubb3 (tubulin beta 3 class III); mammary epithelial lineage, CSN2/Csn2 (casein beta); endodermal lineage, GATA6/Gata6 (GATA binding protein 6) and SPP1/Spp1 (secreted phosphoprotein 1); mesodermal lineage, TBXT/T (T-box transcription factor T); and ectodermal lineage, CDX2/Cdx2 (caudal type homeobox 2). Altogether, these results unveil the ability of HDAC6 to maintain the dedifferentiated state of the CSCs.
Figure 2. HDAC6 inhibition or KD promotes differentiation in NT2/D1 and P19 cells. (a and b) Micrographs of NT2/D1 KD or tubastatin A-treated cells evaluating the influence of HDAC6 KD (a) and tubastatin A treatment (b) on cell morphology. (c and d) NT2/D1 and P19 tubastatin A-treated cells were subjected to WB analysis for differentiation factors (TUBB3 and CSN2). The numbers below the blots correspond to densitometry quantification of blots normalized to the loading control. (e and f) NT2/D1 and P19 HDAC6 KD cells were subjected to WB analysis for differentiation factors (TUBB3/Tubb3 and CSN2). (g and h) qRT-PCR analysis for differentiation markers TUBB3, CSN2, SPP1, GATA6, TBXT/T and Cdx2 in tubastatin A-treated NT2/D1 and P19 cells. (i and j) NT2/D1 and P19 HDAC6 KD cells were subjected to qRT-PCR analysis for differentiation markers TUBB3, CSN2, SPP1, GATA6, TBXT/T and Cdx2. (k) NT2/D1 HDAC6 KD cells were subjected to WB analysis for differentiation marker ACTB. (l) NT2/D1 HDAC6 KD cells treated with or without MG132 for 4 h were subjected to WB analysis for differentiation marker ACTB. (m) NT2/D1 HDAC6 KD cells were subjected to immunoprecipitation (IP) using anti-ACTB antibody followed by WB analysis for specific ubiquitination of ACTB. Statistical analysis was performed with two-tailed, Student’s t-test with 95% confidence interval; *P-values = 0.05 obtained by comparing the respective data with the untreated or scrambled control.
In the context of our observation that HDAC6 KD causes morphological changes in CSCs, we investigated whether HDAC6 KD had any effect on cytoskeleton components, such as ACTB (actin beta). We found that HDAC6 KD increased the protein levels of ACTB () that is known to promote the increase in cell size and dendrite-like cell outgrowth. Further mechanistic analysis revealed that this increase in ACTB expression was not due to an increase in ACTB transcription, as HDAC6 KD decreased ACTB mRNA levels (Figure S2(b)). We hypothesized that HDAC6 inhibition may increase the post-transcriptional stability of ACTB by inhibiting its degradation. To analyze this, we treated NT2/D1 scrambled control and HDAC6 KD cells with the proteasome inhibitor MG132 and found that MG132 treatment increased ACTB levels similar to HDAC6 KD, and that the combination of HDAC6 and MG132 further enhanced ACTB expression (). Moreover, MG132 treatment increases the accumulation of total ubiquitin in NT2/D1 scrambled control cells, indicating efficient inhibition of proteasomal degradation of ubiquitinated proteins (Figure S2(c)). Of note, the levels of total ubiquitin in HDAC6 KD and MG132-treated cells were lower than MG132 treatment alone, further indicating that HDAC6 KD inhibits the ubiquitination and proteasomal degradation of proteins, including those involved in cell differentiation. To further confirm that the ubiquitin modification observed in HDAC6 KD involves the specific ubiquitination of ACTB, we performed a co-immunoprecipitation assay. Indeed, we detected decreased ubiquitination of ACTB in HDAC6 KD ( and S2(d)), supporting the proposal that increased ACTB expression in HDAC6 KD occurs via inhibition of its degradation.
Quantitative multi-plex proteomics comprehensively captures the contrasting role of HDAC6 in the regulation of pluripotency and differentiation factors in CSCs
To comprehensively explore the role of HDAC6 in regulating the pluripotency and differentiation factors in CSCs, we evaluated the change in the total proteome of NT2/D1 cells following HDAC6 KD or inhibition using quantitative TMT-based multiplexed proteomics [Citation37]. We then identified the top proteins with the greatest change in expression by both tubastatin A treatment and HDAC6 KD. In line with our observations thus far, we found that both tubastatin A treatment and HDAC6 KD greatly decreased the expression of proteins involved in pluripotency maintenance; among these, POU5F1 was one of the proteins most drastically affected (Figure S3(a)). Furthermore, HDAC6 KD and inhibition decreased the levels of GDF3 (growth differentiation factor 3), which is positively regulated by NANOG and is normally highly expressed in embryonic carcinoma cell lines (Figure S3(a)) [Citation38]. Of note, similarly reduced GDF3 expression has been observed following RA-mediated differentiation of CSCs [Citation39]. HDAC6 KD and inhibition also downregulated the expression of PAF1 (PAF1 homolog, Paf1/RNA polymerase II complex component), which promotes self-renewal of pancreatic cancer stem cells [Citation40]. In contrast, HDAC6 KD and inhibition increased the expression of many differentiation markers including BRK1 (BRICK1, SCAR/WAVE actin nucleating complex subunit), and EFHD1 (EF-hand domain family member D1) (Figure S3(b)). Considering the fact that BRK1 plays a major role in neuronal differentiation by promoting ACTB nucleation and cytoskeleton rearrangement, our data unearths another mechanism by which HDAC6 KD or inhibition regulates CSC morphology and ACTB dynamics [Citation41]. Similar to BRK1, the calcium binding protein EFHD1 also promotes neuronal differentiation [Citation42]. Together, these data conclusively capture the differential regulation of regulatory factors involved in differentiation and pluripotency following HDAC6 inhibition.
In addition to regulating CSC pluripotency and differentiation, HDAC6 KD and inhibition also deregulated many proteins involved in cellular processes important for CSC development such as mitochondrial maintenance (HADH and TIMM9; Figure S3(c)), metabolism (AK1 and GPT2; Figure S3(d)) and autophagy (HEXIM1 and PLIN3; Figure S3(g)).
Our proteomic analysis also revealed the drastic downregulation of ribosomal associated proteins by HDAC6 inhibition and KD in CSCs. Because ribosomes are the factories in which proteins are synthesized, rapidly growing cells typically express high levels of ribosomal proteins and ribosomal RNA (rRNA) [Citation43]. Not only did HDAC6 inhibition decrease the expression of many ribosomal proteins such as RPL7A, RPL27, RPL29, RPL35A, RPS25, RPS18, RPS6, RPL13, RPL15 and RPS16, but the expression of mitochondrial ribosome associated proteins MRPL47, MRPS15, and MRPL2 was also significantly downregulated (Figure S3(f)). This indicates that HDAC6 KD and inhibition causes a global decrease in protein synthesis within NT2/D1 CSCs, thereby inhibiting their proliferative potential. Moreover, HDAC6 inhibition and KD also decreased the expression of many proteins involved in gene transcription, such as several histone proteins including members of the linker histone H1 family, HIST1H1B and HIST1H1D, the histone H4 family, HIST1H4A, and the histone H3 family, HIST1H3A (Figure S3(e)). The research of histone modifications has garnered much interest in recent years as it plays a major role in the epigenetic regulation of differentiation, tumorigenesis, and other pathologies. While most studies focus on the post-translational modifications (PTMs) of histones such as methylation, the proteolytic degradation of histones, especially through other PTMs such as acetylation and ubiquitination, is also an important mechanism of epigenetic regulation of gene expression [Citation44,Citation45].
Together, our proteomics analysis highlights the importance of HDAC6 in maintaining a pluripotent, undifferentiated phenotype of CSCs. Inhibition or KD of HDAC6 drastically downregulates proteins involved in maintaining pluripotency, especially POU5F1, and promotes the expression of proteins involved in differentiation (Figure S3(h)). Moreover, HDAC6 inhibition or KD has a universal effect on CSC gene expression and protein synthesis, where HDAC6 inhibition or KD may epigenetically modify the gene expression profile of CSCs via histone proteolysis and reduce global protein translation by decreasing ribosomal protein synthesis (Figure S3(h)).
HDAC6 inhibitor-mediated effect on pluripotency and differentiation of CSCs is independent of CASP3/caspase-3
To understand how HDAC6 regulates CSC pluripotency and differentiation, we next evaluated whether the effect of HDAC6 inhibition on pluripotency and differentiation could be attributed to an increase in cell death. We found that treatment of NT2/D1 and P19 cells with 1 µM and 5 µM of tubastatin A increased the levels of cleaved CASP3/caspase-3 in a dose-dependent manner, indicating an upregulation in cell death (Figure S4(a,c)). However, CASP3 can be upregulated in response to programmed cell death (apoptosis) or cell injury (necroptosis). We observed that tubstatin A treatment decreased the levels of the necroptosis protein RIPK3 (receptor interacting serine/threonine kinase 3) (Figure S4(b)), indicating that CASP3 is likely upregulated in response to apoptosis, as opposed to necroptosis. Keeping in mind that PARP is the main target of CASP3 activity, and cleaved PARP serves as a marker of apoptosis, our data showed that tubastatin A increased the levels of cleaved PARP in a dose-dependent manner. Meanwhile, levels of RIPK3, a key component in necroptosis, were found to decrease with tubastatin A, negating the possibility that cells were undergoing necroptosis (Figure S4(b)).
To further differentiate between HDAC6-induced apoptosis and necroptosis, we treated NT2/D1 cells with tubastatin A in combination with either CASP3 inhibitor V or necrostatin (an inhibitor of necroptosis). Treatment with CASP3 inhibitor, but not necrostatin, effectively reversed the tubastatin A-mediated increase in both CASP3 levels and cleaved PARP levels (Figure S4(d)). However, CASP3 inhibitor had no further effect on the tubastatin A-induced levels of pluripotency factors or differentiation markers (), whereas necrostatin had only minor effects on the levels of cleaved CASP3, pluripotency and differentiation factors as compared to those observed with tubastatin A alone ( and S4(d)). This indicates that tubastatin A-mediated cell death and upregulation of CASP3 is mostly via apoptosis, not necroptosis, and that the tubastatin A-mediated effects on pluripotency and differentiation unlikely rely on CASP3-mediated effects. Therefore, regulation of these processes likely occur upstream of CASP3 upregulation following tubastatin A treatment. We also measured the levels of CASP3 by western blot (WB) analysis in NT2/D1 scrambled control and HDAC6 KD cells and we were unable to detect the presence of cleaved CASP3 following HDAC6 KD (Figure S4(e)). Together, these data suggested that the low levels of apoptotic death observed within tubastatin A-treated cells could arise from an off-target effect of chemical treatment, and does not occur due to exclusive HDAC6-specific inhibition.
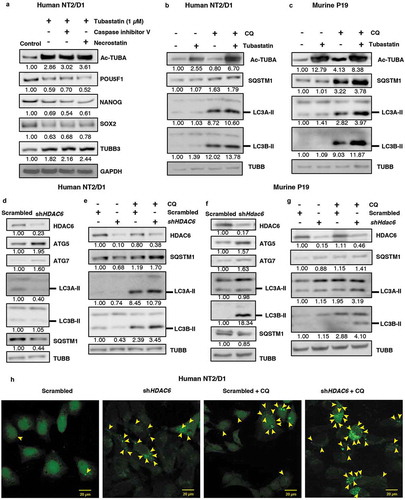
Figure 3. HDAC6 inhibition or KD promotes autophagy in NT2/D1 and P19 cells. (a) NT2/D1 cells were pre-treated with caspase inhibitor V or necrostatin followed by treatment with tubastatin A and subjected to WB for POU5F1, NANOG, SOX2, and TUBB3. (b and c) Tubastatin A-treated NT2/D1 and P19 cells were treated with 18 µM chloroquine (CQ) and the levels of SQSTM1, and LC3B-II were analyzed by WB analysis. (d and f) NT2/D1 HDAC6 KD cells were subjected to WB analysis for ATG5, LC3A-II, LC3B-II and SQSTM1. (e and g) NT2/D1 and P19 cells with either scrambled control or shHDAC6 shRNA were treated with 18 µM chloroquine (CQ) and the levels of SQSTM1, and LC3B-II were analyzed by WB analysis. (h) NT2/D1 HDAC6 KD cells were transfected with a GFP-LC3 overexpressing plasmid and treated with chloroquine (CQ), and puncta formation was analyzed by confocal microscopy. Arrowheads indicate examples of GFP-LC3 puncta.
HDAC6 inhibition promotes autophagy in NT2/D1 and P19 cancer stem cells
Given that tubastatin A and HDAC6 KD-mediated decrease in pluripotency and increase in differentiation occur independent of apoptosis, we next explored other mechanisms by which HDAC6 could regulate CSC pluripotency. HDAC6 has been identified as a major regulator of autophagy in several cancer cells and neurodegeneration models [Citation12,Citation20–Citation22]; however, the effect of HDAC6 inhibition on autophagy in CSCs remains unexplored. Our recent report revealed that autophagic homeostasis is essential for maintaining CSC pluripotency [Citation11], therefore we were interested to know whether HDAC6 inhibition had any effect on autophagic homeostasis in our CSC models. We found that tubastatin A treatment upregulated the protein levels of ATG5 and MAP1LC3/LC3 isoforms A and B in NT2/D1 and P19 CSCs compared to the nontreated control (Figure S5(a,b)). Furthermore, tubastatin A treatment decreased the levels of SQSTM1, a known substrate of autophagic degradation (Figure S5(a,b)). We were able to rescue this downregulation of SQSTM1 levels via combination treatment with the late-stage autophagy inhibitor chloroquine (CQ) (). Moreover, CQ treatment further enhanced the levels of LC3A/B-II in tubastatin A-treated cells compared to CQ treatment alone () [Citation46]. Together, these results demonstrate that inhibition of HDAC6 via tubastatin A increases autophagic flux in NT2/D1 and P19 CSCs.
Similar to tubastatin A-mediated HDAC inhibition, we found that HDAC6 KD also upregulated the levels of the autophagy-related proteins ATG5 and ATG7 in both NT2/D1 and P19 CSCs (). HDAC6 KD in NT2/D1 cells also downregulated the levels of SQSTM1, which was effectively rescued via treatment with CQ (). Unlike tubastatin A-treated samples, HDAC6 KD in NT2/D1 CSCs decreased the expression of LC3A/B-II. However, the levels of LC3A/B-II were rescued in HDAC6 KD cells treated with CQ, indicating that this decrease in LC3 levels was due to increased LC3 turnover through enhanced autophagic degradation in HDAC6 KD cells (). Furthermore, treatment of P19 HDAC6 KD cells with CQ also greatly enhanced LC3A/B-II expression, indicating an increase in autophagic flux, but the levels of SQSTM1were not as drastically affected (). We found that the mRNA levels of SQSTM1 in NT2/D1 HDAC6 KD cells remained stable (Figure S5(c)), therefore the upregulation of autophagic degradation was sufficient to greatly decrease SQSTM1 protein levels, and inhibition of autophagic degradation via CQ treatment rescued SQSTM1 levels (). However, we found that HDAC6 KD in P19 cells significantly increased the mRNA expression of Sqstm1 (Figure S5(d)); therefore it is likely that although HDAC6 KD upregulates autophagy in these cells, we were unable to visualize a decrease in SQSTM1protein by autophagic degradation due to the enhanced translation of Sqstm1 mRNA (Figure S5(d)).
As an additional method to monitor autophagic activity, we used fluorescence microscopy to visualize the puncta formation in NT2/D1 cells transfected with the fluorescent protein GFP-LC3. These punctate structures represent autophagosomes, and we observed that HDAC6 KD cells have increased numbers of puncta, indicating an induction of autophagy ( and S5(e)). Furthermore, HDAC6 KD cells treated with CQ displayed even more visible puncta than control cells treated with CQ ( and S5(e)), supporting our previous results that autophagic flux is upregulated in HDAC6 KD CSCs. Taken together, these results further confirm that inhibition of HDAC6 via pharmacological inhibition or KD increases autophagic flux in CSCs. These results are especially important in the context of our recent findings that autophagic homeostasis is required for maintaining the pluripotency of CSCs, and that an increase or decrease from the basal levels of autophagy induces differentiation and/or senescence in CSCs [Citation11].
HDAC6 KD negatively regulates p-MTOR signaling and the tuberous sclerosis complex in CSCs
Moving forward, we aimed to understand the mechanism by which HDAC6 KD promotes autophagy in CSCs. MTOR (mechanistic target of rapamycin kinase) is a positive regulator of cell growth and proliferation and a negative regulator of autophagy [Citation47]. Upon phosphorylation at Ser2448, MTOR is activated and forms a complex referred to as MTOR complex 1 (MTORC1). MTORC1 inhibits autophagy by promoting the phosphorylation and inactivation of ULK1, an essential kinase for initiation of canonical autophagy [Citation47]. We found that HDAC6 KD in NT2/D1 and P19 cells decreased p-MTOR at Ser2448 without the matching trends of protein expression for total MTOR ().
Figure 4. HDAC6 KD inhibits MTOR in NT2/D1 and P19 cells via the tuberous sclerosis complex. (a-d) NT2/D1 and P19 cells were subjected to western blot analysis for (a) p-MTOR, MTOR, (b) p-AKT, AKT, (c) TSC1, TSC2, (d) p-RPS6KB and p-EIF4EBP1. (e and f) NT2/D1 HDAC6 KD cells were treated with autophagy inducing agents Tat-Beclin or rapamycin for 24 h, stained with trypan blue and counted to determine the number of viable cells. (g and h) P19 HDAC6 KD cells were treated with autophagy-inducing agents Tat-Beclin or rapamycin for 24 h, stained with trypan blue and counted to determine the number of viable cells. (i) NT2/D1 retinoic acid-treated cells were subjected to WB for POU5F1. (j) POU5F1 KD cells were subjected to WB for HDAC6. (k) NT2/D1 (ATG7 or ATG12 KD) cells were subjected to WB analysis for HDAC6. Statistical analysis was performed with two-tailed, Student’s t-test with 95% confidence interval; *P-values ≤ 0.05 obtained by comparing the respective data with the untreated or scrambled control.
Ultimately, we focused on deciphering the molecular players involved in dictating p-MTOR expression in CSCs. One of the most common mechanisms of MTOR activation is via the AKT serine/threonine kinase signaling pathway, which is activated in response to growth factors and proliferation signals. AKT is phosphorylated and activated at Ser473, and can then activate MTOR directly [Citation48] or indirectly by inhibiting the tuberous sclerosis tumor suppressor complex. This complex consists of TSC1/hamartin (tuberous sclerosis 1) and TSC2/tuberin (tuberous sclerosis 2), and when active, acts as a GTPase activating protein (GAP) that promotes the conversion of RHEB to its inactive state [Citation49]. Because activated RHEB promotes the activation of MTORC1, the tuberous sclerosis complex acts as a negative regulator of MTORC1. AKT promotes the phosphorylation of TSC2 which inhibits the function of the tuberous sclerosis complex, thereby promoting MTORC1 activation [Citation50–Citation52]. As shown in , HDAC6 KD in NT2/D1 and P19 lead to decreased phosphorylation of AKT at Ser473. In line with the decreased p-AKT levels, HDAC6 KD in CSCs also had increased levels of TSC1 and TSC2 (). Altogether, these results help explain the decreased activation of p-MTOR and subsequent upregulation of autophagy in HDAC6 KD CSCs.
Other than autophagy, the other major targets of MTORC1 activity include regulators of protein translation. MTORC1 promotes protein synthesis and cell growth by phosphorylating and activating RPS6KB (ribosomal protein S6 kinase B) [Citation53], which phosphorylates the RPS6/S6 ribosomal protein for mRNA translation. MTORC1 also phosphorylates and inhibits EIF4EBP1 (eukaryotic translation initiation factor 4E binding protein 1) [Citation53] preventing it from binding to and inhibiting EIF4E (eukaryotic translation initiation factor 4E), thereby promoting protein translation. In line with our observations that HDAC6 KD inhibits the activation of MTOR in CSCs, we found that phosphorylation of RPS6KB and EIF4EBP1 also decreased following HDAC6 KD in NT2/D1 and P19 cells (). These findings support our proteomics data where we observed a significant decrease in proteins associated with ribosomal synthesis and protein translation.
Promotion of autophagy in combination with HDAC6 inhibition synergistically reduces cell viability in CSCs
Thus far we have observed that downregulation or inhibition of HDAC6 suppresses CSC growth and viability and increases autophagy. Moving forward, we wished to know whether this regulation of autophagy is important for HDAC6-mediated effects on cell growth and viability. Therefore, we treated NT2/D1 and P19 CSCs with the autophagy inducers Tat-Beclin 1 (BECN1) peptide or rapamycin in combination with HDAC6 KD to see whether further upregulation of autophagy has a synergistic effect on CSC viability. We found that combination of HDAC6 KD with either Tat-Beclin 1 or rapamycin significantly reduced the viability of both NT2/D1 () and P19 () CSCs compared to either HDAC6 KD, Tat-Beclin 1 or rapamycin treatment alone. These results highlight the importance of inducing autophagy for the treatment of CSCs.
Promotion of differentiation in CSCs decreases their endogenous HDAC6 expression
Given our observations that HDAC6 inhibition and KD decrease the expression of pluripotency factors, especially POU5F1, and promote autophagy, we were interested to know whether inhibition of pluripotency via various manipulations had any reciprocal effect on HDAC6. We found that both retinoic acid treatment and POU5F1 KD decreased the protein expression of HDAC6, further highlighting the importance of HDAC6 for maintaining the pluripotent and undifferentiated state of CSCs (,j)).
In the context of our recent findings that ATG7 or ATG12 KD decrease pluripotency and induce differentiation in CSCs [Citation11], we also found that ATG7 and ATG12 KD drastically decreased the levels of HDAC6 in NT2/D1 CSCs (). Furthermore, in corroboration with our previous findings that fluctuations in autophagy in CSCs promotes senescence, we observed that HDAC6 KD in CSCs upregulated the protein and mRNA expression of CDKN1A/CDKN1A (cyclin dependent kinase inhibitor 1A) and increased GLB1/β-galactosidase activity compared to scrambled control cells (Figure S6(a,b)) [Citation54]. Taken together, these data show that inhibition of pluripotency by promoting differentiation downregulates HDAC6 expression in CSCs.
Autophagy and apoptosis are differentially regulated by HDAC6 in CSCs and breast cancer cells
Several reports have described autophagy-promoting properties of HDAC6 in differentiated cancer cells, so in light of our findings showing the contrasting role of HDAC6 in regulating autophagy in CSCs, we hypothesized that HDAC6-related differential regulation of autophagy is cell-type dependent. To test this hypothesis, we began by determining the effect of HDAC6 inhibition or KD on the viability of differentiated breast cancer cells. We found that tubastatin A treatment and HDAC6 KD significantly inhibited the growth and viability of MDA-MB-231 () and MDA-MB-468 () breast cancer cells. To determine whether this decrease in viability was due to an increase in apoptotic cell death, we measured the levels of CASP3 by WB analysis. Similar to NT2/D1 and P19 CSCs, tubastatin A treatment increased CASP3 in MDA-MB-231 and MDA-MB-468 breast cancer cells (). However, unlike CSCs, KD of HDAC6 in breast cancer cells also upregulated CASP3 (), suggesting an increase in apoptosis, but not necroptosis, as we observed no increase in the levels of RIPK3 (Figure S7(a–d)). These results were supported with flow cytometry analyzes, which showed that tubastatin A treatment and HDAC6 KD in MDA-MB-231 and MDA-MB-468 cells had an increase in percentage of cells positively stained with ANXA5/annexin V (–)). Thus, our results indicate a differential role of HDAC6 for the regulation of apoptosis in differentiated cells as compared to that in stem-like cancer cells.
Figure 5. HDAC6 inhibition or KD decreases the viability and promotes apoptosis in MDA-MB-231 and MDA-MB-468 differentiated breast cancer cells. (a and c) Tubastatin A-treated MDA-MB-231 and MDA-MB-468 cells were stained with MTS reagent and proliferation was determined 24 h post treatment. (b and d) MDA-MB-231 and MDA-MB-468 HDAC6 KD cells were stained with trypan blue and counted to determine the number of viable cells after 24, 48 and 72 h transfection. Tubastatin A-treated or HDAC6 KD MDA-MB-231 (e and f) or MDA-MB-468 (g and h) cells were subjected to WB analysis for CASP3. Tubastatin A-treated or HDAC6 KD MDA-MB-231 (i and j) or MDA-MB-468 (k and l) cells were stained with ANXA5-7-AAD and then analyzed by flow cytometry for the detection of apoptotic cells. Statistical analysis was performed with two-tailed, Student’s t-test with 95% confidence interval; *P-values = 0.05 obtained by comparing the respective data with the untreated or scrambled control.
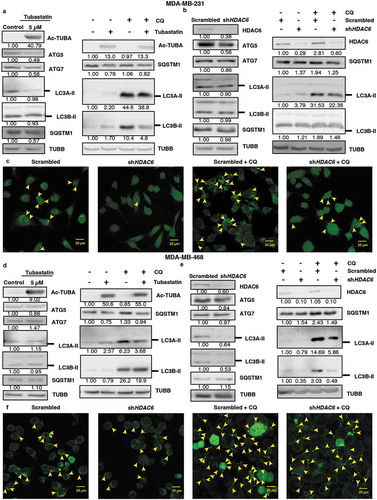
Next, we determined whether HDAC6 also differentially regulates autophagy in differentiated cancer cells. As shown in , and in contrast to the results observed in CSCs, treatment with tubastatin A or KD of HDAC6 in MDA-MB-231 and MDA-MB-468 breast cancer cells either decreased or had no effect on the levels of autophagy-related proteins ATG5, ATG7, or LC3A/B-II in breast cancer cells compared to the nontreated or scrambled controls (). Moreover, SQSTM1 levels remained unchanged following tubastatin A treatment or HDAC6 KD in these differentiated breast cancer cells, and treatment with CQ did not increase the expression of SQSTM1 or LC3A/B-II levels in tubastatin A-treated or HDAC6 KD cells compared to CQ treatment alone. In support of the WB data, confocal analysis of MDA-MB-231 and MDA-MB-468 cells also showed that fewer numbers of GFP-LC3 puncta were present with HDAC6 KD with or without CQ treatment, compared to the respective controls ( and S8(a,b)). Collectively these results showed that HDAC6 differentially regulates apoptosis and autophagy in differentiated cancer cells, as compared to that observed in CSCs.
Figure 6. HDAC6 inhibition or KD inhibit autophagy in MDA-MB-231 and MDA-MB-468 cells. (a) MDA-MB-231 tubastatin A-treated cells were subjected to western blot analysis for ATG5, ATG7 LC3A-II, LC3B-II and SQSTM1 and treated with 18 µM chloroquine (CQ), and the levels of SQSTM1, and LC3-II were analyzed by WB analysis. (b) MDA-MB-231 HDAC6 KD cells were subjected to WB analysis for ATG5, ATG7, LC3A-II and LC3B-II and SQSTM1 and scrambled control or shHDAC6 KD cells were treated with 18 µM chloroquine (CQ) and the levels of SQSTM1, and LC3-II were analyzed by WB analysis. (c) MDA-MB-231 HDAC6 KD cells were transfected with GFP-LC3-overexpressing plasmid and treated with chloroquine (CQ) and puncta formation was analyzed by confocal microscopy. Arrowheads indicate examples of GFP-LC3 puncta. (d) MDA-MB-468 tubastatin A-treated cells were subjected to western blot analysis for ATG5, ATG7, LC3A-II, LC3B-II and SQSTM1 and treated with 18 µM chloroquine (CQ) and the levels of SQSTM1, and LC3-II were analyzed by WB analysis. (e) MDA-MB-468 HDAC6 KD cells were subjected to WB analysis for ATG5, ATG7, LC3A-II, LC3B-II and SQSTM1 and scrambled control or shHDAC6 KD cells were treated with 18 µM chloroquine (CQ) and the levels of SQSTM1, and LC3-II were analyzed by WB analysis. (f) MDA-MB-468 HDAC6 KD cells were transfected with GFP-LC3-overexpressing plasmid and treated with chloroquine (CQ) and puncta formation was analyzed by confocal microscopy.
HDAC6 KD positively regulates p-MTOR signaling via the tuberous sclerosis complex in differentiated cancer cells
Because we observed that HDAC6 KD causes contrasting autophagic phenotypes in CSCs and differentiated breast cancer cells, we examined the MTOR signaling pathway in differentiated cancer cells as a possible mechanism by which HDAC6 KD differentially regulates autophagy. We found that, unlike CSCs, HDAC6 KD in breast cancer cells MDA-MB-231 and MDA-MB-468 slightly increased p-MTOR expression, with no change or decreased levels of total MTOR (). This differential regulation of p-MTOR expression provides an explanation for the contrasting effect of HDAC6 KD on the regulation of autophagy in CSCs and breast cancer cells, and further highlights the differences between CSC and cancer cell biology.
Figure 7. HDAC6 KD differentially regulates p-MTOR and the tuberous sclerosis complex in MDA-MB-231 and MDA-MB-468 breast cancer cells. (a-d) MDA-MB-231 and MDA-MB-468 cells were subjected to western blot analysis for (a) p-MTOR, MTOR, (b) p-AKT, AKT, (c) TSC1, TSC2, (d) p-RPS6KB and p-EIF4EBP1.
Additionally, we examined the upstream regulators of MTOR in differentiated cancer cells to determine how those molecular players affect p-MTOR expression compared to CSCs. Similar to the regulation that occurs in CSCs, HDAC6 KD in differentiated cancer cells (MDA-MB-231 and MDA-MB-468) led to decreased phosphorylation of AKT at Ser473 (). These results lend hand to the hypothesis that the differential regulation of MTOR phosphorylation in HDAC6 KD CSCs and differentiated breast cancer cells must occur downstream of p-AKT. Indeed, while HDAC6 KD in NT2/D1 and P19 CSCs increased the levels of TSC1 and TSC2 (), the same HDAC6 KD in MDA-MB-231 and MDA-MB-468 breast cancer cells decreased TSC1 and TSC2 levels (). These data demonstrate that HDAC6 KD-mediated regulation of p-MTOR occurs through differential manipulation of tuberous sclerosis complex levels in CSCs and differentiated cancer cells in an AKT-independent manner.
Moreover, we found that HDAC6 KD in differentiated cancer cells also exhibited differential effects on the downstream effectors of p-MTOR. HDAC6 KD increased RPS6KB and EIF4EBP1 phosphorylation in MDA-MB-231 and MDA-MB-468 breast cancer cells (), consistent with our observations that MTOR phosphorylation and activity is increased in these cells. In summary, these data reveal that HDAC6-mediated differential regulation of autophagy in stem-like versus differentiated cancer cells is governed through contrasting negative regulation of p-MTOR via the tuberous sclerosis complex.
HDAC6 KD differentially regulates autophagy in non-stem like HMLER breast cancer cells versus HMLERshECad breast cancer stem cells (BCSCs)
Moving forward, we wished to directly compare the differential effect of HDAC6 inhibition in non-stem like cancer cells versus stem-like cancer cells from the same isogenic background. For this purpose, we utilized the well-characterized model of breast cancer stem cell transformation, where EMT was induced in the human mammary epithelial breast cancer cell line HMLER by silencing of CDH1/E-cadherin to produce the HMLERshECad breast cancer stem-like cell (BCSC) line [Citation34,Citation35]. Similar to MDA-MB-231 and MDA-MB-468 breast cancer cells, HDAC6 KD in the non-stem cell HMLER breast cancer cell line upregulated CASP3 and promoted the cleavage of PARP () but had no effect on the levels of RIPK3 (Figure S9(a)), indicating an increase in apoptosis but not in necroptosis. In contrast, HDAC6 KD in HMLERshECad BCSCs did not increase CASP3 levels (), similar to our observations in NT2/D1and P19 CSCs. Furthermore, treatment with CQ in differentiated HDAC6 KD HMLER breast cancer cells did not increase the expression of SQSTM1 or LC3A/B-II levels as compared to CQ in scrambled control (), indicating no upregulation of autophagy, whereas the levels of SQSTM1 and LC3A/B-II were enhanced following CQ treatment in HDAC6 KD HMLERshECad BCSCs compared to CQ in scrambled control (). These findings were further corroborated by GFP-LC3 puncta formation ( and S9(b,c)).
Figure 8. HDAC6 KD in HMLERshECad breast cancer stem cells (BCSCs) promotes autophagy by inhibition of p-MTOR via the tuberous sclerosis complex. (a) HMLER and (b) HMLERshECad HDAC6 KD cells were subjected to western blot analysis for Pro-CASP3 and cleaved CASP3. Numbers below the blots correspond to densitometry quantification of blots normalized to the loading control. (c) HMLER and (d) HMLERshECad cells with either scrambled control or shHDAC6 shRNA were treated with 18 µM chloroquine (CQ) and the levels of SQSTM1, and LC3-II were analyzed by WB analysis. (e) HMLER and (f) HMLERshECad HDAC6 KD cells were transfected with GFP-LC3-overexpressing plasmid and treated with chloroquine (CQ) and puncta formation was analyzed by confocal microscopy. Arrowheads indicate examples of GFP-LC3 puncta. (g) HMLER and (h) HMLERshECad HDAC6 KD cells were subjected to analysis for p-MTOR, MTOR, p-AKT and AKT. (i) HMLER and (j) HMLERshECad HDAC6 KD cells were subjected to analysis for TSC1 and TSC2. (k) HMLER and (l) HMLERshECad HDAC6 KD cells were subjected to analysis for p-RPS6KB and p-EIF4EBP1.
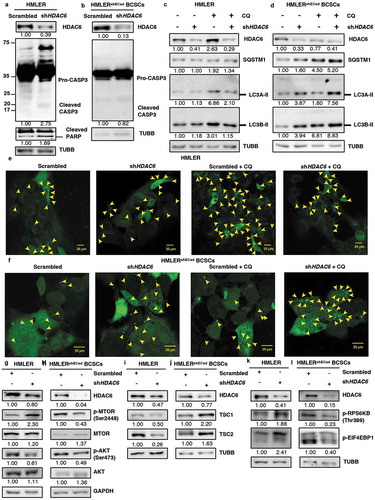
The differential effect of HDAC6 KD in differentiated HMLER cells and stem-like HMLERshECad breast cancer cells was also apparent by the contrasting regulation of upstream regulators of autophagy. In differentiated HMLER breast cancer cells, HDAC6 KD increased MTOR phosphorylation at S2448 () which was accompanied by a downregulation of TSC1 and TSC2 () and a decrease in the downstream mediators of p-MTOR signaling, p-RPS6KB and p-EIF4EBP1 (); whereas HDAC6 KD in HMLERshECad cells inhibited p-MTOR () along with p-RPS6KB and p-EIF4EBP1 () while promoting the expression of TSC1 and TSC2 (). Similar to findings in NT2/D1, P19, MDA-MB-231 and MDA-MB-468 cells, HDAC6 KD suppressed AKT phosphorylation at S473 in both HMLER and HMLERshECad cells (), further supporting the notion that the differential regulation of p-MTOR is dependent on TSC1 and TSC2, independent of p-AKT. Taken together, and as summarized in Figure S10, our data demonstrates that HDAC6 differentially regulates autophagy in differentiated versus cancer stem-like cells.
Discussion
HDAC6 is a class II histone deacetylase involved in various biological functions that are of interest in cancers, including transcription regulation, motility, and cell cycle progression [Citation55]. Overexpression of HDAC6 has been detected in a variety of cancer cell lines such as ovarian, prostate epithelial, and oral squamous cells [Citation14,Citation15,Citation19,Citation56]. Whereas its expression has been linked to improved survival of some cancers [Citation13,Citation20], few studies have investigated the specific roles of HDAC6 in CSC pluripotency. Studies specifically focusing on CSCs are of value because unlike differentiated cancer cells which comprise the majority of tumors, CSCs are more resistant to therapy and, due to their pluripotency [Citation2], survival of even one single CSC is sufficient to regenerate the tumor [Citation57–Citation60]. Considering HDAC6’s ability to regulate the tumorigenicity of cancers, and in the context of currently on-going clinical trials employing HDAC inhibitors for cancer treatment, we wanted to comprehensively analyze the effect of HDAC inhibition on pluripotency of CSCs. Thus, we began our study by inhibiting or knocking down HDAC6 in CSCs and determined the ability of HDAC6 to regulate pluripotency factors (i.e., POU5F1, NANOG and SOX2).
Here we showed that HDAC6 is critical in maintaining the pluripotency of CSCs via POU5F1. There is abundant evidence supporting the role of POU5F1 as a master regulator of pluripotency, which is demonstrated by the ability of POU5F1 to confer pluripotency to somatic cells [Citation28,Citation60]. Additionally, the dependency on POU5F1 by embryonic stem cells (ESCs) has been illustrated in POU5F1 KD ESCs, which show decreased stem cell properties characterized by a decreased proliferation rate [Citation61,Citation62]. We demonstrated that in CSCs, HDAC6 regulates both the protein and mRNA levels of POU5F1. In fact, our proteomics data showed that POU5F1 was among the top targets regulated by our manipulations of HDAC6. These findings suggest the pluripotency factor POU5F1 can be targeted through therapeutic modulation of HDAC6.
Accompanying the loss of pluripotency in HDAC6 KD cells was an increase in differentiation. In addition to the upregulation of common differentiation markers, we determined that HDAC6 also controls the levels of ACTB, an important regulator of differentiation. While HDAC6 is known to modulate cytoskeleton dynamics via deacetylation of tubulins and actin-associated proteins [Citation63,Citation64], here we report that HDAC6 KD enhances the stability of ACTB by inhibiting its proteasomal degradation. ACTB is an important cytoskeleton component and has an integral role in epidermal stem cell differentiation as well as cell fate by affecting cellular architecure [Citation65]. Our morphological observations of HDAC6 KD cells are consistent with these data and further support the regulation of differentiation by HDAC6. Importantly, we observed that induction of differentiation via classical manipulations (KD of POU5F1) or by autophagy KD led to decreased HDAC6 expression in CSCs. These findings unveil a role for HDAC6 in CSCs to maintain their undifferentiated state.
In this study, we noted an important observation concerning the contrasting effect of HDAC6 inhibition on apoptosis in CSCs versus differentiated cancer cells. Previous studies inhibiting HDAC6 in multiple myeloma cells using tubacin or knocking down HDAC6 in cervical carcinoma cells using siRNA show inhibition of proliferation and induction of apoptosis [Citation66,Citation67]. Our data are consistent with these studies in that the inhibition or KD of HDAC6 inhibits cell proliferation in both CSCs and differentiated cancer cells. However, while tubastatin A-treated HDAC6 CSCs showed apoptosis, HDAC6 shRNA KD cells did not appear to undergo cell death. This prompted us to distinguish the role of apoptosis following tubastatin A treatment in CSCs. By inhibiting apoptosis in the tubastatin A-treated CSCs, we determined that the HDAC6-related effects on pluripotency and differentiation were unaffected. These results highlight that HDAC6 inhibitor-mediated effects on pluripotency are independent of apoptosis, and also point towards the involvement of another process in HDAC6-related effects on CSCs.
Tumor masses are comprised of heterogeneous cells, which includes populations of differentiated cells, along with poorly differentiated CSCs. These CSCs have the ability to undergo multi-lineage differentiation, as their progeny can commit to various lineages. Thus, cancers with their heterogeneous constituents can show differential response to the same therapeutic strategy, and thus must be considered when designing effective treatments [Citation68]. In this study, the differential induction of autophagy in differentiated and CSCs supports the existence of heterogeneous populations of cells in tumors, and also advocates for differential therapeutic strategies against these different populations. An important finding in this paper expands on our recent publication highlighting how basal autophagy levels in CSCs are crucial to maintain pluripotency [Citation11]. In our quest to find the mechanism linked with HDAC6-related decrease in pluripotency, we focused on autophagy. Here, we have also found that inhibition or KD of HDAC6 disturbs autophagy levels in CSCs by activating autophagic machinery as shown by an increase in autophagic flux, thereby inducing their loss of pluripotency and decreasing cell proliferation. Furthermore, this is in line with the existing paradigm regarding the plasticity of CSCs, which describes that there are small populations of autophagic/quiescent stem cells that are more primitive but can proliferate and differentiate under appropriate stimuli [Citation69]. On the contrary, we found that HDAC6 inhibition or KD in the more differentiated breast cancer cell lines inhibited cell growth by downregulating autophagy and promoting apoptosis. Thus, our findings uncovered that HDAC6 inhibition or KD differentially regulates autophagy and apoptosis in differentiated cancer cell lines as compared to that observed in CSCs.
We discovered that HDAC6-mediated differential regulation of autophagy in CSCs versus differentiated cancer cells stemmed from contrasting p-MTOR activation following HDAC6 inhibition. MTOR is a major regulator of cell growth in response to energy and nutrient supply. When activated, p-MTOR inhibits the autophagic breakdown of cellular constituents and promotes the translation and synthesis of proteins and macromolecules to promote cellular growth and proliferation [Citation47]. A major negative regulator of p-MTOR is the tuberous sclerosis tumor suppressor complex, which is often inhibited in rapidly proliferating tumor cells [Citation49]. We found that HDAC6 KD differentially regulates the levels of the tuberous sclerosis complex proteins TSC1 and TSC2 in CSCs and differentiated cancer cells in an AKT-independent manner. In CSCs, HDAC6 KD increases TSC1 and TSC2 levels, thereby decreasing p-MTOR activation and hence increasing autophagy and inhibiting protein synthesis and cell growth. Moreover, our quantitative proteomics analysis revealed that HDAC6 KD in NT2/D1 cancer stem cells causes a huge downregulation in many ribosomal proteins. This observation offers another mechanism by which HDAC6 inhibits protein translation. A recent study by Artero-Castro et al. (2015) also showed that downregulation of ribosomal protein synthesis leads to stress-induced autophagy [Citation70]. Hence, it is possible that this downregulation of ribosomal protein synthesis, in combination with decreased p-MTOR activation, contributes to HDAC6 KD-induced autophagy in CSCs.
The findings from this study have important clinical implications. We found that further upregulation of autophagy in CSCs using autophagy-stimulating agents inhibited the growth of HDAC6 KD cells even more, suggesting that a combination of HDAC6-inhibiting and autophagy-stimulating drugs could be an effective strategy to target CSCs. Hence, our data presents autophagy as an important target for developing anticancer stem cell therapies. Given that a few HDAC inhibitors are approved for use in clinical applications but have shown disappointing results in solid tumors [Citation23], our findings propose that a combination of HDAC inhibitors and autophagy-manipulating drugs could be used to target the more resistant CSCs [Citation8,Citation9].
In conclusion, this study highlights that CSCs and cancer cells respond differently to HDAC6 inhibition or KD, and, in line with the most recent evidence [Citation71], advocate for differential therapeutic strategies against CSCs and differentiated cancer cells in clinical settings. Our findings also suggest that autophagy-related manipulations could not only arrest the growth of cancer cells but also limit the pluripotency of CSCs. These findings of clinical importance will stimulate further research on the use HDAC6 inhibitors and autophagy modulators (inducers or inhibitors) to achieve better efficacy against both CSCs and differentiated cancer cells [Citation72,Citation73].
Materials and methods
Cell culture
Human NTERA-2 (NT2/D1; ATCC, CRL1973), murine P19 (ATCC, CRL-1825) teratocarcinoma, MDA-MB-231 and MDA-MB-468 cells were maintained in Dulbecco’s Modified Eagle’s medium (DMEM; Thermo Fisher Scientific, 12430–054). The medium was supplemented with 1% penicillin-streptomycin (Thermo Fisher Scientific, 15240–062), 1% non-essential amino acids (Thermo Fisher Scientific, 11140–050) and 10% heat-inactivated fetal bovine serum (Thermo Fisher Scientific, 12483–020). HMLER and HMLERshECad cells were a gift from Dr. Robert Weinberg (Whitehead Institute for Biomedical Research, Ludwig/MIT Center for Molecular Oncology, and MIT Department of Biology, Cambridge, MA, USA). HMLER cells were maintained in DMEM F12 while HMLERshECad cells were maintained in serum-free HUMEC Ready Media (Gibco, 12735–018). Cells were maintained at 37°C in a humidified atmosphere of 5% CO2 and 95% air.
Generation of knockdowns
HDAC6, POUF51/OCT4, ATG7 and ATG12 KDs were generated using lentiviral plasmids expressing shRNAs specific against human HDAC6 (Dharmacon, RHS4533-EG10013, accessions: NM_001321225.1, clone ID: TRCN0000004839, TRCN0000004840, TRCN0000004841, TRCN0000004842 and TRCN0000004843), mouse Hdac6 (Dharmacon, RMM4534-EG15185, accessions: NM NM_001130416.1, clone ID: TRCN0000008414, TRCN0000008415 and TRCN0000008417), Pouf51/Oct4 (Dharmacon, RHS4533-EG7161, accessions: NM_001126240, NM_001126242, NM_005427, clone ID: TRCN0000004879, TRCN0000004880, TRCN0000004881 and TRCN0000004883), ATG7 (Dharmacon, RHS39379-201739857, accession no.: NM_006395, Noclone ID: TRCN0000007584 and TRCN0000007587), and ATG12 (Dharmacon, RHS3979-201739663, accession no.: NM_004707, Noclone ID: TRCN0000007392). The 293T cells were cotransfected with the plasmid of interest together with the packaging (psPAX2; Addgene, 12260, deposited by Didier Trono) and envelope vector (pMD2.G; Addgene, 12259, deposited by Didier Trono) using the calcium phosphate transfection method [Citation74]. NT2/D1 cells (5 x 10⁵) were subcultured onto 35-mm wells 24 h prior to transduction with lentivirus. The following day, cells were selected with 2 μg/ml puromycin (Thermo Fisher, A11138-03) for 2 d.
Treatment protocols, protein extraction and western blot assay
Actively growing cells were treated with tubastatin A (Sellekchem, S8049), Tat-Beclin 1 peptide, rapamycin (Sigma-Aldrich Corporation, R0395), chloroquine (Sigma-Aldrich Corporation, C6628), and MG132 (Merck Millipore, 474790) at different concentrations or with the vehicle and incubated for the times indicated. For peptide treatment, cells were treated with 10 µM of Tat-scrambled (Novus Biologicals, NBP2-49887) or Tat-Beclin 1 peptide (Novus Biologicals, NBP2-49888) for 24 h34. Cells were then harvested and centrifuged at 200 g for 10 min at room temperature; the pellets were resuspended in RIPA buffer (25 mM Tris, pH 7.6, 150 mM NaCl, 1% IGEPAL [Sigma-Aldrich Corporation, I8896], 1% sodium deoxycholate [Sigma-Aldrich Corporation, D6750], 0.1% SDS [Sigma-Aldrich Corporation, L3771]) containing protease inhibitors (Thermo Fisher Scientific, 78434) and incubated on ice. The cell suspensions were then sonicated and the supernatants were collected after centrifugation at 10,000 g for 15 min. Protein concentrations were determined using the Micro BCA protein assay kit (Thermo Fisher Scientific, 23235). For western blot analysis, proteins were resolved on SDS-polyacrylamide gels and transferred onto nitrocellulose membranes (Bio-Rad Laboratories, 162–0115). Immunoblotting was then performed using specified antibodies. Cell death was measured using FITC-anti-ANAX5/Annexin-V (BioLegend, 640945) and 7-AAD (BioLegend, 420403) as per the manufacturer’s instructions.
Protein extraction and TMT labelling
Pelleted cells were lysed in 2% SDS, 150 mM NaCl, 50 mM Tris, pH 8.5 containing complete mini protease inhibitor mixture (1 tablet per 10 ml) (Sigma-Aldrich Corporation, 11836153001). Lysis was performed using a probe sonicator for 12 sec on ice. Lysates were cleared by centrifugation at 13 000 x g for 5 min and protein concentrations were determined using a BCA assay (Thermo Fisher, 23227). Cysteine residues were reduced using 5 mM dithiothreitol for 40 min at room temperature, then alkylated using 14 mM iodoacetamide for 40 min in the dark followed by methanol chloroform precipitation. Protein was resuspended in 8 M Urea, 50 mM Tris, pH 8.8 and protein concentration was assessed using a BCA assay. Aliquots containing 100 μg of protein were diluted to 1 M urea, 50 mM HEPES, pH 8.5 and digested overnight with trypsin (Promega, V5111) at a ratio of 1:100 trypsin:protein, then again at a ratio of 1:100 trypsin:protein for 4 h. Digested peptides were desalted using 60 mg solid-phase C18 extraction cartridges (Waters, WAT054955) and lyophilized. Dried peptides were labelled using 10-plex TMT reagents (Thermo Fisher, 90110) as previously described [Citation75]. Samples were mixed equally, desalted using solid-phase C18 extraction cartridges, and lyophilized [Citation37].
2D-LC-SPS-MS3
TMT10-labeled samples were fractionated using high-pH reversed phase chromatography performed with an Onyx monolithic 100 × 4.6 mm C18 column (Phenomenex). The flow rate was 800 μL/min and a gradient of 5% to 40% acetonitrile (10 mM ammonium formate, pH 8) was applied over 60 min using an Agilent 1100 pump (Agilent) from which 12 fractions were collected. Fractions were desalted using homemade stage-tips as previously described [Citation76] and lyophilized. Each fraction was analyzed using an Orbitrap Velos Pro mass spectrometer (Thermo Fisher) using an MS3 method as previously described [Citation77]. Protein identification was performed using a database search against a human proteome database (downloaded from UniprotKB, September, 2014) concatenated to a database of common proteomic contaminants. All FDR filtering and protein quantification was performed as previously described [Citation75]. Data and analysis for all proteins detected by 2D-LC-SPS-MS3 is present in Table S1 for tubastatin A treatment and Table S2 for HDAC6 KD.
Cell viability assays
To monitor cell growth and viability, equal numbers of cells from each sample were seeded in 6-well plates containing 2 mL of culture medium. After 24-h incubation, cells were treated with chemicals at the indicated concentrations. Adherent cells were dissociated at the indicated times with 0.05% trypsin-EDTA and then counted by trypan blue dye exclusion. The numbers of viable cells are presented as mean ± S.E.M of 3 replicates for each sample.
Proliferation assay
The effect of tubastatin A or HDAC6 KD on cell proliferation was monitored by using an MTS assay. Briefly, equal numbers of cells were seeded in 96-well plates. After 24 h of incubation, cell were treated with tubastatin A at the indicated concentration or left untreated (in the case of HDAC6 KD). MTS reagent (20 µl; Promega Corporation, G3580) was added into each well after 24-h treatment with tubastatin A, and the quantity of formazan product was quantified 2 h later by measuring the absorbance at 490 nm with a 96-well plate reader.
Senescence detection
Senescence was detected by using the senescence β-Galactosidase staining kit (Cell Signaling Technology, 9860) following the manufacturer’s protocol. Briefly, the growth media was removed from the cells and the plate was washed one time with 1X PBS (Thermo Fisher Scientific, 10010023). Cells were fixed with the 1X fixative solution and incubated for 15 min at room temperature. After the incubation, the plate was rinsed 2 times with 1X PBS and 1 mL of the β-galactosidase staining solution was added to each plate. All the plates were sealed with parafilm and incubated at 37°C in a dry incubator. After the final incubation, the images were captured using a microscope.
Autophagy puncta formation assay
For puncta formation, cells were plated on coverslips and transfected with 1 µg/ml of EGFP-LC3 plasmid (Addgene, 11546; deposited by Karla Kirkegaard) 24 h prior to CQ (Sigma-Aldrich Corporation, C6628) treatment. After 25 h, cells were fixed using 4% paraformaldehyde and mounted using mounting medium (Dako, S3023).
Antibodies and chemicals
Antibodies against the following proteins were used for immunobloting: HDAC6 (Cell Signaling Technology, 7612), POU5F1 (Santa Cruz Biotechnology, sc-5279), SOX2 (Cell Signaling Technology, 2748), NANOG (Santa Cruz Biotechnology, sc-134218), ATG5 (Cell Signaling Technology, 8540), ATG7 (Cell Signaling Technology, 8558), ATG12 (Cell Signaling Technology, 4180), LC3A (Cell Signaling Technology, 4599), LC3B (Cell Signaling Technology, 3868), SQSTM1/p62 (Cell Signaling Technology, 5114), p-AKT (Cell Signaling Technology, 4060), p-MTOR (Santa Cruz Biotechnology, sc-101738), p-TSC2 (Cell Signaling Technology, 8350), TSC2 (Cell Signaling Technology, 4308), p-EIF4EBP1/4EBP1 (Cell Signaling Technology, 9459), RPS6KB/p70S6K (Cell Signaling Technology, 9205), ubiquitin (Santa Cruz Biotechnology, sc-8017), RIPK3 (Cell Signaling Technology, 13526), GAPDH (Santa Cruz Biotechnology, sc-365062), ACTB (Santa Cruz Biotechnology, sc-47778), and TUBB (Cell Signaling Technology, 2146), CASP3 (Cell Signaling Technology, 9662), PARP (Santa Cruz Biotechnology, sc-8007).
Quantitative real-time PCR analysis
RNA was extracted using Trizol (Invitrogen, 15596026) methodology and cDNA was synthesized using the enzyme Superscript II (Thermo Fisher Scientific, 180640140). Each sample of cDNA was quantified and diluted to a similar concentration of 10 ng/mL. The Bio-Rad CFX96 PCR machine was used for the quantitative real-time PCR (qRT-PCR), using Bio-Rad SYBR Green Supermix (Bio-Rad Laboratories, 1708880). All primers, as described in Table S3, were purchased from Invitrogen. GAPDH was used for normalization of the genes of interest. The results were collected and analyzed using the 2−ΔΔCT method and expressed as fold change relative to the respective nontreated or scrambled controls.
Statistical analysis
All values are expressed as means ± S.E.M. of 3 independent experiments. Statistical evaluation was performed using the two-tailed, Student’s t-test with 95% confidence interval. P < 0.05 was considered as significant.
Abbreviations
| ACTB | = | actin beta |
| ANXA5 | = | annexin V |
| BCSCs | = | breast cancer stem cells |
| BECN1 | = | beclin 1 |
| CASP3 | = | caspase 3 |
| CDH1 | = | cadherin 1/E-cadherin |
| CSC | = | cancer stem cells |
| CSN2 | = | casein beta |
| CQ | = | chloroquine |
| EIF4EBP1 | = | Eukaryotic translation initiation factor 4E binding protein 1 |
| GATA6 | = | GATA binding protein 6 |
| GFP | = | green fluorescent protein |
| HCQ | = | hydroxycholorquine |
| HDAC6 | = | histone deacetylase 6 |
| KD | = | knock-down |
| MAP1LC3A/LC3A | = | microtubule associated protein 1 light chain 3 alpha |
| MAP1LC3B/LC3B | = | microtubule associated protein 1 light chain 3 beta |
| MTOR | = | mammalian target of rapamycin |
| NANOG | = | homeobox protein NANOG |
| PARP | = | poly(ADP-ribose) polymerase |
| POU5F1/Oct4 | = | POU Class 5 Homeobox 1 |
| RIPK3 | = | Receptor for interacting serine/threonine kinase 3 |
| RPS6KB | = | ribosomal protein S6 kinase B |
| SOX2 | = | SRY-Box 2 |
| SPP1 | = | secreted phosphoprotein 1 |
| SQSTM1 | = | sequestome 1 |
| TBXT | = | T-box transcription factor T |
| TSC1 | = | tuberous sclerosis complex 1 |
| TSC2 | = | tuberous sclerosis complex 2 |
| TUBA | = | tubulin alpha |
| TUBB | = | tubulin beta class I |
| TUBB3 | = | tubulin beta 3 class III |
Supplemental Material
Download Zip (13.2 MB)Acknowledgments
This work was supported by grants from the Canadian Institute of Health Research (CIHR), from the Canadian Breast Cancer Foundation – Atlantic (CBCF), and Breast Cancer Society of Canada (BCSC)/QEII Foundation Awards for Breast Cancer Research through Beatrice Hunter Cancer Research Institute (BHCRI) to SAG and PWKL. TS is supported by the CIHR. PJM is supported through the post-doctoral fellowship from Cancer Research Training Program (CRTP) of BHCRI. MH is a trainee in the CRTP of BHCRI, with funds provided by a CIBC Graduate Scholarship in Medical Research. EM and CD were recipients of the BHCRI studentship award from BHCRI. SAG is supported by Dalhousie Medical Research Foundation (DMRF).
Disclosure statement
No potential conflict of interest was reported by the authors.
Supplementary material
Supplementary data for this article can be accessed here.
Additional information
Funding
Related Research Data
References
- Polyak K, Hahn WC. Roots and stems: stem cells in cancer. Nat Med. 2006 Mar;12(3):296–300. PubMed PMID: 16520777.
- Dean M. Cancer stem cells: implications for cancer causation and therapy resistance. Discov Med. 2005 Jun;5(27):278–282. PubMed PMID: 20704888.
- Clevers H. The cancer stem cell: premises, promises and challenges. Nat Med. 2011 Mar;17(3):313–319. PubMed PMID: 21386835.
- Huang J, Klionsky DJ. Autophagy and human disease. Cell Cycle. 2007 Aug 1;6(15):1837–1849. PubMed PMID: 17671424.
- Levy JMM, Towers CG, Thorburn A. Targeting autophagy in cancer. Nat Rev Cancer. 2017 Sep;17(9):528–542. PubMed PMID: 28751651.
- Kimmelman AC, White E. Autophagy and tumor metabolism. Cell Metab. 2017 May 02;25(5):1037–1043. PubMed PMID: 28467923; PubMed Central PMCID: PMCPMC5604466.
- Mathew R, Karantza-Wadsworth V, White E. Role of autophagy in cancer. Nat Rev Cancer. 2007 Dec;7(12):961–967. PubMed PMID: 17972889; PubMed Central PMCID: PMCPMC2866167.
- Janku F, McConkey DJ, Hong DS, et al. Autophagy as a target for anticancer therapy. Nat Rev Clin Oncol. 2011 May 17;8(9):528–539. PubMed PMID: 21587219.
- Levine B, Packer M, Codogno P. Development of autophagy inducers in clinical medicine. J Clin Invest. 2015 Jan;125(1):14–24. PubMed PMID: 25654546; PubMed Central PMCID: PMCPMC4382267.
- Manic G, Obrist F, Kroemer G, et al. Chloroquine and hydroxychloroquine for cancer therapy. Mol Cell Oncol. 2014;1(1):e29911. PubMed PMID: 27308318; PubMed Central PMCID: PMCPMC4905171.
- Sharif T, Martell E, Dai C, et al. Autophagic homeostasis is required for the pluripotency of cancer stem cells. Autophagy. 2017; 13(2):264–284. PubMed PMID: 27929731; PubMed Central PMCID: PMC5324853.
- Pandey UB, Nie Z, Batlevi Y, et al. HDAC6 rescues neurodegeneration and provides an essential link between autophagy and the UPS. Nature. 2007 Jun 14;447(7146):859–863. PubMed PMID: 17568747.
- Zhang Z, Yamashita H, Toyama T, et al. HDAC6 expression is correlated with better survival in breast cancer. Clin Cancer Res. 2004 Oct 15;10(20):6962–6968. PubMed PMID: 15501975.
- Lee YS, Lim KH, Guo X, et al. The cytoplasmic deacetylase HDAC6 is required for efficient oncogenic tumorigenesis. Cancer Res. 2008 Sep 15;68(18):7561–7569. PubMed PMID: 18794144; PubMed Central PMCID: PMCPMC2978070.
- Sakuma T, Uzawa K, Onda T, et al. Aberrant expression of histone deacetylase 6 in oral squamous cell carcinoma. Int J Oncol. 2006 Jul;29(1):117–124. PubMed PMID: 16773191.
- Shan B, Yao TP, Nguyen HT, et al. Requirement of HDAC6 for transforming growth factor-beta1-induced epithelial-mesenchymal transition. J Biol Chem. 2008 Jul 25;283(30):21065–21073. PubMed PMID: 18499657; PubMed Central PMCID: PMCPMC2475688.
- Wang KH, Kao AP, Chang CC, et al. Increasing CD44+/CD24(-) tumor stem cells, and upregulation of COX-2 and HDAC6, as major functions of HER2 in breast tumorigenesis. Mol Cancer. 2010 Nov 02;9:288. PubMed PMID: 21044318; PubMed Central PMCID: PMCPMC2989327.
- Mak AB, Nixon AM, Kittanakom S, et al. Regulation of CD133 by HDAC6 promotes beta-catenin signaling to suppress cancer cell differentiation. Cell Rep. 2012 Oct 25;2(4):951–963. PubMed PMID: 23084749; PubMed Central PMCID: PMCPMC3590846.
- Bradbury CA, Khanim FL, Hayden R, et al. Histone deacetylases in acute myeloid leukaemia show a distinctive pattern of expression that changes selectively in response to deacetylase inhibitors. Leukemia. 2005 Oct;19(10):1751–1759. PubMed PMID: 16121216.
- Jung KH, Noh JH, Kim JK, et al. Histone deacetylase 6 functions as a tumor suppressor by activating c-Jun NH2-terminal kinase-mediated beclin 1-dependent autophagic cell death in liver cancer. Hepatology. 2012 Aug;56(2):644–657. PubMed PMID: 22392728.
- Lee JY, Koga H, Kawaguchi Y, et al. HDAC6 controls autophagosome maturation essential for ubiquitin-selective quality-control autophagy. Embo J. 2010 Mar 03;29(5):969–980. PubMed PMID: 20075865; PubMed Central PMCID: PMCPMC2837169.
- Zhu T, Zhao D, Song Z, et al. HDAC6 alleviates prion peptide-mediated neuronal death via modulating PI3K-Akt-mTOR pathway. Neurobiol Aging. 2016 Jan;37:91–102. PubMed PMID: 26507311.
- West AC, Johnstone RW. New and emerging HDAC inhibitors for cancer treatment. J Clin Invest. 2014 Jan;124(1):30–39. PubMed PMID: 24382387; PubMed Central PMCID: PMCPMC3871231.
- Marchion D, Munster P. Development of histone deacetylase inhibitors for cancer treatment. Expert Rev Anticancer Ther. 2007 Apr;7(4):583–598. PubMed PMID: 17428177.
- Valente S, Mai A. Small-molecule inhibitors of histone deacetylase for the treatment of cancer and non-cancer diseases: a patent review (2011–2013). Expert Opin Ther Pat. 2014 Apr;24(4):401–415. PubMed PMID: 24397271.
- Ceccacci E, Minucci S. Inhibition of histone deacetylases in cancer therapy: lessons from leukaemia. Br J Cancer. 2016 Mar 15;114(6):605–611. PubMed PMID: 26908329; PubMed Central PMCID: PMCPMC4800301.
- Santo L, Hideshima T, Kung AL, et al. Preclinical activity, pharmacodynamic, and pharmacokinetic properties of a selective HDAC6 inhibitor, ACY-1215, in combination with bortezomib in multiple myeloma. Blood. 2012 Mar 15;119(11):2579–2589. PubMed PMID: 22262760; PubMed Central PMCID: PMCPMC3337713.
- Takahashi K, Yamanaka S. Induction of pluripotent stem cells from mouse embryonic and adult fibroblast cultures by defined factors. Cell. 2006 Aug 25;126(4):663–676. PubMed PMID: 16904174.
- Lin Y, Yang Y, Li W, et al. Reciprocal regulation of Akt and Oct4 promotes the self-renewal and survival of embryonal carcinoma cells. Mol Cell. 2012 Nov 30;48(4):627–640. PubMed PMID: 23041284; PubMed Central PMCID: PMCPMC3601782.
- Kim BS, Lee CH, Chang GE, et al. A potent and selective small molecule inhibitor of sirtuin 1 promotes differentiation of pluripotent P19 cells into functional neurons. Sci Rep. 2016 Sep 29;6:34324. PubMed PMID: 27680533; PubMed Central PMCID: PMCPMC5041152.
- Sharif T, Auger C, Bronner C, et al. Selective proapoptotic activity of polyphenols from red wine on teratocarcinoma cell, a model of cancer stem-like cell. Invest New Drugs. 2011 Apr;29(2):239–247. PubMed PMID: 19943082.
- Silvan U, Diez-Torre A, Arluzea J, et al. Hypoxia and pluripotency in embryonic and embryonal carcinoma stem cell biology. Differentiation. 2009 Sep-Oct;78(2–3):159–168. PubMed PMID: 19604622.
- Tripathi R, Samadder T, Gupta S, et al. Anticancer activity of a combination of cisplatin and fisetin in embryonal carcinoma cells and xenograft tumors. Mol Cancer Ther. 2011 Feb;10(2):255–268. PubMed PMID: 21216935.
- Mani SA, Guo W, Liao MJ, et al. The epithelial-mesenchymal transition generates cells with properties of stem cells. Cell. 2008 May 16;133(4):704–715. PubMed PMID: 18485877; PubMed Central PMCID: PMCPMC2728032.
- Gupta PB, Onder TT, Jiang G, et al. Identification of selective inhibitors of cancer stem cells by high-throughput screening. Cell. 2009 Aug 21;138(4):645–659. PubMed PMID: 19682730; PubMed Central PMCID: PMCPMC4892125.
- Andrews PW. Retinoic acid induces neuronal differentiation of a cloned human embryonal carcinoma cell line in vitro. Dev Biol. 1984 Jun;103(2):285–293. PubMed PMID: 6144603.
- Weekes MP, Tomasec P, Huttlin EL, et al. Quantitative temporal viromics: an approach to investigate host-pathogen interaction. Cell. 2014 Jun 5;157(6):1460–1472. PubMed PMID: 24906157; PubMed Central PMCID: PMCPMC4048463.
- Park SW, Lim HY, Do HJ, et al. Regulation of human growth and differentiation factor 3 gene expression by NANOG in human embryonic carcinoma NCCIT cells. FEBS Lett. 2012 Sep 21;586(19):3529–3535. PubMed PMID: 22963770.
- Caricasole AA, van Schaik RH, Zeinstra LM, et al. Human growth-differentiation factor 3 (hGDF3): developmental regulation in human teratocarcinoma cell lines and expression in primary testicular germ cell tumours. Oncogene. 1998 Jan 08;16(1):95–103. PubMed PMID: 9467948.
- Vaz AP, Ponnusamy MP, Rachagani S, et al. Novel role of pancreatic differentiation 2 in facilitating self-renewal and drug resistance of pancreatic cancer stem cells. Br J Cancer. 2014 Jul 29;111(3):486–496. PubMed PMID: 25003666; PubMed Central PMCID: PMCPMC4119968.
- Escobar B, de Carcer G, Fernandez-Miranda G, et al. Brick1 is an essential regulator of actin cytoskeleton required for embryonic development and cell transformation. Cancer Res. 2010 Nov 15;70(22):9349–9359. PubMed PMID: 20861187.
- Tominaga M, Tomooka Y. Novel genes cloned from a neuronal cell line newly established from a cerebellum of an adult p53(-/-) mouse. Biochem Biophys Res Commun. 2002 Sep 27;297(3):473–479. PubMed PMID: 12270117.
- Ruggero D, Pandolfi PP. Does the ribosome translate cancer? Nat Rev Cancer. 2003 Mar;3(3):179–192. PubMed PMID: 12612653.
- Duncan EM, Muratore-Schroeder TL, Cook RG, et al. Cathepsin L proteolytically processes histone H3 during mouse embryonic stem cell differentiation. Cell. 2008 Oct 17;135(2):284–294. PubMed PMID: 18957203; PubMed Central PMCID: PMCPMC2579750.
- Vossaert L, Meert P, Scheerlinck E, et al. Identification of histone H3 clipping activity in human embryonic stem cells. Stem Cell Res. 2014 Jul;13(1):123–134. PubMed PMID: 24874291.
- Klionsky DJ, Abdelmohsen K, Abe A, et al. Guidelines for the use and interpretation of assays for monitoring autophagy (3rd edition). Autophagy. 2016 Jan 2;12(1):1–222. PubMed PMID: 26799652; Eng.
- Hay N, Sonenberg N. Upstream and downstream of mTOR. Genes Dev. 2004 Aug 15;18(16):1926–1945. PubMed PMID: 15314020.
- Nave BT, Ouwens M, Withers DJ, et al. Mammalian target of rapamycin is a direct target for protein kinase B: identification of a convergence point for opposing effects of insulin and amino-acid deficiency on protein translation. Biochem J. 1999 Dec 01;344 Pt 2:427–431. PubMed PMID: 10567225; PubMed Central PMCID: PMCPMC1220660.
- Inoki K, Li Y, Xu T, et al. Rheb GTPase is a direct target of TSC2 GAP activity and regulates mTOR signaling. Genes Dev. 2003 Aug 01;17(15):1829–1834. PubMed PMID: 12869586; PubMed Central PMCID: PMCPMC196227.
- Inoki K, Li Y, Zhu T, et al. TSC2 is phosphorylated and inhibited by Akt and suppresses mTOR signalling. Nat Cell Biol. 2002 Sep;4(9):648–657. PubMed PMID: 12172553.
- Goncharova EA, Goncharov DA, Eszterhas A, et al. Tuberin regulates p70 S6 kinase activation and ribosomal protein S6 phosphorylation. A role for the TSC2 tumor suppressor gene in pulmonary lymphangioleiomyomatosis (LAM). J Biol Chem. 2002 Aug 23;277(34):30958–30967. PubMed PMID: 12045200.
- Ng S, Wu YT, Chen B, et al. Impaired autophagy due to constitutive mTOR activation sensitizes TSC2-null cells to cell death under stress. Autophagy. 2011 Oct;7(10):1173–1186. PubMed PMID: 21808151.
- Fingar DC, Salama S, Tsou C, et al. Mammalian cell size is controlled by mTOR and its downstream targets S6K1 and 4EBP1/eIF4E. Genes Dev. 2002 Jun 15;16(12):1472–1487. PubMed PMID: 12080086; PubMed Central PMCID: PMCPMC186342.
- Debacq-Chainiaux F, Erusalimsky JD, Campisi J, et al. Protocols to detect senescence-associated beta-galactosidase (SA-betagal) activity, a biomarker of senescent cells in culture and in vivo. Nat Protoc. 2009;4(12):1798–1806. PubMed PMID: 20010931.
- Aldana-Masangkay GI, Sakamoto KM. The role of HDAC6 in cancer. J Biomed Biotechnol. 2011;2011:875824. PubMed PMID: 21076528; PubMed Central PMCID: PMCPMC2975074.
- Bazzaro M, Lin Z, Santillan A, et al. Ubiquitin proteasome system stress underlies synergistic killing of ovarian cancer cells by bortezomib and a novel HDAC6 inhibitor. Clin Cancer Res. 2008 Nov 15;14(22):7340–7347. PubMed PMID: 19010849; PubMed Central PMCID: PMCPMC2744414.
- O’Brien CA, Pollett A, Gallinger S, et al. A human colon cancer cell capable of initiating tumour growth in immunodeficient mice. Nature. 2007 Jan 4;445(7123):106–110. PubMed PMID: 17122772.
- Ricci-Vitiani L, Lombardi DG, Pilozzi E, et al. Identification and expansion of human colon-cancer-initiating cells. Nature. 2007 Jan 4;445(7123):111–115. PubMed PMID: 17122771.
- Lapidot T, Sirard C, Vormoor J, et al. A cell initiating human acute myeloid leukaemia after transplantation into SCID mice. Nature. 1994 Feb 17;367(6464):645–648. PubMed PMID: 7509044; eng.
- Blum B, Benvenisty N. The tumorigenicity of human embryonic stem cells. Adv Cancer Res. 2008;100:133–158. PubMed PMID: 18620095.
- Nichols J, Zevnik B, Anastassiadis K, et al. Formation of pluripotent stem cells in the mammalian embryo depends on the POU transcription factor Oct4. Cell. 1998 Oct 30;95(3):379–391. PubMed PMID: 9814708.
- Niwa H, Miyazaki J, Smith AG. Quantitative expression of Oct-3/4 defines differentiation, dedifferentiation or self-renewal of ES cells. Nat Genet. 2000 Apr;24(4):372–376. PubMed PMID: 10742100.
- Hubbert C, Guardiola A, Shao R, et al. HDAC6 is a microtubule-associated deacetylase. Nature. 2002 May 23;417(6887):455–458. PubMed PMID: 12024216.
- Zhang X, Yuan Z, Zhang Y, et al. HDAC6 modulates cell motility by altering the acetylation level of cortactin. Mol Cell. 2007 Jul 20;27(2):197–213. PubMed PMID: 17643370; PubMed Central PMCID: PMCPMC2684874.
- Connelly JT, Gautrot JE, Trappmann B, et al. Actin and serum response factor transduce physical cues from the microenvironment to regulate epidermal stem cell fate decisions. Nat Cell Biol. 2010 Jul;12(7):711–718. PubMed PMID: 20581838.
- Hideshima T, Bradner JE, Wong J, et al. Small-molecule inhibition of proteasome and aggresome function induces synergistic antitumor activity in multiple myeloma. Proc Natl Acad Sci U S A. 2005 Jun 14;102(24):8567–8572. PubMed PMID: 15937109; PubMed Central PMCID: PMCPMC1150844.
- Qin HX, Cui HK, Pan Y, et al. HDAC6 siRNA inhibits proliferation and induces apoptosis of HeLa cells and its related molecular mechanism. Asian Pac J Cancer Prev. 2012;13(7):3367–3371. PubMed PMID: 22994762.
- Tang DG. Understanding cancer stem cell heterogeneity and plasticity. Cell Res. 2012 Mar;22(3):457–472. PubMed PMID: 22357481; PubMed Central PMCID: PMCPMC3292302.
- Gupta PB, Chaffer CL, Weinberg RA. Cancer stem cells: mirage or reality? Nat Med. 2009 Sep;15(9):1010–1012. PubMed PMID: 19734877.
- Artero-Castro A, Perez-Alea M, Feliciano A, et al. Disruption of the ribosomal P complex leads to stress-induced autophagy. Autophagy. 2015;11(9):1499–1519. PubMed PMID: 26176264; PubMed Central PMCID: PMCPMC4590587.
- Yeo SK, Wen J, Chen S, et al. Autophagy differentially regulates distinct breast cancer stem-like cells in murine models via EGFR/Stat3 and Tgfbeta/Smad signaling. Cancer Res. 2016 Jun 01;76(11):3397–3410. PubMed PMID: 27197172; PubMed Central PMCID: PMCPMC4990205.
- Kondo Y, Kondo S. Autophagy and cancer therapy. Autophagy. 2006 Apr-Jun;2(2):85–90. PubMed PMID: 16874083.
- White E, DiPaola RS. The double-edged sword of autophagy modulation in cancer. Clin Cancer Res. 2009 Sep 01;15(17):5308–5316. PubMed PMID: 19706824; PubMed Central PMCID: PMCPMC2737083.
- Kingston RE, Chen CA, Rose JK. Calcium phosphate transfection. Curr Protoc Mol Biol. 2003 Aug. Chapter 9: Unit9 1. PubMed PMID: 18265332. DOI:10.1002/0471142727.mb0901s63
- Murphy JP, Stepanova E, Everley RA, et al. Comprehensive temporal protein dynamics during the diauxic shift in saccharomyces cerevisiae. Mol Cell Proteomics. 2015 Sep;14(9):2454–2465. PubMed PMID: 26077900; PubMed Central PMCID: PMCPMC4563728.
- Rappsilber J, Ishihama Y, Mann M. Stop and go extraction tips for matrix-assisted laser desorption/ionization, nanoelectrospray, and LC/MS sample pretreatment in proteomics. Anal Chem. 2003 Feb 1;75(3):663–670. PubMed PMID: 12585499.
- Ting L, Rad R, Gygi SP, et al. MS3 eliminates ratio distortion in isobaric multiplexed quantitative proteomics. Nat Methods. 2011 Nov;8(11):937–940. PubMed PMID: 21963607; PubMed Central PMCID: PMCPMC3205343.