
ABSTRACT
Macroautophagy/autophagy is a natural intracellular process that maintains cellular homeostasis and protects cells from death under stress conditions. Autophagy sustains tumor survival and growth when induced by common cancer treatments, including IR and cytotoxic chemotherapy, thereby contributing to therapeutic resistance of tumors. In this study, we report that the expression of MIR93, noted in two clinically relevant tumor subtypes of GBM, influenced GSC phenotype as well as tumor response to therapy through its effects on autophagy. Our mechanistic studies revealed that MIR93 regulated autophagic activities in GSCs through simultaneous inhibition of multiple autophagy regulators, including BECN1/Beclin 1, ATG5, ATG4B, and SQSTM1/p62. Moreover, two first-line treatments for GBM, IR and temozolomide (TMZ), as well as rapamycin (Rap), the prototypic MTOR inhibitor, decreased MIR93 expression that, in turn, stimulated autophagic processes in GSCs. Inhibition of autophagy by ectopic MIR93 expression, or via autophagy inhibitors NSC (an ATG4B inhibitor) and CQ, enhanced the activity of IR and TMZ against GSCs. Collectively, our findings reveal a key role for MIR93 in the regulation of autophagy and suggest a combination treatment strategy involving the inhibition of autophagy while administering cytotoxic therapy.
Abbreviations: ACTB: actin beta; ATG4B: autophagy related 4B cysteine peptidase; ATG5: autophagy related 5; BECN1: beclin 1; CL: classical; CQ: chloroquine diphosphate; CSCs: cancer stem cells; GBM: glioblastoma; GSCs: glioma stem-like cells; HEK: human embryonic kidney; IB: immunoblotting; IF: immunofluorescent staining; IR: irradiation; MAP1LC3/LC3: microtubule associated protein 1 light chain 3; MES: mesenchymal; MIR93: microRNA 93; MIRC: a control miRNA; miRNA/miR: microRNA; MTOR: mechanistic target of rapamycin kinase; NSC: NSC185085; PN: proneural; qRT-PCR: quantitative reverse transcription-polymerase chain reaction; Rap: rapamycin; SQSTM1/p62: sequestosome 1; TCGA: the cancer genome atlas; TMZ: temozolomide; WT: wild type; ZIP93: lentiviral miRZIP targeting MIR93; ZIPC: lentiviral miRZip targeting control miRNA
Introduction
Glioblastoma (GBM) represents the most prevalent and lethal primary tumor of the central nervous system [Citation1]. Gene expression profiling studies have shown that GBM can be classified in three transcriptionally-defined and clinically relevant subtypes: proneural (PN), mesenchymal (MES) and classical (CL) [Citation2]. However, individual GBM are far from being uniform, and single tumors exhibit substantial cellular heterogeneity that includes small subpopulations termed glioma stem-like cells (GSCs). GSCs have been shown to contribute to tumor initiation, malignant phenotypes, recurrence and therapy-resistance [Citation3]. Similar to bulk GBM tumors [Citation2], gene expression analysis has grouped patient-derived GSCs into the PN, CL, and MES subtypes [Citation4–Citation6]. Of these, MES GSCs are the most biologically aggressive and show heightened resistance to radiation [Citation5,Citation6]. High autophagic activity in MES GSCs relative to PN GSCs is also attributed to high tumorigenicity and therapy resistance of MES GSCs [Citation7].
Autophagy is an evolutionarily conserved process that maintains control of intracellular components through lysosome-mediated degradation. This provides a means to conserve energy, particularly in response to intrinsic and extrinsic stresses [Citation8,Citation9]. Upon autophagy initiation, more than 30 proteins, including autophagy-related proteins, orchestrate a multistep autophagic process that involves membrane remodeling and vesicular trafficking in four different stages: initiation/nucleation, elongation, maturation, and lysosome reformation [Citation10,Citation11]. At the first step, phosphatidylinositol triphosphate production by the class III phosphatidylinositol 3-kinase (PtdIns3K) in a complex with BECN1 is required for the biogenesis of autophagosome formation [Citation12]. Next, the double-membrane elongation of the phagophore (the autophagosome precursor) involves 2 sequential ubiquitin-like conjugation steps: one involving ATG12 (autophagy related 12)–ATG5 and the other involving MAP1LC3-II/LC3-II (microtubule associated protein 1 light chain 3-II) in mammals [Citation13]. The latter process is mediated by ATG4B (autophagy related 4B cysteine peptidase), which cleaves the precursor form of LC3 (pro-LC3). This event reveals a C-terminal glycine residue for conjugation with membrane-bound phosphatidylethanolamine, resulting an insertion of LC3-II into elongating autophagic membranes. This process is reversible because ATG4B also removes phosphatidylethanolamine from LC3-II and recycles LC3 [Citation14,Citation15]. LC3-II present on the inner surface of the phagophore membrane is bound with the autophagic receptor molecule SQSTM1/p62 (sequestosome 1), which sequesters ubiquitinated cargo via its ubiquitin association (UBA) domain and delivers those cargos through its LC3-interacting region [Citation16].
In cellular and tissue repair processes, autophagy principally serves as a protective mechanism against stresses and diverse pathologies including cancer [Citation17]. However, in advanced cancers, autophagy-mediated intracellular catabolism is co-opted to support tumor’s increasing demands for energy and resources needed for growth and survival from treatments [Citation18,Citation19]. For GBM, treatments such as irradiation (IR) and chemotherapy, especially temozolomide (TMZ), induce autophagy [Citation20,Citation21]. GBM utilizes autophagy as an escape mechanism of cell survival in response to cytotoxic therapies including IR and TMZ, which are standard first-line treatments for GBM and other cancers [Citation18,Citation22].
MicroRNAs (miRNAs) have emerged as important post-transcriptional ‘fine-tuners’ of gene expression in both normal and neoplastic development [Citation23–Citation25]. These small noncoding RNAs bind to the 3ʹ-untranslated region (3ʹ-UTR) of target mRNAs and regulate gene expression by promoting mRNA degradation or inhibiting mRNA translation. A given miRNA can simultaneously inhibit the expression of multiple target genes based on sequence homology, and thereby has significant influence on gene networks and cellular signaling pathways [Citation26]. Accumulating evidence reveal that miRNAs are dysregulated in cancer cells and cancer stem cells (CSCs), which have distinct miRNA expression signatures in various types of tumors, including GBM, and have shown context-dependent properties of miRNAs in regulating tumorigenicity and response to therapy [Citation20,Citation24,Citation27–Citation29]. In this study, we investigated the roles of MIR93 (microRNA -93), which is differentially expressed in PN and MES GBM subtypes, for its relationship with GBM autophagy, as well as for its role in GBM response to anti-tumor activities of TMZ and IR.
Results
MIR93 is differentially expressed in PN and MES GBM
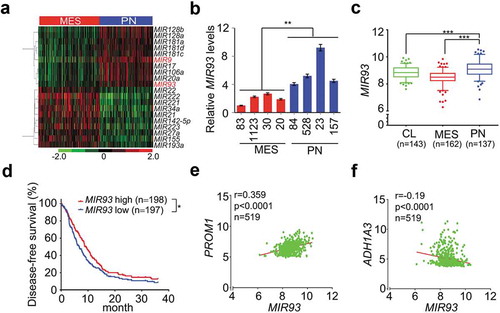
Distinct miRNA expression signatures have been described in human cancers including GBM, suggesting cancer cell type-specific miRNA functions [Citation30]. To identify miRNAs that influence the biological properties of different GBM and GSC subtypes, we compared miRNA expression profiles in PN and MES GBM subtypes in the Cancer Genome Atlas (TCGA) datasets and in a panel of patient-derived PN and MES GSCs that we recently described [Citation24]. We found that MIR93 and MIR9, among the top 10 up-regulated miRNAs in PN GBM, were also among in the top 20 PN-enriched miRNAs in GSCs (()) [Citation24]. To determine the roles of MIR93 and MIR9 in GSCs, we first examined the expression of MIR93 and MIR9 in four PN GSCs and four MES GSCs from different sources [Citation5,Citation31]. As measured by quantitative reverse transcription-polymerase chain reaction (qRT–PCR), levels of MIR93 but not MIR9 were significantly increased in PN compared with MES GSCs ( and Figure S1(a)). Therefore, we selected MIR93 for further investigation. In the TCGA dataset, MIR93 was expressed at a significantly higher level in PN GBM compared to MES or CL GBM subtypes (). The elevated level of MIR93 expression was associated with better survival for GBM patients (). Multivariate analyses of MIR93 expression showed longer survival associations with tumor p53 mutation status, patient age, and GBM PN subtype classification (Figure S1(b–e)). Additionally, MIR93 expression displayed a positive correlation with the expression of PN marker PROM1/CD133 () and SOX2 (Figure S1(f)), and an inverse correlation with MES marker ALDH1A3 () and CD44 (Figure S1(g)) [Citation5].
Figure 1. MIR93 is differentially expressed between PN and MES GBM. (a) Hierarchical cluster analysis on expression data of miRNAs that were top most differentially expressed between PN and MES GBM tumors in TCGA miRNA (miR) microarray dataset. Red color indicates upregulated and the green is for downregulated MIRs. (b) Relative expression levels of MIR93 in 4 PN and 4 MES GSCs were determined using quantitative RT-PCR (qRT-PCR) assays. (c) Expression levels of MIR93 in 3 clinically relevant GBM subtypes. Boxplots indicate the median quartiles, with whiskers extending the minimum and maximum range. (d) Kaplan–Meier analysis for survival of patients with gliomas with high or low expression levels of MIR93 using the TCGA dataset. (e and f) Correlation of expression levels between MIR93, and PN marker PROM1 (e) or MES marker ALDH1A3 (f) in the TCGA datasets. *p < 0.05, **p < 0.01, ***p < 0.001, the Mann-Whitney U-test. R value, Pearson value. Data in (b) are representative from 3 independent experiments with similar results.
MIR93 modulates MES and PN GBM phenotypes
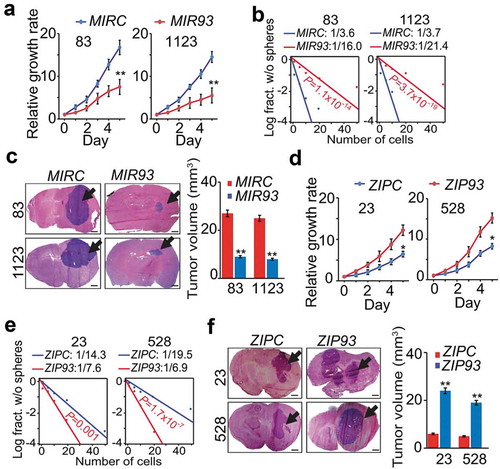
To determine the biological roles of MIR93 in GBM, we first ectopically expressed MIR93 in GSC 83 and 1123 spheres (Figure S2(a)). Cells modified for exogenous expression of MIR93 markedly reduced the expression levels of MES GSC stem cell markers, ALDH1A3 and CD44, but increased the expression of differentiation marker TUBB3 (Figure S2(b)). Importantly, MIR93 overexpression resulted in decreases in cell growth, sphere-forming frequency, and glioma sphere-forming abilities of GSC 83 and 1123 (, and Figure S2(c)). When GSC 83 and 1123 modified with stable expression of MIR93 or a control vector were stereotactically implanted into the brains of mice, ectopic MIR93 expression markedly suppressed intracranial tumor growth in athymic mice (). Conversely, we antagonized MIR93 function in PN GSCs using a targeted anti-miR (ZIP93). We found inhibition of MIR93 decreased expression levels of PN GSC stem cell markers SOX2 and OLIG2 but had no effect on TUBB3 expression (Figure S2(d)). Moreover, MIR93 inhibition significantly enhanced in vitro cell growth, sphere-forming frequency and glioma sphere-forming abilities of GSC 23 and 528 (), and Figure S2(e)). In vivo, ZIP93-mediated suppression of MIR93 markedly increased GSC 23 and 528 tumorigenicity of orthotopic GBM xenografts (). In contrast, modulation of MIR93 expression had no appreciable effects on the cell viability of normal human astrocytes (NHA in Figure S2(f,g)).
Figure 2. MIR93 regulates cell growth, self-renewal, and tumorigenicity of GSCs. (a–c) effects of ectopic expression of MIR93 or a control miRNA (MIRC) in GSC 83, 1123 on cell growth (a), sphere-forming frequency (b) in vitro and tumorigenicity in brain xenografts (n = 5) that received indicated GSC 83 or 1123 cells (c). (d–f), effects of ectopic expression of ZIP93 or a control (ZIPC) in GSC 23 and 528 on cell growth (d), sphere-forming frequency (e) in vitro, and tumorigenicity in brain xenografts (n = 5) that received indicated GSC 23 or 528 cells (f). Arrows in (c and f) indicate GSC tumor xenografts. Bar graphs in (c and f), estimation of tumor volumes in indicated groups. Scale bar: 1.0 mm. *p < 0.05, **p < 0.01. Data are representative from 3 independent experiments with similar results.
MIR93 inhibits autophagic activity in GBM
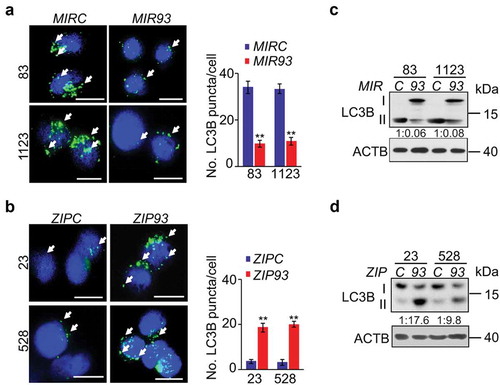
Potent effects of MIR93 in regulation of MES and PN GBM phenotypes prompted us to explore the downstream effectors of MIR93. To identify downstream targets, we performed in silico predictive analyses for potential targets of MIR93 using Targetscan [Citation32]. Then, we identified pathways enriched in MIR93 potential targets by using gene set enrichment analysis (GSEA). We observed enrichment in MIR93 target gene sets (false discovery rate, FDR, ≤ 0.01) that comprised regulation of autophagy, immune system, AMP-activated protein kinase (AMPK), MAPK/JNK, WNT, and ERBB signaling pathways (Figure S3). Autophagy plays critical roles in sustaining tumor growth and survival when challenged by cytotoxic and/or targeted therapies [Citation18]. An indicator of active autophagy is the formation of autophagosome membranes by conversion of LC3-I to lipidated LC3-II, and the resultant appearance of LC3 puncta [Citation33]. Thus, we assessed whether MIR93 regulated autophagic activity in GSCs. As shown in , overexpression of MIR93 resulted in a significant reduction in numbers of LC3B+ puncta in MES GSC 83 and 1123, whereas suppression of MIR93 activity by ZIP93 in PN GSC 23 and 528 increased the number of LC3B+ puncta as compared with their corresponding controls (). Consistent with these results, the protein levels of LC3B-II were markedly decreased, while the levels of LC3B-I were significantly increased in MES GSC 83 and 1123 with MIR93 overexpression (). In contrast, LC3B-II was enhanced, while LC3B-I was reduced in PN GSC 23 and 528 with ZIP93 suppression (). This indicates that MES GSCs display greater basal autophagy activity compared with PN GSCs, as indicated by a significantly higher level of LC3-II (), and that this phenomenon is reversed upon modification of MIR93 levels [Citation7].
Figure 3. MIR93 regulates autophagic activity in GSCs. (a and b) Immunofluorescent staining (IF) analyses for LC3B+ puncta (green) in GSC 83 and 1123 modified with ectopic MIR93 or a control (MIRC) (a), and GSC 528 and 23 modified with ZIP93 or a control (ZIPC) (b). Arrows indicate stained LC3B+ puncta. Cell nuclei were visualized with DAPI (blue). Right panels in (a and b), quantification of LC3B+ puncta in indicated GSCs. (c and d) Immunoblotting analysis (IB) for LC3B and ACTB in GSC with indicated modifications. Quantifications of LC3B-II:I ratios in numbers are shown. *p < 0.05, **p < 0.01. Data are representative from 3 independent experiments with similar results.
MIR93 downregulates autophagy regulatory genes
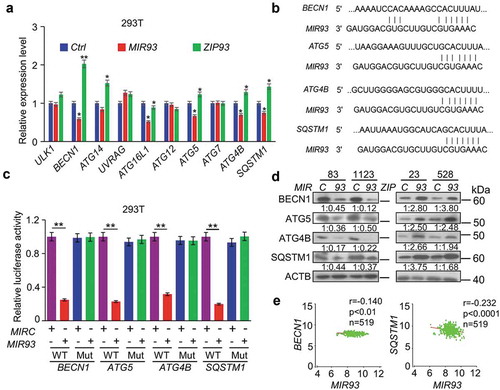
The observation that MIR93 influences autophagic activity in GSCs prompted us to determine which of the predicted candidate genes responded to MIR93 modulation of autophagy. As shown in , among a total of ten candidate genes of MIR93 targets involved in autophagy, BECN1, ATG5, ATG4B, and SQSTM1 were significantly down-regulated when ectopic MIR93 was expressed in human embryonic kidney (HEK) 293T cells. Conversely, when MIR93 was inhibited in these cells by ZIP93, the expression levels of these four genes were markedly increased. Consistent with these results, MIR93 expression suppressed the activity of BECN1, ATG5, ATG4B, and SQSTM1 gene reporters with wild-type (WT) MIR93 binding sites, when compared to mutated MIR93-binding sites ((,)). Ectopic expression of MIR93 in GSC 83 and 1123, with low endogenous levels of MIR93, decreased the expression of BECN1, ATG5, ATG4B, and SQSTM1 proteins, while ZIP93 suppression of MIR93 in GSC 23 and 528, with high endogenous levels of MIR93, enhanced the expression of these proteins (). Similar results were also obtained when levels of MIR93 were modified in three other cancer cell lines derived from glioma (U87), lung cancer (343T) and melanoma (A375), indicating that MIR93 regulated autophagic activity through targeting these autophagy genes in cells (Figure S4). Additionally, analysis of MIR93, BECN1, ATG5, ATG4B, and SQSTM1 expression in the TCGA glioma dataset revealed an inverse correlation between the expression of MIR93 and BECN1 or SQSTM1 (), but not ATG5 or ATG4B. These results are not atypical since there are multiple potential mechanisms for miRNA-mediated regulation, including induction of mRNA degradation or the inhibition of mRNAs translation without affecting mRNA levels [Citation34]. This could be the possible reason that no inverse correlation was observed between the expression of MIR93 and ATG5/ATG4B in GBM.
Figure 4. MIR93 simultaneously targeted multiple autophagy regulators. (a) qRT–PCR analysis for relative expression levels of MIR93 target genes in HEK293T cells transfected with the indicated plasmids. Ctrl, a control lentivirus vector. ACTB was used as an internal control (Ctrl). (b) Targeting sites of MIR93 in 3ʹ-untranslated region (3ʹ-UTR) sequence of target genes. (c) Effects of MIR93 on the activities of indicated reporter genes containing WT or mutations at the MIR93-binding sites. Renilla luciferase activities were normalized with Firefly luciferase activities. (d) IB for BECN1, ATG5, ATG4B, and SQSTM1 in GSC 83 and 1123 modified with ectopic MIR93 or MIRC, and in GSC 23 and 528 modified with ectopic ZIP93 or ZIPC. Quantifications in ratios of BECN1, ATG5, ATG4B, and SQSTM1 relative to ACTB are shown. (e) Correlation of expression levels between MIR93 and autophagy regulators BECN1 or SQSTM1 in the TCGA datasets. R, Pearson value. *p < 0.05, **p < 0.01. Data are representative from 3 independent experiments with similar results.
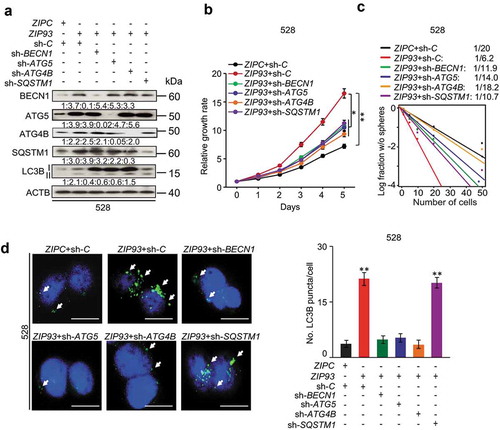
Next, we determined whether autophagic activity was critical for GSC cell growth and self-renewal. To test this possibility, we knocked down BECN1, ATG5, ATG4B, and SQSTM1 using 3 different shRNAs in GSC 83 and 30 cells ( and Figure S5(a)) and selected 2 shRNA clones with higher knockdown efficiency for further functional study. As a result, knockdown of BECN1, ATG5, ATG4B, and SQSTM1 significantly reduced proliferation, sphere-forming frequency, and sphere formation ability in GSC 83 and 30 cells (, and Figure S5(b–e)). Last, we compared the effects of shRNA knockdown of BECN1, ATG5, ATG4B or SQSTM1 on cell growth and glioma sphere-forming ability using GSC 528, with and without ZIP93 suppression of MIR93. Our results showed that shRNA inhibition of MIR93 target sequences reduces cell proliferation, sphere-forming frequency, and sphere formation ability ((–), Figure S6(a,b)). In addition, knockdown of these four MIR93 targets except SQSTM1 in ZIP93-expressing GSC 528 resulted in a significant reduction of LC3B+ puncta number (). Since sh-SQSTM inhibition should not have an effect on the closure of autophagy membranes, puncta formation was expected to be similar to ZIP93 and sh-C controls (), supporting the LC3BII:I ratios shown in . Together, these data indicate that MIR93 regulates autophagic activity through suppressing BECN1, ATG5, ATG4B, and SQSTM1 in GSCs.
Figure 5. BECN1, ATG5, ATG4B, and SQSTM1 are critical for cell proliferation and self-renewal of GSCs. (a) IB for BECN1, ATG5, ATG4B, and SQSTM1 in GSC 83 with the indicated shRNAs or a control shRNA (sh-C). Quantifications in ratios of BECN1, ATG5, ATG4B, and SQSTM1 relative to ACTB are shown. (b and c) The effect of BECN1, ATG5, ATG4B, and SQSTM1 knockdown by specific shRNAs on GSC cell growth (b) and sphere-forming frequencies (c) in vitro. **p < 0.01. Data are representative from 3 independent experiments with similar results.
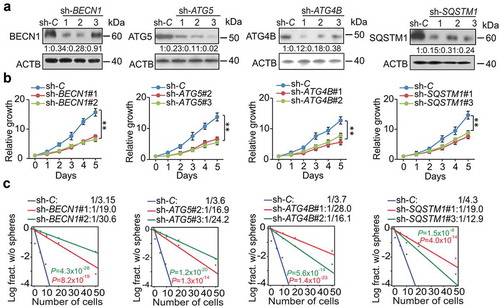
Figure 6. Autophagy regulators mediate MIR93 regulation of GSCs. (a) IB for BECN1, ATG5, ATG4B, SQSTM1, LC3B, and ACTB in GSC 528 with the indicated modifications. Quantifications in ratios of BECN1, ATG5, ATG4B, and SQSTM1 relative to ACTB, as well as LC3B-II:-I ratios are shown. (b and c) The effects of shRNA knockdown of BECN1, ATG5, ATG4B, and SQSTM1 in GSC 528 on GSC cell growth (b) or sphere-forming frequencies (c). (d) IF analyses for LC3B+ puncta in GSC 528 with the indicated modifications. Right panel, quantification of LC3B+ puncta (green) in the indicated GSCs. ZIPC, a control ZIP. Sh-C, a control shRNA. Cell nuclei were visualized with DAPI (blue). Arrows indicate stained LC3B+ puncta. Scale bar: 100 µm. *p < 0.05, **p < 0.01. Data are representative from 3 independent experiments with similar results.
Inhibition of autophagy enhances anti-tumor activity of TMZ, IR and rap on GSCs
Autophagy contributes to tumor survival when challenged by cytotoxic and/or targeted therapies [Citation18,Citation19]. Thus, we determined whether MIR93 was involved in therapy-induced autophagy by treating GSC 528 with cytotoxic therapy TMZ [Citation35], IR [Citation7], or Rap, an inhibitor of MTOR that also induced cell autophagy in cancer treatment [Citation36]. As shown in , all these treatments markedly reduced levels of MIR93 () and increased protein levels of MIR93 targets including BECN1, ATG5, ATG4B, and SQSTM1 (). In addition, these treatments also induced autophagic activity as indicated by enhanced LC3B lipidation (LC3B II, ). The induction of autophagy by these treatments was also evidenced by increased LC3B+ puncta in GSCs. However, the therapy-induced autophagic activity (LC3B puncta formation) was markedly attenuated by expressing exogenous MIR93 in these cells ().
Figure 7. Modulation of autophagic activity by MIR93, CQ, or NSC regulates anti-tumor activities of TMZ, IR, and Rap on GSCs.(a) qRT–PCR analysis of MIR93 levels in GSC 528 with indicated treatments. (b) IB for BECN1, ATG5, ATG4B, SQSTM1, LC3B, γH2AFX, and ACTB in GSC 528 with indicated treatments. Quantification in ratios of BECN1, ATG5, ATG4B, SQSTM1, and γH2AFX relative to ACTB, as well as LC3B-II:-I ratios are shown. (c) IF analyses for LC3B (green) in GSC 528 with the indicated modifications and treatments. Cell nuclei were visualized with DAPI (blue). Arrows indicate stained LC3B+ puncta. Scale bar: 100 µm. In (a) to (c), doses of indicated treatments: TMZ, 100 µM. IR, 2 Gy. Rap, 100 nM. Ctrl, a vehicle control. MIRC, a control miRNA. (d and e) Effects of MIR93, ZIP93, IR (2 Gy/day for 5 consecutive days) and TMZ (20 mg/kg daily, for 15 d) on GSC 1123 (d) or 23 (e) brain tumor xenografts in mice. Mice were imaged after the last treatment. Representative bioluminescent images indicative of tumorigenicity are shown (left). Colored scale bars represent photons/s/cm2/steradian. Kaplan-Meier analyses of mice bearing GSC 1123 (d) or 23 (e) orthotopic xenografts with indicated treatments (right). (f) Cell viability of GSC 83 with the indicated modification or treatments. MIRC, a control miRNA. CQ, 50 µM. NSC, 100 µM. TMZ, zero to 200 µM. IR, zero to 10 Gy. (g) Cell apoptosis (ANXA5 expression) for GSC 83 with indicated treatments for 72 h. *p < 0.05, **p < 0.01. Data are representative from 3 independent experiments with similar results.
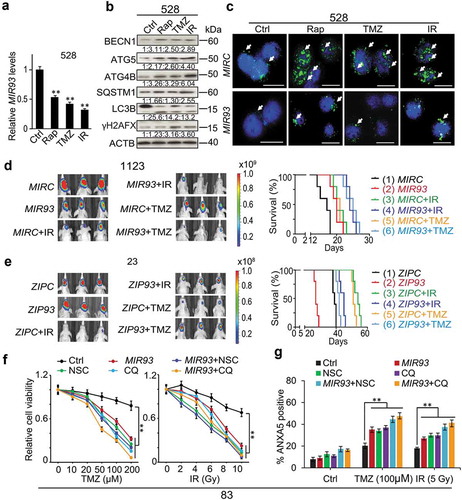
IR and TMZ are the first-line treatments for GBM [Citation37]. To test the in vivo effects of MIR93 on response of GSCs to IR and TMZ therapy, mice with intracranial MES GSC 1123 xenografts modified with MIRC or MIR93, and PN GSC 23 xenografts modified with ZIPC or ZIP93, received separate treatments of IR (2 Gy/day, Monday through Friday for one cycle, 10 Gy total), or TMZ (20 mg/kg daily, for 15 days). In MES GSC 1123 model, overexpression of MIR93, or individual treatment of IR, TMZ resulted in growth-suppressive effects on intracranial tumor xenografts measured by bioluminescent imaging and survival benefits of animals ( and Figure S7(a)). Importantly, exogenous expressed MIR93 markedly enhanced anti-tumor activities of IR or TMZ treatments and further prolonged the survival of these animals ( and Figure S7(a)). In the PN GSC 23 model, when compared to ZIPC group, ZIP93 inhibition of MIR93 significantly enhanced while treatment of IR or TMZ reduced the growth of intracranial tumors ( and Figure S7(b)). Moreover, when ZIP93-expressing GSC 23 tumor xenografts were treated with IR or TMZ, tumor suppressive functions of these modalities were markedly reduced () and Figure S7(b)). Modulation of tumorigenicity and therapeutic benefits of IR and TMZ by ZIP93 also affected the survivals of these animals (, right panel).
Next, we examined the effects of MIR93 regulation and IR or TMZ treatment on cell proliferation, DNA damage and autophagic activity in the aforementioned GSC tumor xenografts. We found that MES 1123 xenografts with separate or combined treatments showed lower proliferation indices (by MKI67/Ki-67 staining) when compared with the controls (MIRC). PN GSC 23 xenografts modified with ZIP93 displayed higher mitotic activity when compared with ZIPC-expressing tumors (p < 0.01, Figure S7(c,d)). In both MES GSC 1123 and PN GSC 23 xenografts, treatments with IR or TMZ resulted in higher levels of DNA damage (γH2AFX staining) when compared with the controls (p < 0.001, Figure S7(c,d)). IR or TMZ alone induced autophagy in vivo as indicated by increased LC3B levels compared with controls (p < 0.01, Figure S7(c,d)). However, exogenous MIR93 expression blocked the IR- or TMZ-induced autophagy in the MES GSC 1123 xenografts. In contrast, MIR93 inhibition by ZIP93 further enhanced treatments-induced autophagic activities in PN GSC 23 xenografts (p < 0.01, Figure S7(c,d)).
We recently described that specific inhibition of autophagic activity by chloroquine diphosphate (CQ), which suppresses autophagy through blocking lysosomal acidification [Citation38], or by a novel ATG4B antagonist NSC185058 (NSC) [Citation39], significantly enhanced anti-tumor activity of IR in treating orthotopic GSC xenografts [Citation7]. We next wanted to determine whether MIR93 sensitized GSC to the tumor-inhibiting effects of cytotoxic therapy by suppressing autophagy-associated proteins. Thus, we subjected MES GSC 83 cells, which had intrinsically high autophagic activity [Citation7], to TMZ or IR. We also varied both the expression of MIR93, as well as inclusion of CQ or NSC treatment. We found that similar to enhancing TMZ inhibitory effects on cell viability, increasing doses of IR in combination with CQ (50 µM), NSC (100 µM) [Citation7], or ectopic MIR93 expression, or MIR93 plus either of the autophagy inhibitors (CQ or NSC) significantly reduced cell viability of GSC 83 when compared to the controls (). Last, we determined the effects on apoptosis in GSCs by these treatments. Overexpression of MIR93 or treatment with NSC or CQ alone sensitized GSC 83 to IR- or TMZ- induced cell apoptosis as measured by ANXA5/Annexin V. MIR93 expression combined with NSC or CQ treatment also increased the proportion of apoptotic cells induced by IR or TMZ (). Notably, MIR93 plus NSC or CQ only had additional but not significant effects on GSC response to IR and TMZ, relative to MIR93, NSC or CQ alone (), suggesting that both MIR93 and autophagy inhibitors may target a common autophagy pathway.
To further examine whether inhibition of autophagic flux contributes to the increase of cell apoptosis in MIR93-overexpressed cells, we introduced the shRNA against specific autophagy genes BECN1 and ATG5 into GSC 83 cells stably expressing exogenous MIR93. Apoptosis indicator cleaved CASP3/caspase-3 were markedly increased in GSC 83 cells with ectopic MIR93 expression, or MIR93 plus either of BECN1 or ATG5 knockdown after TMZ or IR treatment when compared with control (Figure S8(a)). In addition, the proportion of apoptotic cells induced by IR or TMZ was markedly increased in the BECN1- or ATG5-deficient cells, which was consistent with the results from NSC or CQ-treated cells (). Furthermore, combination treatment with MIR93 and autophagy inhibition by BECN1 or ATG5 knockdown had an additional but not significant effect on cell death induced by TMZ or IR, relative to MIR93, BECN1 or ATG5 knockdown alone, suggesting MIR93 may have an additional effect on cell apoptosis induced by TMZ or IR besides its effect on autophagy (Figure S8(b)).
Discussion
In this study, we described a critical role for MIR93 in modulating GSC self-renewal and GBM tumorigenesis by targeting multiple key autophagy effectors: BECN1, ATG5, ATG4B, and SQSTM1. Inhibition of autophagic activity in GBM through ectopic MIR93 expression and treatment with autophagy inhibitors NSC (for ATG4B) or CQ enhanced the effects of TMZ and IR in reducing GSC viability. Our findings establish that the MIR93-autophagy axis is an important regulator of autophagy, including tumor cell autophagic response to cytotoxic therapies such as TMZ and IR. Thus, targeting this axis may present as a potential therapeutic strategy for treating GBM.
MIR93 has been reported as highly expressed in certain human malignancies, acting as an oncogenic miRNA by activating the PI3K-AKT signaling pathway [Citation40–Citation42]. However, the oncogenic activity of MIR93 is context dependent. For example, MIR93 functions as a tumor suppressor by inhibiting multiple factors in the TGFβ signaling pathway as well as genes regulating cell stemness, including CCND2, CDKN1A, JAK1, STAT3, AKT3, SOX4, and EZH1 [Citation43,Citation44]. In the present study, we showed that MIR93 regulates the autophagic activity of GSCs. In MES GSCs with low levels of endogenous MIR93, ectopic expression of MIR93 down-regulated multiple autophagy regulatory genes including BECN1, ATG5, ATG4B, and SQSTM1, resulting in inhibition of cell growth, glioma sphere self-renewal in vitro, and tumor cell growth in vivo. In suppressing autophagic response, MIR93 sensitized GSC to TMZ and IR. Conversely, suppressing MIR93 in PN GSCs increased cell growth, GSC self-renewal in vitro, tumor cell growth in vivo, and attenuated the anti-tumor activity of IR or TMZ in animals.
Our identification of the molecular and biologic effects that were influenced by MIR93 in GBM emphasized the ability of a single expressed sequence to suppress the protein levels of multiple genes. Our results demonstrated that MIR93 inhibited autophagic activity in GBM through simultaneously targeting key autophagy regulators BECN1, ATG5, ATG4B, and SQSTM1. Interestingly, MIR93 has been shown to activate the PI3K-AKT-MTOR signaling through another set of targets resulting in autophagy suppression [Citation41,Citation42,Citation45,Citation46]. Thus, MIR93 influences autophagy through its effects on multiple signaling pathways. However, the combination of MIR93 plus autophagy inhibitors or knockdown of specific autophagy genes appears to have additional but not significant effects on TMZ or IR-induced cell apoptosis when compared to individual treatments, suggesting that MIR93 modulates proapoptotic pathways besides its effect on autophagy [Citation47–Citation49].
Nearly all GBM tumors recur following surgical resectioning and subsequent treatment of patients with RT and TMZ. Recurrent tumors are enriched with CSCs, and there are no treatments that have shown consistency in limiting the growth of recurrent GBM [Citation50,Citation51]. Several mechanisms have been implicated in therapeutic resistance of CSCs in recurrent GBM, including a switch to quiescence, and the increased expression of multidrug resistance pumps as well as detoxifying enzymes. The induction of autophagy has also been proposed as a survival response mechanism employed by CSCs [Citation52–Citation54]. In addition to survival, autophagy plays critical roles in oncogenic transformation, tumor growth, and CSC maintenance [Citation55–Citation58]. Consistent with our recent report [Citation7], we found that MES GSCs displayed a higher level of autophagic activity compared to PN counterparts. MES tumors often exhibit a more invasive phenotypes, a greater resistance to standard treatments, and less favorable prognosis relative to PN tumors [Citation31,Citation59,Citation60]. Here, we have shown that there were also significant differences in autophagy activity between these subtypes of GBM, with these differences mediated, in part, through MES versus PN differences in expression of BECN1, ATG5, ATG4B, and SQSTM1. In addition to affecting autophagy, our results showed that the expression of these genes influenced cell proliferation and GSC self-renewal.
In conclusion, we showed that MIR93 expression influenced multiple biologic properties of GBM by targeting the expression and/or activity of key autophagy regulators. Furthermore, by attenuating autophagic activity through ectopic expression of MIR93, or through the use of autophagy inhibitors NSC or CQ, tumor suppressing functions of routinely-used cytotoxic therapies TMZ and IR were enhanced. These results support further investigation of a strategy for treating primary as well as recurrent GBM.
Materials and methods
Ethics
Athymic (Ncr nu/nu) mice at 6–8 wk of age were purchased from Taconic Farms. All experiments using animals with 5 mice per group were conducted under the Institutional Animal Care and Use Committee (IACUC)-approved protocol at Northwestern University in accordance with NIH and institutional guidelines. Human Subjects Research protocols were approved by the Institutional Review Board (IRB) at the Northwestern University in accordance with NIH and institutional guidelines.
Cell culture and reagents
Human HEK293T cells (ATCC, CRL-1573), glioma U87 cells (ATCC, HTB-14), lung adenocarcinoma cells 343T (ATCC, CRL-7245) and melanoma A375 cells (ATCC, CRL-3223) were cultured in DMEM (Thermo Fisher Scientific, 11995-065) supplemented with 10% FBS (Thermo Fisher Scientific, 10437028) and 1% penicillin and streptomycin (Thermo Fisher Scientific, 15140122). Normal human astrocyte (Thermo Fisher Scientific, N7805100) cells were cultured in the astrocyte growth medium (Lonza, CC-3187). Patient-derived GSCs that were previously characterized [Citation5,Citation31] were cultured in DMEM/F12 medium (Thermo Fisher Scientific, 11320-033) containing 2% B27 supplement (Thermo Fisher Scientific, 17504-044), 1% penicillin and 1% streptomycin (Thermo Fisher Scientific, 11860-038), 5 μg/ml heparin (Sigma-Aldrich, 9041-08-1), 20 ng/ml EGF (Peprotech, 100-15R), and 20 ng/ml bFGF (Peprotech, 100-18B). We obtained CQ (Sigma, C6628), TMZ (Selleckchem, S1237), and Rap (Selleckchem, S1039) from the indicated suppliers. We obtained NSC from National Institutes of Health (NIH) National Cancer Institute (NCI) Developmental Therapeutic Program.
Xenograft studies
The GSC suspension (1 × 10⁴ cells for GSC 83 and 1123, and 5 × 10⁵ cells for GSC 23 and 528) was intracranially injected into the brains of mice as described previously [Citation7,Citation24]. Intracranial tumor xenograft-bearing mice received radiation at 2 Gy directed at the cranium for five consecutive days. The radiation treatment was started one week after transplantation. TMZ-treated mice received TMZ through gavage at 20 mg/kg daily for 15 d. TMZ treatments were started at day 3 post-implantation. The mice were monitored every day for the neurological symptoms relative to tumor burden. The tumor growth was monitored using an in vivo imaging system (IVIS) Lumina imaging station. For the animal survival analysis, mice were maintained until pathological symptoms developed resulting from tumor burden and combined with IVIS signal intensity indicative of tumor burden [Citation7].
In all experiments, the mice were monitored every day for the development of neurological symptoms indicative of substantial tumor growth. The mice were humanely euthanized 15–28 d after GSC 83 and 1123 implantation, or 30–58 d after GSC 23 and 528 implantation based on tumor burden. Mouse brains were collected for analysis as previously described [Citation7,Citation24].
Lentiviral production and infection
Lenti-MIR93 (PMIRH93PA-1) and -ZIP93 constructs (MZIP93-PA-1) were from System Biosciences. Lentiviral shRNAs for knockdown of BECN1 (V3LHS_349509, V3LHS_349512, V3LHS_349513), ATG5 (V2LHS_248503, V2LHS_249282, V2LHS_67978), ATG4B (TRCN0000073798, TRCN0000073799, TRCN0000073800), and SQSTM1 (V2LHS_47986, V2LHS_47987, V2LHS_47988) were purchased from Dharmacon. Lentiviral production and infection were carried out as described previously [Citation7,Citation24]. Briefly, lentiviral vectors expressing non-target control shRNA, or specific shRNA constructs (BECN1, ATG5, ATG4B, and SQSTM1) were transfected into HEK293T cells using Lipofectamine 2000 (Thermo Fisher Scientific, 11668) in accordance to the manufacturer’s instructions. To establish GSC cell lines that stably expressed indicated genes or constructs, the supernatants containing lentivirus were harvested 48–72 h after transfection and used to infect target cells with 6.0 µg/ml polybrene (Sigma-Aldrich, TR-1003). 72 h after transduction, cells were subjected to 2.0 µg/ml puromycin (10.0 mg/ml, Thermo Fisher Scientific, A11138-03) for 4 d to select for infected cells. Subsequently, cells were harvested to determine the knockdown efficiency by using immunoblot analyses (IB).
Luciferase reporter assay
psiCHECK2 constructs with BECN1, ATG5, ATG4B or SQSTM1 were generated by separately inserting their 3ʹ-untranslated regions into a psiCHECK2 vector (Promega, C8021) using XhoI and NotI restriction sites. All vectors containing mutations located at the putative binding sites of MIR93 were generated using a QuikChange Mutagenesis Kit (Agilent Technologies, 200524), according to the manufacturer’s instructions. For the luciferase assay, HEK293T cells were co-transfected with MIRC or MIR93, and psiCHECK2 constructs with WT or mutated target sequence. 48 h after transfection, the luciferase activity was measured according to the instructions of Dual-Luciferase Reporter Assay System (Promega, E1910).
Bioinformatics analyses
TargetScan (http://www.targetscan.org/vert_71/) was used to predict potential targets of MIR93 irrespective of site conservation, ranked by cumulative weighted context++ score (−1.07 to −0.46). GSEA (http://www.broadinstitute.org/gsea/index.jsp) was used for KEGG analysis of signaling pathway enrichment. The TCGA datasets of GBM, expression levels of MIR93 in GBM (Agilent 8 × 15K Human miRNA-specific microarray) and gene expression levels in GBM (Affymetrix HT HG U133A), were downloaded from Firebrowse (http://firebrowse.org/). The Mann-Whitney U-test was performed to determine whether MIR93 was differentially expressed between different GBM molecular subtypes. Kaplan-Meier survival analyses were performed to assess the correlations of MIR93 expression and clinical parameters to prognosis in gliomas and GBM tumor subtypes. Correlation of expression between MIR93 and PN or MES GBM subtypes markers was also determined using TCGA datasets of GBM aforementioned.
Immunoblotting (IB)
The cell lysates were prepared in RIPA buffer (50 mM Tris-HCl, pH 8.0 [Thermo Fisher Scientific, 15568-025], 150 mM sodium chloride [Sigma-Aldrich, S9888], 1% NP-40 [Sigma-Aldrich, I3021, 0.5% sodium deoxycholate [Sigma-Aldrich, D6750], 0.1% sodium dodecyl sulfate [Wako, 191-07145], 2 mM EDTA [Dojindo, 345-01865]) containing 1 X protease inhibitor cocktail (Nacalai Tesque, 25955-11). Equal amounts of protein samples (10 μg/lane) were fractionated on SDS–polyacrylamide gel electrophoresis and transferred onto a polyvinylidene difluoride (PVDF) membrane (Thermo Fisher Scientific, LC2005) in 25 mM Tris and 192 mM glycine. Membranes were blocked with 5% nonfat dry milk in PBS (Thermo Fisher Scientific, AM9625), 0.05% Tween-20 (Sigma-Aldrich, P9416) for 1 h and then probed with the indicated antibodies at desired dilutions at 4°C overnight, followed by corresponding secondary antibodies (DAKO, anti-rabbit immunoglobulins, P0217, anti-mouse immunoglobulins, P0260; and anti-goat immunoglobulins, P0449). The results of IB analyses were quantified by using ImageJ software.
The following antibodies were used in IB analyses. Anti-BECN1 (Cell Signaling Technology, 3738S), anti-LC3B (Cell Signaling Technology, 3868S), anti-ATG4B (Cell Signaling Technology, 5299S), anti-ATG5 (Cell Signaling Technology, 12994), anti-cleaved CASP3 (Cell Signaling Technology, 9661S), anti-phospho-histone γH2AFX (Cell Signaling Technology, 9718S), anti-ACTB (Santa Cruz Biotechnology, sc-47778), and anti-SQSTM1 (Santa Cruz Biotechnology, sc-28359).
Immunofluorescent staining (IF)
Cells were fixed with 4% formaldehyde (Thermo Fisher Scientific, AAJ19943K2) for 15 min and then blocked with AquaBlock (EastCoast Bio, PP82) for 60 min at room temperature. After permeabilization with 0.3% Triton X-100 (Sigma-Aldrich, X100), cells were probed with anti-LC3B (Cell Signaling Technology, 2775), or anti-MKI67/Ki-67 (EMD Millipore, AB9260) and anti-phospho-histone γH2AFX (Cell Signaling Technology, p-Ser139, 9718S). After being washed three times with PBS-T (PBS [Thermo Fisher Scientific, AM9625], 0.05% Tween-20 [Sigma-Aldrich, P9416PBS-T]), cells were incubated with Alexa Fluor 488-labeled secondary antibodies (Thermo Fisher Scientific, A-11008) and DAPI-containing mounting solution Vectashield (Vector Laboratories, H-1200), and then visualized by using a Nikon inverted microscope Eclipse Ti-U equipped with a digital camera (Japan). Frozen brain tissue sections with GSC tumor xenografts were stained as previously described [Citation7].
RNA isolation and quantitative real-time PCR (qRT-PCR)
Total RNA was isolated from various GSCs using a Qiagen RNeasy Mini kit (Qiagen, 74104) according to the manufacturer’s instructions. TaqMan miRNA assays (Thermo Fisher Scientific, 4427975) were used to quantify levels of MIR93 expression in GSCs according to the supplier’s instructions. cDNA was generated using the PrimeScript First Strand cDNA Synthesis kit (Takara, 6110B). qRT-PCR was carried out with the Power SYBR Green Master Mix (Thermo Fisher Scientific Applied Biosystems, 4367659) on the Applied Biosystems StepOne Plus Real-Time Thermal Cycling Block (USA). Results were analyzed using the 2−ΔΔCt method. Primers used in this study can be found in the Supplementary information.
In vitro cell proliferation assays
In vitro cell proliferation assays were performed as previously described [Citation7,Citation24]. Briefly, GSC spheres were dissociated with StemPro Accutase (Thermo Fisher Scientific, A1110501) into single cells, and cell density was quantified by counting viable (Trypan Blue negative) cells using a hemotocytometer (Thermo Fisher Scientific, 02-671-51B). Cells were seeded into a 24-well plate containing 1.0 ml culture medium at a density of 5000 cells per well. The number of living cells was determined at different time points using a hemotocytometer.
Glioma sphere-forming assays
As previously described [Citation5,Citation7], One thousand cells with indicated modifications or treatments were plated in 96-well plates in at least eight replicates by a BD FACSAria™ III flow cytometer (USA). After 5–10 d, the number of GSC spheres with size ≥50 μm in each well was quantified. Sphere sizes were evaluated at day 5 for GSC 83 and 1123, and 10 d for GSC 23 and 528 using a Nikon inverted microscope Eclipse Ti-U equipped with a digital camera (Nikon, Japan).
Limited dilution assays for GSCs
Limiting dilution assay was performed as described previously [Citation7]. In brief, single cells from glioma spheres were cultured in 96-well plates at densities of 1, 5, 10, 20 or 50 cells per well. After one week for GSC 83 and 1123, and two weeks for GSC 528 and 23, each well was examined for sphere formation. Glioma sphere-forming frequencies were evaluated using extreme limiting dilution analysis (http://bioinf.wehi.edu.au/software/elda/).
Cell viability and apoptosis assay
GSCs with indicated treatments were plated in 96-well plates at 2,000 cells per well. Cell viabilities were evaluated using CellTiter-Glow 2.0 Assay (Promega, G9241) [Citation7]. For apoptosis assay, GSCs were incubated with an anti-ANXA5/Annexin V antibody (AV) and propidium iodide (PI) in accordance to the protocol provided by the manufacturer (Thermo Fisher Scientific, V13242). Cells without AV or PI were used as negative controls.
Statistical analysis
Statistical analysis was performed using Microsoft Excel 2013 and GraphPad Prism version 5.00 for Windows. The analysis included the Mann-Whitney U-test, one-way ANOVA with Newman-Keuls post-test and paired two-way Student t-test. The log-rank test was used to determine the significance of Kaplan-Meier curves. All grouped data are presented as mean ± SEM unless otherwise stated.
Supplemental Material
Download PDF (1.5 MB)Acknowledgments
We thank Dr. Y. Deng for providing reagents. We also thank members of the Cheng Laboratory for the discussion and edits for this manuscript. This work was supported by US National Institutes of Health (NIH) grants NS093843, NS095634 (S.-Y.C.); a Brain Cancer Research Award from James S. McDonnell Foundation (B.H.); NIH grants L32 MD010147 and T32 CA070085 (A.A.A.), F31 CA232630 (N.S.), NS080619 (C.D.J.), NS083767 (I.N.), support from Lou and Jean Malnati Brain Tumor Institute at Northwestern University (S.-Y.C. and B.H.).
Disclosure statement
No potential conflict of interest was reported by the authors.
Supplementary material
Supplemental data for this article can be accessed here.
Additional information
Funding
Related Research Data
References
- Wen PY, Kesari S. Malignant gliomas in adults. N Engl J Med. 2008;359(5):492–507. PMID: 18669428.
- Wang Q, Hu B, Hu X, et al. Tumor evolution of glioma-intrinsic gene expression subtypes associates with immunological changes in the microenvironment. Cancer Cell. 2017;32(1):42–56e6. PMID: 28697342.
- Lathia JD, Mack SC, Mulkearns-Hubert EE, et al. Cancer stem cells in glioblastoma. Genes Dev. 2015;29(12):1203–1217. PMID: 26109046.
- De Bacco F, Casanova E, Medico E, et al. The MET oncogene is a functional marker of a glioblastoma stem cell subtype. Cancer Res. 2012;72(17):4537–4550. PMID: 22738909.
- Mao P, Joshi K, Li J, et al. Mesenchymal glioma stem cells are maintained by activated glycolytic metabolism involving aldehyde dehydrogenase 1A3. Proc Natl Acad Sci USA. 2013;110(21):8644–8649. PMID: 23650391.
- Laks DR, Crisman TJ, Shih MY, et al. Large-scale assessment of the gliomasphere model system. Neuro Oncol. 2016;18(10):1367–1378. PMID: 27116978.
- Huang T, Kim CK, Alvarez AA, et al. MST4 phosphorylation of ATG4B regulates autophagic activity, tumorigenicity, and radioresistance in glioblastoma. Cancer Cell. 2017;32(6):840–855e8. PMID: 29232556.
- Rabinowitz JD, White E. Autophagy and metabolism. Science. 2010;330(6009):1344–1348. PMID: 21127245.
- Mizushima N, Komatsu M. Autophagy: renovation of cells and tissues. Cell. 2011;147(4):728–741. PMID: 22078875.
- Deretic V, Saitoh T, Akira S. Autophagy in infection, inflammation and immunity. Nat Rev Immunol. 2013;13(10):722–737. PMID: 24064518.
- Galluzzi L, Pietrocola F, Bravo-San Pedro JM, et al. Autophagy in malignant transformation and cancer progression. Embo J. 2015;34(7):856–880. PMID: 25712477.
- Kang R, Zeh HJ, Lotze MT, et al. The Beclin 1 network regulates autophagy and apoptosis. Cell Death Differ. 2011;18(4):571–580. PMID: 21311563.
- Pyo JO, Nah J, Jung YK. Molecules and their functions in autophagy. Exp Mol Med. 2012;44(2):73–80. PMID: 22257882.
- Kabeya Y, Mizushima N, Yamamoto A, et al. LC3, GABARAP and GATE16 localize to autophagosomal membrane depending on form-II formation. J Cell Sci. 2004;117(Pt13):2805–2812. PMID: 15169837.
- Xie Z, Klionsky DJ. Autophagosome formation: core machinery and adaptations. Nat Cell Biol. 2007;9(10):1102–1109. PMID: 17909521.
- Lee Y, Chou TF, Pittman SK, et al. Keap1/Cullin3 modulates p62/SQSTM1 activity via UBA domain ubiquitination. Cell Rep. 2017;20(8):1994. PMID: 28834760.
- Levine B, Kroemer G. Autophagy in the pathogenesis of disease. Cell. 2008;132(1):27–42. PMID: 18191218.
- White E. The role for autophagy in cancer. J Clin Invest. 2015;125(1):42–46. PMID: 25654549.
- Amaravadi R, Kimmelman AC, White E. Recent insights into the function of autophagy in cancer. Genes Dev. 2016;30(17):1913–1930. PMID: 27664235.
- Liu B, Bao JK, Yang JM, et al. Targeting autophagic pathways for cancer drug discovery. Chin J Cancer. 2013;32(3):113–120. PMID: 22835386.
- Kroemer G. Autophagy: a druggable process that is deregulated in aging and human disease. J Clin Invest. 2015;125(1):1–4. PMID: 25654544.
- Kondo Y, Kanzawa T, Sawaya R, et al. The role of autophagy in cancer development and response to therapy. Nat Rev Cancer. 2005;5(9):726–734. PMID: 16148885.
- Huang T, Alvarez A, Hu B, et al. Noncoding RNAs in cancer and cancer stem cells. Chin J Cancer. 2013;32(11):582–593. PMID: 24206916.
- Huang T, Alvarez AA, Pangeni RP, et al. A regulatory circuit of miR-125b/miR-20b and Wnt signalling controls glioblastoma phenotypes through FZD6-modulated pathways. Nat Commun. 2016;7:12885. PMID: 27698350.
- Ling H, Zhang W, Calin GA. Principles of microRNA involvement in human cancers. Chin J Cancer. 2011;30(11):739–748. PMID: 22035854.
- Bartel DP. MicroRNAs: target recognition and regulatory functions. Cell. 2009;136(2):215–233. PMID: 19167326.
- Cascio S, D’Andrea A, Ferla R, et al. miR-20b modulates VEGF expression by targeting HIF-1 alpha and STAT3 in MCF-7 breast cancer cells. J Cell Physiol. 2010;224(1):242–249. PMID: 20232316.
- Li D, Ilnytskyy Y, Kovalchuk A, et al. Crucial role for early growth response-1 in the transcriptional regulation of miR-20b in breast cancer. Oncotarget. 2013;4(9):1373–1387. PMID: 23945289.
- So AY, Zhao JL, Baltimore D. The Yin and Yang of microRNAs: leukemia and immunity. Immunol Rev. 2013;253(1):129–145. PMID: 23550643.
- Liu C, Tang DG. MicroRNA regulation of cancer stem cells. Cancer Res. 2011;71(18):5950–5954. PMID: 21917736.
- Bhat KPL, Balasubramaniyan V, Vaillant B, et al. Mesenchymal differentiation mediated by NF-kappaB promotes radiation resistance in glioblastoma. Cancer Cell. 2013;24(3):331–346. PMID: 23993863.
- Lewis BP, Burge CB, Bartel DP. Conserved seed pairing, often flanked by adenosines, indicates that thousands of human genes are microRNA targets. Cell. 2005;120(1):15–20. PMID: 15652477.
- Klionsky DJ, Abdelmohsen K, Abe A, et al. Guidelines for the use and interpretation of assays for monitoring autophagy (3rd edition). Autophagy. 2016;12(1):1–222. PMID: 26799652.
- Gu S, Kay MA. How do miRNAs mediate translational repression? Silence. 2010;1(1):11. PMID: 20459656.
- Garnier D, Meehan B, Kislinger T, et al. Divergent evolution of temozolomide resistance in glioblastoma stem cells is reflected in extracellular vesicles and coupled with radiosensitization. Neuro Oncol. 2018;20(2):236–248. PMID: 29016925.
- Kim YC, Guan KL. mTOR: a pharmacologic target for autophagy regulation. J Clin Invest. 2015;125(1):25–32. PMID: 25654547.
- Osuka S, Van Meir EG. Overcoming therapeutic resistance in glioblastoma: the way forward. J Clin Invest. 2017;127(2):415–426. PMID: 28145904.
- Degtyarev M, De Maziere A, Orr C, et al. Akt inhibition promotes autophagy and sensitizes PTEN-null tumors to lysosomotropic agents. J Cell Biol. 2008;183(1):101–116. PMID: 18838554.
- Akin D, Wang SK, Habibzadegah-Tari P, et al. A novel ATG4B antagonist inhibits autophagy and has a negative impact on osteosarcoma tumors. Autophagy. 2014;10(11):2021–2035. PMID: 25483883.
- Fang L, Deng Z, Shatseva T, et al. MicroRNA miR-93 promotes tumor growth and angiogenesis by targeting integrin-beta8. Oncogene. 2011;30(7):806–821. PMID: 20956944.
- Jiang L, Wang C, Lei F, et al. miR-93 promotes cell proliferation in gliomas through activation of PI3K/Akt signaling pathway. Oncotarget. 2015;6(10):8286–8299. PMID: 25823655.
- Li N, Miao Y, Shan Y, et al. MiR-106b and miR-93 regulate cell progression by suppression of PTEN via PI3K/Akt pathway in breast cancer. Cell Death Dis. 2017;8(5):e2796. PMID: 28518139.
- Liu S, Patel SH, Ginestier C, et al. MicroRNA93 regulates proliferation and differentiation of normal and malignant breast stem cells. PLoS Genet. 2012;8(6):e1002751. PMID: 22685420.
- Yu XF, Zou J, Bao ZJ, et al. miR-93 suppresses proliferation and colony formation of human colon cancer stem cells. World J Gastroenterol. 2011;17(42):4711–4717. PMID: 22180714.
- Li C, Lyu J, Meng QH. MiR-93 promotes tumorigenesis and metastasis of non-small cell lung cancer cells by activating the PI3K/Akt pathway via inhibition of LKB1/PTEN/CDKN1A. J Cancer. 2017;8(5):870–879. PMID: 28382150.
- Yang Z, Klionsky DJ. Mammalian autophagy: core molecular machinery and signaling regulation. Curr Opin Cell Biol. 2010;22(2):124–131. PMID: 20034776.
- Wang Y, Li F, Wang S. MicroRNA93 is overexpressed and induces apoptosis in glaucoma trabecular meshwork cells. Mol Med Rep. 2016;14(6):5746–5750. PMID: 27878244.
- Yan LJ, Fan XW, Yang HT, et al. MiR-93 inhibition ameliorates OGD/R induced cardiomyocyte apoptosis by targeting Nrf2. Eur Rev Med Pharmacol Sci. 2017;21(23):5456–5461. PMID: 29243790.
- Wang P, Liang X, Lu Y, et al. MicroRNA-93 downregulation ameliorates cerebral ischemic injury through the Nrf2/HO-1 defense pathway. Neurochem Res. 2016;41(10):2627–2635. PMID: 27300700.
- Brabletz T, Jung A, Spaderna S, et al. Opinion: migrating cancer stem cells - an integrated concept of malignant tumour progression. Nat Rev Cancer. 2005;5(9):744–749. PMID: 16148886.
- Nassar D, Blanpain C. Cancer stem cells: basic concepts and therapeutic implications. Annu Rev Pathol. 2016;11:47–76. PMID: 27193450.
- Lu H, Chen I, Shimoda LA, et al. Chemotherapy-induced Ca2+ release stimulates breast cancer stem cell enrichment. Cell Rep. 2017;18(8):1946–1957. PMID: 28228260.
- Xu ZY, Tang JN, Xie HX, et al. 5-Fluorouracil chemotherapy of gastric cancer generates residual cells with properties of cancer stem cells. Int J Biol Sci. 2015;11(3):284–294. PMID: 25678847.
- Vlashi E, Chen AM, Boyrie S, et al. Radiation-induced dedifferentiation of head and neck cancer cells into cancer stem cells depends on human papillomavirus status. Int J Radiat Oncol Biol Phys. 2016;94(5):1198–1206. PMID: 27026319.
- Dolma S, Selvadurai HJ, Lan X, et al. Inhibition of dopamine receptor D4 impedes autophagic flux, proliferation, and survival of glioblastoma stem cells. Cancer Cell. 2016;29(6):859–873. PMID: 27300435.
- Gong C, Bauvy C, Tonelli G, et al. Beclin 1 and autophagy are required for the tumorigenicity of breast cancer stem-like/progenitor cells. Oncogene. 2013;32(18):2261–72, 2272e 1–11. PMID: 22733132.
- Pagotto A, Pilotto G, Mazzoldi EL, et al. Autophagy inhibition reduces chemoresistance and tumorigenic potential of human ovarian cancer stem cells. Cell Death Dis. 2017;8(7):e2943. PMID: 28726781.
- Zhao XL, Lin Y, Jiang J, et al. High-mobility group box 1 released by autophagic cancer-associated fibroblasts maintains the stemness of luminal breast cancer cells. J Pathol. 2017;243(3):376–389. PMID: 28802057.
- Phillips HS, Kharbanda S, Chen R, et al. Molecular subclasses of high-grade glioma predict prognosis, delineate a pattern of disease progression, and resemble stages in neurogenesis. Cancer Cell. 2006;9(3):157–173. PMID: 16530701.
- Colman H, Zhang L, Sulman EP, et al. A multigene predictor of outcome in glioblastoma. Neuro Oncol. 2010;12(1):49–57. PMID: 20150367.