
ABSTRACT
SIRT3 (sirtuin 3), a mitochondrial protein deacetylase, maintains respiratory function, but its role in the regulation of innate immune defense is largely unknown. Herein, we show that SIRT3 coordinates mitochondrial function and macroautophagy/autophagy activation to promote anti-mycobacterial responses through PPARA (peroxisome proliferator activated receptor alpha). SIRT3 deficiency enhanced inflammatory responses and mitochondrial dysfunction, leading to defective host defense and pathological inflammation during mycobacterial infection. Antibody-mediated depletion of polymorphonuclear neutrophils significantly increased protection against mycobacterial infection in sirt3−/- mice. In addition, mitochondrial oxidative stress promoted excessive inflammation induced by Mycobacterium tuberculosis infection in sirt3−/- macrophages. Notably, SIRT3 was essential for the enhancement of PPARA, a key regulator of mitochondrial homeostasis and autophagy activation in the context of infection. Importantly, overexpression of either PPARA or TFEB (transcription factor EB) in sirt3−/- macrophages recovered antimicrobial activity through autophagy activation. Furthermore, pharmacological activation of SIRT3 enhanced antibacterial autophagy and functional mitochondrial pools during mycobacterial infection. Finally, the levels of SIRT3 and PPARA were downregulated and inversely correlated with TNF (tumor necrosis factor) levels in peripheral blood mononuclear cells from tuberculosis patients. Collectively, these data demonstrate a previously unappreciated function of SIRT3 in orchestrating mitochondrial and autophagic functions to promote antimycobacterial responses.
Abbreviations
Ab: antibody; BCG: M. bovis Bacillus Calmette–Guérin; Baf-A1: bafilomycin A1; BMDMs: bone marrow-derived macrophages; CFU: colony forming unit; CXCL5: C-X-C motif chemokine ligand 5; EGFP: enhanced green fluorescent protein; ERFP: enhanced red fluorescent protein; FOXO3: forkhead box O3; HC: healthy controls; H&E: haematoxylin and eosin; HKL: honokiol; IHC: immunohistochemistry; IL1B: interleukin 1 beta; IL6: interleukin 6; IL12B: interleukin 12B; MDMs: monocyte-derived macrophages; MMP: mitochondrial membrane potential; Mtb: Mycobacterium tuberculosis; PBMC: peripheral blood mononuclear cells; PBS: phosphate buffered saline; PMN: polymorphonuclear neutrophil; PPARA: peroxisome proliferator activated receptor alpha; ROS: reactive oxygen species; SIRT3: sirtuin 3; TB: tuberculosis; TEM: transmission electron microscopy; TFEB: transcription factor EB; TNF: tumor necrosis factor
Introduction
Both mitochondrial function and autophagy play key roles in biological homeostasis during a variety of stress conditions, including infection and inflammation [Citation1,Citation2]. Beyond the basic function of mitochondria in energy production, emerging studies have reported that mitochondria also play key roles in the integral regulation of innate immune, inflammatory, and antimicrobial responses [Citation2,Citation3]. Inflammatory mediators, including TNF (tumor necrosis factor), are also associated with mitochondrial damage in that they produce oxygen radicals, which cooperate with inflammation to form a feed-forward loop in degenerative diseases or during infection [Citation4–Citation6]. Dysfunctional mitochondria can be targeted and engulfed by phagophores, the precursors to autophagosomes; thus, the autophagy machinery participates in the mitochondrial quality control network under various physiological or pathological conditions [Citation3,Citation7]. Autophagy activation is also beneficial for controlling the host defense against various pathogenic infections, including Mycobacterium tuberculosis (Mtb), the major pathogen of human tuberculosis (TB) [Citation8–Citation10]. Although mitochondrial function and autophagy pathways constitute the major intracellular homeostatic programs in response to infectious insults, the principal regulator that coordinates both functions is not entirely clear.
SIRT3 (sirtuin 3), a mitochondrial NAD+-dependent deacetylase belonging to class III histone deacetylases, is essential for orchestrating mitochondrial energy metabolism and homeostasis [Citation11,Citation12]. SIRT3 is required to regulate the acetylation status of various metabolic enzymes and proteins involved in oxidative phosphorylation in the mitochondria [Citation13–Citation15]. It is also crucial for mitochondrial protection from DNA damage and oxidative stress-induced cell death, as it activates SOD2 (superoxide dismutase 2, mitochondrial) and CAT (catalase) by reducing reactive oxygen species (ROS) [Citation16]. Moreover, increased expression and activity of SIRT3 improves renal function and ameliorates mitochondrial dysfunction and fragmentation in acute kidney injury [Citation17]. Dysregulation of SIRT3 activity has been reported in aging [Citation18] and multiple pathologies, including cardiovascular diseases, diabetes, intolerance to cold exposure, and pulmonary arterial hypertension [Citation12,Citation14–Citation16,Citation19]. However, the specific role of SIRT3 in the regulation of the innate host defense during mycobacterial infection is unknown.
In this study, Sirt3-deficient mice exhibited increased susceptibility to mycobacterial infection, showing an exaggerated lung inflammatory response and polymorphonuclear neutrophil (PMN) infiltration as well as damaged mitochondria in disease sites and macrophages. Sirt3 deficiency resulted in increased production of mitochondrial ROS, which led to a proinflammatory cytokine response during infection. Prevention of the PMN-induced immunopathology in Sirt3-deficient mice enhanced protection against mycobacterial infection. In addition, both PPARA (peroxisome proliferator activated receptor alpha) and TFEB (transcription factor EB), which are regulated by SIRT3, were required for antibacterial autophagy to promote host defense against Mtb infection. Pharmacological activation of SIRT3 resulted in the maintenance of functional mitochondrial pools and enhanced autophagy, promoting the antimicrobial response against mycobacterial infection. Finally, SIRT3 and PPARA mRNA levels were downregulated, whereas inflammatory cytokine TNF was upregulated, in peripheral immune cells in TB patients. Further data showed the role of SIRT3 in the regulation of inflammatory cytokine generation, autophagy, and antimicrobial responses in human monocytes/macrophages. These data demonstrate a previously unappreciated function of SIRT3 in the anti-mycobacterial host defense through coordinating mitochondrial function and autophagy activation.
Results
SIRT3 is required for host protection during mycobacterial infection in vivo and in macrophages
To identify a role for SIRT3 in the antimicrobial response against intracellular mycobacteria, Sirt3+/+ and sirt3−/- mice were intranasally infected with Mtb or M. bovis Bacillus Calmette–Guérin (BCG). We examined the bacterial loads in the infected lungs and found them to be significantly increased in the lungs of Mtb- or BCG-infected sirt3−/- mice compared to Sirt3+/+ mice (Figure 1(a), Mtb; (b), BCG; at 7 dpi [days post-infection]). We noted that Mtb infection significantly increased mortality in sirt3−/- mice (). In addition, enhanced red fluorescent protein (ERFP)-expressing BCG displayed an increased ERFP signal consistent with bacterial proliferation 7 days after infection in sirt3−/- mice (). Moreover, Mtb or BCG infection induced significantly more granulomatous lesions in the lungs of sirt3−/- mice (; and S1A), which were dominated by neutrophilic infiltrates and necrotic cells, than in Sirt3+/+ mice ( for Mtb; S1B and C for BCG).
Figure 1. SIRT3 is essential for antimicrobial responses against mycobacterial infection in vivo and in vitro. (a-g) Sirt3+/+ and sirt3−/- mice were infected intranasally with various CFU of Mtb (3 × 10⁴ CFU) or BCG (2 × 10⁶ CFU), and monitored at 7 days post infection (dpi). (a and b) log pulmonary CFU (n = 21 for A; n = 14 for b per group). (c) Survival (n = 22, per group). (d and e) In vivo imaging of BCG-RFP-infected lungs from Sirt3+/+ and sirt3−/- mice. Mice (n = 5 each group) were infected intranasally with BCG-RFP (2 × 10⁶ CFU) for 7 dpi prior to sacrifice. (d) Representative in vivo imaging of bacterial fluorescence in representative mice. (e) Quantitative analysis of signal intensity in the infected lungs was assessed by measuring the total photon flux. (f) Lung histopathology by h&e staining of Sirt3+/+ and sirt3−/- mice infected with Mtb for 7 days. Scale bars: 3 mm. (g) The number of granulomatous lesions in lungs of Sirt3+/+ and sirt3−/- mice infected with Mtb for 7 days. (h and i) Neutrophil counts in lung tissues (Representative images for h, Scale bars: 60 µm; numbers of infiltrating neutrophils counted from 10 random fields for I) of Sirt3+/+ and sirt3−/- mice infected with Mtb for 7 days (3 × 10⁴ CFU). (j) Positive immunoreaction for localization of LDH, as an indicator of necrosis, in lung tissues (Representative images for left, Scale bars: 60 µm; numbers of LDH counted from 10 random fields for right) of Sirt3+/+ and sirt3−/- mice infected with Mtb for 7 days (3 × 10⁴ CFU). (k) Intracellular survival of Mtb assessed by CFU assay. Sirt3+/+ and sirt3−/- BMDMs were infected with Mtb (MOI = 1, for left) or BCG (MOI = 10, for right) for 4 h, and then lysed to determine intracellular bacterial loads at 0 and 3 dpi. *P < 0.05, **P < 0.01, ***P < 0.001. Mann-Whitney U test (a, b, e, and g), log-rank (Mantel-Cox) test (c) or Two-way ANOVA (i-k). Data are the combined results from three or four independent experiments (a-c), representative of three independent experiments (d, f, h and j left), and values represent means (± SEM) from three or four independent experiments performed in triplicate (e, g, i, j right, and k).
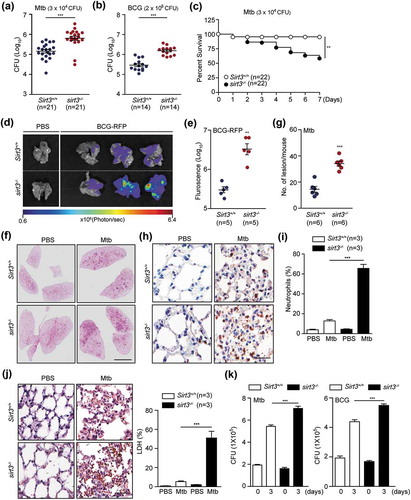
Next, we investigated the effects of SIRT3 in the antimicrobial response in macrophages from Sirt3+/+ and sirt3−/- mice. Sirt3+/+ and sirt3−/- bone marrow-derived macrophages (BMDMs) were subjected to intracellular survival assays after infection with Mtb or BCG. Consistent with the in vivo data, sirt3−/- BMDMs exhibited a significant increase in intracellular Mtb or BCG compared to Sirt3+/+ BMDMs ( for Mtb and BCG, respectively). Collectively, these data indicate that SIRT3 contributes to antimicrobial activity and promotes host survival during mycobacterial infection.
SIRT3 ameliorates pathological inflammation and neutrophil infiltration during mycobacterial infection
As the increased mortality of sirt3−/- mice compared to Sirt3+/+ mice was accompanied by increased bacterial burden and enhanced lung pathology at the early (<14 dpi) stages of infection (), next, we compared the lung inflammatory response and myeloid cell infiltration of Sirt3+/+ and sirt3−/- mice. The mRNA levels of proinflammatory cytokines Tnf and Il6 (interleukin 6) were elevated in sirt3−/- mice at 7 dpi with Mtb (Figure 2(a)). Similarly, the levels of the proinflammatory cytokines TNF and IL6 were markedly elevated in the lungs from sirt3−/- mice compared to those from Sirt3+/+ mice after BCG infection (Figure S2A and B). To qualitatively analyze the inflammatory process in vivo, we examined cytokine production by mononuclear cell types in the lung tissues from Sirt3+/+ and sirt3−/- mice after Mtb infection. As shown in , there were many more TNF-expressing ADGRE1/F4/80-positive macrophages in the lungs of sirt3−/- mice than in Sirt3+/+ mice during Mtb infection. Additionally, CXCL5 (C-X-C motif chemokine ligand 5)-expressing cells, which are related to immunopathology during Mtb infection [Citation20], were significantly increased in Mtb-infected lungs from sirt3−/- mice compared to Sirt3+/+ mice (). The major cellular source of CXCL5 production during Mtb infection was further identified by immunostaining lung tissue samples. Interestingly, CXCL5 expression was highly colocalized with the macrophage marker ADGRE1/F4/80 as well as the alveolar type II epithelial cell-specific marker ABCA3 (ATP binding cassette subfamily A member 3) in the lungs of sirt3−/- mice (data not shown).
Figure 2. SIRT3 is required for controlling pathological inflammation and neutrophil infiltration during mycobacterial infection. (a-e) Sirt3+/+ and sirt3−/- (n = 8 each group) mice were infected intranasally with Mtb (3 × 10⁴ CFU), and monitored at 7dpi. (a) Quantitative real-time PCR of lung Tnf and Il6 mRNA expression; (b and c) TNF immunoreactivity in ADGRE1/F4/80-positive cells in lung tissues (Representative images for b, Scale bars: 50 µm; quantitative analysis for c). (d and e) CXCL5 immunoreactivity in lung tissues (Representative images for d, Scale bars: 50 µm; quantitative analysis for e). (f and g) Sirt3+/+ and sirt3−/- BMDMs were infected with Mtb (MOI = 10) at the indicated times, and then subjected to quantitative real-time PCR (f) and cytokine ELISA (g) analysis. (h) Bacterial burden of Mtb-infected Sirt3+/+ and sirt3−/- mice (n = 5 each group) by depletion of neutrophils. The neutrophil-specific anti-LY6G Ab (clone 1A8) or the isotype control (clone 2A3) was treated 7 days after Mtb infection. *P < 0.05, **P < 0.01, ***P < 0.001 compared with Sirt3+/+ conditions (f and g). Two-way ANOVA (a, c, e, f, and g) or one-way ANOVA with Dunn’s multiple comparison test (h). Data are representative of three independent experiments (b,d and h left), values represent means (± SEM) from three or four independent experiments performed in triplicate (a,c, and e-g), and represent combined results of three independent experiments (h right).
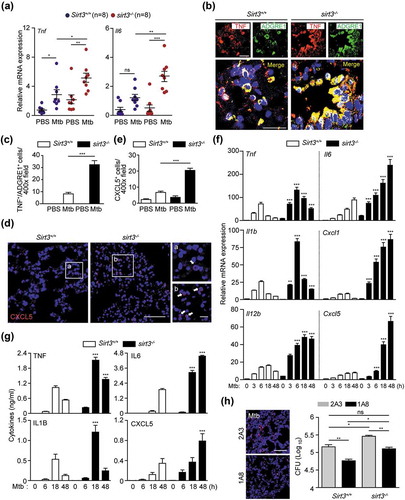
We further compared the Mtb-induced generation of cytokines and chemokines in BMDMs from Sirt3+/+ and sirt3−/- mice after Mtb or BCG infection. Mtb-mediated mRNA generation of Tnf, Il6, Il1b (Interleukin 1 beta), Il12b (Interleukin 12b), Cxcl1 (C-X-C motif chemokine ligand 1), and Cxcl5 was significantly increased in BMDMs from sirt3−/- mice compared to Sirt3+/+ mice after infection in a time-dependent manner (). The protein levels of TNF, IL6, IL1B, and CXCL5 were also increased in sirt3−/- BMDMs compared to Sirt3+/+ BMDMs in response to Mtb infection (). Similarly, BCG-induced cytokine and chemokine generation was significantly increased in sirt3−/- BMDMs compared to Sirt3+/+ BMDMs (Figure S2C and D). Previous studies have shown that neutrophil infiltration is associated with higher bacterial burdens during Mtb infection [Citation20,Citation21]. Therefore, we examined the effects of PMN infiltration on in vivo bacterial loads in sirt3−/- mice. We found that depleting PMN by treatment with anti-neutrophil antibody (Ab) significantly inhibited the in vivo bacterial loads in infected lungs from sirt3−/- mice under both Mtb- and BCG-infected conditions ( and S2E for Mtb and BCG, respectively). It was noted that colony-forming unit (CFU) data from neutrophil depletion in sirt3−/- mice showed comparable results with those from Sirt3+/+ lungs without neutrophil depletion (see lane 1 and 4, no significance; and S2E for Mtb and BCG, respectively). Taken together, these data demonstrate that pathological inflammation and myeloid cell infiltration are greatly higher in sirt3−/- mice and macrophages during mycobacterial infection.
Accumulation of dysfunctional mitochondria and increased oxidative stresses leads to excessive inflammation in Sirt3 deficiency during mycobacterial infection
SIRT3 is crucial for controlling mitochondrial metabolism and homeostasis and protects cells from death under conditions of stress [Citation11,Citation12,Citation16,Citation22]. Thus we assessed whether SIRT3 was required for protection from mitochondrial damage and oxidative stress during mycobacterial infection. Ultrastructural analyses by transmission electron microscopy (TEM) showed a significant accumulation of damaged mitochondria with swollen and disrupted cristae in the infected lungs and BMDMs from sirt3−/- mice compared to Sirt3+/+ mice (Figure 3(a) for lungs and S3A for BMDMs, respectively). However, there were no significant differences in the numbers of swollen mitochondria in uninfected lungs and BMDMs from sirt3−/- mice compared to Sirt3+/+ mice ( for lungs and S3A for BMDMs, respectively).
Figure 3. SIRT3 is required for control of mitochondrial damage, dysfunction, and oxidative stress during mycobacterial infection. (a) Sirt3+/+ and sirt3−/- mice were infected intranasally with Mtb (3 × 10⁴ CFU), and monitored at 7 dpi. The lung tissues were harvested and then subjected to TEM analysis. Mitochondria with complete cristae for a; Swollen mitochondria with vacuolation in the cristae for b. Scale bars: 5 µm. Right, quantification of the results at left. (b-g) BMDMs from Sirt3+/+ and sirt3−/- mice were infected with Mtb (MOI = 10) for 24 h (b-f), and then subjected to flow cytometric analysis for MitoTracker Deep Red and MitoTracker Green (b; quantitative analysis, for right); MitoSOX Red fluorescence (c; Scale bars: 50 µm; quantitative analysis, for d) and TMRE (e and f) analysis. (g) Mtb-infected Sirt3+/+ and sirt3−/- BMDMs were incubated in the presence or absence of scavengers for mitochondrial ROS (mitoTEMPO, 25, 50, 100 μM; NecroX, 10, 25, 50 μM), and subjected to ELISA analysis for measuring the production of TNF, IL6, IL1B, and CXCL5. *P < 0.05, **P < 0.01, ***P < 0.001 compared with SC (g). U, uninfected; SC, solvent control; mito-T, mito-TEMPO. Two-way ANOVA (f and g). Data are representative of three independent experiments (a-c, e), and values represent means (± SEM) from three or four independent experiments performed in triplicate (f and g).
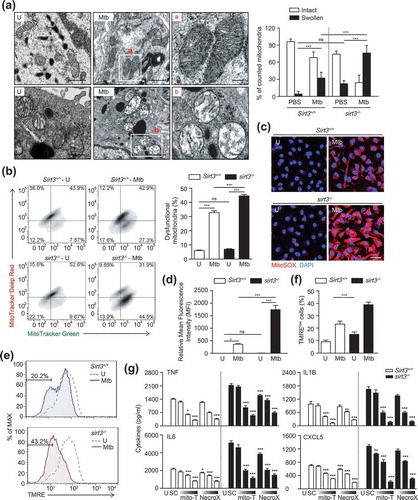
Next, we compared the dysfunctional mitochondrial pools of Sirt3+/+ and sirt3−/- BMDMs by dual staining with MitoTracker Red (respiring) and MitoTracker Green (total) to analyze non-respiring and dysfunctional (MitoTracker Green-positive, MitoTracker Red-negative) mitochondria [Citation23]. In Mtb-infected conditions, the proportion of dysfunctional mitochondrial pool significantly increased in sirt3−/- BMDMs, when compared to those in Sirt3+/+ BMDMs. However, there was no significant difference in the numbers of dysfunctional mitochondria between uninfected sirt3−/- and Sirt3+/+ BMDMs ().
Previous studies have shown that SIRT3 protects mitochondria from oxidative damage by deacetylating SOD2 and FOXO3 (forkhead box O3) [Citation16,Citation23,Citation24]. Therefore, we further examined the mitochondrial redox status in Sirt3+/+ and sirt3−/- BMDMs before and after mycobacterial infection using MitoSOX Red, a highly selective fluorescent probe used to detect mitochondrial O2- [Citation4]. Mtb infection significantly increased mitochondrial O2-generation in sirt3−/- BMDMs compared to Sirt3+/+ BMDMs and did so in a time-dependent manner (Figure S3B and C). Similarly, the fluorescence intensity of MitoSOX Red was significantly increased in sirt3−/- BMDMs compared to Sirt3+/+ BMDMs, in response to Mtb infection (). Moreover, Mtb infection increased the number of cells with reduced mitochondrial membrane potential (MMP) more under Sirt3 deficiency than under Sirt3+/+ conditions ().
Numerous studies have revealed a role for mitochondrial ROS in the activation of inflammatory signaling pathways to stimulate the production of proinflammatory cytokines, such as TNF, IL6, and IL1B [Citation4,Citation24,Citation25]. Thus we pretreated BMDMs with the mitochondrial-targeted antioxidant MitoTEMPO [Citation26] or NecroX [Citation27] during infection with Mtb or BCG. As shown in , treatment of BMDMs with MitoTEMPO or NecroX significantly inhibited the Mtb-induced generation of proinflammatory cytokines, including TNF, IL6, IL1B, and CXCL5, in sirt3−/- and Sirt3+/+ BMDMs in a dose-dependent manner. These data suggest that Sirt3 deficiency leads to increased production of mitochondrial ROS, which enhances the production of proinflammatory cytokines in macrophages during infection.
SIRT3 is essential for the expression of PPARA, which promotes autophagy and mitochondrial homeostasis during mycobacterial infection
To identify the SIRT3 target protein(s) that modulates mitochondrial functions and the antimicrobial response during mycobacterial infection, we performed RNA-Seq analyses to compare the mRNA expression levels between Sirt3+/+ and sirt3−/- BMDMs after Mtb infection. Mtb infection of Sirt3+/+ and sirt3−/- BMDMs resulted in considerable differences in the mitochondrial functions, including genes involved in mitochondrial energy metabolism (Ndufa10, Sdha, Sdhd, and Cox7a1), mitochondrial biogenesis (Nrf1, Ppargc1b, and Tfam), TCA cycle (Acly, Fh1, Idh1, Idh3a, Idh3b, Idh3g, Mdh2, and Pdha1), and glucose and lipid metabolism (Acox1, Fabp7, Irs1, and Ppara), as shown in heatmap analyses (Figure 4(a)). The most striking difference observed between Sirt3+/+ and sirt3−/- BMDMs was the expression levels of the Ppara gene, a key transcriptional regulator of autophagy () [Citation28,Citation29]. Real-time qRT-PCR analyses confirmed that Ppara mRNA expression was significantly decreased in BMDMs and lung tissues of sirt3−/- compared to Sirt3+/+ mice after Mtb infection ( for BMDMs; (c) and (d) for lung tissues). Similarly, Mtb-induced PPARA protein levels were significantly lower in BMDMs from sirt3−/- than from Sirt3+/+ mice (). We noted that Mtb infection inhibited mRNA and protein levels of SIRT3 and PPARA in BMDMs in a time-dependent manner (Figure S4A and B).
Figure 4. SIRT3 is essential for the expression of PPARA, which contributes to mitochondrial homeostasis during mycobacterial infection. (a and b) BMDMs from Sirt3+/+ and sirt3−/- mice were infected with Mtb (MOI = 10), incubated for 24 h, and then subjected to RNAseq analysis. (a) Heatmap analysis of the RNAseq data (representative of triplicate determinations). The most differentially expressed genes were shown between Sirt3+/+ and sirt3−/- BMDMs. The value of each sample in the heatmap was compared to the median values of all 4 conditions. (b) RNAseq analysis was validated with quantitative real-time PCR analysis. (c and d) Sirt3+/+ and sirt3−/- (n = 8 each group) mice were infected intranasally with Mtb (1 × 10⁴ CFU for C; 3 × 10⁴ CFU for D), and monitored at 7 dpi. Quantitative real-time PCR of lung Ppara mRNA expression. (e) Sirt3+/+ and sirt3−/- BMDMs were infected with Mtb (MOI = 10) at the indicated times. PPARA and ACTB protein levels were evaluated by immunoblotting. Right, quantification of the results at left. (f-j) BMDMs from Ppara+/+ and ppara−/- mice were infected with Mtb (MOI = 10), incubated for 24 h (f), 4 h (g), or the times indicated (h); FACS analysis for MitoTracker Deep Red and MitoTracker Green (f); MitoSOX FACS analysis (Representative images for g; quantitative analysis for h); TMRE (Representative images for i; quantitative analysis for j). **P < 0.01, ***P < 0.001. U, uninfected. Two-way ANOVA (b-d, h, and j). Data are representative of three independent experiments (a,e-g and i), and values represent means (± SEM) from three or four independent experiments performed in triplicate (c,d,h and j).
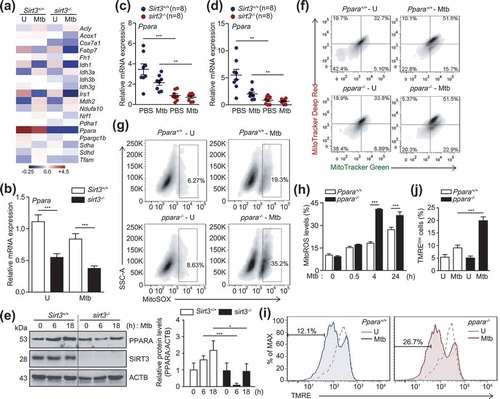
We recently demonstrated that PPARA agonists promoted the macrophage antimicrobial response against mycobacterial infection by activating autophagy and phagosomal maturation [Citation28]. Consistent with a recent study [Citation28], mycobacterial colocalization with LC3 autophagosomes or lysosomes was significantly lower in ppara−/- BMDMs than in Ppara+/+ BMDMs (Figure S5A–D). We further questioned whether PPARA expression is associated with controlling functional mitochondria and mitochondrial ROS production in macrophages during infection. The functional mitochondrial pools were markedly downregulated in ppara−/- BMDMs compared to Ppara+/+ BMDMs after Mtb infection (). In addition, the production of mitochondrial ROS was significantly upregulated in ppara−/- BMDMs after Mtb infection, compared to those in Ppara+/+ BMDMs (). Furthermore, ppara−/- cells showed decreased tetramethylrhodamine, ethyl ester, perchlorate staining during Mtb infection, denoting the loss of mitochondrial ΔΨm in Ppara deficiency during Mtb infection (). These data suggest that PPARA, whose expression is mediated through SIRT3, is involved in autophagy activation and mitochondrial homeostasis during mycobacterial infection.
SIRT3 is essential for antibacterial autophagy and phagosomal colocalization with lysosomes during mycobacterial infection
Several studies have reported the involvement of SIRT3 in autophagy, such as autophagy-induced cell death in cadmium toxicity [Citation30], and autophagic flux in fibroblasts [Citation31]. However, the exact role of SIRT3 in autophagy with respect to the innate immune response during infection has been largely unknown. Interestingly, in this study we found that LC3B expression was significantly increased in Sirt3+/+ BMDMs than in sirt3−/- BMDMs in response to Mtb infection (Figure 5(a)). Previous studies have reported that activation of antibacterial autophagy results in enhanced phagosomal maturation of Mtb during infection [Citation8,Citation9,Citation32]. Thus we investigated whether SIRT3 is required for the colocalization of Mtb with lysosomes during Mtb infection. The contents of the colocalized Mtb phagosomes with LC3 autophagosomes () and with LAMP2 (lysosomal associated membrane protein 2) () were significantly suppressed in Mtb-infected BMDMs from sirt3−/- mice, compared to those from Sirt3+/+ mice. Nevertheless, approximately 10% of Mtb colocalized with LC3 autophagosomes or lysosomes in Mtb-infected sirt3−/- BMDMs (). In addition, the autophagic flux was measured in Sirt3+/+ and sirt3−/- BMDMs using a tandem LC3B retroviral vector containing mCherry-enhanced green fluorescent protein (EGFP)-LC3B. After Mtb infection, the levels of red (mCherry; acid stable) punctate structures, which indicate autolysosomes (acidic pH quenches GFP fluorescence), were significantly decreased in sirt3−/- BMDMs compared to Sirt3+/+ BMDMs (Figure S6). Furthermore, ultrastructural findings showed a significant decrease in Mtb inside autophagosomes in the infected lungs of sirt3−/- mice, compared to those of Sirt3+/+ mice (). However, approximately 20% of the Mtb was still observed inside autophagosome-like structures in lung tissues from sirt3−/- mice by TEM analyses ().
Figure 5. SIRT3 is essential for activation of antibacterial autophagy and phagosomal colocalization with lysosomes during mycobacterial infection. (a-e) BMDMs from Sirt3+/+ and sirt3−/- mice were infected with Mtb (a) or Mtb-ERFP (b-e) at MOI of 10, and incubated for 24 h (a), 4 h (b and c) or 6 h (d and e). (a) Representative images of FACS analysis for LC3B. Right, quantification of the results at left. (b-e) Cells were stained with Alexa 488-conjugated LC3 Ab (green; for b), LAMP2 Ab (green; for d), and DAPI (blue; for nuclei). (b and d) Representative immunofluorescence images of three independent replicates are shown. Scale bars: 5 µm. (c and e) Quantitative data of colocalization analyses showing the means ± SEM of three independent experiments, with each experiment including at least 100 internalized mycobacteria scored in seven random fields. (f) Sirt3+/+ and sirt3−/- mice were infected intranasally with Mtb (3 × 10⁴ CFU), and monitored at 7 dpi. Below, the enlarged TEM images of the selected areas (asterisks) of Sirt3+/+ and sirt3−/- lung tissues. Representative TEM images from three independent experiments are shown. Scale bars: 5 µm. (g) Quantitation of 100 internalized mycobacteria per experimental condition. (H-J) BMDMs from Sirt3+/+ and sirt3−/- mice were transduced with a control adenovirus, virus expressing a mouse SIRT3 plasmid for 36 h. (h) The cells were infected with Mtb-ERFP (MOI = 10) for 4 h, and then stained with Alexa Fluor 488-conjugated LC3 Ab (green) and DAPI (blue; for nuclei). Representative immunofluorescence images of three independent replicates are shown. Scale bars: 5 µm. Right, qPCR analysis for overexpression efficiency of adenovirus containing mouse SIRT3 plasmid or a control adenovirus. (i) Quantitative data of colocalization analyses showing the means ± SEM of three independent experiments, with each experiment including at least 100 internalized mycobacteria scored in seven random fields. (j) The cells were infected with Mtb (MOI = 1) for 4 h, then lysed to determine intracellular bacterial loads at 3 dpi. ***P < 0.001. ns, not significant. U, uninfected. Mann-Whitney U test (c and e) or one-way ANOVA (g,i and j). Data are representative of three independent experiments (a,b,d,f and h), and values represent means (± SEM) from three or four independent experiments performed in triplicate (c,e,g,i and j).
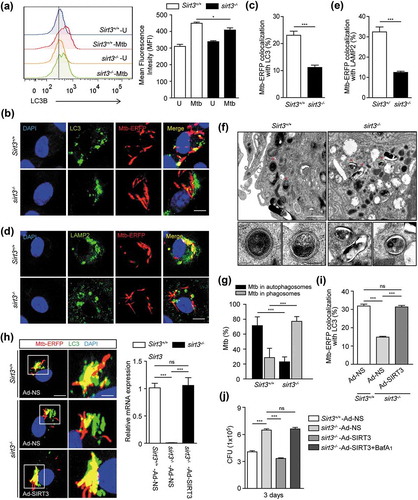
We further examined whether SIRT3 overexpression increased autophagic host defense against Mtb infection in sirt3−/- BMDMs. We transduced sirt3−/- BMDMs with SIRT3 adenovirus prior to infection, and then investigated the colocalization of Mtb phagosomes and autophagosomes, and the antimicrobial responses against Mtb infection. SIRT3 overexpression in sirt3−/- BMDMs significantly increased the autophagosomal trap of Mtb, and intracellular killing effects (). Bafilomycin A1 (Baf-A1) treatment significantly reversed the SIRT3-mediated increase in antimicrobial responses in sirt3−/- BMDMs, which suggests that autophagic flux is specifically involved in the activation of anti-mycobacterial responses (). Collectively, these data suggest that SIRT3 is required for the activation of autophagy to promote antimicrobial host defense during Mtb infection.
Either PPARA or TFEB overexpression in sirt3−/- BMDMs promotes phagosomal colocalization with autophagosomes/lysosomes and antimicrobial responses against Mtb infection
Previous data on the SIRT3-PPARA axis in mycobacterial infection prompted us to investigate whether PPARA contributes to the SIRT3-mediated autophagic clearance of Mtb infection. For this, we transduced sirt3−/- BMDMs with PPARA adenovirus prior to infection, and examined whether this was sufficient to rescue the SIRT3 defect. We found that PPARA overexpression in sirt3−/- BMDMs significantly increased the colocalization of Mtb with autophagosomes/lysosomes (Figure 6(a,b)), and intracellular killing effects ().
Figure 6. Either PPARA or TFEB enhances phagosomal colocalization with autophagosomes/lysosomes, and antimicrobial responses against Mtb infection. (a-c and e-g) BMDMs from Sirt3+/+ and sirt3−/- mice were transduced with a control adenovirus, virus expressing a mouse PPARA (a-c) or TFEB (e-g) plasmid for 36 h. (a,b,e and f) The cells were infected with Mtb-ERFP (MOI = 10) for 4 h (a and e) or 6 h (b and f), and then stained with Alexa 488-conjugated LC3 Ab (green; for a or e), LAMP2 Ab (green; for b or f), and DAPI (blue; for nuclei). Representative immunofluorescence images of three independent replicates are shown. Scale bars: 5 µm. Quantitative data of colocalization analyses showing the means ± SEM of three independent experiments, with each experiment including at least 100 internalized mycobacteria scored in seven random fields. (c and g) The cells were infected with Mtb (MOI = 1) for 4 h, then lysed to determine intracellular bacterial loads at 3 dpi. G Right, qRT-PCR analysis for overexpression efficiency of adenovirus containing mouse TFEB plasmid or a control adenovirus. (d) Sirt3+/+ and sirt3−/- BMDMs were infected with Mtb (MOI = 10) at the indicated times, and then subjected to quantitative real-time PCR. *P < 0.05, **P < 0.01, ***P < 0.001 compared with Sirt3+/+ conditions (f). ns, not significant. Two-way ANOVA (d) or one-way ANOVA (a-c and e-g). Data are representative of three independent experiments (a left, b left, e left, and f left), and values represent means (± SEM) from three or four independent experiments performed in triplicate (A right, B right, C,D,E right, F right, G).
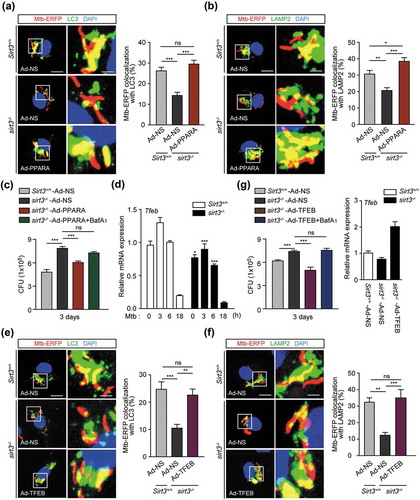
In a previous study, we found that Tfeb, a downstream gene of Ppara, was essentially involved in autophagy activation and antimicrobial responses during mycobacterial infection. Hence, we examined the effects of TFEB overexpression in sirt3−/- BMDMs upon Mtb trap by autophagosomes/lysosomes and intracellular bacterial growth. The mRNA expression of Tfeb was significantly inhibited in sirt3−/- BMDMs compared to Sirt3+/+ BMDMs, in a time-dependent manner (). Similar to the results of PPARA overexpression, transduction of sirt3−/- BMDMs with TFEB adenovirus significantly increased phagosomal colocalization with autophagosomes/lysosomes (), and antimicrobial host defense against Mtb infection (). Baf-A1 treatment significantly reversed the PPARA and TFEB overexpression effects on antimicrobial responses in sirt3−/- BMDMs, which suggests that autophagic flux plays a critical role in the activation of host defenses (). Collectively, these data suggest that the PPARA and TFEB pathway is essential in the SIRT3-mediated autophagic clearance of Mtb infection.
SIRT3 activation enhances autophagy and antimicrobial responses and ameliorates mitochondrial damage and oxidative stress during Mtb infection
A biphenolic compound, honokiol (HKL), was recently identified as a specific SIRT3 activator that has a beneficial effect on the cardiac hypertrophic response [Citation22]. We investigated whether SIRT3 activation by HKL enhanced autophagy and antimicrobial effects in macrophages. Stimulation of Sirt3+/+ BMDMs with HKL significantly increased the formation of LC3-positive autophagic punctate structures and enhanced LC3B expression levels (Figure 7(a–c)). However, the numbers of LC3 punctate structures and LC3B levels were significantly lower in sirt3−/- BMDMs than in Sirt3+/+ BMDMs in response to HKL (). We also compared the effects of HKL on the activation of autophagic flux in Sirt3+/+ and sirt3−/- BMDMs. Transduction of BMDMs with a tandem-LC3 retroviral vector (mCherry-EGFP-LC3B) increased the amount of red (mCherry) punctate structures, which indicate the positions of autolysosomes (acidic pH quenches GFP fluorescence), in Sirt3+/+ BMDMs following HKL stimulation. However, there were fewer of these red structures in sirt3−/- BMDMs than in Sirt3+/+ BMDMs ().
Figure 7. SIRT3 activation enhances antibacterial autophagy, antimicrobial responses and ameliorates mitochondrial damage and oxidative stress during mycobacterial infection. (a-c) BMDMs from Sirt3+/+ mice were stimulated with HKL (20 uM) for 24 h. Alexa Fluor 488-conjugated LC3 (green) and DAPI (blue) were detected by confocal microscopic analysis. (b) Quantitative analysis of LC3 puncta per cell. (c) Flow cytometric analysis of LC3B expression. Average MFIs of LC3B expression. (d) Sirt3+/+ and sirt3−/- BMDMs were transduced with retroviruses expressing a tandem-tagged mCherry-EGFP-LC3B and then infected with Mtb (MOI = 10) for 24 h. Cells were mCherry or EGFP expressing LC3B was detected by confocal microscopy. Scale bar: 5 μm. (e-j) Sirt3+/+ and sirt3−/- BMDMs were infected with Mtb (MOI = 1 for e or MOI = 10 for f-j) for 4 h and then treated with HKL (2, 10, and 20 μM) for 3 days (e) or 24 h (f-j, HKL 20 μM). (e) Intracellular survival of Mtb assessed by CFU assay. (f and g) Mtb-ERFP (red), Alexa Fluor 488-conjugated LAMP2 (green), and DAPI (blue) were detected by confocal microscopy. (f) Representative immunofluorescence images of three independent replicates are shown. Scale bar: 5 μm. (g) Quantitative data of colocalization analyses showing the means ± SEM of three independent experiments, with each experiment including at least 100 internalized mycobacteria scored in seven random fields. (h-i) MitoSOX FACS analysis (Representative images, for H; quantitative analysis, for I). (j) FACS analysis for MitoTracker Deep Red and MitoTracker Green. **P < 0.01, ***P < 0.001, ns, not significant. U, uninfected; M, Mtb; HKL, honokiol; N, nuclei. Two-way ANOVA (b,c,g and i) or one-way ANOVA (e). Data are representative of three independent experiments (a,d,f and h-j), and values represent means (± SEM) from three or four independent experiments performed in triplicate (B,C,E,G and I).
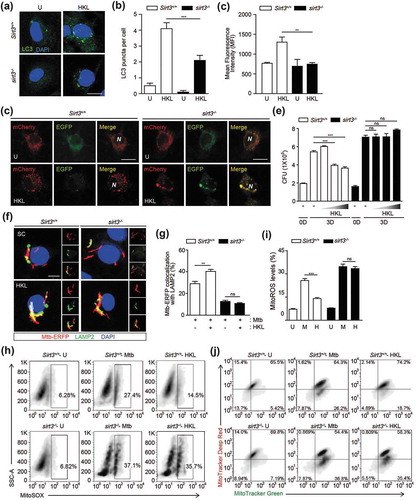
Next, we examined the effects of HKL on antimicrobial responses in BMDMs. As shown in , treatment of Sirt3+/+ BMDMs with HKL significantly inhibited intracellular Mtb survival in a dose-dependent manner. However, these effects were markedly attenuated in sirt3−/- BMDMs (). In addition, the HKL-mediated increased colocalization of bacterial phagosomes with LAMP2 was significantly abrogated in sirt3−/- BMDMs, compared to Sirt3+/+ BMDMs (). We further investigated whether SIRT3 activation diminished mitochondrial damage or ROS generation during Mtb infection. HKL treatment dramatically inhibited mitochondrial ROS generation by Mtb infection. However, these effects were sharply abolished in sirt3−/- BMDMs (). In addition, HKL treatment markedly inhibited the number of dysfunctional non-respiring mitochondria (MitoTracker Green-positive, MitoTracker Red-negative) in Sirt3+/+ BMDMs after Mtb infection (). However, the same treatment did not affect the functional/dysfunctional mitochondrial pool in sirt3−/- BMDMs during Mtb infection (). Furthermore, SIRT3 activation significantly recovered the Mtb-mediated loss of MMP in Sirt3+/+ BMDMs; however, these effects were not detected in sirt3−/- BMDMs (Figure S7). These data indicate that the activation of SIRT3 is required for autophagy, phagosomal colocalization with lysosomes, and the antimicrobial response, and that it protects mitochondria during mycobacterial infection in macrophages.
Levels of SIRT3 and PPARA are lower, whereas TNF levels are higher, in peripheral blood mononuclear cells (PBMCs) from TB patients
The identification of the critical roles of SIRT3 and PPARA in host protection through controlling excessive inflammation during mycobacterial infection led us to examine SIRT3, PPARA, and TNF levels in PBMCs from active pulmonary TB patients. In total, 48 TB cases and 50 HCs (healthy control) were assessed using real-time qPCR analyses. The clinical and epidemiological information (severity of disease, radiological lesions, leukocyte counts, bacilloscopy, and so forth) of the enrolled subjects is included in Table S1.
Interestingly, SIRT3 mRNA levels were significantly lower in PBMCs from TB patients than in those from HCs (P < 0.001; Figure 8(a)). In addition, PPARA mRNA levels were significantly lower in TB patients (P < 0.001; ). By contrast, TNF levels were significantly higher in TB patients (P < 0.001; ). Notably, there was a significant correlation between SIRT3 and PPARA levels (P < 0.001; ). An inverse correlation was observed between TNF and SIRT3 levels (P = 0.014; ). We further examined the role of SIRT3 in human macrophages. To this end, we transduced human primary monocyte-derived macrophages (MDMs) with lentiviral shRNA specific to SIRT3, and measured the TNF levels in response to Mtb infection. As shown in , knockdown of SIRT3 significantly increased TNF mRNA and protein levels of TNF in human primary MDMs after Mtb infection. Although we could not examine all samples from HC and TB subjects, TNF levels were significantly higher in the sera of TB patients than in HC (data not shown). In addition, the mRNA expression levels of other proinflammatory cytokines IL1B and IL6, but not IL17A, were significantly higher in TB patients than in HC subjects (data not shown). These data suggest that SIRT3 and PPARA levels were lower, whereas levels of inflammatory cytokines TNF, IL1B, and IL6 were higher, in peripheral immune cells from TB patients.
Figure 8. The SIRT3 levels are decreased in PBMCs from TB patients. (a-e) Human PBMCs were isolated from healthy controls (HC; n = 50) and TB patients (TB; n = 48). Quantitative real-time PCR of SIRT3 (a), PPARA (b), and TNF (c) mRNA expression. (d and e) Correlation of the expression of SIRT3 and PPARA (Spearman r = 0.735, P < 0.001), TNF and SIRT3 (Spearman r = −0.249, P = 0.014) by Pearson regression in PBMCs from HC and TB patients. (f-g) Human MDMs were transduced with non-specific shRNA (shNS) or SIRT3-specific shRNA (shSIRT3)-expressing lentivirus for 48 h and infected with Mtb (f and i) or Mtb-ERFP (g) at MOI of 1 (i) or 10 (f and g) and then, treated HKL (20 μM) for 6 h (f, left) or 24 h (f, right and g) or 3 days (i). Right, qRT-PCR analysis for knockdown efficiency of shSIRT3-expressing lentivirus. The cells were subjected to quantitative real-time PCR (f, left) and cytokine ELISA (f, right) analysis. (g) Alexa488-conjugated LC3 (green) and DAPI (blue) were detected by confocal microscopic analysis. Quantitative analysis of LC3 puncta per cell). (h) Mtb-ERFP (red), Alexa 488-conjugated LAMP2 (green), and DAPI (blue) were detected by confocal microscopy. Representative immunofluorescence images of three independent replicates are shown. Scale bar: 5 μm. Quantitative data of colocalization analyses showing the means ± SEM of three independent experiments, with each experiment including at least 100 internalized mycobacteria scored in seven random fields. (i) Intracellular survival of Mtb assessed by CFU assay. The intracellular bacterial loads were determined at 0 and 3 dpi. **P < 0.01, ***P < 0.001. ns, not significant. U, uninfected; HKL, honokiol; N, nuclei. Mann-Whitney U test (a-c and h), Spearman correlation (d-e), Two-way ANOVA (f and g) or one-way ANOVA (i). Data are representative of three independent experiments (G right, H right), and values represent means (± SEM) from three or four independent experiments performed in triplicate (A-F, G right, H right and I).
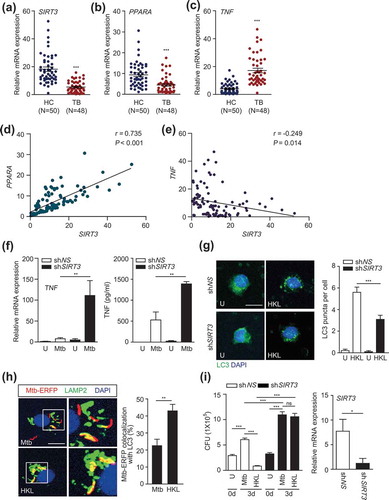
We further determined whether the activation of SIRT3 upregulated autophagy and antimicrobial responses in human primary monocytes/macrophages. As shown in , we found that HKL treatment led to a robust increase in LC3 punctate autophagosome structures, which were significantly inhibited by silencing SIRT3 in human monocytes (). In addition, treatment of human MDMs with HKL significantly increased the colocalization of Mtb with lysosomes (). Furthermore, we performed intracellular mycobacterial survival assays in human MDMs in the presence or absence of HKL. Adding HKL significantly decreased intracellular bacterial loads in human MDMs. Importantly, silencing SIRT3 dramatically decreased HKL-induced killing effects against Mtb in human MDMs (). Together these data suggest that SIRT3 is required for HKL-induced autophagy and antimicrobial effects against Mtb infection in human macrophages.
Discussion
Emerging evidence supports a key function of mitochondria in the regulation of the innate immune response against various intracellular pathogens, particularly during viral infection [Citation3,Citation33]. However, the mechanisms by which mitochondria orchestrate the antimicrobial innate response against mycobacterial infections are poorly understood. We found that SIRT3 plays an essential role in promoting antimicrobial host defense against Mtb and BCG that acts by ameliorating excessive pathological inflammation during infection, controlling mitochondrial damage and oxidative stress, and activating antibacterial autophagy via SIRT3-PPARA-TFEB signaling. Further, SIRT3 activation by pharmacological activators promoted autophagy, phagosomal maturation, mitochondrial homeostasis, and the antimicrobial response against mycobacterial infection.
Mitochondrial SIRT3 is an NAD+-dependent deacetylase that is critical for numerous mitochondrial functions, including respiration, energy metabolism, fatty acid β-oxidation, and antioxidant activities [Citation11,Citation13,Citation14,Citation34]. As such, it is an attractive therapeutic target for the treatment of metabolic and cardiovascular diseases, cancer, renal diseases, and aging [Citation17,Citation22,Citation35,Citation36]. In the current study, we challenged Sirt3+/+ and sirt3−/- mice with Mtb or BCG and found that Sirt3 deficiency led to increased susceptibility to mycobacterial infection in vivo and in vitro. In sirt3−/- mice, we observed increased production of inflammatory cytokines and chemokines as well as neutrophil infiltration in the infected lungs. The inflammatory response during Mtb infection is needed for the primary host defense; however, excessive production of TNF and proinflammatory cytokines is strongly associated with pathological responses to mycobacterial infection [Citation20,Citation21,Citation37]. In addition, PMN infiltration is implicated in lung pathological damage and infection progression in a context-dependent manner [Citation20,Citation21]. A recent study showed that SIRT3 deficiency had no major impact on host defenses against several bacterial and fungal infections [Citation38]. Our data demonstrate that SIRT3 plays a role in anti-mycobacterial host defenses, at least partly, through controlling excessive pathological inflammation and lung damage in sirt3−/- mice after Mtb infection. Importantly, depletion of PMN significantly increased host protection in sirt3−/- mice during Mtb or BCG infection. These data indicate that increased pulmonary inflammation with dysfunctional PMN response contributes to the increased susceptibility to mycobacterial infection in sirt3−/- mice. Our findings are partly coincident with the report by Kimmey et al. [Citation21], in that controlling the excessive inflammatory responses and neutrophil infiltration promotes anti-mycobacterial responses during Mtb infection. However, the high-dose inoculum (3 x 10⁴ CFU) in this study is not typical, because most papers have performed in vivo experiments with a lower dose of CFU [Citation20,Citation21,Citation39–Citation41]. Future studies are needed to examine whether the low-dose inoculum will exert similar effects upon the differences in pathological inflammation and susceptibility between Sirt3+/+ and sirt3−/- mice.
Mitochondria are an inevitable source of ROS, which are generated from respiratory and metabolic pathways and thus are crucial in the diverse signaling pathways involved in biological responses, including immune regulation and autophagy [Citation2,Citation42]. However, excessive production of mitochondrial ROS is associated with diverse pathophysiological conditions related to a variety of inflammatory and autoimmune diseases [Citation4,Citation25,Citation43]. Indeed, blockade of mitochondrial ROS may contribute to a novel therapeutic strategy for autoinflammatory diseases as this reduces lipopolysaccharide-induced inflammatory cytokine production in macrophages [Citation4]. In addition, excessive oxidative stress, which is largely derived from mitochondria and NOX (NADPH oxidase), is detrimental to host cell survival during infection with an Mtb eis-deletion mutant [Citation44]. However, the precise roles of mitochondrial ROS in the regulation of the host inflammatory response during mycobacterial infection remain largely unknown. Our data show that exaggerated mitochondrial ROS generation is associated with a hyper-inflammatory response against Mtb or BCG in Sirt3-deficient macrophages. These data support previous findings in zebrafish infection models, which showed that an increase in TNF-induced ROS is bactericidal in the initial phases but later becomes detrimental to the host by releasing mycobacteria into the extracellular milieu [Citation5].
Recent efforts have shed light on the potential roles of autophagy in host-directed therapies against mycobacterial infections [Citation45]. In contrast to SIRT1 [Citation46,Citation47], which is essential for autophagy activation, there have been few reports on the function of SIRT3 in autophagy. Previous studies have demonstrated the involvement of SIRT3 in the regulation of autophagy or mitophagy in various pathological conditions [Citation30,Citation31]. Recently, it was shown that SIRT3, by regulation of acetylation of ATG5 (autophagy related 5), activates macrophage autophagy to regulate NLRP3 (NLR family pyrin domain containing 3) inflammasome activation [Citation48]. We found that SIRT3 is critical for host defense against Mtb infection through activation of autophagy. During Mtb infection, a portion of Mtb is released into the cytosol via the ESX-1 system to be targeted by autophagy through a cytosolic DNA recognition- and ubiquitin-mediated pathway [Citation32]. In this study, SIRT3 reconstitution in sirt3−/- BMDMs significantly recovered the autophagy activity to enhance antimicrobial responses against Mtb infection. Based on the previous findings that BCG cannot be usually targeted by autophagy due to an absence of the ESX secretion system [Citation32,Citation49], the current data suggest that SIRT3-mediated autophagy activation plays a unique role in the activation of host defense against Mtb infection.
One notable finding of our study was that the expression of PPARA, a key regulator of autophagy and inflammation [Citation28,Citation29], was modulated by SIRT3 in macrophages during mycobacterial infection. PPARA is a key transcription factor that mediates the nucleo–mitochondrial interactions regulating inflammation, lipid metabolism, and mitochondrial functions in various tissues and cells [Citation50–Citation52]. We recently showed that PPARA activation enhances multiple autophagy-related and lysosomal genes including Lamp2, Rab7, and Tfeb in macrophages following Mtb or BCG infection [Citation28]. In this study, we further confirmed that PPARA, as a downstream effector of SIRT3, is critically involved in the activation of antibacterial autophagy and maintenance of mitochondrial homeostasis during mycobacterial infection. Indeed, the PPARA-TFEB pathway plays an essential role in the activation of phagosomal maturation and the antimicrobial response, as well as in controlling the inflammatory response during infection [Citation28]. We also found that Mtb-induced TFEB expression in macrophages is dependent on SIRT3. Importantly, overexpression of either PPARA or TFEB in sirt3−/- BMDMs significantly recovered phagosomal colocalization with autophagosomes and lysosomes, as well as antimicrobial responses against Mtb infection. Combined with previous studies [Citation28], our data suggest that SIRT3-mediated autophagy activation, which is mediated through PPARA-TFEB pathway, contributes to antimicrobial host defenses against Mtb infection.
The crosstalk between autophagy and mitochondrial dynamics is essential for mitochondrial quality control, as it targets and eliminates dysfunctional mitochondria [Citation53]. The deletion of essential autophagy genes in yeast caused mitochondrial defects, with reduced oxygen consumption rates and higher levels of mitochondrial ROS [Citation54]. Several autophagy proteins and autophagy pathways are involved in excessive inflammation and inflammasome activation via inhibition of mitochondrial injury and protection from mitochondrial DNA translocation into the cytosol [Citation2]. In this study, we showed that treating macrophages with HKL activated autophagy and increased the intact mitochondrial pool during mycobacterial infection. Combined with a previous report that showed that HKL is a pharmacological activator of SIRT3 and reduces ROS synthesis [Citation22], these data strongly suggest that SIRT3 is essential for attenuating oxidative injury and pathological inflammation during a variety of stress conditions, as it activates autophagy. Nevertheless, HKL has off-target effects that are independent of Sirt3 [Citation55–Citation57], the application of HKL should be carefully considered in terms of anti-mycobacterial therapeutic development.
Of particular note is the finding that SIRT3 and PPARA levels were downregulated, whereas inflammatory cytokine TNF, IL1B, and IL6 levels were upregulated in PBMCs from human TB patients. Numerous previous studies have reported an increased inflammatory cytokine profile in human TB [Citation58–Citation61]. Our study is the first to report the clinical relevance of SIRT3 and PPARA levels in human TB, presumably related to inflammatory responses in the pathogenesis of TB. Although our data suggest that SIRT3 plays a role in the regulation of inflammation and autophagy in human cells, we did not observe any relationships between SIRT3-PPARA levels and clinical parameters, e.g., the severity of TB diseases (data not shown). Future studies are required to elucidate the exact roles of the SIRT3-PPARA-TFEB axis in terms of clinical relevance in human TB. The efforts investigating the functional activation of SIRT3 may contribute to the development of potential therapeutic candidates for use in host-directed treatment of TB.
Materials and methods
Mycobacterial strains and cultures
The mycobacterial strains of Mtb H37Rv, BCG, Mtb-ERFP, and BCG-ERFP were cultured as described [Citation28]. Mtb and BCG were grown in Middlebrook 7H9 Broth (Difco, 271310) supplemented with 10% OADC (BD Biosciences, 212240), 0.5% glycerol (Sigma-Aldrich, G5516), and 0.05% Tween-80 (Sigma-Aldrich, P1754). Mtb- or BCG-ERFP strains were grown in Middlebrook 7H9 broth supplemented with 10% OADC and selected 50 μg/ml kanamycin (Sigma-Aldrich, 60615). All mycobacterial strain suspensions were aliquoted and stored at −80°C. Mid-logarithmic-phase bacteria (optical density 0.6) were used in all experiments. CFUs were enumerated on Middlebrook 7H10 agar (Difco, 262710).
Abs and chemicals
HKL (H4914) was purchased from Sigma-Aldrich. Mito-Tempo (ALX-430-150) and Necrox (ALX-430-167) were purchased from Enzo Life Sciences. Alexa Fluor 594-conjugated anti-mouse IgG (A-11005) and Alexa Fluor 594-conjugated anti-rabbit IgG (A-21207) were purchased from Molecular Probes. Baf-A1 (196000) was purchased from Calbiochem. ACTB (actin beta; sc-1616) was purchased from Santa Cruz Biotechnology. Abs for SIRT3 (5490S) and PPARA (ab45859) were purchased from Cell Signaling Technology and Abcam, respectively.
Mice and isolation of primary mouse BMDMs
Sirt3+/+, sirt3−/-, Ppara+/+, and ppara−/- mice were maintained under specific pathogen-free conditions in Chungnam National University School of Medicine. Mice were 6–8 weeks of ages and were sex-matched for each experiments. All mice were bred and housed for experiments in accordance with the Chungnam National University School of Medicine and Korea Research Institute of Bioscience and Biotechnology (KCDC-15-3-01) in biosafety level (BSL)-3 laboratory facilities. Mice experimental protocols were approved by the Institutional Animal Care and Use Committee of Chungnam National University (CNU-00751) and Korea Research Institute of Bioscience and Biotechnology (KRIBB-AEC-16174).
Primary mouse BMDMs were isolated and cultured as described [Citation62]. BMDMs were isolated and differentiated after culture for 4 to 5 days in medium containing 25 ng/ml macrophage colony-stimulating factor (R&D Systems). The culture medium consisted of DMEM supplemented with 10% FBS, and penicillin-streptomycin-amphotericin B. BMDMs were cultured in a 37°C, 5% CO2 atmosphere.
Mycobacterial infection of mice
Mycobacterial infection in Sirt3+/+ and sirt3−/- mice were performed as described previously [Citation28]. Groups of male 6–8 week old mice were infected intravenously or intranasally with BCG (1 x 10⁵ or 2 × 10⁶ CFU/mouse) or Mtb (1 or 3 × 10⁴ CFU/mouse) for 7 or 14 days. At 24 h post-infection, the numbers of bacteria in the lungs of at least three mice were determined to confirm the Mtb and BCG inoculum. The dose determined from these mice is assumed to represent the average inoculum of mice from each group.
CFU of mycobacteria-infected lungs
For CFU of Mtb or BCG infected mice, lungs were harvested at 7 days. For measurement of the bacterial burden, the lungs were homogenized in phosphate buffered saline with Tween 20 (Sigma-Aldrich, P1379), and serial dilutions of the homogenates were plated on duplicate plates of Middlebrook 7H10 agar. Bacterial colonies were counted after 21 days of incubation at 37°C.
Immunopathology and immunohistochemistry (IHC) on mycobacteria-infected lungs
Lungs were harvested from mice infected with Mtb or BCG for 7 or 14 days. Lungs were fixed in 10% formalin and embedded in paraffin wax. For histopathology, lung parraffin section (4 µm) were cut and stained for haematoxylin and eosin (H&E). For analysis of the extent of tissue necrosis, IHC for LDH localization was performed as described previously [Citation63]. Sections were incubated with anti-LDH (Abcam, ab84716) Ab overnight and secondary-HRP conjugated Ab (Abcam, ab205718) followed by DAB substrate (colorimetric; Thermo Fisher Scientific, 34002). Sections were counterstained with hematoxylin-7211. H&E, LDH, and neutrophil staining were scanned with Aperio digital pathology slide scanner (Leica Biosystems, Germany) and imaged using an Aperio ScanScope® CS System (Leica Biosystems, Germany). For IHC staining [Citation29], lung paraffin sections (4 µm) were cut and immunostained with Abs specific for neutrophil (Abcam, ab2557) TNF (Santa Cruz Biotechnology, sc-52,746), CXCL5 (Abcam, ab198505), ADGRE1/F4/80 (Santa Cruz Biotechnology, sc-52664), Immunoglobulins (Dako, P0450). IHC stained lung tissue slides were examined using a confocal laser-scanning microscope. To analyze inflammation in Mtb infected mice lung, the ImageJ software was used. Slides were assayed in triplicate, and at least 200 cells per well were counted.
Detection of cytokines in lungs
For measurement of mRNA expression levels, lungs were harvested from mice infected with Mtb or BCG for 7 days. Total RNA from homogenized lungs were isolated using TRIzol reagent (Qiagen, 79306) and used for synthesis of cDNA using Superscript II reverse transcriptase. The cDNA were subjected to qPCR and data analysis performed relative quantification using the 2-ΔΔCt method with Gapdh. Data were expressed as relative fold changes. For measurement of cytokine production in serum, Sirt3+/+ and sirt3−/- mice infected with BCG for 7 days. Serum was analyzed using a Mouse ELISA Kit to detect TNF and IL6. All the assays were performed as recommended by the manufacturer’s instructions.
Optical fluorescence imaging
For Optical fluorescence imaging, Sirt3+/+ and sirt3−/- mice were intranasally injected with BCG-ERFP (2 x 10⁶ CFU/mouse) for 7 days. To check bacterial colonization in lung, ex vivo fluorescence imaging was performed using an optical imaging system (Night OWL LB983, Berthold Technologies, USA). At 7 days after bacterial infection, mice were sacrificed and lungs were excised for ex vivo imaging. BCG RFP-expressing bacteria were detected with excitation/emission wavelength at 530/600 nm with an exposure of 60 s. Data were analyzed with IndiGo software (Berthold Technologies).
1A8-mediated neutrophil depletion
Sirt3+/+ and sirt3−/- mice were infected intranasally with Mtb (3 x 10⁴ CFU/mouse) or BCG (2 x 10⁶ CFU/mouse) under 20 μl in each nostril. In vivo depletion of neutrophils, mice treated with 0.2 mg anti-LY6G mAb (neutrophil depleting, clone 1A8; BioXcell,BP0075-1) or anti-IgG2a Ab (isotype control, clone 2A3; BioXcell, BE0085) via intraperitoneal injection every 24 h between days 3 and 6 post infection. Efficacy of PMN depletion was confirmed by loss of anti-LY6G in lungs at 7 dpi. For IHC staining, lung paraffin sections (4 µm) were cut and immunostained with specific monoclonal Ab for neutrophil (anti-LY6G mAb).
Human study population
Human peripheral blood samples were collected from 98 individuals: 50 HC (median age 48.92 ± 29.26 y; male 46%; tuberculin-negative) and 48 active pulmonary TB patients (median age 52.82 ± 23.91 y; male 47.9%). Individual samples from TB patients were diagnosed for Mtb by chest x-ray, Ziehl-Neelsen staining, mycobacterial culture, and PCR. All TB patients were enrolled based on their diagnosis prior to chemotherapy treatment. All samples were HIV negative. All human HC and TB patient samples were approved by the Chungnam National University Hospital Bioethics Committee (project license: CNUH 2014-04-039-009) and informed written consent was obtained from all participants.
Isolation and culture of primary human PBMCs and MDMs
Human PBMCs were isolated from heparinized venous blood using Ficoll-Hypaque (Lymphoprep; Axis-Sheid, 1114545) as described previously [Citation62]. For macrophage differentiation, adherent monocytes were incubated in RPMI 1640 (Lonza, 12-702F) with 10% pooled human serum (Lonza, 14-402), 1% L-glutamine, 50 IU/ml penicillin, and 50 mg/ml streptomycin for 1 h at 37°C, and nonadherent cells were removed. Human MDMs were prepared by culturing peripheral blood monocytes for 5 days in the presence of 2 ng/ml human CSF1/macrophage colony stimulating factor (Sigma-Aldrich, M6518) as described previously.
CFU assay
For quantification of intracellular bacteria, CFU assays were performed as described [Citation28]. Mtb-infected Sirt3+/+ and sirt3−/- BMDMs were washed with phosphate buffered saline (PBS; Wel Gene, LB001-02), and fresh medium containing 200 μg/ml amikacin (Sigma-Aldrich, A0368000) was added. After incubation cells were lysed with 0.3% saponin (Sigma-Aldrich, 47036) to release intracellular bacteria. And then, infected lysates were resuspended vigorously, transferred to screw-capped tubes, and sonicated in a preheated 37°C waterbath sonicator (Elma, Germany) for 5 min. Aliquots of the sonicates were diluted 5-fold in 7H9 medium and homogenates were plated on duplicate plates of Middlebrook 7H10 agar. Bacterial colonies were counted after 21 days of incubation at 37°C.
RNA extraction and quantitative real time PCR (qPCR)
RNA extraction and qPCR were performed as previously described [Citation62]. Total RNA from human PBMC was isolated for using TRIzol reagent and synthesis of cDNA for using Superscript II reverse transcriptase (Invitrogen, 18064). QPCRs were carried out using cDNA, primers, and SYBR Green PCR Kits (Qiagen, 204074) using the Real-time PCR cycler Rotor-Gene Q 2plex system (Qiagen GmbH, 9001620, Hilden, Germany). The samples were amplified for 40 cycles as follows: 95°C for 10s and 60°C for 30s. To analyze qPCR data, we performed relative quantification using the 2-ΔΔCt method with mouse Gapdh or human GAPDH as an internal control gene; data were expressed as relative fold changes. The sequences of primers are shown in Table S2.
Western blot analysis and ELSIA
Western blot and sandwich ELISAs were performed as described previously [Citation62]. For western blot analysis, cell lysate was boiled in sample buffer and separated by 12% SDS-PAGE gels. Proteins were transferred to polyvinylidene difluoride membranes (PVDF; Millipore Corp, IPVH0001). After incubation with the appropriate Abs, immunoreactive bands were visualized using an ECL reagent (Millipore), and bands were detected using a Vilber chemiluminescence analyzer (Vilber Lourmat, Fusion SL 3, Eberhardzell, Germany). ELISA was performed to detect TNF (BioLegend, 430903), IL6 (BioLegend, 431303), IL1B (BD Biosciences, 559603), and CXCL5 (LIX; R&D Systems, DY443). All the assays were performed as recommended by the manufacturers.
Immunofluorescence
Immunofluorescence analysis of endogenous and colocalized LC3 was performed as described previously [Citation62]. Mtb-infected Sirt3+/+ and sirt3−/- BMDMs were fixed in 4% paraformaldehyde for 15 min, followed by membrane permeabilization using 0.25% Triton X-100 (Sigma-Aldrich, T8787). Cells were incubated with a primary anti-LC3 Ab (MBL International, PM036) or anti-LAMP2 Ab (Santa Cruz Biotechnology, sc-18822) at room temperature. After 2 h, primary Ab was removed and washed twice with PBS followed by an incubation with a secondary anti-rabbit IgG-Alexa Fluor 488 Ab (Invitrogen A17041) at room temperature for 1 h. Nuclei were stained with 4′,6-diamidino-2-phenylindole (DAPI; Sigma-Aldrich, D9542) for 1 min. Immunofluorescence images were acquired using a confocal laser-scanning microscope (Zeiss, Germany). To quantify autophagy, LC3 punctate dots were analyzed using ImageJ software. For colocalization of mycobacteria, non-colocalization for red and colocalized for yellow mycobacteria were quantified and analyzed using ZEN 2009 software (Zeiss). Each experiment was assayed in triplicate, and at least 200 cells per well were counted.
LC3 FACS analysis
Flow cytometry analysis of LC3B was performed as described previously [Citation62]. Mtb-infected Sirt3+/+ and sirt3−/- BMDMs were incubated in fixation and permeabilization solution (BD Biosciences, 554714) for 10 min. Fixed and permeabilized cells were washed and incubated with an anti-LC3B Ab (Cell Signaling Technology, 2775S) for 1 h and a secondary anti-rabbit IgG-Alexa Fluor 488 Ab (Invitrogen A17041) for 30 min on ice. And then, cells were washed in PBS, resuspended in FACS buffer and analyzed immediately. The samples were examined using a FACSCanto II flow cytometer (Becton Dickinson, USA). Flow cytometry data of 10,000 cells were collected and analyzed using the FlowJo software (Tree Star).
Generation and transduction of lentivirus-based shRNA knockdown and adenovirus-mediated overexpression of SIRT3, TFEB and PPARA
Lentivirus production was performed as described previously [Citation62]. Briefly, the lentiviral construct vector pLKO.1 and three packaging plasmids (pRSVRev; 12253, pMD2.VSV-G; 12259, and pMDLg/pRRE; 12251 were purchased from Addgene, deposited by Dr. Didier Trono). The pLKO.1-based target shRNA plasmids for hSIRT3 (Santa Cruz Biotechnology, sc-61555-SH) were cotransfected into HEK293T cells using Lipofectamine 2000 (Invitrogen, 12566014) for 72 h. Then, the lentivirus-containing supernatant was collected and filtered. Titration of the lentiviral vectors was determined using 293T cells as described previously [Citation62]. Briefly, approximately 5 × 10⁵ cells were plated in each well of a 6-well plate. The cells were infected with viral supernatants in the presence of 8 μg/mL polybrene (Sigma-Aldrich, 107689). After 24 h, medium was removed and replaced with fresh medium containing 5 μg/mL puromycin, which was replaced every 3 days. On day 14, cells were stained with crystal violet for 15 min and colonies were counted using a cut off of 50 viable cells. For lentivirus transduction, MDMs were infected with lentiviral vectors using 8 μg/mL polybrene for 48 h. Transduced cells were harvested, and the target gene knockdown efficiency was analyzed.
Adenoviral vectors expressing PPARA (AAV-mPPARA, 269120) and TFEB (AAV-mTFEB, 281149) were purchased from Vector Biolabs. For the generation of SIRT3-containing adenoviral vector, PCR-amplified flag-Sirt3 cDNA (NM_001177804.1) was subcloned into pAd-Track-CMV, a shuttle vector, using Kpn I and Xho I restriction enzyme sites. To prepare a recombinant adenoviral vector, the linearized shuttle vector DNA was transformed into BJ5183 E. coli containing AdEasy adenoviral vector by electroporation. Amplification of adenovirus and viral titers were performed as described previously [Citation64]. Briefly, HEK293 cells were transfected with adenovirus (multiplicity of infection [MOI] = 5), and the replicated virus particles were concentrated by CsCl gradient ultracentrifugation. Purified and concentrated adenoviruses that had titers in the range of 109-1011 pfu/mL were suspended in 10 mM Tris-HCl, pH 8.0, 2 mM MgCl2, 5% sucrose (Sigma-Aldrich, S8501). For in vitro infection with adenovirus, BMDMs were plated into 24-well culture plates in DMEM containing 5% FBS at 5 × 10⁵ cells per well, in the presence of recombinant adenovirus at a concentration of 10 PFU/cell, as described previously [Citation64].
Generations of retroviruses encoding tandem-tagged mCherry-EGFP-LC3B for measurement of autophgic flux analysis
Human Phoenix AMPHO cells were seeded at 70% confluence into a 6-well plate and transfected with 1 μg of pBABE-puro mCherry-EGFP-LC3B (Addgene, 22418; deposited by Jayanta Debnath), 0.75 μg of pCL-Eco (Addgene, 12371; deposited by Inder Verma), and 0.25 μg of pDM2.G (Addgene, 12259; deposited by Didier Trono) using Lipofectamine 2000 for 18 h. The transfected cell culture medium was removed and replaced with fresh medium. The retrovirus-containing medium was harvested at 60 h post-transfection and filtered through a 0.45-μm syringe filter. BMDMs from Sirt3+/+ and sirt3−/- mice were transduced with mCherry-EGFP-LC3B retrovirus for 24 h and infected with Mtb (MOI = 10). The stimulated cells on coverslips were washed twice with PBS, fixed with 4% paraformaldehyde for 15 min. After mounting, fluorescence images were acquired using a confocal laser-scanning microscope. To analyze endogenous autophgic flux, the ImageJ software was used. Slides were assayed in triplicate, and at least 200 cells per well were counted.
Measurement of mitochondria ROS and mitochondrial mass
Mtb-infected Sirt3+/+ and sirt3−/- BMDMs were incubated with 50 nM MitoSOXTM Red Mitochondrial Superoxide Indicator (Invitrogen, M36008). After 30 min, cells were washed and measured using FACSCanto II flow cytometer or confocal laser-scanning microscope. For data analysis, flow cytometer data and confocal data were analyzed using the FlowJo software and ImageJ software respectively. The percentage and mean fluorescence intensity level of the mitochondria ROS were calculated for each sample.
Sirt3+/+ and sirt3−/- BMDMs infected with Mtb or stimulated with HKL were incubated with 25 nM MitoTracker Green FM (Invitrogen, M7514) and 25 nM MitoTracker Deep Red FM (Invitrogen, M22426) at 37°C. After 20 min, cells were washed with PBS and measured using FACSCanto II flow cytometer and analyzed using the FlowJo software. The percentage and mean fluorescence intensity level of the mitochondrial mass were calculated for each sample.
Measurement of MMP
Mtb-infected Sirt3+/+ and sirt3−/- BMDMs were incubated with 100 nM tetramethylrhodamine, ethyl ester, perchlorate (TMRE; Invitrogen, T669) at 37°C in the dark. After 20 min, the cells were measured by flow cytometry using the FL2 channel (582 nm). Data were analyzed using the Flow Jo software.
TEM analysis
Mtb-infected Sirt3+/+ and sirt3−/- BMDMs were washed with PBS, fixed with 3% glutaraldehyde in 0.1 M sodium cacodylate buffer (pH 7.2) containing 0.1% CaCl2. After 3 h, post-fixed with 1% osmium tetroxide in 0.1 M sodium cacodylate buffer containing 0.1% CaCl2 for 2 h. And then cells were rinsed with cold distilled water, dehydrated slowly with ethanol series and propylene oxide at 4°C. The cells were embedded in Embed-812 (EMS, 14120), and cured at 60°C for 36 h. The ultrathin sections (70–80 nm) were cut with a diamond knife and ULTRACUT UC7 ultramicrotome (Leica, Germany), and mounted on formvar-coated slot grids. Sections were stained with 4% uranyl acetate for 10 min and lead citrate for 7 min. TEM staining sections were scanned using a Tecnai G2 Spirit Twin TEM (FEI Company, USA).
RNAseq analysis and data acquisition
Total RNA was isolated using Trizol reagent. RNA quality was assessed by Agilent 2100 bioanalyzer using the RNA 6000 Nano Chip (Agilent Technologies, Amstelveen, The Netherlands), and RNA quantification was performed using ND-2000 Spectrophotometer (Thermo Inc., DE, USA).
For control and test RNAs, the construction of library was performed using a SENSE mRNA-Seq Library Prep Kit (Lexogen, Inc 001) according to the manufacturer’s instructions. Briefly, each 2 ug total RNA are prepared and incubated with magnetic beads decorated with oligo-dT and then other RNAs except mRNA were removed by washing solution. Library production is initiated by the random hybridization of starter/stopper heterodimers to the poly (A) RNA still bound to the magnetic beads. These starter/stopper heterodimers contain Illumina-compatible linker sequences. A single-tube reverse transcription and ligation reaction extends the starter to the next hybridized heterodimer, where the newly synthesized cDNA insert is ligated to the stopper. Second strand synthesis is performed to release the library from the beads, and the library is then amplified. Barcodes were introduced when the library was amplified. High-throughput sequencing was performed as paired-end 100 sequencing using HiSeq 2000 (Illumina, Inc., USA).
mRNA-Seq reads were mapped using TopHat software tool in order to obtain bam file (alignment file). Read counts mapped on transcripts region were extracted from the alignment file using bedtools (v2.25.0) and Bioconductor that uses R (version 3.2.2) statistical programming language (R development Core Team, 2011). The alignment file also was used for assembling transcripts, estimating their abundances and detecting differential expression of genes or isoforms using cufflinks. And we used the fragments per kilobase of exon per million fragments (FPKM) as the method of determining the expression level of the gene regions. Global normalization method was used for comparison between samples. Fold change value of genes was calculated to the read count using EgeR (http://bioconductor.org/packages/release/bioc/html/edgeR.html), and selection of differential expressed genes was to screen according to the fold change value. Functional gene classification was performed by DAVID (http://david.abcc.ncifcrf.gov/). Cytoscape (version 2.7), an open source bioinformatics platform, provided by the U.S. National Institute of General Medical Sciences (NIGMS) was used to construct network diagrams. We provided a list of gene identifiers and stringApp (http://apps.cytoscape.org/apps/stringapp) returned the matching network on Cytoscape.
Statistical analysis
Statistical analysis was performed in Prism (GraphPad Software, v5.01, 2007). Data are presented as means ± SEM (standard error of the mean). Normality was assessed using D’Agostino and Pearson omnibus normality test, and data were analyzed using two-tailed Student’s t test or non-parametric tests were used. In non-parametric tests, two conditions were compared using Mann-Whitney U-Test and three or more conditions using one-way ANOVA with Dunn’s multiple comparison test where appropriate. Two-way ANOVA with Bonferroni’s test was used to compare the data from each sirt3−/- condition with the corresponding Sirt3+/+. The log-rank (Mantel-Cox) test was used for survival studies. Spearman correlations were also performed to examine correlations between SIRT3, TNF, and PPARA. Specific p values are detailed in the figure legends.
Supplemental Material
Download MS Word (4.4 MB)Acknowledgments
Dr. Chul-Ho Lee (Korea Research Institute of Bioscience and Biotechnology) and Dr. Taeok Bae (University of Indiana) for generously providing reagents. Dr. Kyung Mok Sohn (Chungnam National University School of Medicine) and Dr. Sung Soo Jung (Chungnam National University School of Medicine) contributed to enrollment of the patients and healthy volunteers of this study. We also thank members of the E-K Jo’s lab for their helpful discussions and technical assistance.
Disclosure statement
No potential conflict of interest was reported by the authors.
Supplementary material
Supplemental data for this article can be accessed here.
Additional information
Funding
Related Research Data
References
- Levine B, Mizushima N, Virgin HW. Autophagy in immunity and inflammation. Nature. 2011;469:323–335. http://doi.org/10.1038/nature09782. PMID: 21248839.
- Nakahira K, Haspel JA, Rathinam VA, et al. Autophagy proteins regulate innate immune responses by inhibiting the release of mitochondrial DNA mediated by the NALP3 inflammasome. Nat Immunol. 2011;12:222–230. http://doi.org/10.1038/ni.1980. PMID: 21151103.
- Mills EL, Kelly B, O’Neill LAJ. Mitochondria are the powerhouses of immunity. Nat Immunol. 2017;18:488–498. http://doi.org/10.1038/ni.3704. PMID: 28418387.
- Bulua AC, Simon A, Maddipati R, et al. Mitochondrial reactive oxygen species promote production of proinflammatory cytokines and are elevated in TNFR1-associated periodic syndrome (TRAPS). J Exp Med. 2011;208:519–533. http://doi.org/10.1084/jem.20102049. PMID: 21282379.
- Roca FJ, Ramakrishnan L. TNF dually mediates resistance and susceptibility to mycobacteria via mitochondrial reactive oxygen species. Cell. 2013;153:521–534. http://doi.org/10.j.cell.2004.11.038/j.cell.2013.03.022. PMID: 23582643.
- Schulze-Osthoff K, Bakker AC, Vanhaesebroeck B, et al. Cytotoxic activity of tumor necrosis factor is mediated by early damage of mitochondrial functions. Evidence for the involvement of mitochondrial radical generation. J Biol Chem. 1992;267:5317–5323. PMID: 1312087.
- Narendra D, Tanaka A, Suen DF, et al. Parkin is recruited selectively to impaired mitochondria and promotes their autophagy. J Cell Biol. 2008;183:795–803. http://doi.org/10.1083/jcb.200809125. PMID: 19029340.
- Gutierrez MG, Master SS, Singh SB, et al. Autophagy is a defense mechanism inhibiting BCG and Mycobacterium tuberculosis survival in infected macrophages. Cell. 2004;119:753–766. http://doi.org/j.cell.2004.11.038/j.cell.2004.11.038. PMID: 15607973.
- Singh SB, Davis AS, Taylor GA, et al. Human IRGM induces autophagy to eliminate intracellular mycobacteria. Science. 2006;313:1438–1441. http://doi.org/10.1126/science.1129577. PMID: 16888103.
- Rubinsztein DC, Bento CF, Deretic V. Therapeutic targeting of autophagy in neurodegenerative and infectious diseases. J Exp Med. 2015;212:979–990. http://doi.org/10.1084/jem.20150956. PMID: 26101267.
- Ahn BH, Kim HS, Song S, et al. A role for the mitochondrial deacetylase Sirt3 in regulating energy homeostasis. Proc Natl Acad Sci USA. 2008;105:14447–14452. http://doi.org/10.1073/pnas.0803790105. PMID: 18794531.
- Jing E, Emanuelli B, Hirschey MD, et al. Sirtuin-3 (Sirt3) regulates skeletal muscle metabolism and insulin signaling via altered mitochondrial oxidation and reactive oxygen species production. Proc Natl Acad Sci USA. 2011;108:14608–14613. http://doi.org/10.1073/pnas.1111308108. PMID: 21873205.
- Hallows WC, Yu W, Smith BC, et al. Sirt3 promotes the urea cycle and fatty acid oxidation during dietary restriction. Mol Cell. 2011;41:139–149. http://doi.org/10.j.cell.2004.11.038/j.molcel.2011.01.002. PMID: 21255725.
- Hirschey MD, Shimazu T, Goetzman E, et al. SIRT3 regulates mitochondrial fatty-acid oxidation by reversible enzyme deacetylation. Nature. 2010;464:121–125. http://doi.org/10.1038/nature08778. PMID: 20203611.
- Yang L, Zhang J, Xing W, et al. SIRT3 deficiency induces endothelial insulin resistance and blunts endothelial-dependent vasorelaxation in mice and human with obesity. Sci Rep. 2016;6:23366. http://doi.org/10.1038/srep23366. PMID: 2700041.
- Sundaresan NR, Gupta M, Kim G, et al. Sirt3 blocks the cardiac hypertrophic response by augmenting Foxo3a-dependent antioxidant defense mechanisms in mice. J Clin Invest. 2009;119:2758–2771. http://doi.org/10.1172/JCI39162. PMID: 19652361.
- Morigi M, Perico L, Rota C, et al. Sirtuin 3-dependent mitochondrial dynamic improvements protect against acute kidney injury. J Clin Invest. 2015;125:715–726. http://doi.org/10.1172/JCI77632. PMID: 25607838.
- Someya S, Yu W, Hallows WC, et al. Sirt3 mediates reduction of oxidative damage and prevention of age-related hearing loss under caloric restriction. Cell. 2010;143:802–812. http://doi.org/10.j.cell.2004.11.038/j.cell.2010.10.002. PMID: 21094524.
- Paulin R, Dromparis P, Sutendra G, et al. Sirtuin 3 deficiency is associated with inhibited mitochondrial function and pulmonary arterial hypertension in rodents and humans. Cell Metab. 2014;20:827–839. http://doi.org/10.j.cell.2004.11.038/j.cmet.2014.08.011. PMID: 25284742.
- Nouailles G, Dorhoi A, Koch M, et al. CXCL5-secreting pulmonary epithelial cells drive destructive neutrophilic inflammation in tuberculosis. J Clin Invest. 2014;124:1268–1282. http://doi.org/10.1172/JCI72030. PMID: 24509076.
- Kimmey JM, Huynh JP, Weiss LA, et al. Unique role for ATG5 in neutrophil-mediated immunopathology during M. tuberculosis infection. Nature. 2015;528:565–569. http://doi.org/10.1038/nature16451. PMID: 26649827.
- Pillai VB, Samant S, Sundaresan NR, et al. Honokiol blocks and reverses cardiac hypertrophy in mice by activating mitochondrial Sirt3. Nat Commun. 2015;6:6656. http://doi.org/10.1038/ncomms7656. PMID: 25871545.
- Tal MC, Sasai M, Lee HK, et al. Absence of autophagy results in reactive oxygen species-dependent amplification of RLR signaling. Proc Natl Acad Sci U S A. 2009;106:2770–2775. http://doi.org/10.1073/pnas.080769106. PMID: 19196953.
- Zhou R, Yazdi AS, Menu P, et al. A role for mitochondria in NLRP3 inflammasome activation. Nature. 2011;469:221–225. http://doi.org/10.1038/nature09663. PMID: 21124315.
- Naik E, Dixit VM. Mitochondrial reactive oxygen species drive proinflammatory cytokine production. J Exp Med. 2011;208:417–420. http://doi.org/10.1084/jem.20110367. PMID: 21357740.
- Dikalova AE, Bikineyeva AT, Budzyn K, et al. Therapeutic targeting of mitochondrial superoxide in hypertension. Cir Res. 2010;107:106–116. http://doi.org/10.1161/CIRCRESAHA.109.214601. PMID: 20448215.
- Park JH, Seo KS, Tadi S, et al. An indole derivative protects against acetaminophen-induced liver injury by directly binding to N-acetyl-p-benzoquinone imine in mice. Antioxid Redox Signal. 2013;18:1713–1722. http://doi.org/10.1089/ars.2012.4677. PMID: 23121402.
- Kim YS, Lee HM, Kim JK, et al. PPAR-alpha activation mediates innate host defense through induction of TFEB and lipid catabolism. J Immunol. 2017;198:3283–3295. http://doi.org/10.4049/jimmunol.1601920. PMID: 28275133.
- Lee JM, Wagner M, Xiao R, et al. Nutrient-sensing nuclear receptors coordinate autophagy. Nature. 2014;516:112–115. http://doi.org/10.1038/nature13961. PMID: 25383539.
- Pi H, Xu S, Reiter RJ, et al. SIRT3-SOD2-mROS-dependent autophagy in cadmium-induced hepatotoxicity and salvage by melatonin. Autophagy. 2015;11:1037–1051. http://doi.org/10.1080/15548627.2015.1052208. PMID: 26120888.
- Liang Q, Benavides GA, Vassilopoulos A, et al. Bioenergetic and autophagic control by Sirt3 in response to nutrient deprivation in mouse embryonic fibroblasts. Biochem J. 2013;454:249–257. http://doi.org/10.1042/BJ20130414. PMID: 23767918.
- Watson RO, Manzanillo PS, Cox JS. Extracellular M. tuberculosis DNA targets bacteria for autophagy by activating the host DNA-sensing pathway. Cell. 2012;150:803–815. http://doi.org/10.j.cell.2004.11.038/j.cell.2012.06.040. PMID: 22901810.
- Hou F, Sun L, Zheng H, et al. MAVS forms functional prion-like aggregates to activate and propagate antiviral innate immune response. Cell. 2011;146:448–461. http://doi.org/10.j.cell.2004.11.038/j.cell.2011.06.041. PMID: 21782231.
- Yang W, Nagasawa K, Münch C, et al. Mitochondrial sirtuin network reveals dynamic SIRT3-dependent deacetylation in response to membrane depolarization. Cell. 2016;167:985–1000 e21. http://doi.org/10.j.cell.2004.11.038/j.cell.2016.10.016. PMID: 27881304.
- Benigni A, Perico L, Macconi D. Mitochondrial dynamics is linked to longevity and protects from end-organ injury: the emerging role of sirtuin 3. Antioxid Redox Signal. 2016;25:185–199. http://doi.org/10.1089/ars.2016.6682. PMID: 26972664.
- Chen Y, Fu LL, Wen X, et al. Sirtuin-3 (SIRT3), a therapeutic target with oncogenic and tumor-suppressive function in cancer. Cell Death Dis. 2014;5:e1047. http://doi.org/10.1038/cddis.2014.14. PMID: 24503539.
- Tobin DM, Roca FJ, Oh SF, et al. Host genotype-specific therapies can optimize the inflammatory response to mycobacterial infections. Cell. 2012;148:434–446. http://doi.org/10.j.cell.2004.11.038/j.cell.2011.12.023. PMID: 22304914.
- Ciarlo E, Heinonen T, Lugrin J, et al. 3 deficiency does not alter host defenses against bacterial and fungal infections. Sci Rep. 2017;7:3853. http://doi.org/10.1038/s41598-017-04263-x. PMID: 28634345.
- Härtlova A, Herbst S, Peltier J, et al. LRRK2 is a negative regulator of Mycobacterium tuberculosis phagosome maturation in macrophages. Embo J. 2018;37(12):pii: e98694. http://doi.org/10.15252/embj.201798694. PMID: 29789389.
- Franco LH, Nair VR, Scharn CR, et al. The ubiquitin ligase Smurf1 functions in selective autophagy of Mycobacterium tuberculosis and anti-tuberculous host defense. Cell Host Microbe. 2017;21:59–72. http://doi.org/10.j.cell.2004.11.038/j.chom.2016.11.002. PMID: 28017659.
- Koster S, Upadhyay S, Chandra P, et al. Mycobacterium tuberculosis is protected from NADPH oxidase and LC3-associated phagocytosis by the LCP protein CpsA. Proc Natl Acad Sci USA. 2017;114:E8711–E20. http://doi.org/10.1073/pnas.1707792114. PMID: 28973896.
- Tur J, Vico T, Lloberas J, et al. Macrophages and mitochondria: a critical interplay between metabolism, signaling, and the functional activity. Adv Immunol. 2017;133:1–36. http://doi.org/10.1016/bs.ai.2016.12.001. PMID: 28215277.
- Dan Dunn J, Alvarez LA, Zhang X, et al. Reactive oxygen species and mitochondria: A nexus of cellular homeostasis. Redox Biol. 2015;6:472–485. http://doi.org/10.1016/j.redox.2015.09.005. PMID: 26432659.
- Shin DM, Jeon BY, Lee HM, et al. Mycobacterium tuberculosis eis regulates autophagy, inflammation, and cell death through redox-dependent signaling. PLoS Pathog. 2010;6:e1001230. http://doi.org/10.1371/journal.ppat.1001230. PMID: 21187903.
- Zumla A, Rao M, Wallis RS, et al. Host-directed therapies for infectious diseases: current status, recent progress, and future prospects. Lancet Infect Dis. 2016;16:e47–63. http://doi.org/10.1016/S1473-3099(16)00078-5. PMID: 27036359.
- Morselli E, Maiuri MC, Markaki M, et al. Caloric restriction and resveratrol promote longevity through the Sirtuin-1-dependent induction of autophagy. Cell Death Dis. 2010;1:e10. http://doi.org/10.1038/cddis.2009.8. PMID: 21364612.
- Lee IH, Cao L, Mostoslavsky R, et al. A role for the NAD-dependent deacetylase Sirt1 in the regulation of autophagy. Proc Natl Acad Sci USA. 2008;105:3374–3379. http://doi.org/10.1073/pnas.0712145105. PMID: 18296641.
- Liu P, Huang G, Wei T, et al. Shen. Sirtuin 3-induced macrophage autophagy in regulating NLRP3 inflammasome activation. Biochim Biophys Acta. 2018;1864:764–777. http://doi.org/10.1016/j.bbadis.2017.12.027. PMID: 29277324.
- Romagnoli A, Etna MP, Giacomini E, et al. ESX-1 dependent impairment of autophagic flux by Mycobacterium tuberculosis in human dendritic cells. Autophagy. 2012;8:1357–1370. http://doi.org/10.4161/auto.20881. PMID: 22885411.
- Varga T, Czimmerer Z, Nagy L. PPARs are a unique set of fatty acid regulated transcription factors controlling both lipid metabolism and inflammation. Biochim Biophys Acta. 2011;1812:1007–1022. http://doi.org/10.1016/j.bbadis.2011.02.014. PMID: 21382489.
- Kersten S. Integrated physiology and systems biology of PPARα. Mol Metab. 2014;3:354–371. http://doi.org/10.1016/j.molmet.2014.02.002. PMID: 24944896.
- WoerlyG, Honda K, Loyens M, et al. Peroxisome proliferator-activated receptors alpha and gamma down-regulate allergic inflammation and eosinophil activation. J Exp Med. 2003;198:411–421. http://doi.org/10.1084/jem.20021384. PMID: 12900517.
- Twig G, Shirihai OS. The interplay between mitochondrial dynamics and mitophagy. Antioxid Redox Signal. 2011;14:1939–1951. http://doi.org/10.1089/ars.2010.3779. PMID: 21128700.
- Zhang Y, Qi H, Taylor R, et al. The role of autophagy in mitochondria maintenance: characterization of mitochondrial functions in autophagy-deficient S. cerevisiae strains. Autophagy. 2007;3:337–346. http://doi.org/10.4161/auto.4127. PMID: 17404498.
- Atanasov AG, Wang JN, Gu SP, et al. Honokiol: a non-adipogenic PPARgamma agonist from nature. Biochim Biophys Acta. 2013;1830:4813–4819. http://doi.org/10.1016/j.bbagen.2013.06.021. PMID: 23811337.
- Woodbury A, Yu SP, Wei L, et al. Neuro-modulating effects of honokiol: a review. Front Neurol. 2013;4:130. http://doi.org/10.3389/fneur.2013.00130. PMID: 24062717.
- Arora S, Singh S, Piazza GA, et al. Honokiol: a novel natural agent for cancer prevention and therapy. Curr Mol Med. 2012;12:1244–1252. http://doi.org/10.2174/156652412803833508. PMID: 22834827.
- Giacomini E, Iona E, Ferroni L, et al. Infection of human macrophages and dendritic cells with Mycobacterium tuberculosis induces a differential cytokine gene expression that modulates T cell response. J Immunol. 2001;166:7033–7041. http://doi.org/10.4049/jimmunol.166.12.7033. PMID: 11390447.
- Dorhoi A, Kaufmann SH. Tumor necrosis factor alpha in mycobacterial infection. Semin Immunol. 2014;26:203–209. http://doi.org/10.1016/j.smim.2014.04.003. PMID: 24819298.
- Nau GJ, Richmond JF, Schlesinger A, et al. Human macrophage activation programs induced by bacterial pathogens. Proc Natl Acad Sci U S A. 2002;99:1503–1508. http://doi.org/10.1073/pnas.022649799. PMID: 11805289.
- Volpe E, Cappelli G, Grassi M, et al. Gene expression profiling of human macrophages at late time of infection with Mycobacterium tuberculosis. Immunology. 2006;118:449–460. http://doi.org/10.1111/j.1365-2567.2006.02378.x. PMID: 16895554.
- Kim JK, Lee HM, Park KS, et al. MIR144* inhibits antimicrobial responses against Mycobacterium tuberculosis in human monocytes and macrophages by targeting the autophagy protein DRAM2. Autophagy. 2017;13:423–441. http://doi.org/10.1080/15548627.2016.1241922. PMID: 27764573.
- Periasamy S, Avram D, McCabe A, et al. An immature myeloid/myeloid-suppressor cell response associated with necrotizing inflammation mediates lethal pulmonary tularemia. PLoS Pathog. 2016;12:e1005517. http://doi.org/10.1371/journal.ppat.1005517. PMID: 27015566.
- Yuk JM, Kim TS, Kim SY, et al. orphan nuclear receptor ERRΑ controls macrophage metabolic signaling and A20 expression to negatively regulate TLR-induced inflammation. Immunity. 2015;43:80–91. http://doi.org/10.1016/j.immuni.2015.07.003. PMID: 26200012.